simulation and feasibility analysis of the operation of
TRANSCRIPT

International Journal of Engineering Research and Technology. ISSN 0974-3154, Volume 14, Number 7 (2021), pp. 687-699
© International Research Publication House. http://www.irphouse.com
687
Simulation and feasibility analysis of the operation of port ballast
water treatment stations in the port of Santos (SP, Brazil)
C. Toro-Perez1, Y.F. Ceballos2* and L.E. Muñoz3
1,2 Grupo Ing. y sociedad. Ingeniería Industrial, Universidad de Antioquia Calle 70 No 52-21, Medellín 050010, Colombia. 3Universidad Tecnológica de Pereira.Pereira, Colombia.
*Corresponding Author (ORCID: 0000-0001-5787-8832)
Abstract: This study analyses the feasibility of installing a
ballast water system in the port of Santos (Brazil); For this
purpose, a discrete event simulation model was carried out that
was verified and validated and represents an approximation to
the current behavior of the port and the proposed treatment
system. In a first stage, a review of the literature was carried
out on the fundamental issues for understanding the problem
and analysis of the system: ballast water, the Brazilian port
system, the port of Santos in São Paulo and the simulation of
discrete events. Subsequently, the scope of the study was
defined, and the analysis was limited to the export terminals of
bulk cargo of soy products, corn, sugar, and citrus juices, since
these are the ones that receive the vessels that will require water
treatment ballast. Subsequently, the conceptual model for the
port system was built, which once validated served as the basis
for formulating and building the computational model that
would represent the operation of the system, initially the
current situation of the port and later the scenario where the
operation. The normal operation of the port will be adapted to
the operation of a ballast water treatment system. The model
went through several verification and validation processes,
necessary to determine its operation as the real system and the
validity of the results obtained; It was determined that the
model, under the previously established assumptions, responds
in a similar way to the system before the entry of information
and / or changes in the parameters. As a result of the evaluation
of the addition of a ballast water treatment system to the port
operation, four scenarios were proposed with different sizes of
the treatment fleet and their respective implications in terms of
operation within the model.
Keywords: Ballast water; bulk cargo, computational, discrete
events, simulation, model, operation, port, system.
I. INTRODUCTION
The international maritime industry transports approximately
90% of the world's merchandise and is essential for the
development of the global economy, since the transport of raw
materials, food, commodities and other products between
countries and continents would not be possible without the use
of this medium [1]. Thus, the development of this industry is
decisive for growth in economies and improvements in global
living conditions, given the availability, efficiency, and low
cost that the industry can achieve when transporting its goods
by sea. There is an evident and justified trend that the exchange
of goods between countries continues to increase, according to
a study by the International Chamber of Shipping (ICS), the
volume of maritime trade will go from approximately 9 Billion
tons in 2015 to around 17 billion by 2030 [2]. This trend is not
isolated from the growth in population and gross domestic
product in the countries; As shown in Fig. 1, these two variables
are increasing for the 2030 period, which will generate an
increase in demand and needs at a global level. The goods
exchange increasing worldwide, will require an expansion of
international trade directly linked to the port operation, in
addition to flexible and integrated supply chains.
Fig. 1 Projections for increased maritime trade, GDP and
population worldwide
The increasing needs for freight transport must be optimized,
so that they affect to a lesser extent the products cost at the end
of the chain. Countries like China will play a decisive role in
the naval market, but emerging economies such as Vietnam,
India, the Philippines, and Brazil will increase their shipments
and will also be world leaders in that market [2].
Another determining aspect in the growth of this industry is the
urban concentration that is occurring in the countries, more
than half of the population lives in urban areas and the trend is
increasing for the coming decades: the global urban population
is expected to grow by 2.5 billion between 2014 and 2050, that
is, 66% of the population will be concentrated in urban areas
[3]. One of the implications of this urbanization process is the
environmental deterioration caused by the greater intervention
in the ecosystem, exploitation of resources and generation of
waste caused by the industrial operation, and it is of interest for
this study, the environmental deterioration derived from the
operation of the maritime industry.

International Journal of Engineering Research and Technology. ISSN 0974-3154, Volume 14, Number 7 (2021), pp. 687-699
© International Research Publication House. http://www.irphouse.com
688
The interoceanic movement of vessels generates various
sources of pollution, such as C02 emissions, cargo residues and
ballast water. Ballast water is the water transported by ships to
submerge their propellers and ensure their stability and
structural integrity, which, while essential for modern, safe, and
efficient transport operations, is causing serious ecological,
economic, and environmental problems. public health due to
the number of marine species it carries. Different organizations
have wanted to take action on the issue in the sense of seeking
a solution to the problem, the IMO - International Maritime
Organization and its marine environment protection committee
(MEPC) - which since 1948 regulates transport and maritime
activities, adopted in 1997 resolution A.868 (20) "guidelines
for the control and management of ships' ballast water to
minimize the transfer of harmful aquatic organisms and
pathogenic agents" as an invitation to all countries to take
action in order to mitigate the problem. This resolution is still
in force and has been integrated with other programs such as
GloBallast (global ballast water management program) and at
the national level with standards such as NORMAM-20 / DPC
in Brazil [4].
This paper studies the local environmental problems derived
from the use of ballast water in the port of Santos, BR, the
largest in the country and classified as the second in Latin
America in terms of cargo movement. (Latin American
Association of Ports and Terminals, 2014). The port of Santos
was responsible for the transport of 111,159,485 tons of cargo
in 2014, of which 76,574,936 (69%) corresponded to export
cargo and the remaining 31% in imports. The main products
that were dispatched from the port in 2014 were sugar
(17,276,544 tons), soybeans (16,464,584 tons) and corn
(8,967,526 tons) [5].
The current operation of the port was analyzed as a base
scenario to evaluate the incorporation of a ballast water
treatment system, which would alter port operations and the
logistics costs associated with them to a lesser extent. The
alternative treatment analyzed consisted of the operation of
treatment stations in vessels dedicated only to this task, which
wait in the canal and in the anchorage area due to the
requirements of the vessels that arrive to load with bulk. These
treatment barges are connected to the vessels and shed the water
as the cargo tanks fill up, to maintain stability throughout the
operation.
To analyze the operation of the water treatment system, we
started from the verified and validated port operation model and
the addition of the system and its implications on the
performance were evaluated; this to present the investment in a
treatment system as a viable option for port operators, who,
although they would incur other costs for the installation and
maintenance of the system, would prefer to preserve the
performance of their operations which is a priority [6].
Furthermore, this treatment is not a need for logistics operators
given the lack of regulation on the subject and if it is included
in their planning, it is for other benefits for the company [7].
This study did not evaluate the operation of the port, that is, the
system was simulated with input data demands, pre-operation,
operation, and post-operation times, under the assumption that
cargo is always available at each dock and that once the vessel
is docked, it begins its operation, ignoring the probability of
delays in loading, bankruptcy of equipment and other variables
that undoubtedly affect the operation.
II. PROBLEM SITUATION
The world economy is highly dependent on maritime transport,
an average that a year transports approximately 90% of the
loads that move around the world; Advances in the growth of
this maritime industry and international maritime trade are
determined by macroeconomic conditions around the world
[3]. Over the years, various impacts that this industry is causing
to the environment have been identified, the IMO highlights the
pollution caused by hydrocarbons, chemicals, wastewater,
garbage, and atmospheric emissions. Although initiatives to
mitigate these impacts have been and should be carried out,
some of these are generated by accidents that are difficult to
foresee, so the industry must work on attention plans to these
events that make a precise and timely response when necessary.
The case of water pollution occurs in two ways, on the one
hand, the wastewater generated by the operation of ships and,
on the other, the impact of the discharge of ballast water in the
environment [8], [9].
Ballast water is that which gives stability to ships, its transport
helps to maintain safe conditions during the trip, thanks to the
fact that stress on the hull is reduced, provides transversal
stability, improves propulsion, maneuverability and
compensates for changes in Weight presented according to load
level and fuel and water consumption during the tours.
Quantities of marine species are transported on ships by ballast
water, including bacteria, microbes, small invertebrates, eggs,
among others. These species, which are unloaded in the port
where the vessel picks up merchandise, can survive in the new
ecosystems where they arrive, but they become competition for
native species and multiply in the environment as pests.
Fig. 2. Behavior of the OECD countries production index vs world
indicators.
This problem is now recognized as one of the greatest threats
to ecological and economic well-being worldwide. The
introduction of species by ballast water causes great damage to
the biodiversity and natural resources that we have, in addition
to having increasingly serious effects on human health [4].
Even so, this problem has not yet reached its highest point, as
mentioned, it is derived from the growing expansion of trade
and the greater volumes of merchandise that are transported by

International Journal of Engineering Research and Technology. ISSN 0974-3154, Volume 14, Number 7 (2021), pp. 687-699
© International Research Publication House. http://www.irphouse.com
689
sea, which continue to tend to increase over the years. and to
reach out and affect new areas.
III. METHOD
To study the problem, the methodology used is adapted from
[10], which is shown in the figure 3.
Fig 3. Methodology for of discrete event system simulation.
An initial stage of conception of the study, the objective of the
study was defined to analyse the operation of a ballast water
treatment system in port for the port of Santos. As already
mentioned in other points, ballast water is transported by ships
that sail without or with little load, that is, ships that arrive at
the port to export and, in general, only bulk carriers transport
ballast, for this reason, the study was delimited to the terminals
exclusively dedicated to export activities of bulk cargo:
soybeans, corn, sugar, juices and fertilizers. Of the 65 terminals
that currently operate within the port, 14 terminals were
identified as bulk cargo export terminals as shown in Table 1.
Table 1. Terminals and export products in the port of Santos.
Source Author.
Terminal Productos
ADM Soy / Corn
COREX Soy / Corn
Cutrale Soy / Corn / Juices
Citrosuco Soy / Corn / Juices
TGG Soy / Corn
TEAG Soy / Corn / Sugar
TEG Soy / Corn
TERMAG Solid bulk / Fertilizers
Armazem 12A Soy / Corn / Sugar
T-grão - silos Soy / Corn / Juices
Rodrimar General Cargo / Fertilizers
Rumo/Cosan Soy / Corn / Sugar
Copersucar Sugar
Pérola Fertilizers
Once these terminals and the products to be worked had been
identified, the conceptual model was formulated that would
represent the operation of the port-system without the
adaptation of the ballast water treatment system shown in Fig
4, which was necessary to validate the normal operation of the
port and on this subsequently analyse the operation of the
ballast water treatment system.
The operation of the port system involves several events that
have already been mentioned in the theoretical framework of
this work. In the first place, the ships arrive at the anchorage
area where the port authority registers their arrival and it is
defined when the ship will be able to enter the terminal where
it will load the respective merchandise; the anchorage area is
the row of all the ships that are waiting to dock at the respective
docks, it should be noted again that these rows for the case
study (Port of Santos) are the bottleneck of port operations and
the main port performance problem.
Once the ship has channel and dock availability to dock, in
addition to the environmental conditions being favourable for
navigation, the manoeuvring operation begins, which consists
of navigating the access channel to the area where the turn and
navigation is carried out. to the dock of attraction. Once the ship
docked at the respective dock of the terminal where it will
operate, the pre-operation begins, where the documents of the
ship and the cargo are inspected and it is verified that the
conditions for the operation are being met to begin the loading
of the merchandise, which is the next process. Once the loading
operation is finished, in this case of the bulk cargo tanks, the
post operation begins, where the ship's departure order is
inspected and given, environmental conditions for channel
navigation and availability of the same to proceed to carry out
the departure navigation and leave for the cargo destination.
The scope of the study was defined, and the conceptual model
of its operation built, we proceeded to define and search for the
input data for the model.
II. METHODOLOGY
Collection of input data to the model: There are 3 different
public databases on the port of Santos, information on the port,
the ANTAQ and the company that carries out the piloting
operation; the origin of the information used in the model was
mainly from the data of the port and the ANTAQ, given the
greater availability and reliability of the data [11].
The construction of the model required several input data,
which are presented below:
Quantities of merchandise for each type of product transported
in 2013 by each terminal: This information was obtained from
the port's database. The record of the year 2013 was taken from
all the ships that passed through the port and only the data
related to the export terminals included within the model were
used, particularly, the transported quantities of four products:
soybeans, corn, sugar, and citrus juices, which represent the
largest volume of exports within bulk cargo export terminals.
Although the fertilizer export terminals were included in the
elaboration of the model, they were not analyzed within this
study due to the insufficient information, however, in a later
study, the operations of these three terminals (TERMAG,
Rodrimar and Pérola) and evaluate the treatment system
operating on them as well [5].

International Journal of Engineering Research and Technology. ISSN 0974-3154, Volume 14, Number 7 (2021), pp. 687-699
© International Research Publication House. http://www.irphouse.com
690
Average weight of the vessels that frequent the terminals: this
parameter is one of the assumptions that will be mentioned
later, the average size of the vessels that enter the port to
transport bulk cargo was taken as 60,000 tons.
Product amount transported in the year (by harvest season):
This information was taken from the website of the national
association of grain exporters. The entity arises with the
purpose of promoting the development of activities related to
grains and cereals, in addition to defending the interests of its
35 associated companies before public and private authorities.
The organization is the one who monitors the evolution of grain
exports, on the website you can find information from the
quantities exported of each product in each port to the quantities
exported each month for each product during a year, which was
essential. for the distribution of the total quantity shipped.
Operations Times (Pre-operation, operation, and post-
operation): This information was taken from the Master Plan of
the port of Santos prepared by the Secretariat of ports of the
Presidency of the Republic in agreement with the Federal
University of Santa Catalina.
The canal journey time: it was estimated by dividing the canal
into three sections, measuring the distance of each of the
sections and dividing by the navigation speed within the canal.
Fig 4. Conceptual operation model of the port of Santos, Br. Source Author.

International Journal of Engineering Research and Technology. ISSN 0974-3154, Volume 14, Number 7 (2021), pp. 687-699
© International Research Publication House. http://www.irphouse.com
691
The distance of each stretch was measured using the Google
Earth tool in nautical miles; The speed for navigation within the
channel is given in the literature, on average, the ships sail at
eight or nine nodes of speed, given the conditions of the
channel, an average speed of 9 nodes was taken as a measure
for this study for all the ships.
Travel time between terminals for treatment barges: This time
was calculated similarly to the travel time for the canal, with an
average speed of 12 nodes. (See annexes). The lengths were
taken very close to the continent, contrary to those of the
channel, this because the barges can navigate close to the dock,
the large vessels cannot.
Defined scope, conceptual model, and input data for the model,
a second stage called according to the implementation
methodology was entered, where the computational model was
built and its functionality and precision in representing the real
system studied was verified and validated. Initially, the
assumptions that were considered to formulate the model were
raised: Cargo is always available at the export terminals, the
vessels that enter to load merchandise at the related ports are
mostly of the Panamax class, the service of the ships that arrive
at the port is FIFO (first in first out), no terminal has priority,
the ships are attended in order of arrival and the environmental
conditions do not represent major inconveniences for the
operation within the port, the ships dock at the respective dock
in the direction of departure from the port, that is, all the ships
when entering the channel, navigate to the end where the
turning area is, make the turning maneuver and return to the
terminal and dock to perform the operation.
The model run under the logic of "first to arrive first to be
attended", none of the terminals has priority over another to
enter the first operation of navigating the channel. As shown in
Fig 5, the system has three major operations that were also
described within the theoretical framework of the work: the
arrival of the ships to the anchorage area, the navigation
channel, and the terminals and docking bays. Initially, the
figure shows the generation of the ships for each terminal,
organized by zones as they are distributed in the port (See
annexes), once they enter the system, they go to the waiting line
for dock assignment, the so-called zone of anchorage, which is
where ships wait for the availability of the dock, channel, and
the necessary conditions to be able to enter and go into
operation. In the model, this row was divided, initially the
vessels are in line for dock availability, they go on to an activity
of "dock assignment" and enter the last wait for channel release,
this to analyze and reveal the neck Port bottle, which is the
channel availability as it will be shown later in the results and
analysis point.
Once the ships have a channel and dock available, they proceed
to carry out the entry navigation to the port, an operation that
was divided into sections according to the location of the
destination terminal; Once they navigate channel 1, 2 and / or
3, they proceed to perform the turning manoeuvre, where for
the ease of the model, the turning manoeuvre and navigation of
the rest of the sections, entry and exit required for the ship to
be in direction of exit as determined within the assumptions to
the model. Once the manoeuvre has been carried out, the ship
is ready to dock at the assigned dock and carry out the pre-
operation, operation and post-operation and navigate the exit
channel.
Based on the input data collected for the model, the
distributions for arrivals and the activities involved were
determined; It is worth mentioning that month by month the
model updates the input data since the calculations consider the
harvest times of the products, especially soybeans and corn,
which are the products that have a more variable behaviour
during the year (see annexes). Each of the main processes
carried out and the way in which the distributions and other
times necessary for the operation of the model were determined
are briefly explained below:
Fig 5. Simulation model of operation of the port of Santos, Br.
International Journal of Engineering Research and Technology. ISSN 0974-3154, Volume 14, Number 7 (2021), pp. 687-699
© International Research Publication House. http://www.irphouse.com
692
The arrival of vessels to the port was separated by terminal, this
to characterize the entrances by dock to which they were going
to dock, channel, section of the channel that they required to
navigate and type of product that entered each time (according
to product distribution).
To estimate times between arrivals at the terminals in each
month, the starting point was the amount of cargo per product
transported per year multiplying it by the proportion of product
that was exported in that month (See annexes); Thus, the load
that was transported of the specific product during the month
was determined. With this figure, it was sought to determine
the number of ships that would be necessary to transport such
cargo, dividing it by the ship's capacity (Panamax, 60,000 tons)
and rounding this figure to the largest integer. Given the
number of vessels that would be required per product in each
terminal, the total for each terminal was determined and the
total hour-month was divided by the number of vessels, and this
last figure was used as the mean for the exponential distribution
that would describe the entry of the boats to the model. The
exponential distribution is the one that best describes the entries
in a queuing system, given the uncertainty that the times
between user arrivals represents for the system.
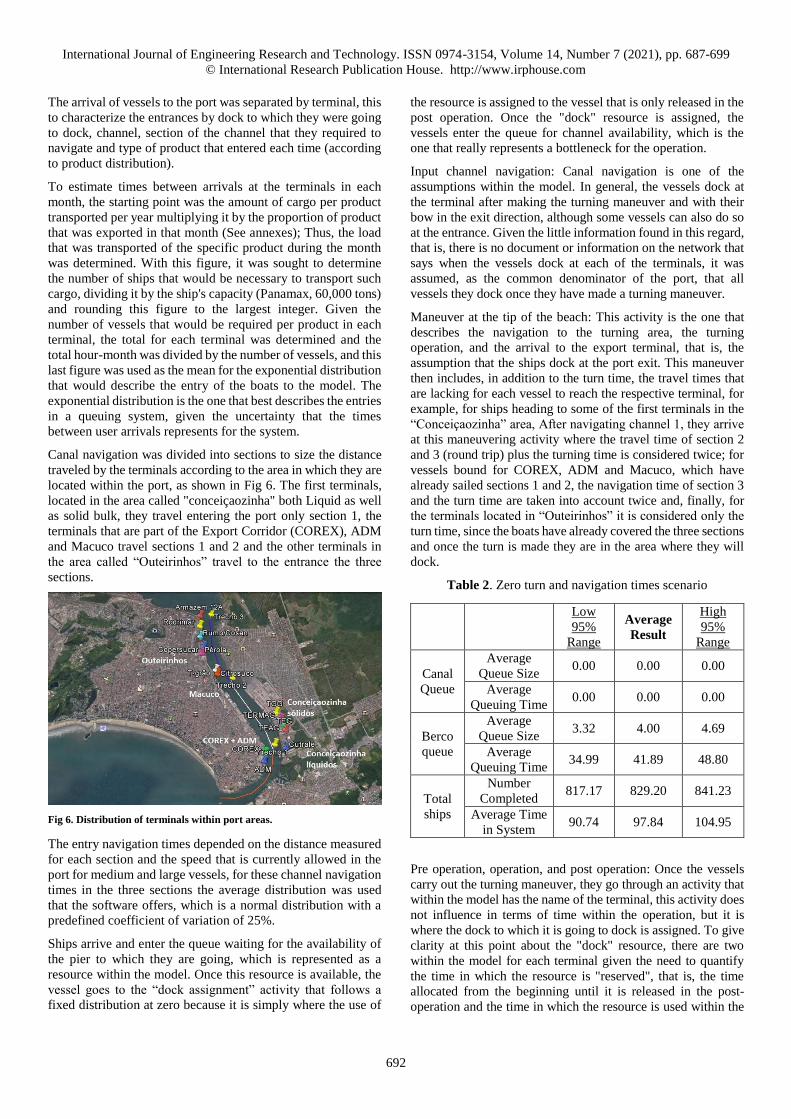
Canal navigation was divided into sections to size the distance
traveled by the terminals according to the area in which they are
located within the port, as shown in Fig 6. The first terminals,
located in the area called "conceiçaozinha" both Liquid as well
as solid bulk, they travel entering the port only section 1, the
terminals that are part of the Export Corridor (COREX), ADM
and Macuco travel sections 1 and 2 and the other terminals in
the area called “Outeirinhos” travel to the entrance the three
sections.
Fig 6. Distribution of terminals within port areas.
The entry navigation times depended on the distance measured
for each section and the speed that is currently allowed in the
port for medium and large vessels, for these channel navigation
times in the three sections the average distribution was used
that the software offers, which is a normal distribution with a
predefined coefficient of variation of 25%.
Ships arrive and enter the queue waiting for the availability of
the pier to which they are going, which is represented as a
resource within the model. Once this resource is available, the
vessel goes to the “dock assignment” activity that follows a
fixed distribution at zero because it is simply where the use of
the resource is assigned to the vessel that is only released in the
post operation. Once the "dock" resource is assigned, the
vessels enter the queue for channel availability, which is the
one that really represents a bottleneck for the operation.
Input channel navigation: Canal navigation is one of the
assumptions within the model. In general, the vessels dock at
the terminal after making the turning maneuver and with their
bow in the exit direction, although some vessels can also do so
at the entrance. Given the little information found in this regard,
that is, there is no document or information on the network that
says when the vessels dock at each of the terminals, it was
assumed, as the common denominator of the port, that all
vessels they dock once they have made a turning maneuver.
Maneuver at the tip of the beach: This activity is the one that
describes the navigation to the turning area, the turning
operation, and the arrival to the export terminal, that is, the
assumption that the ships dock at the port exit. This maneuver
then includes, in addition to the turn time, the travel times that
are lacking for each vessel to reach the respective terminal, for
example, for ships heading to some of the first terminals in the
“Conceiçaozinha” area, After navigating channel 1, they arrive
at this maneuvering activity where the travel time of section 2
and 3 (round trip) plus the turning time is considered twice; for
vessels bound for COREX, ADM and Macuco, which have
already sailed sections 1 and 2, the navigation time of section 3
and the turn time are taken into account twice and, finally, for
the terminals located in “Outeirinhos” it is considered only the
turn time, since the boats have already covered the three sections
and once the turn is made they are in the area where they will
dock.
Table 2. Zero turn and navigation times scenario
Low
95%
Range
Average
Result
High
95%
Range
Canal
Queue
Average
Queue Size 0.00 0.00 0.00
Average
Queuing Time 0.00 0.00 0.00
Berco
queue
Average
Queue Size 3.32 4.00 4.69
Average
Queuing Time 34.99 41.89 48.80
Total
ships
Number
Completed 817.17 829.20 841.23
Average Time
in System 90.74 97.84 104.95
Pre operation, operation, and post operation: Once the vessels
carry out the turning maneuver, they go through an activity that
within the model has the name of the terminal, this activity does
not influence in terms of time within the operation, but it is
where the dock to which it is going to dock is assigned. To give
clarity at this point about the "dock" resource, there are two
within the model for each terminal given the need to quantify
the time in which the resource is "reserved", that is, the time
allocated from the beginning until it is released in the post-
operation and the time in which the resource is used within the

International Journal of Engineering Research and Technology. ISSN 0974-3154, Volume 14, Number 7 (2021), pp. 687-699
© International Research Publication House. http://www.irphouse.com
693
operation, that is, it is assigned in the activity that precedes the
pre-operation.
The pre-operation and post-operation times also follow a mean
distribution within the model with a value equal to 1.2 h for all
terminals, this value corresponds to an approximation validated
by the experts to the duration of these operations, given the non-
existence of this data within the databases reviewed. The
operating times were taken from the Master Plan of the port of
Santos of the year 2013, although there is not complete
information for each terminal and the products, an average of 50
hours was considered for the operation except for some
terminals that do present in the literature more detailed
information of time according to the type of product that is being
loaded.
Exit navigation: Finally, the vessels go through the departure
navigation activity where they travel the distance that is
necessary to leave the channel and finish their operation within
the port.
Model verification and validation
The processes of verification and validation of the model were
transversal to its construction, that is, once the computational
model was built, tests of its operation were carried out and
possible errors were identified and resolved before advancing
to the next stages, as more were added. restrictions, variables,
and parameters to the model that would complicate the
identification and solution of possible inconsistencies. For
verification, the response of the model against degeneracy tests
or extreme values, continuity and simplified runs is shown in
table 3.
Table 3. 200,000-ton vessel operation scenario
Low 95%
Range
Average
Result
High 95%
Range
Canal
Queue
Average
Queue
Size
0.00 0.01 0.01
Average
Queuing
Time
0.09 0.10 0.12
Berco
queue
Average
Queue
Size
0.49 0.60 0.71
Average
Queuing
Time
10.15 12.17 14.19
Total
ships
Number
Completed 405.83 423.50 441.17
Average
Time in
System
72.06 74.31 76.56
Degeneration tests: This test consists of checking the model by
using extreme values in the inputs to the model.
In the first place, a scenario was evaluated where there is no
demand for cargo to be transported in any of the terminals, so it
is expected that vessels will not enter the system and therefore
no operations will be carried out nor will there be departures at
the end of shot, that as there is no demand, no terminal generates
ships and all operations have zero value. The scenario where the
navigation and turn times are equal to zero was also tested,
under these conditions it is expected that no queue will be
generated due to channel availability, since this activity would
not take any time.
Finally, a last test of extreme value was carried out where the
ships that entered the port were larger, for the case about
200,000 tons of merchandise, where it is expected that the
number of ships served would be much smaller and the lines
would be similarly reduced considerably.
Continuity tests: This type of test consists of running the model
several times with small variations in the input parameters,
where a small change in the initial value of any parameter is
expected to produce only small variations in the results. For
example, the pre-operation and post-operation time was
changed from 1.2 hours to just one hour, the changes in the
results are shown in the table 4 and table 5.
Table 4. Results with pre and post operation times equal to
1.2 hours.
Low
95%
Range
Average
Result
High
95%
Range
Canal
Queue
Average
Queue Size
0.02 0.02 0.02
Average
Queuing
Time
0.22 0.23 0.25
Berco
queue
Average
Queue Size
3.76 4.60 5.43
Average
Queuing
Time
36.97 48.09 56.51
Total
ships
Number
Completed
816.90 829.10 841.30
Average
Time in
System
97.98 106.61 115.24
Table 5. Results with pre and post operation times equal to
one hour
Low
95%
Range
Average
Result
High
95%
Range
Canal
Queue
Average
Queue
Size
0.02 0.02 0.02
Average
Queuing
Time
0.21 0.22 0.23

International Journal of Engineering Research and Technology. ISSN 0974-3154, Volume 14, Number 7 (2021), pp. 687-699
© International Research Publication House. http://www.irphouse.com
694
Berco
queue
Average
Queue
Size
3.68 4.48 5.28
Average
Queuing
Time
38.81 46.86 54.91
Total
ships
Number
Completed
816.76 829.00 841.24
Average
Time in
System
96.72 104.97 113.23
Simplified runs test: this test seeks to run simpler or simplified
cases and analyze the behavior. In this case, the model was run
generating load only for the ADM terminal, so it is expected that
only this one operates, and the outputs are consistent with the
inputs, that is, they correspond only to this terminal.
Additionally, the row for channel should be equal to zero and
the bottleneck in this case would be the availability of the dock.
Table 6. Simplified runs test, only ADM terminal generates
load.
Low 95% Range
Averag
e
Result
High 95% Range
Fila para
canal
Average
Queue Size
0.00 0.00 0.00
Average
Queuing
Time
0.00 0.00 0.00
Fila para
berco
Average
Queue Size
0.79 1.29 1.78
Average
Queuing
Time
72.47 116.83 161.20
Total
navíos
atendidos
Number
Completed
89.80 93.20 96.60
Average
Time in
System
135.53 180.02 224.52
OP_Arm
39
Number
Completed
Jobs
89.80 93.20 96.60
Navega_
canal_1
Number
Completed
Jobs
90.30 93.50 96.70
The model validation was carried out by experts, the research
professors associated with the Center for Innovation in Logistics
and Port Infrastructure - CILIP of the University of Sao Paulo -
USP, who accompanied the process from the formulation, data
collection and experimentation.
Once the model had been built, verified, and validated, the final
analysis phase was completed, where initially the operational
model of the system to be evaluated is completed, that is, the
port system with operation of a ballast water treatment system.
The conceptual model that represents the operation of the
terminals under study, with the addition of the ballast water
treatment system can be seen in Fig 8. For the operation of the
water treatment system, the system does not undergo major
changes in terms of its operation, the ballast water in the ships
is treated while they operate, which will not affect the operation
since the only thing that changes in the system is the intervention
of a new resource, the treatment barges, and a certain time of
their operation, which is less than that of the operation in total,
including enlistment and post-operation.
Conceptually, a new sub-process is generated within the pre-
operation called ballast water treatment, which would operate as
shown in the diagram in fig. 8.
Fig 8. Ballast water treatment system conceptual model. Source author
For the operation of the water treatment barges, it was necessary
to calculate the time between each terminal as mentioned at the
point of data collection, it should be noted that these barges do
not have navigation restrictions in the channel, that is, given its
characteristics (size, draft, etc.) the barges could cross both with
large vessels and with each other, in addition the speed is greater
than that of the vessels entering the port (12 nodes) and the
turning maneuver times are not are taken into account given the
simplicity of this operation.
The addition of the ballast water treatment system within the
port operation does not cause major interventions to the
computational model either, it maintains its structure, only a
new resource called "treatment barges" is added and the
respective navigation times between terminals, which are of
great relevance because the barges will be serving the ships
while they operate and once they end in one of the terminals they
will be required in some other. These times within the model are
read through a logic of "set resource travel time", where the time
is entered for each of the possible journeys that are going to be
required. For the subsequent analysis, the costs associated with

International Journal of Engineering Research and Technology. ISSN 0974-3154, Volume 14, Number 7 (2021), pp. 687-699
© International Research Publication House. http://www.irphouse.com
695
the operation of the treatment stations were estimated, as shown
in the following point.
Fig 9. Conceptual model of operation of the port of Santos with ballast
water treatment system. Source author
IV. ANALYSIS AND RESULTS
For an experimental design of ten runs of one year, the base
period for which it was necessary to evaluate the operation of
the port, the results obtained are very close to the reality of the
system, also considering the assumptions under which it was
worked; The Table 7 summarizes the main results of the
system's operation:
Table 7. Performance results of the model without a ballast
water treatment system.
Low
95%
Range
Averag
e Result
High
95%
Range
Canal Queue
Average
Queue
Size
0.02 0.02 0.02
Average
Queuing
Time
0.19 0.21 0.24
Berco queue
Average
Queue
Size
1.69 1.97 2.25
Average
Queuing
Time
17.82 20.72 23.63
Total ships
Number
Complete
d
818.3
0
830.00 841.7
0
Average
Time in
System
63.82 66.86 69.90
B_ARM 39 Utilization
%
49.86 51.23 52.60
B_CUTRALE Utilization
%
30.78 32.36 33.94
B_12A Utilization
%
28.23 29.51 30.78
B_13_14 Utilization
%
0.0 0.00 0.00
B_ARM 29 Utilization
%
19.98 21.79 23.59
B_ARM 36 Utilization
%
28.46 30.51 32.57
B_ARM_16_1
7
Utilization
%
24.69 26.80 28.91
B_ARM_19 Utilization
%
24.84 26.59 28.35
B_ARM_20_2
1
Utilization
%
24.70 26.74 28.78
B_ARM_22_2
3
Utilization
%
0.00 0.00 0.00
B_ARM_27 Utilization
%
0.00 0.00 0.00
B_SUG26 Utilization
%
34.40 36.96 39.51
B_TEAG Utilization
%
34.24 35.42 36.61
B_TEG Utilization
%
42.26 44.24 46.22
B_TERMAG Utilization
%
0.00 0.00 0.00
B_TGG Utilization
%
49.79 51.69 53.60
For the system, it is important to analyze the rows first. As
mentioned in the theoretical framework of this work, the port
presents large lines given the bureaucracy for the arrival and
departure of vessels, the number of available berths, the
impossibility of crossing vessels in the canal and the high
number of anchored ships. As can be seen in the results, the
waiting line for dock availability (row for berço) is the largest
within the system, given that the number of available docks is
not enough to meet all the demand that is being generated.
In the literature, an average row of 16 hours is mentioned for the
year 2012 and with a tendency to increase, in the simulated
system this time is on average 21 hours, which in comparison is
not very far from the reality of the system, considering that this
model waits for each vessel to carry out its entire operation to
free the channel, while in reality the piloting team can
coordinate this operation more efficiently and, additionally, the
model takes all the vessels that enter the Panamax class
terminals, while that smaller vessels can enter the real system

International Journal of Engineering Research and Technology. ISSN 0974-3154, Volume 14, Number 7 (2021), pp. 687-699
© International Research Publication House. http://www.irphouse.com
696
that, given their structure, do not require a large draft to
navigate, so they do not require channel availability to navigate.
The vessels attended to were 830, while in the real system this
figure was 818 vessels. This difference is due to the calculation
that was made for the generation of the ships, because when
dividing the demand in the terminal by the capacity of the
vessel, the figure was rounded to the largest integer, so they
could have been required, for example 0.14 vessels, but the
model received the request for 1 vessel.
The use of the docks is another data of great interest for the port
operator, in general, it is expected that the use of the dock will
be greater than 60%, because otherwise it would not be
profitable to operate in a dock that less than half of the time is
operating. For the model, this utilization after the runs that were
made and the best result that was achieved, is very low. This
result can be explained given that within the study only four
products and the quantities exported were considered; These
docks in some terminals also receive goods and are shared with
other terminal products.
For the treatment system, it is required that this new operation
does not greatly affect the performance of the system, but there
are trade-offs involved that the port entity must evaluate to adopt
the treatment system, since each barge implies additional costs.
When compared to the efficiency of the treatment system as
such, the acquisition may not be decisive, that is, there is a point
at which having one more barge will not mean shorter row times
but an even more significant cost for the business.
The results of the four scenarios evaluated for the installation of
the treatment system are presented below, characterized as the
ideal scenario, the one in which 8 treatment barges are acquired,
a desirable scenario with 7 barges, an acceptable scenario with
6 treatment stations and finally an unfavourable scenario for the
operation of the system with 5 barges for treatment.
Table 8. Ideal scenario, port performance is maintained, and
eight treatment stations are acquired.
Low
95%
Rang
e
Averag
e Result High
95%
Rang
e
Canal Queue
Average
Queue
Size
0.02 0.02 0.02
Average
Queuing
Time
0.18 0.20 0.22
Berco queue
Average
Queue
Size
1.69 1.97 2.26
Average
Queuing
Time
17.81 20.74 23.67
Total ships
Number
Complete
d
818.21 829.90 841.59
Average
Time in
System
63.76 66.84 69.91
B_ARM 39 Utilization
%
49.90 51.30 52.70
B_CUTRALE Utilization
%
30.85 32.44 34.03
B_12A Utilization
%
28.36 29.60 30.84
B_13_14 Utilization
%
0.00 0.00 0.00
B_ARM 29 Utilization
%
19.99 21.80 23.61
B_ARM 36 Utilization
%
28.50 30.56 32.62
B_ARM_16_1
7
Utilization
%
24.79 27.01 29.23
B_ARM_19 Utilization
%
24.88 26.53 28.19
B_ARM_20_2
1
Utilization
%
24.89 26.89 28.88
B_ARM_22_2
3
Utilization
%
0.00 0.00 0.00
B_ARM_27 Utilization
%
0.00 0.00 0.00
B_SUG26 Utilization
%
34.44 36.98 39.52
B_TEAG Utilization
%
34.30 35.48 36.66
B_TEG Utilization
%
42.42 44.37 46.32
B_TERMAG Utilization
%
0.00 0.00 0.00
B_TGG Utilization
%
49.81 51.79 53.77
Table 8 shows the scenario that maintains the normal
performance of the port and operates with eight barges, this
alternative is also the most expensive in terms of acquisition of
barges, acquisition of treatment systems, maintenance of
equipment and annual operation (labor, fuel, among others); The
desirable and acceptable scenario still represent benefits in
terms of operation at lower costs in relation to the desirable
scenario. These benefits must be analyzed in greater depth and
a detailed economic evaluation of each of the alternatives is
required (Tables 9 to 11).
Table 9. Desirable scenario, the total time in the system
increases less than two hours and seven treatment stations are
acquired.
Low
95%
Range
Averag
e Result
High
95%
Range
Canal Queue
Average
Queue
Size
0.02 0.02 0.02
Average
Queuing
Time
0.18 0.20 0.24

International Journal of Engineering Research and Technology. ISSN 0974-3154, Volume 14, Number 7 (2021), pp. 687-699
© International Research Publication House. http://www.irphouse.com
697
Berco queue
Average
Queue
Size
1.73 2.02 2.32
Average
Queuing
Time
18.26 21.29 24.32
Total ships
Number
Complete
d
818.3
1
829.90 841.4
9
Average
Time in
System
64.60 67.78 70.96
B_ARM 39 Utilization
%
50.13 51.65 53.17
B_CUTRALE Utilization
%
31.06 32.67 34.28
B_12A Utilization
%
28.65 29.90 31.15
B_13_14 Utilization
%
0.00 0.00 0.00
B_ARM 29 Utilization
%
20.09 21.90 23.71
B_ARM 36 Utilization
%
28.66 30.81 32.97
B_ARM_16_1
7
Utilization
%
24.95 27.28 29.61
B_ARM_19 Utilization
%
25.83 27.36 28.89
B_ARM_20_2
1
Utilization
%
25.11 27.05 28.99
B_ARM_22_2
3
Utilization
%
0.00 0.00 0.00
B_ARM_27 Utilization
%
0.00 0.00 0.00
B_SUG26 Utilization
%
34.62 37.17 39.72
B_TEAG Utilization
%
34.55 35.69 36.83
B_TEG Utilization
%
42.79 44.73 46.67
B_TERMAG Utilization
%
0.00 0.00 0.00
B_TGG Utilization
%
50.27 52.38 54.50
Table 10. Acceptable scenario, the time in the system is four
hours longer than the base scenario and six treatment barges
are acquired
Low
95%
Range
Averag
e Result
High
95%
Range
Canal Queue
Average
Queue
Size
0.01 0.02 0.02
Average
Queuing
Time
0.17 0.19 0.22
Berco queue
Average
Queue
Size
1.94 2.33 2.71
Average
Queuing
Time
20.59 24.45 28.31
Total ships
Number
Complete
d
818.2
3
829.80 841.3
7
Average
Time in
System
68.21 72.54 76.88
B_ARM 39 Utilization
%
51.36 53.10 54.84
B_CUTRALE Utilization
%
31.87 33.51 35.15
B_12A Utilization
%
29.78 31.10 32.42
B_13_14 Utilization
%
0.00 0.00 0.00
B_ARM 29 Utilization
%
20.64 22.49 24.35
B_ARM 36 Utilization
%
29.17 31.43 33.69
B_ARM_16_1
7
Utilization
%
26.69 28.97 31.64
B_ARM_19 Utilization
%
27.16 29.11 31.06
B_ARM_20_2
1
Utilization
%
26.39 28.41 30.43
B_ARM_22_2
3
Utilization
%
0.00 0.00 0.00
B_ARM_27 Utilization
%
0.00 0.00 0.00
B_SUG26 Utilization
%
35.45 38.21 40.97
B_TEAG Utilization
%
35.31 36.60 37.89
B_TEG Utilization
%
44.77 46.57 48.38
B_TERMAG Utilization
%
0.00 0.00 0.00
B_TGG Utilization
%
51.52 54.28 57.03
Finally, from five barges or less it is not beneficial for the
company to implement a ballast water treatment system,
because even if the water was being treated, the loss in the
operation is so high that it would not be economically viable
under any circumstances and the company could jeopardize the
operation of the terminals within the port.

International Journal of Engineering Research and Technology. ISSN 0974-3154, Volume 14, Number 7 (2021), pp. 687-699
© International Research Publication House. http://www.irphouse.com
698
Table 11. Unfavorable scenario, the time in the system
increases by more than one day and five treatment barges are
acquired.
Low
95%
Range
Average
Result
High
95%
Range
Canal Queue
Average
Queue
Size
0.02 0.02 0.02
Average
Queuing
Time
0.18 0.19 0.21
Berco queue
Average
Queue
Size
3.09 4.85 6.61
Average
Queuing
Time
33.01 50.70 68.38
Total ships
Number
Completed
818.03 829.80 841.57
Average
Time in
System
86.19 106.08 125.97
B_ARM 39 Utilization
%
57.47 60.80 64.12
B_CUTRALE Utilization
%
34.28 36.94 39.60
B_12A Utilization
%
33.36 35.72 38.07
B_13_14 Utilization
%
0.00 0.00 0.00
B_ARM 29 Utilization
%
22.39 24.62 26.86
B_ARM 36 Utilization
%
31.65 34.82 37.99
B_ARM_16_17 Utilization
%
32.54 36.75 40.96
B_ARM_19 Utilization
%
32.25 36.38 40.51
B_ARM_20_21 Utilization
%
31.27 34.94 38.61
B_ARM_22_23 Utilization
%
0.00 0.00 0.00
B_ARM_27 Utilization
%
0.00 0.00 0.00
B_SUG26 Utilization
%
38.23 41.74 45.24
B_TEAG Utilization
%
38.23 40.84 43.44
B_TEG Utilization
%
52.71 55.20 57.68
B_TERMAG Utilization
%
0.00 0.00 0.00
B_TGG Utilization
%
59.04 63.82 68.61
A future detailed economic evaluation of each of the alternatives
can further support the decision process by informing the
decision maker not only of the effects of the treatment system
on the port operation, but also the precision of the costs and
investment needs. that would be required to start operating the
system.
V. CONCLUSION
The installation of a ballast water treatment system in port,
although it is still optional for port agents, is a tendency to
become a requirement for operations, which makes this type of
analysis and the evaluation of alternatives essential. of water
treatment in port. There is evidence in the literature that the
ballast water treatment of ships represents a great benefit in
terms of sustainability in the three axes: environmental, social
and economic for the port, improves its corporate image and in
general may represent lower costs in the long-term.
An alternative analysis for the adoption of a treatment system
such as the one proposed in the study is the simulation of
discrete events, this tool is widely used to analyze port
operations, it is a way of representing this type of complex
systems that does not allow operation Directly on them and
achieve a greater understanding of the system being studied,
additionally, it enables the analysis of changes within the
operation such as the operation of a dock or an additional
treatment barge.
For the case study, the adoption of a ballast water treatment
system in port may not affect the port operation, although this
requires a greater investment by the company. Decision-makers
must evaluate the losses in performance due to a lower cost of
the treatment system and thus make a better decision where the
benefits may be the greatest.
REFERENCES
[1] N. Gaskell, “International Maritime Organization,” Int.
J. Mar. Coast. Law, vol. 8, no. 2, pp. 286–290, 2008, doi:
10.1163/157180893x00044.
[2] P. Brodie, “International Chamber of Shipping,” in
Commercial Shipping Handbook, 2020, pp. 211–211.
[3] U. Nations, “Department of Economic and Social
Affairs,” United Nations, vol. 10, p. 1, 2014, [Online].
Available:
https://sdgs.un.org/topics/forests%0Ahttps://esa.un.org/
unpd/wup/publications/files/wup2014-highlights.Pdf.
[4] I. T. Serafin and J. A. Henkes, “Água de lastro: um
problema ambiental,” Rev. Gestão Sustentabilidade
Ambient., vol. 2, no. 1, p. 92, 2013, doi:
10.19177/rgsa.v2e1201392-112.
[5] Companhia Docas do Estado de São Paulo (CODESP),
“Porto de Santos,” Porto de Santos, 2017.
http://www.portodesantos.com.br/.
[6] J. W. Fowler, P. Wirojanagud, and E. S. Gel, “Heuristics
for workforce planning with worker differences,” Eur. J.
Oper. Res., vol. 190, no. 3, pp. 724–740, 2008, doi:
10.1016/j.ejor.2007.06.038.

International Journal of Engineering Research and Technology. ISSN 0974-3154, Volume 14, Number 7 (2021), pp. 687-699
© International Research Publication House. http://www.irphouse.com
699
[7] S. Henn, “Computers & Operations Research
Algorithms for on-line order batching in an order
picking warehouse,” Comput. Oper. Res., vol. 39, no. 11,
pp. 2549–2563, 2012, doi: 10.1016/j.cor.2011.12.019.
[8] C. E. Golden, M. J. Rothrock, and A. Mishra, “Mapping
foodborne pathogen contamination throughout the
conventional and alternative poultry supply chains,”
Poult. Sci., p. 101157, 2021, doi:
10.1016/j.psj.2021.101157.
[9] T. Santa and M. Gonzalez, “Challenges in the
implementation of Extended Producer Responsibility
policies: The case of Packaging in Chile,” 2018.
[10] L. Chwif and A. C. Medina, Modelagem e simulação de
eventos disretos. 2015.
[11] E.-L. Silva-Ramírez, R. Pino-Mejías, M. López-Coello,
and M.-D. Cubiles-de-la-Vega, “Missing value
imputation on missing completely at random data using
multilayer perceptrons.,” Neural Netw., vol. 24, no. 1, pp.
121–9, Jan. 2011, doi: 10.1016/j.neunet.2010.09.008.