feasibility study report - static.azdeq.gov
TRANSCRIPT


Feasibility Study Report 40th Street and Osborn Road WQARF Registry Site Phoenix, Arizona Project # 14-2020-2037 Prepared for: Arizona Department of Environmental Quality 1110 West Washington Street, Phoenix, Arizona 85007
Prepared by: Wood Environment & Infrastructure Solutions, Inc. 4600 East Washington Street, Suite 600 Phoenix, Arizona 85034-1917 USA Tel: (602) 733-6000 Fax: (602) 733-6100
June 25, 2021
Copyright and Non-Disclosure Notice The contents and layout of this report are subject to copyright owned by Wood (© Wood Environment & Infrastructure Solutions, Inc.) save to the extent that copyright has been legally assigned by us to another party or is used by Wood under license. To the extent that we own the copyright in this report, it may not be copied or used without our prior written agreement for any purpose other than the purpose indicated in this report. The methodology (if any) contained in this report is provided to you in confidence and must not be disclosed or copied to third parties without the prior written agreement of Wood. Disclosure of that information may constitute an actionable breach of confidence or may otherwise prejudice our commercial interests. Any third party who obtains access to this report by any means will, in any event, be subject to the Third Party Disclaimer set out below.
Third-Party Disclaimer Any disclosure of this report to a third party is subject to this disclaimer. The report was prepared by Wood at the instruction of, and for use by, our client named on the front of the report. It does not in any way constitute advice to any third party who is able to access it by any means. Wood excludes to the fullest extent lawfully permitted all liability whatsoever for any loss or damage howsoever arising from reliance on the contents of this report. We do not however exclude our liability (if any) for personal injury or death resulting from our negligence, for fraud or any other matter in relation to which we cannot legally exclude liability.

Feasibility Study Report 40th Street and Osborn Road WQARF Registry Site
Project # 14-2020-2037 | June 25, 2021 Page ii
Table of Contents Introduction ........................................................................................................................................................................... 1
1.1 Objectives and Scope of the Feasibility Study Report ......................................................................... 1 2.0 Site Background ................................................................................................................................................................... 2
2.1 Site Description and History ........................................................................................................................... 2 2.2 Physiographic Setting ........................................................................................................................................ 3 2.3 Nature and Extent of Contamination .......................................................................................................... 6 2.4 Risk Evaluation/Conceptual Site Model ..................................................................................................... 8
2.4.1 Potential Receptors............................................................................................................................ 8 2.4.2 Ecological Risk Evaluation ............................................................................................................... 9 2.4.3 Human Risk Evaluation ..................................................................................................................... 9 2.4.4 Conceptual Site Model ..................................................................................................................... 9
3.0 Feasibility Study Scoping .................................................................................................................................................. 9 3.1 Regulatory Requirements ..............................................................................................................................10 3.2 Delineation of Remediation Areas .............................................................................................................10 3.3 Remedial Objectives ........................................................................................................................................10
3.3.1 Remedial Objectives for Land Use/Soil ....................................................................................11 3.3.2 Remedial Objectives for Groundwater Use ............................................................................11 3.3.3 Remedial Objectives for Surface Water Use ..........................................................................12
4.0 Identification and Screening of Remedial Measures and Strategies ............................................................12 4.1 Remedial Measures/Strategies ....................................................................................................................12
4.1.1 Plume Remediation .........................................................................................................................12 4.1.2 Physical Containment .....................................................................................................................13 4.1.3 Controlled Migration ......................................................................................................................13 4.1.4 Source Control ...................................................................................................................................13 4.1.5 Monitoring ..........................................................................................................................................13 4.1.6 No Action .............................................................................................................................................14
4.2 Screening of Groundwater Technologies ................................................................................................14 4.2.1 Monitored Natural Attenuation ..................................................................................................15 4.2.2 Enhanced Reductive Dechlorination .........................................................................................16 4.2.3 Injected Liquified Granular Activated Carbon (LGAC) ........................................................16 4.2.4 In-Situ Chemical Oxidation ...........................................................................................................17 4.2.5 In-Situ Chemical Reduction ..........................................................................................................17 4.2.6 Groundwater Extraction and Treatment ..................................................................................17 4.2.7 Summary of Screening and Technologies Retained ...........................................................18
5.0 Development of Reference Remedy and Alternative Remedies .....................................................................18 5.1 More Aggressive Alternative Remedy ......................................................................................................21
5.1.1 SRP Well 17.9E-7.5N Wellhead Treatment (SRP Well GWET System)..........................21 5.1.2 Downgradient Extraction Well ....................................................................................................22 5.1.3 Monitoring ..........................................................................................................................................23 5.1.4 Contingencies ....................................................................................................................................24 5.1.5 Permits and Agreements ...............................................................................................................24 5.1.6 Remedial Documents ......................................................................................................................25
5.2 Reference Remedy ............................................................................................................................................25 5.3 Less Aggressive Alternative Remedy .........................................................................................................26
5.3.1 Monitoring ..........................................................................................................................................26 5.4 Discussion of Specific Remedial Measures .............................................................................................27

Feasibility Study Report 40th Street and Osborn Road WQARF Registry Site
Project # 14-2020-2037 | June 25, 2021 Page iii
6.0 Detailed Comparison of The Reference Remedy and the Alternative Remedies .....................................27 6.1 Comparison Criteria .........................................................................................................................................27
6.1.1 Less Aggressive Alternative Remedy ........................................................................................27 6.1.2 Reference Remedy ...........................................................................................................................28 6.1.3 More Aggressive Alternative Remedy ......................................................................................29
6.2 Comparison of Remedies ...............................................................................................................................30 6.2.1 Practicability .......................................................................................................................................30 6.2.2 Protectiveness (Risk) ........................................................................................................................30 6.2.3 Cost ........................................................................................................................................................30 6.2.4 Benefit ...................................................................................................................................................31
7.0 Proposed Remedy .............................................................................................................................................................31 7.1 Process and Reason for Selection...............................................................................................................31 7.2 Achievement of Remedial Objectives .......................................................................................................31 7.3 Achievement of Remedial Action Criteria Pursuant to ARS §49-282.06 .....................................31 7.4 Consistency with Water Management and Land Use Plans .............................................................32
8.0 Community Involvement ................................................................................................................................................32 9.0 References ............................................................................................................................................................................33
List of Tables Table 1 Well Construction Data, Feasibility Study Report, 40th Street and Osborn Road WQARF Site Table 2 Groundwater Elevation Data, Feasibility Study Report, 40th Street and Osborn Road
WQARF Site Table 3 Summary of Groundwater Detected VOC Analytical Results, Feasibility Study Report, 40th
Street and Osborn Road WQARF Site Table 4 Summary of Remedial Technology Screening and Retainage, 40th Street and Osborn Road
WQARF Site Table 5 Groundwater Monitoring Program, 40th Street and Osborn Road WQARF Site. Table 6 Remedy Evaluation, Feasibility Study Report, 40th Street and Osborn Road WQARF Site
List of Figures Figure 1 Site Map, Feasibility Study Report, 40th Street and Osborn Road WQARF Registry Site Figure 2 September 2020 Site PCE Plume Map, Feasibility Study Report, 40th Street and Osborn
Road WQARF Registry Site Figure 3 Cross-Section A-A’, Feasibility Study Report, 40th Street and Osborn Road WQARF Registry
Site Figure 4 Cross-Section B-B’, Feasibility Study Report, 40th Street and Osborn Road WQARF Registry
Site Figure 5 Cross-Section C-C’, Feasibility Study Report, 40th Street and Osborn Road WQARF Registry
Site Figure 6 September 2020 Groundwater Elevation Map, Feasibility Study Report, 40th Street and
Osborn Road WQARF Registry Site Figure 7 Exposure Pathway Model, Feasibility Study Report, 40th Street and Osborn Road WQARF
Registry Site Figure 8 Particle Tracking Model Boundary Conditions, Feasibility Study Report, 40th Street and
Osborn Road WQARF Registry Site Figure 9 Forward Particle Tracking Results, Feasibility Study Report, 40th Street and Osborn Road
WQARF Registry Site


Feasibility Study Report 40th Street and Osborn Road WQARF Registry Site
Project # 14-2020-2037 | June 25, 2021 Page v
List of Acronyms and Abbreviations (cont.) LGAC liquified granular activated carbon LWUS Land and Water Use Study MAU middle alluvial unit MNA monitored natural attenuation O&M operation & maintenance OM&M operation, maintenance, and monitoring ORP oxidation reduction potential OU Operable Unit PCE tetrachloroethene PQGWWP Poor Quality Groundwater Withdrawal Permit PRB permeable reactive barrier Red ox oxidation-reduction remedial measures remedial strategies and actions RD reductive dechlorination RI remedial investigation ROs remedial objectives ROW Right(s)-of-way Site 40th Street and Osborn Road WQARF site SRP Salt River Project TCE trichloroethene UAU upper alluvial unit VC vinyl chloride VOC volatile organic compound VPS(s) vertical profile sample(s) Wood Wood Environment & Infrastructure Solutions, Inc. WQARF Water Quality Assurance Revolving Fund

Feasibility Study Report 40th Street and Osborn Road WQARF Registry Site
Project # 14-2020-2037 | June 25, 2021 Page 1
Introduction The purpose of this Feasibility Study (FS) report is to evaluate remedial alternatives and provide a recommendation for a preferred alternative for the 40th Street and Osborn Road Water Quality Assurance Revolving Fund (WQARF) site (Site). The Site is located in Phoenix, Arizona (Figure 1) and covers an area of mixed commercial, educational and residential land use. There is a school associated with San Pablo Episcopal Church located at the northeast corner of 31st Street and Windsor Avenue. The Wood Environment & Infrastructure Solutions, Inc. (Wood) completed the work described in this report under Arizona Superfund Remedial Action Contract Purchase Order Number PO0000109764 with the Arizona Department of Environmental Quality (ADEQ).
1.1 Objectives and Scope of the Feasibility Study Report The FS is a process used to:
• Identify remedial options and alternatives that will achieve the Site Remedial Objectives (ROs) as outlined in the Remedial Objectives Report (ADEQ, 2020a); and,
• Evaluate the identified remedies and recommend alternatives that comply with the requirements of Arizona Revised Statutes (A.R.S.) §49-282.06.
Based on the purpose and process noted above, this FS presents recommendations for a preferred remedy that:
• Assures the protection of public health, welfare, and the environment;
• To the extent practicable, provides for the control, management, or cleanup of hazardous substances so as to allow for the maximum beneficial use of waters of the state;
• Implements remedial actions which are reasonable, necessary, cost-effective, and technically feasible; and
• Addresses any well (used for municipal, domestic, industrial, irrigation or agricultural purposes) that could produce water that would not be fit for its current or reasonably foreseeable end use without treatment.
This FS report was developed based on data and information from the Remedial Investigation (RI, Wood 2020a). This FS has been developed and presents a reference remedy and two alternative remedies and evaluates the remedies to ensure that the remedies meet the following in accordance with Arizona Administrative Code (A.A.C.) R18-16- 407(H):
• Achieves the ROs;
• Is consistent with water management plans and general land use plans; and,
• Is evaluated with comparison criteria including practicability, risk, cost, and benefit.
• The alternative remedy evaluated is less aggressive than the reference remedy.
In accordance with A.A.C. R18-16-407(I), based on the evaluation of the reference remedy and the alternative remedy, the proposed remedy is developed and described in this FS report. Additionally, this report describes the rationale for selecting the proposed remedy including the following:
• How the proposed remedy will achieve the ROs;

Feasibility Study Report 40th Street and Osborn Road WQARF Registry Site
Project # 14-2020-2037 | June 25, 2021 Page 2
• How the comparison criteria were considered; and
• How the proposed remedy meets the requirements of A.R.S. §49-282.06.
2.0 Site Background This section presents a summary of the Site history and description of physiographic setting, nature and extent of contamination and a risk evaluation. This summary is taken in large part from the Remedial Investigation (RI) report (Wood 2020a) and the BMW-20B, BMW-21B, BMW-22B Well Drilling and Groundwater Monitoring Technical Memorandum, East Central Phoenix 40th Street and Osborn Road Water Quality Assurance Revolving Fund Site, Phoenix, Arizona dated June 26, 2020 (Wood, 2020b). This section also includes a description of the conceptual site model (CSM) for the Site.
2.1 Site Description and History The Site is bounded by East Fairmount Avenue to the north, East Hubbell Street to the south, 42nd Street to the east and 25th Street to the west. The boundary line between the Site and the adjacent (east) 48th Street and Indian School Road WQARF site (herein referred to as the 48th & IS site) is currently 42nd Street (Figure 1). The Site is located in an area of mixed commercial, educational, and residential development.
The investigation began in 1983 when Salt River Project (SRP) collected groundwater samples from several wells that they were pumping in the Salt River Valley. This included SRP Well 17.9E-7.5N, which is located within the Site and west of the intersection of 40th Street and Osborn Road (Figure 1). PCE was detected at a concentration of 53 micrograms per liter (µg/L) in the sample collected from SRP Well 17.9E-7.5N, which is above the Aquifer Water Quality Standard (AWQS) of 5.0 µg/L. SRP took the well off-line in 1990, but continued operating the well periodically to collect water quality samples. The maximum PCE concentration of 210 µg/L was reported in the 1998 sample collected from SRP Well 17.9E-7.5N. PCE concentrations decreased to non-detect in the 2016 sample (ADEQ, 2020b).
Based on the results of the SRP well sampling, the East Central Phoenix (ECP) Study Area was established in 1988. The ECP Study Area was bounded by Camelback Road to the north, McDowell Road to the south, 50th Street to the east and 20th Street to the west and included the Site. The ECP Study Area has historically contained dry cleaning facilities, service stations, and printing shops, with some of the dry cleaners operating since 1962.
In 1997, ADEQ established the WQARF Registry, replacing the WQARF Priority List. In 1998, the ECP Study Area was divided into six individual WQARF Registry sites:
• 40th Street and Osborn Road (Site);
• 48th Street and Indian School Road;
• 40th Street and Indian School Road;
• 38th Street and Indian School Road;
• 32nd Street and Indian School Road; and,
• 24th Street and Grand Canal.
The Site was placed on the WQARF Registry List in May 2000 (ADEQ, 2000).

Feasibility Study Report 40th Street and Osborn Road WQARF Registry Site
Project # 14-2020-2037 | June 25, 2021 Page 3
2.2 Physiographic Setting A detailed description of the Site physiography is provided in the RI Report (Wood, 2020a). In summary, the Site is located within the eastern portion of West Salt River Valley sub-basin of the Phoenix Active Management Area (AMA), a broad, relatively level alluvial valley filled with layers of unconsolidated sand, gravel, silt, clay. The Site is located within the United States Geologic Survey Topographic 7.5 Minute Phoenix map, which shows a general topographic trend of decreasing elevations from the northeast to southwest. The ground surface slopes to the southwest and drops approximately 114 feet (ft) between wells BMW-04A (1,163.11 ft amsl) and BMW-16D (1,049.44 ft amsl) (Figure 3).
In 1993, the Arizona Department of Water Resources (ADWR) released the results of its modeling study of the Salt River Valley (Corkhill et al., 1993). For modeling purposes, the ADWR defined three hydrogeologic units in the basin-fill by differences in grain size that occur throughout most of the Phoenix Basin and are generally correlative with the hydrostratigraphic units defined by the United States Bureau of Reclamation in 1976. These include from the shallowest to deepest: the Upper Alluvial Unit (UAU), the Middle Alluvial Unit (MAU), and the Lower Alluvial Unit (LAU). The UAU consists of unconsolidated sands and gravels deposited by flowing drainages and is the most permeable unit. The MAU and LAU are not present at the Site.
The Site has been assessed up to a depth of 300 ft below ground surface (bgs). The lithology below the Site consists predominantly of silt, clay, sand mixed with silt and/or clay, and gravel. The lithology at upgradient well BMW-02E and downgradient well BMW-16D is summarized on the following pages.

Feasibility Study Report 40th Street and Osborn Road WQARF Registry Site
Project # 14-2020-2037 | June 25, 2021 Page 4
BMW-02E Depth (ft bgs) Summary Description
0-67 sandy silt 67-75 clay with gravel 75-88 gravelly silt with sand 88-103 silt with sand 103-119 gravelly silt with sand 119-125 sandy silt with gravel 125-127 silt with gravel 127-130 silty gravel with sand 130-137 gravelly silt 137-154 silt with sand 155-157 gravelly silt with sand 157-174 sandy clay 174-187 sandy silt 187-197 clay with gravel 197-217 sandy silt with gravel 217-223 sandy clay with gravel 223-236 silty sand with gravel 236-243 sandy clay with gravel 243-248 clayey gravel with sand 248-276 sandy silt with gravel
276 bedrock – Upper Camels Head Formation
BMW-16D Depth (ft bgs) Summary Description
0-25 silt with sand 25-44 sandy silt with gravel 44-73 silt with sand 73-95 silt with clay
95-107 clay with sand 107-127 silty gravel with sand 127-148 clay with sand 148-151 sandy silt with gravel 151-166 clay 166-172 clayey sand 172-187 Clay 187-202 clay with gravel 202-226 clayey sand with gravel 226-240 sandy clay with gravel 240-253 silty sand with gravel 253-265 sandy clay with gravel 265-276 clayey sand with gravel 276-279 silty sand with gravel 279-286 gravelly clay with sand 286-290 clayey sand with gravel
ft bgs – feet below ground surface

Feasibility Study Report 40th Street and Osborn Road WQARF Registry Site
Project # 14-2020-2037 | June 25, 2021 Page 5
As indicated above, bedrock, identified as the Camels Head Formation, was encountered at a depth of 276 ft below top-of-casing (btoc) (923.53 ft amsl) at BMW-02E and at a depth of 285 ft btoc at BMW-10D (863.63 ft amsl). Bedrock was not encountered at monitoring wells BMW-14D and BMW-16D. Based on the lithology, the MAU and LAU are not considered to be present below the Site. Therefore, the UAU/Camels Head Formation contact drops approximately 60 ft in a southwesterly direction between BMW-02E and BMW-10D, which is a slope of approximately 0.007 ft per ft (ft/ft) (Figure 3).
The hydrostratigraphic units have been defined based on review and evaluation of data generated during groundwater assessments at the ECP WQARF sites. The hydrogeology has been investigated to a maximum depth of approximately 300 ft bgs within the UAU. The base of the UAU was encountered at BMW-02E, BMW-09D, BMW-10D, BMW-17D, BMW-18D, and BMW-19D. The UAU ranges from 276 ft thick at BMW-02E to greater than 300 ft thick at BWM-14D. The UAU consists of predominantly fine-grained sands, silts and silt with sand, to sandy silts with trace amounts of gravel. The groundwater surface lies within the UAU.
Monitoring well construction details for the Site are presented in Table 1. The monitoring wells are designated Zone A-D as follows based on depth and screened interval:
Zone Well IDs Screened Interval Range1
(ft btoc)
Sample Depth Range2
(ft btoc) A BMW-01A, BMW-02A,
BMW-03A, BMW-04A, BMW-07A, BMW-10B3, MW-1, MW-7, MW-8, MW-9, and MW-10
20-105 (across water table at all wells)
30-100
B BMW-01B, BMW-02B, BMW-03B, BMW-04B, BMW-07B, and BMW-
09C
70-120 (submerged at all wells) 70-115
C BMW-02C 95-130 (submerged) 100-120 D BMW-02E4, BMW-09D,
BMW-10D, BMW-11D, BMW-14D, BMW-16D, BMW-17D, BMW-18D,
and BMW-19D
155-275 (submerged at all wells) 160-265
Notes: 1) Screened interval range is in feet below top-of-casing (ft btoc) and is obtained from Table 1. Depth-water ranges at the Site
ranges from 39.10 ft btoc at BMW-03A to 82.90 ft btoc at BMW-16D 2) Sample depth range in in ft btoc and is obtained from Table 3. 3) BMW-10B is grouped as a Zone A well. 4) BMW-02E replaced the well that was supposed to be installed in BMW-02D. Therefore, it is grouped as a Zone D well.
Groundwater elevations in the UAU have been monitored since June 2003 (Table 2; Appendix A - hydrographs). Monitoring wells installed at the Site are screened across both shallow (water table) and deeper intervals within the UAU (Figure 3 and Table 1). Groundwater elevations have generally declined since 2003. Depth to groundwater on May 13, 2020 ranged from 82.25 ft btoc (1,049.44 ft amsl) at BMW-04A to 37.26 ft btoc (1,163.11 ft amsl) at BMW-16D (Table 2 and Figure 6).

Feasibility Study Report 40th Street and Osborn Road WQARF Registry Site
Project # 14-2020-2037 | June 25, 2021 Page 6
As shown by the groundwater elevation hydrographs in Appendix A, water levels have been historically declining. The longest record of water levels is available for BMW-01A, dating to June 13, 2003. Water level declines for select monitoring wells are provided as follows:
Well Maximum
GWE (ft AMSL)
Date Current
GWE (ft AMSL)
Date
Change since maximum
GWE (ft)
Change Rate
(ft/yr)
BMW-01A 1,166.30 06/13/03 1,152.69 9/21/20 -13.61 -0.80 BMW-02A 1,168.18 10/01/08 1,157.90 9/21/20 -10.28 -0.86 BMW-02B 1,168.83 6/3/08 1,157.85 9/21/20 -10.98 -0.84 BMW-02C 1,168.831 6/3/08 1,157.82 9/21/20 -11.01 -0.85 BMW-02E 1,168.831 6/3/08 1,157.53 9/21/20 -11.30 -0.87 BMW-03A 1,171.51 10/01/08 1,161.10 9/21/20 -10.41 -0.87 BMW-03B 1,171.46 10/08/08 1,161.102 9/21/20 -10.36 -0.80 BMW-04A 1,168.05 02/27/14 1,162.92 9/21/20 -5.13 -0.79 BMW-04B 1,168.07 02/27/14 1,162.89 9/21/20 -5.18 -0.80 BMW-07A 1,155.34 8/24/2016 1,147.00 9/21/20 -8.34 -2.24 BMW-07B 1,155.26 8/24/2016 1,147.07 9/21/20 -8.19 -2.25 BMW-09D 1,119.41 11/30/18 1,117.96 9/21/20 -1.45 -0.73 BMW-10D 1,074.48 11/30/18 1,073.84 9/21/20 -0.64 -0.32 BMW-14D 1,055.99 5/13/20 1,055.52 9/21/20 -0.47 -1.42 BMW-16D 1049.44 5/13/20 1048.86 9/21/20 -0.58 -1.74
Notes: AMSL – above mean sea level Ft - feet GWE – Groundwater elevation in feet above mean sea level (ft AMSL) ft/yr – feet per year feet above mean sea level (ft AMSL) ft/yr – feet per year 1 – based on BMW-02B 2 – based on BMW-03A
The current (Figure 4) and historical direction of groundwater flow has been to the west-southwest with a current gradient of approximately 0.01 ft/ft. Vertical gradients between the shallow and deeper zones of the UAU monitored are generally negligible. The estimated horizontal hydraulic conductivity of the UAU is variable due to the heterogeneity of the UAU. Based on the results of groundwater modeling that has been performed at an upgradient wells (Fluid Solutions, 2000) and hydraulic parameter determinations of the lithologic logs from on-site wells, the horizontal hydraulic conductivity ranges from 5 to 15 ft/day. Assuming an effective porosity of 0.25, the current groundwater velocity ranges from 0.2 to 0.6 ft/day or 73 to 219 ft/year (ft/yr).
2.3 Nature and Extent of Contamination The purpose of the RI was to determine the nature and extent of contamination. The RI also identified present and foreseeable land and water use that have been or could become impacted by the contamination associated. A summary of the RI findings is presented below (Wood, 2020a):
• The COC at the Site is dissolved PCE in the groundwater. The source of the PCE is currently unknown.

Feasibility Study Report 40th Street and Osborn Road WQARF Registry Site
Project # 14-2020-2037 | June 25, 2021 Page 7
• Based on the October 2019 groundwater sampling event, the maximum concentration of PCE is 120 µg/L in samples BMW-02E-160 (1,039.63 ft amsl), BMW-02E-260 (939.63 ft amsl), and BMW-17D-140 (1,050.00 ft amsl).
• The vertical extent of groundwater impact has been characterized to bedrock.
• Groundwater flows in a southwesterly direction.
• Though PCE concentrations are slightly above the AWQS of 5.0 µg/L in groundwater samples collected from the furthest downgradient monitoring well BMW-16D, it has been determined that the downgradient extent of the PCE is adequately defined to complete the RI and FS.
• Additional details of land and water use within the Site are provided in the Remedial Investigation Report (Wood, 2020a).
Between April 2008 and May 2020, 18 monitoring wells were installed to characterize the areal and vertical extents of the PCE plume as follows:
• 5 Zone B wells – Site wells BMW-01B, BMW-02B, BMW-03B, BMW-04B, BMW-07B, and BMW-09C;
• 1 Zone C well - BMW-02C; and,
• 12 Zone D wells - BMW-02E, BMW-09D, BMW-10D, BMW-11D, BMW-14D, BMW-16D, BMW-17D, BMW-18D, BMW-19D, BMW-20, BMW-21D and BMW-22D.
The depth and sample intervals for each Zone are provided in the table in Section 2.2. Four borings identified as BMW-02D, BMW-08D, BMW-15D, and SMW-14B were also drilled with vertical profile samples (VPSs) collected at depths ranging from 40 ft bgs to 285 ft bgs, encompassing Zones A-D (Table 4).
Based on the results of the October 2019 groundwater monitoring event (Wood, 2020a) and the May 2020 monitoring well installation activities (Wood, 2020b), the aerial and vertical distributions of the dissolved PCE plume have interpreted as shown on Figures 2-5.
The Site PCE plume is described as follows (Figures 2-5):
• Extending from 112.5 ft bgs (1087.03 ft amsl) to 260 ft bgs (939.63 ft amsl) at BMW-02C/E (approximately 147.5 ft thick) at the upgradient end of the plume; and,
• Extending from 208 ft bgs (923.69 ft amsl) to approximately 245 ft bgs (886.69 (ft amsl) at BMW-16D (approximately 37 ft thick) at the downgradient end of the plume.
The entire plume is submerged below the water table and the decreasing thickness in the downgradient direction is controlled by the groundwater gradient and the underlying bedrock.
The September 2020 groundwater elevations are shown on Figure 6. The maximum PCE concentration reported was 120 µg/L in samples BMW-02E-160 (1,039.63 ft amsl), BMW-02E-260 (939.63 ft amsl), and BMW-17D-140 (1,050.00 ft amsl).
The BIOCHLOR Natural Attenuation Decision Support System, Version 2.2 (BIOCHLOR) was used to estimate the mass of dissolved PCE in the plume for the September 2020 groundwater sampling event. As shown on Figures 2 and 3, the PCE plume changes in width and thickness in the downgradient direction. Therefore, the PCE mass evaluation was performed on an area basis using the September 2020 PCE results. Average PCE concentrations for each well were input to the BIOCHLOR Model. The following

Feasibility Study Report 40th Street and Osborn Road WQARF Registry Site
Project # 14-2020-2037 | June 25, 2021 Page 8
provides the per area and total PCE mass/weight estimates for the September 2020 groundwater monitoring event.
Area Wells and Average PCE Concentrations
Plume Water Volume (MGals)
PCE Mass (Kg)
PCE Weight (Lbs)
U1 BMW-02C/E (38 µg/L) Upgradient (55 µg/L)
44.30 9.9 21.83
1 BMW-02C/E (38 µg/L) BMW-17D (98 µg/L) BMW-22D (65 µg/L)
139.84 43.3 95.46
2 BMW-22D (65 µg/L) BMW-09C (18 µg/L)
31.84 7.1 15.65
3 BMW-09C (18 µg/L) BMW-18D (10 µg/L) BMW-10D (5 µg/L)
62.32 3.0 6.61
4 BMW-10D (5 µg/L) 10.52 0.7 1.54
5 BMW-14D (3.4 µg/L) BMW-16D (13 µg/L)
4.65 0.2 0.44
Total 293.47 64.2 141.53
Notes: MGals: million gallons Kg: kilograms Lbs: pounds 1. Area U is the area located upgradient of BMW-02
2.4 Risk Evaluation/Conceptual Site Model
2.4.1 Potential Receptors Prior to performing the exposure pathway evaluation, potential receptors to COCs were identified. The Site boundary (Figure 2) includes an area encompassing residential, educational and commercial/industrial settings. As indicated in Section 1.0, there is a school associated with San Pablo Episcopal Church located at the northeast corner of 31st Street and Windsor Avenue. Potential receptors are identified as current and future residential individuals, student, education workers (teachers, maintenance, and administrative), commercial/industrial workers, and construction workers occupying areas within the boundary.
Residential individuals include children and adults occupying residential locations within the Site boundary. A residential location is typically one where someone is present for an average of more than eight hours a day. It includes, but is not limited to, schools; dwellings; residences; correctional facilities; any other human activity areas of repeated, frequent use and/or chronic duration; and locations that typically house sensitive populations such as grade schools, hospitals, childcare centers, and nursing homes. Due to the depth of the dissolved phase PCE and that impacted groundwater is not being pumped in the area, the dissolved PCE in the groundwater does not currently pose a risk to residents.

Feasibility Study Report 40th Street and Osborn Road WQARF Registry Site
Project # 14-2020-2037 | June 25, 2021 Page 9
Commercial/industrial workers include adults working at the businesses within the Site boundaries. Due to the depth of the dissolved phase PCE and that impacted groundwater is not being pumped in the area, the dissolved PCE groundwater does pose a risk to commercial/industrial workers in the area.
2.4.2 Ecological Risk Evaluation As defined, an ecological receptor is “a specific ecological community, population, or individual organism, protected by federal or state laws and regulations, or a local population that provides an important natural or economic resource, function, and value” (A.A.C. R18-7-201). Wildlife or vegetation that is present in the study area is likely non-native to the area, is habituated to human presence, or has been maintained in a horticultural setting. Areas and land use within the boundary (Figure 2) do not contain suitable habitat for the five federally listed species. Due to the presence of COCs at depth, the urban character, and lack of ecological receptors within the boundary, an evaluation of ecological receptors is not warranted.
2.4.3 Human Risk Evaluation An exposure or migration pathway is the route by which the potential hazard (identified COCs) migrates from the source (soil vapor, soil, surface water, or groundwater) to a receptor. Pathways can include:
• Inhalation of impacted vapors;
• Dermal contact with impacted soil, groundwater, or surface water; or
• Ingestion of impacted soil, groundwater, or surface water.
An exposure pathway is complete when all four of these components are present: 1) a source and mechanism of chemical release; 2) a retention or transport medium (pathway); 3) an exposure point (i.e., a setting where potential human contact with the chemical-affected medium or media occurs); and 4) a route of exposure at the exposure point (e.g., ingestion, dermal, inhalation). The land use at the Site is commercial/industrial, residential, and public open space. This exposure pathway evaluation, therefore, assesses potential pathways by which long-term commercial workers, short-term construction workers, visitors to the site and residents may be exposed to the COC, PCE.
The Exposure Pathway Model is provided as Figure 7. Impacted groundwater is currently not being used. Therefore, the exposure pathways for residential individuals, commercial/industrial workers, and construction workers were determined to be incomplete.
2.4.4 Conceptual Site Model The dissolved PCE in the groundwater is a direct result of PCE releases to the subsurface. However, the source facility is unknown. A previously shallow, relatively horizontal PCE plume entered the zone of influence of SRP Well 17.9E-7.5N. The dissolved PCE plume was then drawn into the well. When pumping was discontinued in the mid-1980s, the dissolved PCE began to migrate downgradient with the ambient groundwater flow. Dissolved PCE has migrated approximately 13,000 feet down gradient. The dissolved PCE plume has been influenced by SRP well 17.9E-7.5N and has migrated approximately 10,660 ft from the SRP well to BMW-16D over a period of less than 35 years since the well was shut down, which is within the estimated groundwater flow velocity range.
3.0 Feasibility Study Scoping This section summarizes the regulatory requirements presented in Arizona statute and rule, delineates the remediation area and presents the ROs identified by ADEQ (ADEQ, 2020a).

Feasibility Study Report 40th Street and Osborn Road WQARF Registry Site
Project # 14-2020-2037 | June 25, 2021 Page 10
3.1 Regulatory Requirements The A.R.S. §49-282.06 requires that remedial actions shall:
1. Assure the protection of public health and welfare and the environment.
2. To the extent practicable, provide for the control, management or cleanup of the hazardous substances in order to allow the maximum beneficial use of the waters of the state.
3. Be reasonable, necessary, cost-effective and technically feasible.
Under A.R.S. §49-282-06B, the selected remedial action “shall address, at a minimum, any well that at the time of selection of the remedial action either supplies water for municipal, domestic, industrial, irrigation or agricultural uses or is part of a public water system if the well would now or in the reasonably foreseeable future produce water that would not be fit for its current or reasonably foreseeable end uses without treatment due to the release of hazardous substances. The specific measures to address any such well shall not reduce the supply of water available to the owner of the well.”
Under A.R.S. §49-282-06C, while selecting remedial actions, ADEQ shall consider:
1. Population, environmental and welfare concerns at risk.
2. Routes of exposure.
3. Amount, concentration, hazardous properties, environmental fate, such as the ability to bioaccumulate, persistence and probability of reaching the waters of the state, and the form of the substance present.
4. Physical factors affecting human and environmental exposure such as hydrogeology, climate and the extent of previous and expected migration.
5. The extent to which the amount of water available for beneficial use will be preserved by a particular type of remedial action.
6. The technical practicality and cost-effectiveness of alternative remedial actions applicable to a site.
7. The availability of other appropriate federal or state remedial action and enforcement mechanisms, including, to the extent consistent with this article, funding sources established under CERCLA, to respond to the release.
3.2 Delineation of Remediation Areas The RI Report concluded that the groundwater was the only media with COC concentrations that exceeded a screening value or a regulatory standard. The remediation area is the main Site PCE plume depicted on Figure 2 and the deep PCE plume depicted on Figures 3-5.
As of the October 2019 and May 2020 sampling events, the PCE plume is estimated to be at least 13,000 ft or 2.5 miles long and is and is a maximum of 960 ft wide. The vertical thickness of the submerged PCE slopes across the Site becoming thinner with distance, nearly 160 feet at well cluster BMW-02C/E to approximately 37 ft thick at BMW-16D.
3.3 Remedial Objectives ROs have been developed as part of the RI process (ADEQ, 2020a). Pursuant to A.A.C. R18-16-406 (I), the ROs were based on field investigation results, the Land and Water use Study (LWUS) (Wood, 2020c), the

Feasibility Study Report 40th Street and Osborn Road WQARF Registry Site
Project # 14-2020-2037 | June 25, 2021 Page 11
screening level risk evaluation, ADEQ input, and input from the community during the public comment period on the draft RO Report. ROs are used in this FS to identify appropriate remedial technologies in developing the remedial alternatives.
3.3.1 Remedial Objectives for Land Use/Soil The Site is located within a mixed residential and commercial area. The current City of Phoenix (COP) zoning maps indicate the Site is zoned as residential (multiple family residence, residential office, and single-family residence) and commercial (neighborhood retail, intermediate commercial, and restricted commercial). The COP indicated there are no current foreseeable plans to alter the current land use at or near the Site.
ROs for land use are typically established for those properties known to be contaminated with hazardous substances above a Soil Remediation Level or a risk-based level. A source facility for the PCE plume was not identified. Therefore, no soil nor vapor intrusion investigation was performed. No soil remedial objective is established for the Site (ADEQ, 2020a).
3.3.2 Remedial Objectives for Groundwater Use The groundwater use portion of the LWUS Report is a summary of information gathered from the Arizona Department of Water Resources (ADWR), water providers, and municipalities. The water providers at the Site are the COP and SRP (Wood, 2020c).
The Site lies within the Phoenix Active Management Area (AMA), an area where groundwater use is controlled and regulated. The Phoenix AMA was created by the Arizona Groundwater Management Code passed in 1980 and covers approximately 5,646 square miles in central Arizona. All groundwater withdrawn from any AMA must occur under a groundwater right or permit, unless groundwater is being withdrawn from an exempt well.
ADWR records indicate there are fourteen (14) non-exempt and four (4) exempt water supply wells located within approximately one mile of the PCE plume boundary. The non-exempt wells include: (a) twelve (12) wells owned and operated by SRP; (b) one well owned by COP; and (c) one well owned by Maricopa County Flood Control District. According to ADWR, the COP owned well was used to fill the swimming pool at Perry Park; however, it is currently inactive. The well owned by Maricopa County was used for de-watering purposes. The intended use of the four exempt wells is domestic irrigation. There are no grandfathered rights in the vicinity of the PCE plume boundary. The COP and SRP have service area rights in the vicinity of the Site, however, only SRP is currently pumping groundwater in the vicinity of the PCE plume boundary. The current use of water is for irrigation water. The future use of groundwater includes irrigation and municipal (potable supply) (Wood, 2020c).
The groundwater is currently contaminated with PCE at concentrations that exceed the AWQS. Thus, the ROs for groundwater use are as follows (ADEQ, 2020a):
1.2.1.1 Irrigation Use Protect against the loss or impairment of irrigation water threatened by the contaminants of concern within the Site. Where protection cannot be achieved in a reasonable, necessary, or cost-effective manner; restore, replace, or otherwise provide for irrigation water that is lost or impaired by the contaminants of concern at or origination from the 40th Street and Osborn Road WQARF Site. Action is needed for as long as necessary to ensure that, while the water exists and the resource remains available, the contamination associated with the Site does not prohibit or limit the designated use of groundwater within or outside the current site boundaries.

Feasibility Study Report 40th Street and Osborn Road WQARF Registry Site
Project # 14-2020-2037 | June 25, 2021 Page 12
1.2.1.2 Potable Use Protect against the loss or impairment of potable water threatened by the contaminants of concern at the Site. Where protection cannot be achieved in a reasonable, necessary, or cost-effective manner; restore, replace, or otherwise provide for potable water that is lost or impaired by the contaminants of concern at the Site. Action is needed for as long as necessary to ensure that, while the water exists and the resource remains available, the contamination associated with the Site does not prohibit or limit the designated use of groundwater.
3.3.3 Remedial Objectives for Surface Water Use Current surface water use at the Site is irrigation from SRP canals. The water in the SRP canals is supplemented with groundwater pumped from SRP wells at the Site. The future use of the surface water in the SRP canals includes irrigation and drinking water. The current and future source of the water in the SRP canals originating from the Site is groundwater pumped by SRP wells. Thus, ROs for surface water use are not needed because the ROs for groundwater use for the water pumped into the canals are applicable (ADEQ, 2020a).
4.0 Identification and Screening of Remedial Measures and Strategies
This section presents the evaluation and screening of various remedial measures and strategies related to Site contamination and lists the applicable technologies retained for evaluation as part of the reference and alternative remedies pursuant to A.A.C. R18-16-407 (E) and (F).
4.1 Remedial Measures/Strategies Remedial measures are remediation technologies or methodologies that are screened based on anticipated removal or reduction of contaminants at the Site and the ability to achieve the ROs. The six remedial strategies to be developed are listed below. A strategy may incorporate more than one remediation technology or methodology, such as a plume remediation strategy that consists of a combination of pumping and treating in portions of an aquifer and monitored \natural attenuation for other portions of the aquifer. The basic remedial strategies are defined in A.R.S. § 49-282.06(B)4 and A.A.C. R18-16-407(F) are:
1. Plume remediation
2. Physical containment
3. Controlled migration
4. Source control
5. Monitoring
6. No action
4.1.1 Plume Remediation Plume remediation is a strategy to achieve water quality standards for COCs in groundwater. This strategy typically involves groundwater extraction and treatment to achieve capture and removal of COCs from impacted groundwater but may also include in-situ treatment approaches. Plume remediation is applicable and will be retained for development of the reference remedy and alternate remedies.
Feasibility Study Report 40th Street and Osborn Road WQARF Registry Site
Project # 14-2020-2037 | June 25, 2021 Page 13
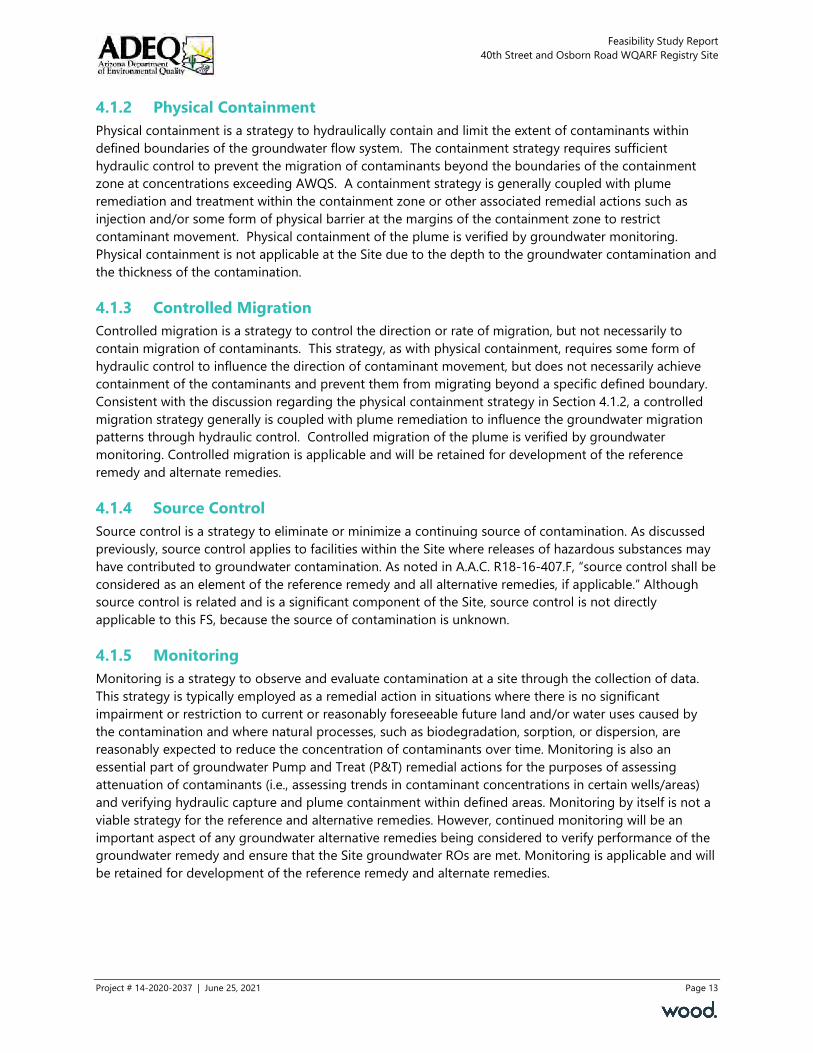
4.1.2 Physical Containment Physical containment is a strategy to hydraulically contain and limit the extent of contaminants within defined boundaries of the groundwater flow system. The containment strategy requires sufficient hydraulic control to prevent the migration of contaminants beyond the boundaries of the containment zone at concentrations exceeding AWQS. A containment strategy is generally coupled with plume remediation and treatment within the containment zone or other associated remedial actions such as injection and/or some form of physical barrier at the margins of the containment zone to restrict contaminant movement. Physical containment of the plume is verified by groundwater monitoring. Physical containment is not applicable at the Site due to the depth to the groundwater contamination and the thickness of the contamination.
4.1.3 Controlled Migration Controlled migration is a strategy to control the direction or rate of migration, but not necessarily to contain migration of contaminants. This strategy, as with physical containment, requires some form of hydraulic control to influence the direction of contaminant movement, but does not necessarily achieve containment of the contaminants and prevent them from migrating beyond a specific defined boundary. Consistent with the discussion regarding the physical containment strategy in Section 4.1.2, a controlled migration strategy generally is coupled with plume remediation to influence the groundwater migration patterns through hydraulic control. Controlled migration of the plume is verified by groundwater monitoring. Controlled migration is applicable and will be retained for development of the reference remedy and alternate remedies.
4.1.4 Source Control Source control is a strategy to eliminate or minimize a continuing source of contamination. As discussed previously, source control applies to facilities within the Site where releases of hazardous substances may have contributed to groundwater contamination. As noted in A.A.C. R18-16-407.F, “source control shall be considered as an element of the reference remedy and all alternative remedies, if applicable.” Although source control is related and is a significant component of the Site, source control is not directly applicable to this FS, because the source of contamination is unknown.
4.1.5 Monitoring Monitoring is a strategy to observe and evaluate contamination at a site through the collection of data. This strategy is typically employed as a remedial action in situations where there is no significant impairment or restriction to current or reasonably foreseeable future land and/or water uses caused by the contamination and where natural processes, such as biodegradation, sorption, or dispersion, are reasonably expected to reduce the concentration of contaminants over time. Monitoring is also an essential part of groundwater Pump and Treat (P&T) remedial actions for the purposes of assessing attenuation of contaminants (i.e., assessing trends in contaminant concentrations in certain wells/areas) and verifying hydraulic capture and plume containment within defined areas. Monitoring by itself is not a viable strategy for the reference and alternative remedies. However, continued monitoring will be an important aspect of any groundwater alternative remedies being considered to verify performance of the groundwater remedy and ensure that the Site groundwater ROs are met. Monitoring is applicable and will be retained for development of the reference remedy and alternate remedies.
Feasibility Study Report 40th Street and Osborn Road WQARF Registry Site
Project # 14-2020-2037 | June 25, 2021 Page 14
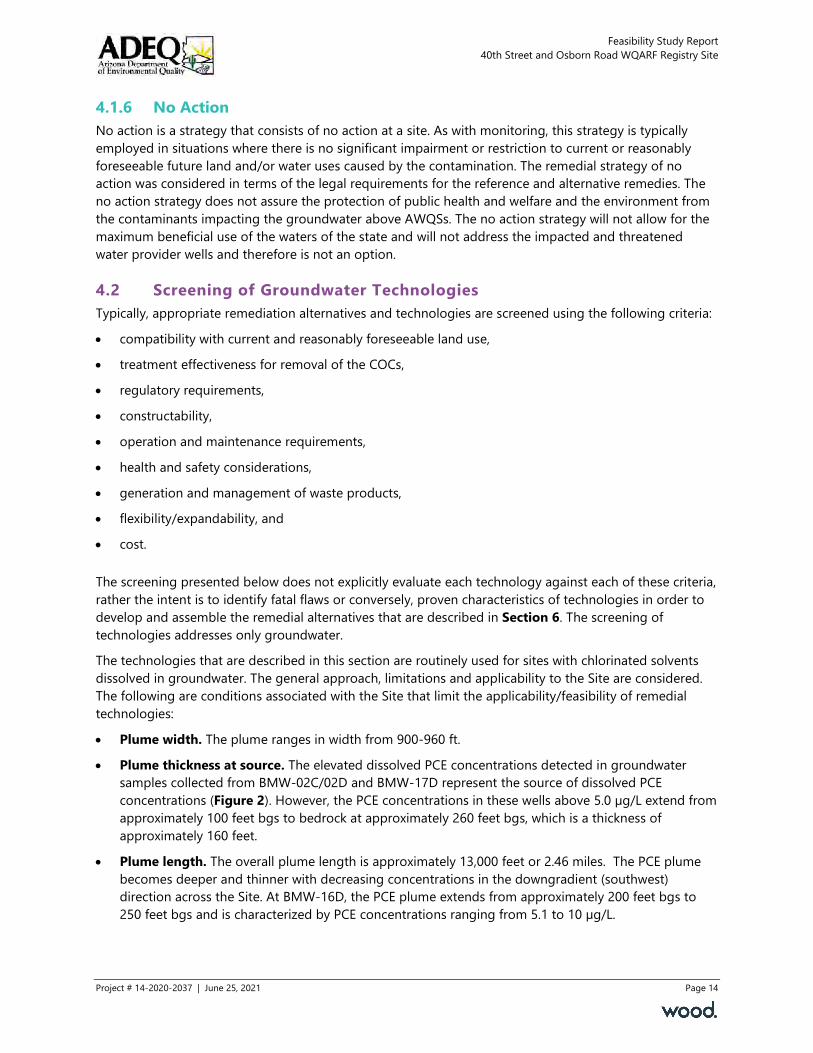
4.1.6 No Action No action is a strategy that consists of no action at a site. As with monitoring, this strategy is typically employed in situations where there is no significant impairment or restriction to current or reasonably foreseeable future land and/or water uses caused by the contamination. The remedial strategy of no action was considered in terms of the legal requirements for the reference and alternative remedies. The no action strategy does not assure the protection of public health and welfare and the environment from the contaminants impacting the groundwater above AWQSs. The no action strategy will not allow for the maximum beneficial use of the waters of the state and will not address the impacted and threatened water provider wells and therefore is not an option.
4.2 Screening of Groundwater Technologies Typically, appropriate remediation alternatives and technologies are screened using the following criteria:
• compatibility with current and reasonably foreseeable land use,
• treatment effectiveness for removal of the COCs,
• regulatory requirements,
• constructability,
• operation and maintenance requirements,
• health and safety considerations,
• generation and management of waste products,
• flexibility/expandability, and
• cost.
The screening presented below does not explicitly evaluate each technology against each of these criteria, rather the intent is to identify fatal flaws or conversely, proven characteristics of technologies in order to develop and assemble the remedial alternatives that are described in Section 6. The screening of technologies addresses only groundwater.
The technologies that are described in this section are routinely used for sites with chlorinated solvents dissolved in groundwater. The general approach, limitations and applicability to the Site are considered. The following are conditions associated with the Site that limit the applicability/feasibility of remedial technologies:
• Plume width. The plume ranges in width from 900-960 ft.
• Plume thickness at source. The elevated dissolved PCE concentrations detected in groundwater samples collected from BMW-02C/02D and BMW-17D represent the source of dissolved PCE concentrations (Figure 2). However, the PCE concentrations in these wells above 5.0 µg/L extend from approximately 100 feet bgs to bedrock at approximately 260 feet bgs, which is a thickness of approximately 160 feet.
• Plume length. The overall plume length is approximately 13,000 feet or 2.46 miles. The PCE plume becomes deeper and thinner with decreasing concentrations in the downgradient (southwest) direction across the Site. At BMW-16D, the PCE plume extends from approximately 200 feet bgs to 250 feet bgs and is characterized by PCE concentrations ranging from 5.1 to 10 µg/L.

Feasibility Study Report 40th Street and Osborn Road WQARF Registry Site
Project # 14-2020-2037 | June 25, 2021 Page 15
• Plume submergence. Depth to groundwater ranges from approximately 41 ft btoc at BMW-02C to approximately 83 ft btoc at BMW-16D. The upper vertical boundary of the PCE plume at BMW-02C is located approximately 60 ft below the water table. At BMW-16D, the upper boundary of the PCE plume is located approximately 117 ft below the water table.
• Plume location. The plume is located within a highly developed urbanized area that includes single and multi-family residences, an assisted living community/nursing home, commercial/retail properties, a City of Phoenix park, and City of Phoenix streets. This limits available locations to install remedial wells and the remediation system(s).
4.2.1 Monitored Natural Attenuation Monitored Natural Attenuation (MNA) is an approach that involves monitoring volatile organic compounds (VOCs) and other parameters in groundwater to identify and track the decrease of contaminant concentrations over time. Processes that can decrease concentrations include dilution, dispersion, volatilization, and biological degradation. Documenting MNA typically includes measurement of various chemical and hydrogeological parameters to provide evidence that MNA is a protective remedy. MNA is usually combined with source control, or selected at sites where the source is substantially depleted. MNA is typically applicable to sites where the contaminant plume is stable or shrinking.
When sufficient biologically appealing organic carbon and hydrogen are available, bacteria will often deplete the supply of available electron acceptors. In this case, anaerobic, non-oxygen breathing, bacteria will utilize chlorinated solvents as electron acceptors, a process that is referred to as reductive dechlorination (RD). Reductive dechlorination is the principal biological process resulting in the degradation of chlorinated solvents in the subsurface. It is rare to find sufficient naturally occurring organic carbon to promote reductive dechlorination. Though the natural fraction of organic carbon in soil plays a role in RD, it is typically present at too low of levels in Arizona soils to promote RD. Therefore, the organic carbon typically originates from a fuel release (i.e., leaking underground storage tank), leachate from a landfill, or added as part of a remedial action. Reductive dechlorination (RD) is evaluated through observation of VOC daughter products, trends in VOC distributions, and trends in natural attenuation parameters. As shown in Table 3, the PCE RD daughter products TCE and c-1,2-DCE have not been historically detected at appreciable concentrations in groundwater samples. Therefore, the groundwater analytical data indicates that biologic degradation by reductive dechlorination is not a factor in MNA at the Site.
Simple one-dimensional numerical models such as BIOCHLOR can be used to obtain natural attenuation rates. These tools are used primarily to model MNA via biodegradation. However, because MNA via biodegradation is not occurring, the BIOCHLOR model can only be used, in a limited fashion, as a screening tool to predict future movement and concentrations of the PCE plume and not as a useful tool to measure natural attenuation. However, the BIOCHLOR model was used to estimate dissolved PCE mass within the plume.
With the exception of biodegradation indicators, the components required for retaining a MNA approach are present. The plume is stable, geochemical parameters at the site are not considered unsuitable for application of MNA, and no continuing source is identified. Based on the above, MNA consisting of physical processes that include advection and dispersion is retained for remedial alternative development, and as included in the remedial approaches described in Section 5.0, would meet the remedial objectives for the Site. Progress of an MNA remedy can be measured by the following:
• Monitoring to observe changes in concentration with time;
Feasibility Study Report 40th Street and Osborn Road WQARF Registry Site
Project # 14-2020-2037 | June 25, 2021 Page 16
• Use of statistical trend analyses such as the Mann-Kendall statistic to evaluate concentration trends with time; and,
• Evaluation of changes in dissolved PCE mass with time.
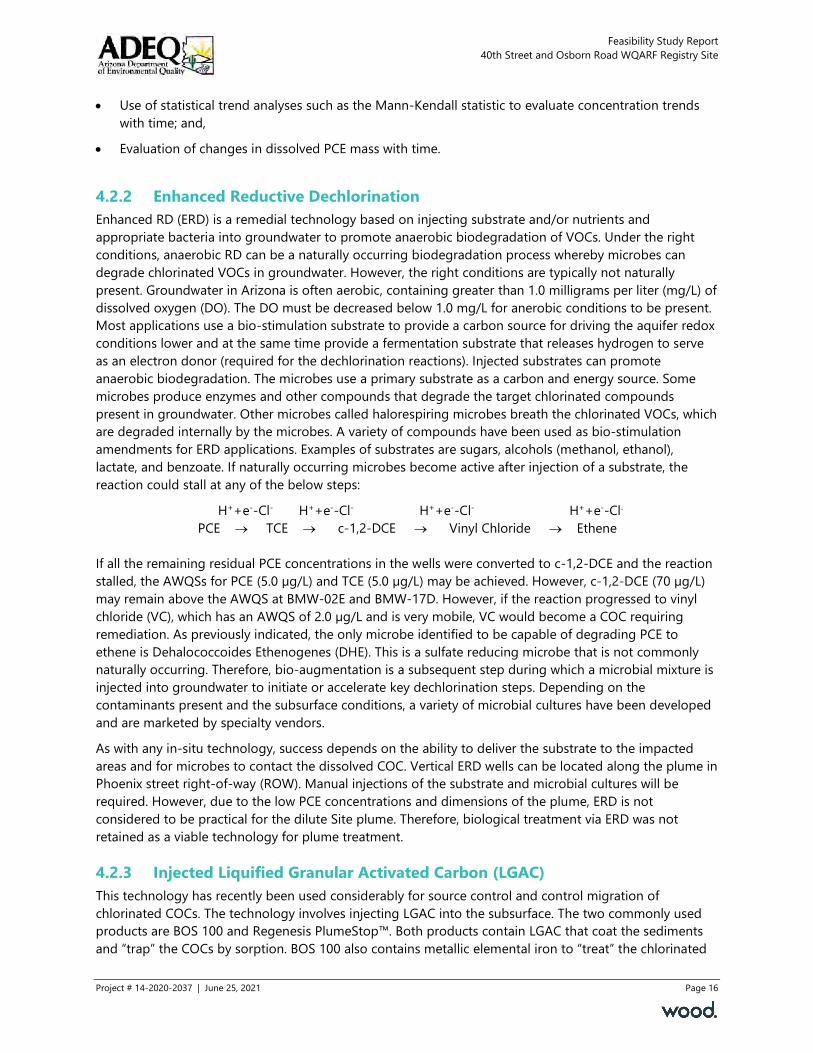
4.2.2 Enhanced Reductive Dechlorination Enhanced RD (ERD) is a remedial technology based on injecting substrate and/or nutrients and appropriate bacteria into groundwater to promote anaerobic biodegradation of VOCs. Under the right conditions, anaerobic RD can be a naturally occurring biodegradation process whereby microbes can degrade chlorinated VOCs in groundwater. However, the right conditions are typically not naturally present. Groundwater in Arizona is often aerobic, containing greater than 1.0 milligrams per liter (mg/L) of dissolved oxygen (DO). The DO must be decreased below 1.0 mg/L for anerobic conditions to be present. Most applications use a bio-stimulation substrate to provide a carbon source for driving the aquifer redox conditions lower and at the same time provide a fermentation substrate that releases hydrogen to serve as an electron donor (required for the dechlorination reactions). Injected substrates can promote anaerobic biodegradation. The microbes use a primary substrate as a carbon and energy source. Some microbes produce enzymes and other compounds that degrade the target chlorinated compounds present in groundwater. Other microbes called halorespiring microbes breath the chlorinated VOCs, which are degraded internally by the microbes. A variety of compounds have been used as bio-stimulation amendments for ERD applications. Examples of substrates are sugars, alcohols (methanol, ethanol), lactate, and benzoate. If naturally occurring microbes become active after injection of a substrate, the reaction could stall at any of the below steps:
H++e--Cl- H++e--Cl- H++e--Cl- H++e--Cl- PCE → TCE → c-1,2-DCE → Vinyl Chloride → Ethene If all the remaining residual PCE concentrations in the wells were converted to c-1,2-DCE and the reaction stalled, the AWQSs for PCE (5.0 µg/L) and TCE (5.0 µg/L) may be achieved. However, c-1,2-DCE (70 µg/L) may remain above the AWQS at BMW-02E and BMW-17D. However, if the reaction progressed to vinyl chloride (VC), which has an AWQS of 2.0 µg/L and is very mobile, VC would become a COC requiring remediation. As previously indicated, the only microbe identified to be capable of degrading PCE to ethene is Dehalococcoides Ethenogenes (DHE). This is a sulfate reducing microbe that is not commonly naturally occurring. Therefore, bio-augmentation is a subsequent step during which a microbial mixture is injected into groundwater to initiate or accelerate key dechlorination steps. Depending on the contaminants present and the subsurface conditions, a variety of microbial cultures have been developed and are marketed by specialty vendors.
As with any in-situ technology, success depends on the ability to deliver the substrate to the impacted areas and for microbes to contact the dissolved COC. Vertical ERD wells can be located along the plume in Phoenix street right-of-way (ROW). Manual injections of the substrate and microbial cultures will be required. However, due to the low PCE concentrations and dimensions of the plume, ERD is not considered to be practical for the dilute Site plume. Therefore, biological treatment via ERD was not retained as a viable technology for plume treatment.
4.2.3 Injected Liquified Granular Activated Carbon (LGAC) This technology has recently been used considerably for source control and control migration of chlorinated COCs. The technology involves injecting LGAC into the subsurface. The two commonly used products are BOS 100 and Regenesis PlumeStop™. Both products contain LGAC that coat the sediments and “trap” the COCs by sorption. BOS 100 also contains metallic elemental iron to “treat” the chlorinated

Feasibility Study Report 40th Street and Osborn Road WQARF Registry Site
Project # 14-2020-2037 | June 25, 2021 Page 17
COCs by chemical reduction. Therefore, BOS 100 removes the contaminants and provides both controlled migration and plume remediation. PlumeStop™ only “traps” the contaminants. AWQSs are achieved; however, the contaminants remain in the subsurface. Therefore, PlumeStop™ is considered a controlled migration technology. LGAC will achieve the ROs. BOS 100 was considered as a contingency remedial technology for the downgradient portion of the Site plume. A preliminary BOS 100 design was obtained from AST Environmental, the provider of BOS 100. The preliminary design involved drilling 20 injection points within a 100 ft line perpendicular to the plume. The initial boring is filled with bentonite chips. A direct push system is then used to pressure inject the BOS 100, forming a permeable reactive barrier (PRB). Assuming a treatment width of 800 ft, 160 injection points will be required. Based on the number of injection points required, this technology is not considered to be practicable in a developed urban setting and is not cost effective compared to other available remedial technologies. Therefore, LGAC injection was not retained for further evaluation as a remedial technology.
4.2.4 In-Situ Chemical Oxidation In-situ chemical oxidation or ISCO involves chemical reactions that convert contaminants into less toxic or inert compounds. ISCO is implemented by injecting a chemical oxidant into groundwater via a series of injection wells (or other injection methods) to destroy or degrade organic compounds. Several different types of oxidants have been used successfully at chlorinated solvent sites including permanganate, persulfate, catalyzed or activated hydrogen peroxide (HP), and ozone. The objective is to form strong oxidizing radicals that are capable of breaking the chemical bonds of the dissolved COCs. Site-specific aquifer oxidation-reduction (redox) conditions and parameters, hydraulic conductivity, along with oxidant-specific characteristics, need to be evaluated to determine the oxidant dosing and other critical design parameters. Although targeted for destruction of dissolved VOCs in water, the oxidizing agent will also react with the soil matrix; therefore, the radius of influence from the injection points may be limited. Pilot testing and/or bench testing is typically necessary to establish the injection spacing, rates, and oxidant dosing. ISCO is typically applicable and feasible for source control and remediation of plumes of limited extent. Due to the limitations caused by the Site plume dimensions, particularly the plume thickness at the source location, ISCO is not feasible. However, a continuous injection system can be applied as a controlled migration strategy for more manageable conditions found in the downgradient portions of the Site PCE plume.
As with LGAC, installation and operation of an ISCO system as a controlled migration technology is considered impracticable within a highly developed residential setting. Therefore, ISCO was not retained for alternative remedy development.
4.2.5 In-Situ Chemical Reduction In situ chemical reduction (ISCR) is intended to reduce VOC concentrations by using materials such as zero-valent iron to degrade the VOCs. This technology is usually implemented in a PRB or funnel-and-gate configuration where the zero-valent iron can be installed perpendicular to the groundwater flow direction and the base of the barrier can be tied into a low permeability layer. Elemental iron or zero-valent iron was previously discussed and is included with the LGAC remedial technology and is therefore not retained as a remedial technology.
4.2.6 Groundwater Extraction and Treatment This remedial technology involves pumping contaminated groundwater from the plume and treating the groundwater ex-situ before discharge. Groundwater extraction and treatment (GWET) removes and decreases contaminant mass from the aquifer but it is generally more effective in controlling or containing the downgradient migration of a VOC plume. Contaminated groundwater can be treated by activated

Feasibility Study Report 40th Street and Osborn Road WQARF Registry Site
Project # 14-2020-2037 | June 25, 2021 Page 18
carbon, air stripping, oxidation, or by other means prior to discharge. Discharge options that may be considered include discharge to a sanitary sewer or a storm drain, a beneficial re-use such as irrigation supply, or reinjection into the aquifer at some location away from the plume. ADWR will require a Poor Quality Groundwater Withdrawal Permit (PQGWWP) for this activity. Discharge options with a beneficial re-use are strongly preferred due to the importance of water as a resource. However, ADWR charges fees for beneficial re-use of the water. Fees are not charged by ADWR for reinjection of treated water.
Groundwater extraction and treatment is typically inefficient at reducing contaminant mass because the concentrations in groundwater are low and it is expensive to install. However, considering the Site conditions, this is the only active remedial technology available to practicably and cost effectively achieve the remedial goals. The issues associated with GWET in a highly developed and urbanized setting are as follows:
• Property has to be retained for installation of extraction wells and treatment systems. This can be done via access agreement, lease, or purchase.
• The treated extracted water must be managed. The three options are re-injection, beneficial use such as irrigation or transfer to a canal system, or discharge to a sewer system.
If an existing pumping well can be equipped with wellhead treatment and treated water management infrastructure exists, the installation costs are greatly decreased. Re-injection is often the preferred method for treated water management; however, the treated water must be transported to an injection well gallery upgradient of the plume boundary. SRP has indicated they prefer transfer of the treated water to their canal system in the area.
Based on the evaluation of Site conditions, particularly the plume thickness at the source, this remedial technology can meet the Site ROs within a reasonable restoration time frame by itself, which as discussed in Section 5.0 is expected to be within 22 years. It can also be an effective controlled migration approach. This FS includes GWET as one element of the remedy considered for the Site. Therefore, this remedial technology has been retained for further evaluation.
4.2.7 Summary of Screening and Technologies Retained A summary of screening and specific technologies retained for developing the remedial alternatives is provided as Table 4.
5.0 Development of Reference Remedy and Alternative Remedies The retained remedial technologies presented in Section 4 are a combination of GWET and MNA, which based on the current Site conditions and urban setting are the best available technologies to practicably and cost effectively achieve the ROs. The recommended remedies including a reference remedy along with less aggressive and more aggressive alternative remedies have been developed, with all three including a combination of GWET and MNA. The reference remedy and alternate remedies consist of remedial strategies and actions (remedial measures) that will achieve ROs for the Site. Each remedy has been identified with consideration of the needs of the local water providers (SRP and COP).
Selected remedial measures are combined with the applicable strategies to develop the reference and alternate remedies. The reference and alternate remedies include contingent remedial measures. The contingent remedial measures are included to address the existing uncertainties regarding certain Site conditions, the achievement of ROs, or uncertain timeframes in which ROs will be achieved. Where remedial measures are necessary to achieve ROs, the remedial measures will be required as long as necessary to ensure the continued achievement of those objectives. The areas where remedial alternatives

Feasibility Study Report 40th Street and Osborn Road WQARF Registry Site
Project # 14-2020-2037 | June 25, 2021 Page 19
need to address environmental impacts include the plume area which is above the PCE AWQS of 5.0 µg/L (from the source to suitable downgradient boundaries) (Figures 2 and 3).
The reference remedy was developed based upon best engineering, geological, or hydrogeological judgment following engineering, geological, or hydrogeological standards of practice, considering the following:
• The information in the RI;
• The best available scientific information concerning available remedial technologies; and,
• Preliminary analysis of the comparison criteria and the ability of the reference remedy to comply with A.R.S. §49-282.06.
At a minimum, at least two alternative remedies are required to be developed for comparison with the reference remedy. At least one of the alternative remedies must employ a remedial strategy or combination of strategies that is more aggressive than the reference remedy, and at least one of the alternative remedies must employ a remedial strategy or combination of strategies that is less aggressive than the reference remedy. A more aggressive strategy is a strategy that requires fewer remedial measures to achieve remedial objectives, a strategy that achieves remedial objectives in a shorter period of time, or a strategy that is more certain in the long term and requires fewer contingencies. The reference and remedial alternatives include pumping of SRP well 17.9E-7.5N with wellhead treatment as either a contingency or the remedy (location shown on Figure 2). This is referred to as the SRP well GWET system. The Reference Remedy and More Aggressive Alternative Remedy include a second groundwater extraction well located at the intersection of the Grand Canal and Oak Street, referred to as the Grand Canal GWET system (location shown on Figure 2). In order to evaluate the proposed remedy, a capture zone analysis was prepared for SRP well 17.9E-7.5N.
The capture zone analysis was performed using a particle tracking simulation exercise. MODPATH was used for the pumping scenarios discussed below. MODPATH is a particle-tracking post-processing model that computes three-dimensional flow paths using output from groundwater flow simulations based on MODFLOW, the U.S. Geological Survey (USGS) finite-difference groundwater flow model. The program uses a semi-analytical particle-tracking scheme that allows an analytical expression of a particle's flow path to be obtained within each finite-difference grid cell. A particle's path is computed by tracking the particle from one cell to the next until it reaches a boundary, an internal sink/source, or satisfies another termination criterion. Data input to MODPATH consists of a combination of MODFLOW input data files, MODFLOW head and flow output files, and other input files specific to MODPATH. Output from MODPATH consists of several output files, including several particle coordinate output files intended to serve as input data for other programs that process, analyze, and display the results in various ways. The analysis is useful for visualizing the flow field and estimating capture zones of wells. The steps to this process can be summarized as follows:
• The user specifies hydraulic conductivity (horizontal and vertical) and sources/sinks. In transient simulations, also specify specific storage and stress periods.
• Run MODFLOW to calculate water table elevation everywhere.
• The user specifies porosity and the starting location of particles.
• Run MODPATH to calculate velocities, interpolate particle location, and output three-dimensional path lines.

Feasibility Study Report 40th Street and Osborn Road WQARF Registry Site
Project # 14-2020-2037 | June 25, 2021 Page 20
Relevant characteristics of this groundwater model, derived from previous investigations of this Site and nearby sites are as follows:
• Single layer system, depth 300 ft.
• Calibrated flow direction is southwest.
• Advective flow is the sole transport mechanism.
• Constant head boundary conditions.
• Grid size is 100 ft x 100 ft.
• Homogeneous aquifer with horizontal and vertical hydraulic conductivities of 5 ft/day and 0.5 ft/day, respectively.
• Porosity = 0.25.
• Transient scenarios used 0.005 for the specific storage value.
The above aquifer parameters used for the following particle tracking scenarios are based on detailed lithologic logs of site-specific monitoring wells.
Figure 8 shows specified the surrounding modeling boundary conditions for the particle tracking simulations where the heads are set and remain constant based on recently measured water level elevations. Fluid is simulated as moving in or out of the groundwater at a rate sufficient to maintain the specified head for the different simulations.
Figure 9 shows the results of steady-state conditions that involves the forward particle tracking simulation for a pumping rate of 700 gpm at SRP Well 17.9 E-7.5N (SRP Well). Additionally, this model simulation indicates an average drawdown of approximately 35 feet and capture of the particles are lost between 1,200 to 1,300 feet downgradient of the SRP Well.
Figures 10 shows the results of transient state conditions that involves the forward particle tracking simulation for a pumping rate of 700 gpm at the SRP Well for a 10-year period. Like the previous steady-state scenario, drawdown is approximately 35 feet and capture are lost 1,200 to 1,300 downgradient of the SRP Well. However, this transient scenario indicates full capture of the upgradient particles within the 10-year period.
Figures 11 shows the results of transient state conditions that involves the forward particle tracking simulation for a pumping rate of 700 gpm at the SRP Well and a modeled extraction well completed approximately 2 miles southwest of the SRP Well pumping (identified as the Grand Canal GWET system) at 300 gpm for a 20-year period. Again, like the previous two scenarios, drawdown is approximately 35 feet at the SRP Well. Drawdown at the modeled extraction well is approximately 10 feet. This transient scenario indicates full capture of the upgradient particles within the 10-year period at the SRP Well and most of the particles downgradient of the SRP Well capture zone are either intercepted or captured at the modeled extraction well within a 17-year pumping period.
The reference and alternate remedies are presented in the following sections. Discussion of the remedies includes a discussion of the associated remedial measures and remedial strategies pursuant to A.A.C. R18-16- 407(E). The remedial alternatives presented includes a group of similar and related remedial measures; therefore, the discussion of individual remedial measures is presented after the discussion of the remedial alternatives.
Components of the More Aggressive Alternative Remedy are included in the Reference Remedy and Less Aggressive Alternative Remedy, either as a part of the remedy or as a contingency. Therefore, the

Feasibility Study Report 40th Street and Osborn Road WQARF Registry Site
Project # 14-2020-2037 | June 25, 2021 Page 21
remedies are discussed in order from More Aggressive Alternative Remedy to Reference Remedy to Less Aggressive Alternative Remedy.
5.1 More Aggressive Alternative Remedy This section describes the More Aggressive Alternative Remedy, which is multiple well GWET plus MNA. The more aggressive remedy involves installation of two GWET systems within two years of each other and concurrent operation, maintenance, and monitoring (OM&M) of the systems with the intent of decreasing the overall time to complete remediation.
The remedial strategies for the Reference Remedy from A.A.C. R18-16-407(F) are as follows:
• Source control for the area of BMW-02C/02E to eliminate or mitigate a continuing source of contamination;
• Controlled migration utilizing a downgradient GWET system;
• Plume remediation to achieve water quality standards for COCs in areas of highest contaminant concentrations;
• Monitoring to observe and evaluate the contamination through the collection of data; and,
• Contingency remedial measures to address potential uncertainties.
The remedy includes two GWET systems, one at SRP Well 17.9E-7.5N to remediate the upgradient portion of the PCE plume and a second downgradient GWET system to remediate the PCE plume downgradient of the SRP well.
5.1.1 SRP Well 17.9E-7.5N Wellhead Treatment (SRP Well GWET System) SRP Well 17.9E-7.5N is an existing irrigation well located slightly outside the Site PCE plume and downgradient of the source that is located in the vicinity of BMW-02C/02E (Figures 2 and 3). As shown in Table 3, groundwater historically extracted from this well was reported with PCE concentrations above 5.0 µg/L ranging from 6.8 µg/L on August 8, 2010 to 210 µg/L on September 28, 1998. This demonstrates that operation of this well is able to locally change the ambient groundwater flow direction, thus capturing the dissolved PCE, which is confirmed by Figures 8-11. SRP took the well off-line in 1990, but continued operating the well periodically to collect water quality samples. When operating, SRP Well 17.9E-7.5N was located within the plume and was removing dissolved PCE. Since August 8, 2010 PCE concentrations in the extracted groundwater have been below 5.0 µg/L as groundwater flow shifted back to ambient conditions after the well was taken off-line.
According to ADWR records, SRP Well 17.9E-7.5N is 300 feet deep with an 18-inch steel casing that is screened from 100 to 300 ft bgs. The well is equipped with a pump that has a design capacity of 1,000 gallons per minute (gpm). However, based on pumping records reviewed in ADWR records, the average pumping rate was approximately 300 gpm. Due to the well and pump possibly not being in sufficient condition to serve as a GWET well, the cost estimate includes re-casing the well with a 14-inch diameter casing and installing a new submersible pump capable of 700 gpm.
The extracted groundwater will be treated using GAC. Based on the pump capacity and expected PCE concentrations, two 20,000 lb GAC vessels in series are planned. The treatment system is designed to handle a maximum flow rate of 700 gpm. The capital costs for the wellhead treatment system are for well improvements and purchase and installation of the GAC vessels. The estimated area required for the GAC vessels is approximately 32 ft x 14 ft. ADEQ will be responsible for OM&M for the wellhead treatment system. These costs include electrical costs and renting space for the treatment system if it is too large to

Feasibility Study Report 40th Street and Osborn Road WQARF Registry Site
Project # 14-2020-2037 | June 25, 2021 Page 22
be installed in the existing SRP well yard. Therefore, these costs have been included in the cost estimate for the remedy. Water samples will be collected monthly from the system to evaluate breakthrough of the GAC. Therefore, this will involve three samples per month analyzed for VOCs, one each from the influent and effluent for the lead GAC vessel and one from the effluent from the secondary GAC vessel. Total volume of water pumped will be measured each month.
The treated water will be discharged to the SRP Arizona Canal. This is considered a beneficial use by ADWR which requires a $3.00 per acre-foot (af) of water pumped. Assuming the system will be operated 24 hours per day and seven days per week (at least 95% runtime), approximately 1,130 af of water will be pumped, treated, and discharged. The estimated annual fee is $3,390.
The GWET system will continue to be operated until four consecutive semi-annual groundwater samples collected from BMW-02C/BMW-02E and from the discharge from the pumping well are reported with PCE below 5.0 µg/L. An additional two year rebound monitoring period (four additional sampling events) will be conducted to confirm completion GWET. Based on the particle tracking simulation and for cost estimation purposes, the O&M period is 10 years. Estimated GAC bed life is 12 months. Therefore, 10 GAC changeouts are estimated during the operation period. The cost estimate assumes the pump will have to be replaced every five years. Therefore, the cost estimate includes two pump replacements.
Based on the historic use and PCE concentrations, returning this well to service with wellhead treatment will provide the following:
• Pumping of SRP Well 17.9E-7.5N will increase the flow velocity upgradient of the well, thus decreasing the time to achieve the ROs.
• Restoration of a groundwater resource and asset for SRP.
• Decreased PCE concentrations downgradient of SRP Well 17.9E-7.5N, thus facilitating the MNA component of the remedy.
• Decreased remedy installation costs, specifically treated water management/infrastructure exist.
5.1.2 Downgradient Extraction Well The more aggressive remedy includes installation of a supplemental extraction well downgradient of SRP well 17.9E-7.5N. This well will be installed within two years of the SRP GWET system and will be operated concurrently with the SRP GWET system with the intent of decreasing the overall time to complete remediation. Due to the highly developed and urbanized area, two locations were identified as follows:
1. Use of the COP production well located at Perry Park. According to ADWR records, the well address is 2626 North 32nd Street (northwest corner of 32nd Street and Virginia Avenue) and the registration number is 55-626525. According to available information in ADWR records, the installation date for this well is unknown. The well is 218 ft deep with a 20-inch casing and is equipped with a 270 gpm capacity pump. The water pumped from the well was used to fill the Perry Park swimming pool. This well and pump has not been used in several years. Therefore, the well must be retrofitted to be used as as the supplemental GWET well. The well must be deepened to 285 ft and a new casing will be required. The cost estimate assumes removal and disposal of the existing pump and video logging of the well. The preliminary design involves installation of a minimum 14-inch diameter casing with 140 feet of 0.02-inch slot (standard flow) casing with 3/16-inch wall thickness. For GWET operation, the well will be equipped with a new 300 gpm pump. Pumped water will be routed from the treatment system to the SRP Grand Canal along 31st to Oak Street and then along Oak Street to the Grand Canal. Total length of piping is one mile (5,280 ft). This is considered the shortest available route to the Grand Canal.

Feasibility Study Report 40th Street and Osborn Road WQARF Registry Site
Project # 14-2020-2037 | June 25, 2021 Page 23
2. A vacant and undeveloped SRP easement for the Grand Canal located at the southeast corner of Oak Street and the Grand Canal. For design and cost purposes, the well will be drilled to 285 ft bgs using an air rotary method. A 10-inch diameter casing screened from 150-285 ft bgs will be installed. The well will be equipped with a submersible pump having a capacity of approximately 300 gpm. A power drop will be required to operate the pump. This location has a lower capital cost due to a long discharge pipe not being required (savings of approximately $1,000,000). However, system operation and maintenance will be required for an additional estimated five years.
Option 1 above is evaluated to be more expensive than Option 2 due to the capital cost to install the discharge pipe to the Grand Canal. However, the time to complete remediation for the area between the SRP well and the Perry Park well will be decreased. If the Grand Canal location is installed, capital costs will be lower; however, an additional five years of O&M will be required. The Grand Canal location does provide the added benefit of more effectively controlling migration of PCE downgradient of BMW-16D. Based on the above, Option 2 was selected for the remedy. The Grand Canal is referred to as the Grand Canal GWET system.
The extracted groundwater will be treated using GAC. Based on the pump capacity and expected PCE concentrations, two 10,000 lb GAC vessels in series are planned. The treatment system is designed to handle a maximum flow rate of 300 gpm. The capital costs for the wellhead treatment system are for well installation, purchase and installation of the GAC vessels, installation of the discharge pipe to the Grand Canal (less than 100 ft), and installation of a power drop. The estimated area required for the GAC vessels is approximately 20 ft x 10 ft. ADEQ will be responsible for OM&M for the wellhead treatment system. These costs include electrical costs, which have been included in the cost estimate for the remedy. Water samples will be collected monthly from the system to evaluate breakthrough of the GAC. Therefore, this will involve three samples per month analyzed for VOCs, one each from the influent and effluent for the lead GAC vessel and one from the effluent from the secondary GAC vessel. Total volume of water pumped will be measured each month.
The treated water will be discharged to the SRP Grand Canal. This is considered a beneficial use by ADWR which requires a $3.00 per af of water pumped. Assuming the system will be operated 24 hours per day and seven days per week, approximately 490 af of water will be pumped, treated, and discharged. The estimated annual fee is $1,470.
The GWET system will continue to be operated until four consecutive semi-annual groundwater samples collected from wells BMW-17D, BMW-22D, BMW-09D BMW-18D, BMW-19D, BMW-10D, BMW-14D, and BMW-16D and from the discharge from the pumping well are reported with PCE below 5.0 µg/L. An additional two year rebound monitoring period (four additional sampling events) will be conducted to confirm completion of GWET. Based on the particle tracking simulation, PCE concentrations may be decreased below 5.0 µg/L in these wells within 17 years considering concurrent operation with the SRP well 17.9E-7.5N GWET system. Estimated GAC bed life is 18 months. Therefore, 13 GAC changeouts are estimated during the operation period. The pump will be required to be changed approximately every five years. Therefore, three pump replacements are included in the cost estimate.
5.1.3 Monitoring
5.1.3.1 GWET Systems Monitoring will be required to evaluate performance of the GWET system performance and achievement of the remedial goals. The monitoring will consist of the following:

Feasibility Study Report 40th Street and Osborn Road WQARF Registry Site
Project # 14-2020-2037 | June 25, 2021 Page 24
• Monthly monitoring of GAC performance (assume six water samples collected per month analyzed for VOCs);
• For six months following startup of the SRP well 17.9N-7.5E GWET system, monthly measurement of water levels in wells BMW-01A, BMW-01B, BMW-02A, BMW-02B, BMW-02C, BMW-02E, BMW-03A, BMW-03B, BMW-04A, and BMW-04B to evaluate changes in water levels during system operation. This will be conducted during the first six months of operation. After this, water levels will be measured semi-annually as part of the regular monitoring program.
• For six months following startup of the Perry Park GWET system, monthly measurement of water levels in wells BMW-09D, BMW-10D, BMW-18D, and BMW-19D to evaluate changes in water levels during system operation. This will be conducted during the first six months of operation. After this, water levels will be measured semi-annually as part of the regular monitoring program.
The GWET systems will operate until four consecutive samples collected from surrounding monitoring wells and the discharge are reported with PCE concentrations below 5.0 µg/L. As indicated previously, the SRP well 17.9E-7.5N GWET system is expected to operate for 10 years and the Grand Canal GWET system is anticipated to operate for 17 years after system installation. Assuming the Grand Canal GWET system is started two years after the SRP well GWET system is started, these periods overlap.
5.1.3.2 Groundwater Monitoring/MNA Program In addition to GWET system monitoring described in Section 5.1.3.1, groundwater monitoring will be used to evaluate performance of the more aggressive remedy and achievement of the remedial goals. Monitoring for the more aggressive remedy will involve semiannual groundwater elevation measurements and collection of groundwater samples. Table 5 provides the groundwater monitoring program for cost estimation purposes. The well locations are shown on Figure 1.
Measurement of progress required for the more aggressive remedy to achieve the remedial goals will be performed using changes in PCE concentration with time, observation of changes in groundwater levels and groundwater flow direction, statistical trend analysis of data, and use evaluation of dissolved PCE mass change with time. Based on the estimated operation period of the Grand Canal GWET system, the estimated monitoring period is 21 years. As the remedy progresses, monitoring wells/sample intervals may be removed from the sampling program based on PCE concentrations, thus decreasing costs. Specifically, monitoring wells/sampling points will be removed from the sampling program if PCE concentrations are below 5.0 µg/L for four consecutive semi-annual groundwater sampling events and decreasing trends are indicated.
5.1.4 Contingencies Contingencies for the more aggressive remedy are as follows:
• Installation of up to two downgradient monitoring wells should PCE concentrations increase in samples collected from BMW-16D.
5.1.5 Permits and Agreements Permits and/or agreements would be necessary to authorize installation and operation of the More Aggressive Alternative Remedy, including:
• Pre-construction notifications (i.e., ADWR Notice of Intent to Drill) and postconstruction reporting (Driller’s Reports) would be prepared for any new wells that are installed;

Feasibility Study Report 40th Street and Osborn Road WQARF Registry Site
Project # 14-2020-2037 | June 25, 2021 Page 25
• Well construction and/or modification work must be conducted by an ADWR-licensed driller. New wells must comply with ADWR standards found in ARS §45-594, -595, -596 and -600 of the Groundwater Code;
• If the SRP well yard does not have sufficient space to install the wellhead treatment system; therefore, access to the adjacent church property will be required to install the wellhead treatment system;
• Special Use Permits for the COP to operate remediation systems (fees typically waived by COP when ADEQ is the applicant);
• An access agreement will have to be obtained from SRP to install and operate the Grand Canal GWET system;
• A poor quality groundwater withdrawal permit (PQGWWP) will be required from ADWR for pumping of the groundwater, which will include annual reporting; and,
• Well 17.9E-7.5N may not be used for remediation purposes and discharges from the contingent extraction well may not be discharged to the SRP canal system until SRP Board approval has been received and relevant agreements are in place.
5.1.6 Remedial Documents The following remedial documents will be required and are included in the cost analysis:
• Remediation System Design;
• O&M Work Plan (requires public comment period);
• Remediation As-Built Installation Report;
• Monthly O&M Technical Memos providing GWET operation times, volumes of water pumped, results of GAC vessel sampling, and GAC changeout if performed;
• Annual Poor Quality Groundwater Withdrawal Report (due by March of each year); and,
• Annual Remedial Progress Report documenting GWET O&M and semi-annual groundwater monitoring results (submitted by June 30 of each year).
5.2 Reference Remedy This section describes the Reference Remedy, which is GWET plus MNA.
The remedial strategies for the Reference Remedy from A.A.C. R18-16-407(F) are as follows:
• Source control for the area of BMW-02C/02E to eliminate or mitigate a continuing source of contamination;
• Plume remediation to achieve water quality standards for COCs in areas of highest contaminant concentrations;
• Monitoring to observe and evaluate the contamination at the Site through the collection of data; and,
• Contingency remedial measures to address potential uncertainties.
The Reference Remedy is the same as the more aggressive remedial alternative, with the exception that the Grand Canal GWET system is included as a contingency. This generally assumes the PCE plume downgradient of SRP well 17.9E-7.5N is currently in equilibrium and is stable. If PCE concentrations do

Feasibility Study Report 40th Street and Osborn Road WQARF Registry Site
Project # 14-2020-2037 | June 25, 2021 Page 26
not indicate a decreasing trend in the downgradient wells based on sampling events and/or modeling or the PCE concentrations are increasing in BMW-16D, the Grand Canal GWET system will be recommended to be installed and operated within seven years. The primary difference to the reference remedy is that the downgradient GWET system is installed at a later date than the more aggressive approach. The monitoring period for SRP well 17.9E-7.5N GWET system is 12 years. Modeling indicated that without a downgradient GWET system to control downgradient migration, PCE concentrations may increase to as high as 40 µg/L in the downgradient wells. After 100 years, PCE is modeled to be approximately 20 µg/L at BMW-16D. Therefore, it is estimated that a 110-year monitoring program will be required. Based on this, the contingency downgradient GWET system will be required.
For cost estimation purposes, the Grand Canal GWET system is installed seven years after the SRP well GWET system is started. Therefore, operation of the two systems will be concurrent for three years. O&M will be required for 17 years and monitoring will continue to year 26. The schedule for installation of the Grand Canal GWET system is flexible and can be installed at any time prior to Year 7. The benefit of this flexible installation schedule is a decrease in the O&M and monitoring time periods, thus decreasing costs.
5.3 Less Aggressive Alternative Remedy This section describes the Less Aggressive Remedy, which is MNA. Though only requiring a single remedial measure, MNA is identified as the Less Aggressive Remedy because it does not require installation of a remediation system and is considered the longest-term remedy. The remedial strategies for the less aggressive remedy from A.A.C. R18-16-407(F) are:
• Plume remediation to achieve water quality standards for COCs in waters of the state throughout the Site;
• Monitoring to observe and evaluate the contamination at the Site through the collection of data; and,
• Contingency remedial measures to address potential uncertainties.
Considering planned future groundwater uses in the area, MNA will likely not be approved as a standalone remedy unless no other feasible remedial technologies are available based on Site limitations. Therefore, pumping of SRP well 17.9E-7.5N with wellhead treatment is included as a contingency, which is the same as the reference remedy.
5.3.1 Monitoring Monitoring will be required to evaluate performance of the less aggressive remedy and achievement of the remedial goals. For cost estimation purposes, monitoring for the less aggressive remedy will involve semiannual groundwater elevation measurements of the same wells included in more aggressive remedy.
Measurement of progress and prediction of the time required for less aggressive remedy to achieve the remedial goals is the same as the more aggressive remedy. BIOCHLOR Natural Attenuation Decision Support System version 2.2 (BIOCHLOR) was used to screen PCE concentrations with time. The BIOCHLOR Model predicted that PCE will be at a concentration of approximately 20 µg/L at BMW-16D at 200 years. At 250 years, all monitoring points at the Site are shown as below 5.0 µg/L. However, PCE has migrated downgradient of BMW-16D. Therefore, implementation of contingency installation and operation of the SRP well 17.9E-7.5N GWET system will be required.

Feasibility Study Report 40th Street and Osborn Road WQARF Registry Site
Project # 14-2020-2037 | June 25, 2021 Page 27
5.4 Discussion of Specific Remedial Measures The evaluated Reference Remedy and More Aggressive Remedial Alternative include GWET utilizing wellhead treatment on SRP Well 17.9E-7.5N with installation and operation of a Grand Canal GWET system. MNA was evaluated as the Less Aggressive Remedy.
6.0 Detailed Comparison of The Reference Remedy and the Alternative Remedies
The following section compares the Reference Remedy and alternative remedies to criteria described in A.A.C R18-16-407H.3.
6.1 Comparison Criteria In accordance with A.A.C R18-16-407E.3, the FS has been completed to identify a Reference Remedy and alternative remedies that are potentially capable of achieving ROs, and to evaluate the remedies based on the comparison criteria in order to select a remedy that complies with A.R.S §49-282.06. A.A.C R18-16-407H specifies that practicability, risks, costs, and benefits are the primary remedy evaluation criteria.
Practicability includes the assessment of feasibility, short- and long-term effectiveness, and the reliability of the remedial alternative. The risk criteria include assessment of the overall protectiveness of public health and the environment in terms of fate and transport of the COCs, current and future land and water uses, exposure pathways and durations of potential exposure, changes in risk during remediation, and residual risk at the end of remediation. The cost analysis includes capital, O&M, and life cycle costs. Evaluation of benefits includes the assessment of lowered risk, reduced COC concentration or volume, decrease in liability, and preservation of existing and future uses.
Table 4 presents an evaluation of the reference and alternative remedies for the Site with respect to the comparison criteria. The following subsections detail how the remedies perform against these criteria.
For cost analyses, the estimates are conceptual and assumed to have similar margins of error between +50 percent (%) and –30% (i.e., the actual costs are expected to be between 30% less than and 50% more than the estimated costs). Long term O&M and monitoring costs are based on an annual escalation rate of 3%. However, due to the contingencies, the costs will be further evaluated in the PRAP.
The remedies are presented in the following subsections in order from the less aggressive remedial alternative to the reference remedy to the more aggressive remedial alternative.
6.1.1 Less Aggressive Alternative Remedy The practicability, risk, cost, and benefit of the Less Aggressive Remedy are discussed in the following subsections.
6.1.1.1 Practicability The Less Aggressive Alternative Remedy for the Site plume consists of MNA. MNA is a known and effective remedy. Semiannual monitoring and progress measurement will assess effectiveness. Considered a long-term remedy for the Site. Provides less certainty than the Reference Remedy and More Aggressive Alternative Remedy; however, trend analysis and predictive modeling are intended to increase certainty. No significant technological or hydrogeological barriers to application are anticipated. This remedy is considered to be feasible. However, due to the estimated time period to achieve the ROs, implementation of the contingency remedial measures will be required to make this remedy practicable. This results in implementation of the Reference Remedy.

Feasibility Study Report 40th Street and Osborn Road WQARF Registry Site
Project # 14-2020-2037 | June 25, 2021 Page 28
6.1.1.2 Protectiveness (Risk) No aquatic or terrestrial biota are at risk from the impacts associated with the plume. Within the current plume boundaries, the Less Aggressive Alternative Remedy is protective of human health because groundwater within the PCE plume is not currently being used. However, PCE may migrate downgradient resulting in impacts to groundwater that is currently being or is planned to be used. Therefore, implementation of the contingency remedial measures will be required to make this remedy protective. This results in implementation of the Reference Remedy.
6.1.1.3 Cost Costs for the Less Aggressive Alternative Remedy are presented in Table 6 and detailed costs are presented in Appendix B-1. The two monitoring wells downgradient of BMW-16D are included in the cost as a capital cost. An estimated 250 years are estimated for the ROs to be achieved. However, by Year 65, the estimated cost for the Less Aggressive Remedy exceeds the estimated maximum cost (+50%) for the Reference Remedy. Due to the estimated time period for the ROs to be achieved, the estimated cost for the Less Aggressive Remedy is more than the estimated cost for the Reference and More Aggressive Remedies. The inclusion of the contingency remedial measure results in the Reference Remedy. Therefore, contingency costs have not been included in the cost analysis for the Less Aggressive Remedy. To provide the cost for the Less Aggressive Alternative Remedy, the time period provided in Appendix B-1 is limited to a 65-year program. Based on a 65-year program, the total cost for the Less Aggressive Alternative Remedy is estimated at approximately $12,054,000, with a margin of error between $8,439,000 (-30%) and $18,081,000 (+50%).
6.1.1.4 Benefits Under the current ambient groundwater flow velocity, the Less Aggressive Remedial Alternative provides less benefit than the Reference Remedy or More Aggressive Remedial Alternative due to the longer anticipated time to achieve the remedial goals. As stated previously, the contingency remedial measure for the Less Aggressive Remedial Alternative is required, thus resulting in the Reference Remedy.
6.1.2 Reference Remedy The Reference Remedy is GWET via wellhead treatment at SRP Well 17.9E-7.5N with contingency installation and operation of the Grand Canal GWET system. The Reference Remedy is intended to achieve the remedial goal in a shorter time period than the Less Aggressive Remedy. It also offers a greater range for installation of the Grand Canal GWET system, between one and seven years of startup of the SRP well GWET system. The practicability, risk, cost, and benefits for implementation of the Reference Remedy are discussed in the following subsections.
6.1.2.1 Practicability GWET is a well-established technology for remediation of PCE impacted groundwater, particularly when an existing production well is available for wellhead treatment. GWET is the only feasible and cost-effective remedial technology available that is shorter term than MNA. No significant technological or hydrogeological barriers to application are anticipated. The reference remedy is considered to be feasible and practical.
6.1.2.2 Protectiveness (Risk) The Reference Remedy is considered protective of human health and the environment because groundwater within the plume area is remediated below the remediation goal, which allows future use of

Feasibility Study Report 40th Street and Osborn Road WQARF Registry Site
Project # 14-2020-2037 | June 25, 2021 Page 29
the groundwater. Also, the Reference Remedy also minimizes/eliminates downgradient migration of the PCE to potential downgradient groundwater uses.
6.1.2.3 Cost Costs for the Reference Remedy are presented in Table 4 and detailed costs are presented in Appendix B-2. Due to the timeframe, the estimated cost for the Reference Remedy is lower than the estimated cost for the Less Aggressive Remedial Alternative. Based on implementation of the Grand Canal GWET system seven years after startup of the SRP well GWET system and overall estimated 26-year time period to achieve the ROs, the cost for the Reference Remedy is higher than the estimated cost for the More Aggressive Remedial Alternative. However, the cost will decrease as the time period between startup of both GWET systems is decreased. Capital costs without contingencies are estimated to be approximately $1,173,000 and operation, maintenance, and monitoring (OM&M) costs are estimated to be approximately $5,858,000. These costs are based on the Grand Canal GWET system being installed and started during Year 7 of the remedy. These costs will decrease if the Grand Canal GWET system is installed and started within less than seven years. The total estimated cost for the Reference Remedy including contingencies is estimated at approximately $7,182,000, with a margin of error between $5,369,000 (-30%) and $11,474,000 (+50%).
6.1.2.4 Benefits The Reference Remedy is the same as the More Aggressive Alternative Remedy; however, it provides a flexible schedule for installation and operation of the Grand Canal GWET system, within seven years of implementation of the remedy. This allows decreased costs if the Grand Canal GWET system is implemented between one and seven years of the SRP well GWET system. The overall benefit for this remedy is that SRP Well 17.9E-7.5N can be returned to service within a relatively short timeframe with minimal construction disturbance and an available groundwater resource is returned to use. Implementation of the Grand Canal GWET system is expected to decrease the time required to achieve the remedial goals, thus decreasing the overall cost.
6.1.3 More Aggressive Alternative Remedy The More Aggressive Alternative Remedy is the same as the Reference Remedy. It is considered “more aggressive” because the Grand Canal GWET system is implemented within two years of startup of the SRP well GWET system. The estimated costs for the More Aggressive Alternative Remedy based on implementation of the Grand Canal GWET system within two years of implementation of the remedy are presented in Table 4 and detailed costs are presented in Appendix B-3. The estimated cost for the More Aggressive Alternative Remedy is lower than the estimated cost for the Reference Remedy due to the shorter time period for OM&M and delisting/closure of the Site. Capital costs without contingencies are estimated to be approximately $1,001,000 and operation, maintenance, and monitoring (OM&M) costs are estimated to be approximately $4,930,000. These costs are based on the Grand Canal GWET system being installed and started during Year 2 of the remedy. The total estimated cost for the More Aggressive Remedy including contingencies is approximately $6,082,000, with a margin of error between $4,241,000 (-30%) and $9,075,000 (+50%).
The More Aggressive Alternative Remedy results in the benefit of decreasing the timeframe to delist/close the Site, thus decreasing cost. However, it requires that the Grand Canal GWET system be implemented within two years of the SRP well GWET system.

Feasibility Study Report 40th Street and Osborn Road WQARF Registry Site
Project # 14-2020-2037 | June 25, 2021 Page 30
6.2 Comparison of Remedies Comparison of the remedies is required under A.A.C R18 16-407(H). The three evaluated remedies are all capable of achieving the ROs for groundwater and result in plume remediation. The differences are the timeframe and cost required to achieve the ROs. However, the Less Aggressive Alternative Remedy without contingency is expected to result in downgradient migration of the PCE plume. Table 4 presents a ranking of the comparison criteria for each of the remedies. Each remedy was ranked from zero to five, with five indicating the most relative benefit and zero indicating the least relative or no benefit. The following subsections describe the practicability, risk, cost, and benefits comparison for the remedies.
6.2.1 Practicability There are four considerations for practicability as follows:
• Feasibility involves the ability to put the remedy in place;
• Short-term effectiveness represents how much the remedy removes the PCE and limits the potential for exposure in the short-term;
• Long-term effectiveness represents how much the remedy removes the PCE and limits the potential for exposure in the long-term; and,
• Reliability involves whether the technologies comprising the alternative are expected to perform reliably.
The three evaluated remedial alternatives were equally feasible and reliable and all received a score of 5. The Reference Remedy and More Aggressive Alternative Remedy each received a score of 5 for short/long term effectiveness. However, due to the estimated timeframe, the Less Aggressive Remedy received a score of 1 for short/long term effectiveness. The practicability scores for the evaluated remedial alternatives are; Reference – 15, More Aggressive – 15, and Less Aggressive – 11.
6.2.2 Protectiveness (Risk) Due to the extent and low PCE concentrations, the Reference Remedy and More Aggressive Alternative Remedy are expected to achieve the remedial goals within 26 years, which is considered a reasonable timeframe, and control downgradient migration of the PCE plume. The Less Aggressive Alternative Remedy will require the most amount of time to achieve the remedial goal and may result in downgradient migration of PCE. The Reference Remedy and More Aggressive Alternative Remedy are considered more protective than the Less Aggressive Alternative Remedy due to the shorter time period to achieve the remedial goal. Therefore, the Reference Remedy and More Aggressive Alternative Remedy received a score of 5 and the Less Aggressive Alternative Remedy received a score of 1.
6.2.3 Cost The three remedies have varying capital and O&M costs. Due to the timeframe required, the Less Aggressive Alternative Remedy will cost the most, exceeding the estimated maximum (+50%) cost of the Reference Remedy by Year 65. The More Aggressive Alternative Remedy is estimated to cost the least. However, the cost for the Reference Remedy is estimated to approach the cost for the More Aggressive Alternative Remedy as the period between implementation of the SRP well and Grand Canal GWET systems decreases.

Feasibility Study Report 40th Street and Osborn Road WQARF Registry Site
Project # 14-2020-2037 | June 25, 2021 Page 31
6.2.4 Benefit The Reference Remedy and More Aggressive Alternative Remedy are the same and have the benefit of achieving the ROs within and estimated 26 years. The More Aggressive Alternative Remedy is expected to achieve the ROs in less time, thus decreasing costs. However, the Reference Remedy provides an extended schedule for installation of the Grand Canal GWET system. The Reference Remedy and More Aggressive Remedy return SRP Well 17.9E-7.5N to service and restore the groundwater use within the Site. Due to the timeframe required, the Least Aggressive Alternative Remedy does not provide benefits.
7.0 Proposed Remedy
7.1 Process and Reason for Selection As previously discussed, the available remedial technologies to achieve the groundwater ROs are limited due to the dimensions of the PCE plume, the hydrogeological and geochemical conditions at the Site, and the highly developed urbanized nature of the Site. The Reference Remedy and More Aggressive Alternative Remedy involve the same remedial measures and preliminary designs. The More Aggressive Alternative Remedy has the overall lowest cost. However, the Reference Remedy provides an extended schedule for installation of the Grand Canal GWET system, between one to seven years. Semiannual groundwater monitoring will be used to assess the PCE plume stability and monitor decreasing VOC concentrations at the Site. The Reference Remedy and More Aggressive Alternative Remedy scored the same (30 points) based on current conditions when ranking in accordance with the comparison criteria specified in A.A.C R18 16-407H.3.e (Section 6).
Based on the evaluation, the recommended remedy is the Reference Remedy. As the timeframe for installation of the Grand Canal GWET system decreases, overall estimated costs for the Reference Remedy will approach the overall estimated costs for the More Aggressive Alternative Remedy due to decreased OM&M time. This recommendation is based on what is the best combination of remedial effectiveness, practicability, cost, and benefit for restoration and use of groundwater resources.
7.2 Achievement of Remedial Objectives The Reference Remedy for PCE in groundwater will achieve the ROs (Section 3.3.2). It will provide active remediation of the dissolved PCE plume and will result in achievement of the ROs within 26 years assuming that the Grand Canal GWET system is installed within seven years of implementation of the remedy. The remedy time period will decrease as the time to implement the Grand Canal GWET system is decreased.
7.3 Achievement of Remedial Action Criteria Pursuant to ARS §49-282.06 To meet the remedial action criteria listed in ARS §49-282.06, it is recommended that the Reference Remedy for PCE in groundwater be selected as the Final Remedy. The Reference Remedy will:
• Provide for adequate protection of public health and welfare and the environment;
• Provide a thorough and timely means for continued remediation and monitoring of the existing groundwater impacts, including evaluation of the progress of remediation over time;
• To the extent practicable, provide for the control, management, and cleanup of the dissolved PCE in the groundwater;
• Provide for the beneficial future use of the groundwater resource by SRP and possibly COP; and,
• Be reasonable, cost-effective, and technically feasible.

Feasibility Study Report 40th Street and Osborn Road WQARF Registry Site
Project # 14-2020-2037 | June 25, 2021 Page 32
7.4 Consistency with Water Management and Land Use Plans The Reference Remedy for groundwater is consistent with water management plans and general land use plans.
8.0 Community Involvement ADEQ will issue a Notice to the Public announcing the availability of FS on ADEQ’s website at www.azdeq.gov. The notice may be mailed to the Public Mailing List for the Site, water providers, the Community Advisory Board (CAB), and any other interested parties. ADEQ may also present a summary of this FS and the remedial alternatives in a CAB meeting. Interested parties can also review the FS and other site documents at the ADEQ Main Office located at 1110 West Washington Street, Phoenix, Arizona. With 24-hour notice, an appointment can be made to review related documentation.

Feasibility Study Report 40th Street and Osborn Road WQARF Registry Site
Project # 14-2020-2037 | June 25, 2021 Page 33
9.0 References Arizona Department of Environmental Quality (ADEQ), 2000. Site Registry Report, 40th Street and Osborn,
May 18, 2000.
ADEQ, 2020a. Final Remedial Objectives Report, 40th Street and Osborn Road WQARF Registry Site, Phoenix, Arizona. July 14, 2020.
ADEQ. 2020b. Site History for the 40th Street and Osborn Road WQARF Site, https://azdeq.gov/node/935.
Corkhill, E.F.; Corell, S., Hill, B.M.; and Carr, D.A.; 1993, A Regional Groundwater Flow Model of the Salt River Valley—Phase I. Phoenix AMA Hydrogeologic Framework and Basic Data Report, April. http://azgs.arizona.edu/azgeobib/regional-groundwater-flow-model-salt-river-valley-phase-i-phoenix-active-management-area.
Earth Technology Corporation, (Earth Tech) 1989. Water Quality Assurance Revolving Fund Task Assignment No. E-2, Phase II – Task No. 1, Results of Soil Gas and Groundwater Testing in the East Central Phoenix Area, Phoenix, Arizona, November.
Fluid Solutions, 2000. Hydrogeologic Conceptual Model Report, 48th Street and Indian School Road Water Quality Assurance Revolving Fund (WQARF) Site, prepared for Salt River Project, February 2000.
Wood, 2020a. Remedial Investigation Report, 40th Street and Osborn Road WQARF Registry Site. Phoenix, Arizona. June 30, 2020.
Wood, 2020b. BMW-20B, BMW-21B, BMW-22B Well Drilling and Groundwater Monitoring Technical Memorandum, East Central Phoenix 40th Street and Osborn Road Water Quality Assurance Revolving Fund Site, Phoenix, Arizona. June 26, 2020.
Wood, 2020c. Revised Land and Water Use Report, East Central Phoenix, 48th Street & Indian School Road and 40th Street & Osborn Road, Water Quality Assurance Revolving Fund Sites, Phoenix, Arizona, June 30, 2020
United States Department of Agriculture (USDA), 2019. USDA Natural Resources Conservation Service Web Soil Survey. https://websoilsurvey.sc.egov.usda.gov/App/WebSoilSurvey.aspx.

Tables

LATITUDE (DEG) LONGITUDE (DEG)
40osb SRP17.9E-7.5N 617857 5/1/1965 Cable Tool NR 300 Steel / 18 / Perforated 100.0 - 300.0 48.0 - 300.0 Gravel NR NR 1193 NR NR
40osb BMW-01A 598109 6/2/2003 Hollow Stem Auger 10 91 PVC / 4 / 0.020 20 - 60 15 - 63 #10-20 Sand11 - 15 63 - 91
1193.20 1194.38 33.4877 -111.9961
40osb BMW-01B 909970 12/4/2008 Hollow Stem Auger 8 100 PVC / 2 / 0.020 70 - 100 65 - 100 #10-20 Sand 59 - 65 1193.59 1194.34 33.4878 -111.996140osb BMW-02A* 908743 4/18/2008 Sonic 10 61 PVC / 2 / 0.020 20 - 60 15 - 61 8/12 Sand 10 - 15 1199.66 1200.06 33.4901 -111.9946
40osb BMW-02B* 908743 4/18/2008 Sonic 10 100 PVC / 2 / 0.020 70 - 100 65 - 100 8/12 Sand10 - 1561 - 65
1199.60 1200.06 33.4901 -111.9946
40osb BMW-02C 917659 3/18/2015 Sonic8.25
7.125139.8 140.6
PVC / 4 / 0.020 109.5 - 139.5 106.7 - 140.6 #10-20 Sand 101.6 - 106.7 1199.53 1199.99 33.4901 -111.9946
40osb BMW-02E 922509 4/10/2019 Sonic 9 280 PVC / 4 / 0.020 155 - 265 153 - 269 #10-20 Sand 147 - 153 1199.63 1199.97 33.4901 -111.994740osb BMW-03A* 908744 5/16/2008 Hollow Stem Auger 10 60.5 PVC / 2 / 0.020 20 - 60 15 - 60.5 8/12 Sand 10 - 15 1201.09 1201.32 33.4895 -111.9929
40osb BMW-03B* 908744 5/16/2008 Hollow Stem Auger 10 98.3 PVC / 2 / 0.020 70 - 100 65 - 101 8/12 Sand10 - 1561 - 65
1201.12 1201.32 33.4895 -111.9929
40osb BMW-04B 916201 1/3/2014 Sonic8.6256.0
120.0121.7
PVC / 4 / 0.020 78.8 - 118.8 75.4 - 121.7 #10-20 Sand 71.6 - 75.4 1200.32 1200.90 33.4888 -111.9920
40osb BMW-04A 916200 1/4/2014 Sonic8.6256.0
70.071.1
PVC / 4 / 0.020 30.0 - 70.0 27.0 - 71.1 #10-20 Sand 23.5 - 27.0 1200.37 1200.86 33.4888 -111.9920
40osb BMW-07A 916198 12/29/2013 Sonic8.6256.0
70.074.0
PVC / 4 / 0.020 29.6 - 69.6 26.0 - 70.0 #10-20 Sand 23.0 - 26.0 1189.22 1189.74 33.2034 -111.9982
40osb BMW-07B 916199 12/28/2013 Sonic8.6256.0
115.0116.0
PVC / 4 / 0.020 85.0 - 115.0 80.0 - 116.0 #10-20 Sand 70.0 - 80.0 1189.20 1189.72 33.4868 -111.9982
40osb BMW-09C 922867 9/29/2019 Sonic 9.0 135.0 PVC / 4 / 0.020 95.0 - 130.0 93.0 - 130.0 #10-20 Sand 90.5 - 93.0 1170.54 1170.84 33.4823 -112.0069
40osb BMW-09D 921211 4/2/2018 Sonic8.25
6.125234.5288.0
PVC / 4 / 0.020 180.7 - 230.7 176.5 - 234 #10-20 Sand 170.5 - 176.5 1170.44 1170.77 33.4823 -112.0069
40osb BMW-10D 921212 4/25/2018 Sonic8.25
6.125233.0293.0
PVC / 4 / 0.020 230.6 - 280.6 227.5 - 280.6 #10-20 Sand 221.5 - 227.5 1148.63 1149.67 33.4765 -112.0339
40osb BMW-11D 921213 5/9/2018 Sonic8.25
6.125233.0241.0
PVC / 4 / 0.020 151.0 - 211.0 148.0 - 214.0 #10-20 Sand 140.0 - 148.0 1180.11 1180.61 33.4828 -111.9998
40osb BMW-14D 922019 10/31/2018 Sonic 9.0 300.0 PVC / 4 / 0.020 225.0 - 275.0 223.0 - 277.0 #10-20 Sand 221.0 - 223.0 1135.93 1136.31 33.4730 -112.023940osb BMW-16D 922021 4/19/2019 Sonic 9.0 290.0 PVC / 4 / 0.020 205.0 - 275.0 203.0 - 278.0 #10-20 Sand 198.3 - 203.0 1131.69 1132.28 33.3717 -112.026340osb BMW-17D 922346 8/27/2019 Sonic 9.0 267.0 PVC / 4 / 0.020 135.0 - 245.0 133.0 - 247.0 #10-20 Sand 130.0 - 133.0 1185.97 1186.37 33.4874 -112.002040osb BMW-18D 922865 9/13/2019 Sonic 9.0 274.0 PVC / 4 / 0.020 215.0 - 265.0 213.0 - 267.0 #10-20 Sand 210.0 - 213.0 1157.00 1157.33 33.4795 -112.015140osb BMW-19D 922866 8/27/2019 Sonic 9.0 267.0 PVC / 4 / 0.020 202.0-252.0 197.0 - 252.0 #10-20 Sand 194.0 - 197.0 1152.04 1152.44 33.3750 -112.118740osb BMW-20D 923910 3/24/2020 Sonic 9.0 247.0 PVC / 4 / 0.020 135.0 - 245.0 133.0 - 245.0 #10-20 Sand 125.0 - 133.0 1192.44 1192.76 33.4904 -112.002140osb BMW-21D 923912 4/1/2020 Sonic 9.0 233.0 PVC / 4 / 0.020 180.0 - 230.0 178.0 - 230.0 #10-20 Sand 170.0 - 178.0 1176.02 1176.35 33.4863 -112.007940osb BMW-22D 923911 4/9/2020 Sonic 9.0 235.0 PVC / 4 / 0.020 130.0 - 230.0 128.0 - 230.0 #10-20 Sand 117.0 - 128.0 1176.67 1176.97 33.4841 -112.0050NOTES:
* wells installed within the same borehole(1) NAVD88(2) GRID, NAD83, Arizona Central 20240osb East Cental Phoenix Water Quality Assurance Revolving Fund Site - 40th Street and Osborn Road SiteADWR Arizona Department of Water ResourcesFEET BGS feet below ground surfaceFEET AMSL feet above mean sea level NR Not ReportedSonic Rotosonic drilling methodSRP Salt River Project
DATE COMPLETED
ADWR REGISTRATION
NUMBER (55-)
WELL IDLOCATION COORDINATES (2)
TABLE 1WELL CONSTRUCTION DATA
FEASIBILITY STUDY REPORT - 40TH STREET AND OSBORN ROAD WATER QUALITY ASSURANCE REVOLVING FUND SITE
ECP SUB AREA
PERFORATED INTERNAL (FEET BGS)
CASING MATERIAL/ DIAMETER/ SLOT SIZE
(INCHES)
BORING DEPTH (FEET BGBS)
BORING DIAMETER (INCHES)
DRILLING METHODGROUND SURFACE
ELEVATION (1) (FEET ASML)
TOP OF CASING ELEVATION (1) (FEET ASML)
BENTONITE SEAL
(FEET BGS)
FILTER PACK MATERIAL
SAND PACK INTERVAL (FEET BGS)

Feasibility Study Report TABLE 2. OCTOBER 2020 -SEPTEMBER 2021 WATER LEVEL DATA, ECP 40th STREET AND OSBORN ROAD WQARF SITE
Well I.DADEQ
NumberADWR
Number Date
Measuring Point Elevation
(ft. AMSL)1
Depth to Groundwater
(ft. BMP)2
Groundwater Elevation
(ft. AMSL)1
Change Since Previous
(ft.) Comments10/15/2019 1193.20 39.93 1153.27 0.225/12/2020 1193.20 40.5 1152.70 -0.579/21/2020 1193.20 40.51 1152.69 -0.01
10/15/2019 1193.59 NM NM NM Inaccessible5/12/2020 1193.59 40.16 1153.43 NM9/21/2020 1193.59 40.21 1153.38 -0.05
10/15/2019 1199.66 40.90 1158.76 0.385/13/2020 1199.66 41.71 1157.95 -0.819/21/2020 1199.66 41.76 1157.90 -0.05
10/15/2019 1199.60 40.89 1158.71 0.365/13/2020 1199.60 41.67 1157.93 -0.789/21/2020 1199.60 41.75 1157.85 -0.08
10/15/2019 1199.53 40.27 1159.26 0.945/13/2020 1199.53 41.63 1157.90 -1.369/21/2020 1199.53 41.71 1157.82 -0.08
10/15/2019 1199.63 41.38 1158.25 0.225/13/2020 1199.63 42.05 1157.58 -0.679/21/2020 1199.63 42.10 1157.53 -0.05
10/15/2019 1201.09 39.10 1161.99 0.325/13/2020 1201.09 39.78 1161.31 -0.689/21/2020 1201.09 39.99 1161.10 -0.21
BMW-03A 71386 55-908744
BMW-02C 80535 55-817659
BMW-02E 81753 55-922509
BMW-02A 71384 55-908743
BMW-02B 71385 55-908743
BMW-01A 62104 55-598109
BMW-01B 77128 55-909970
40th OSB WQARF SitePhoenix, Arizona

Feasibility Study Report TABLE 2. OCTOBER 2020 -SEPTEMBER 2021 WATER LEVEL DATA, ECP 40th STREET AND OSBORN ROAD WQARF SITE
Well I.DADEQ
NumberADWR
Number Date
Measuring Point Elevation
(ft. AMSL)1
Depth to Groundwater
(ft. BMP)2
Groundwater Elevation
(ft. AMSL)1
Change Since Previous
(ft.) Comments10/15/2019 1201.12 39.10 1162.02 0.325/13/2020 1201.12 39.78 1161.34 -0.689/21/2020 1201.12 44.04 1157.08 -4.26 Anomalous reading
10/15/2019 1200.37 36.69 1163.68 NM5/13/2020 1200.37 37.26 1163.11 -0.579/21/2020 1200.37 37.45 1162.92 -0.19
10/15/2019 1200.32 36.62 1163.70 NM5/14/2020 1200.32 37.30 1163.02 -0.68 Vehicle over well 5/139/21/2020 1200.32 37.43 1162.89 -0.13
10/15/2019 1189.22 41.69 1147.53 0.025/13/2020 1189.22 42.21 1147.01 -0.529/21/2020 1189.22 42.22 1147.00 -0.01
10/15/2019 1189.20 41.63 1147.57 0.025/13/2020 1189.20 42.31 1146.89 -0.689/21/2020 1189.20 42.13 1147.07 0.18
10/15/2019 1170.54 51.03 1119.51 First Water Level5/13/2020 1170.54 52.41 1118.13 -1.389/21/2020 1170.54 52.41 1118.13 0.00
10/15/2019 1170.44 52.27 1118.17 -0.265/13/2020 1170.44 52.56 1117.88 -0.299/21/2020 1170.44 52.48 1117.96 0.08
10/15/2019 1149.25 76.16 1073.09 First Water Level5/13/2020 1149.25 76.42 1072.83 -0.269/21/2020 1149.25 76.23 1073.02 0.19
BMW-03B 71387 55-908744
BMW-04A 79627 55-916200
BMW-04B 79628 55-916201
BMW-07A 79643 55-916198
BMW-07B 79644 55-916199
BMW-09D 81660 55-921211
81748 55-922868
BMW-09C 81747 55-922867
BMW-10B
40th OSB WQARF SitePhoenix, Arizona

Feasibility Study Report TABLE 2. OCTOBER 2020 -SEPTEMBER 2021 WATER LEVEL DATA, ECP 40th STREET AND OSBORN ROAD WQARF SITE
Well I.DADEQ
NumberADWR
Number Date
Measuring Point Elevation
(ft. AMSL)1
Depth to Groundwater
(ft. BMP)2
Groundwater Elevation
(ft. AMSL)1
Change Since Previous
(ft.) Comments10/15/2019 1148.63 74.73 1073.90 0.245/13/2020 1148.63 74.68 1073.95 0.059/21/2020 1148.63 74.79 1073.84 -0.11
10/15/2019 1180.11 43.92 1136.19 -0.135/13/2020 1180.11 44.21 1135.90 -0.299/21/2020 1180.11 44.26 1135.85 -0.05
10/15/2019 1135.93 80.45 1055.48 0.165/13/2020 1135.93 79.94 1055.99 0.519/21/2020 1135.93 80.41 1055.52 -0.47
10/15/2019 1131.69 82.90 1048.79 0.055/13/2020 1131.69 82.25 1049.44 0.659/21/2020 1131.69 82.83 1048.86 -0.58
10/15/2019 1185.97 46.12 1139.85 First Water Level5/13/2020 1185.97 46.64 1139.33 -0.529/21/2020 1185.97 46.57 1139.40 0.07
10/15/2019 1157.00 69.34 1087.66 First Water Level5/13/2020 1157.00 69.48 1087.52 -0.149/21/2020 1157.00 69.41 1087.59 0.07
10/15/2019 1152.04 70.85 1081.19 First Water Level5/13/2020 1152.04 71.04 1081.00 -0.199/21/2020 1152.04 70.91 1081.13 0.135/13/2020 1192.44 49.02 1143.42 First Water Level9/21/2020 1192.44 48.86 1143.58 0.165/13/2020 1176.02 51.98 1124.04 First Water Level9/21/2020 1176.02 51.75 1124.27 0.23
BMW-14D 81663 55-922019
BMW-10D 81661 55-921212
BMW-11D 81662 55-921213
BMW-19D 81750 55-922866
BMW-17D 81746 55-922346
BMW-18D 81749 55-922865
BMW-16D 81754 55-922021
BMW-20D 81924 55-923910
BMW-21D 81925 55-923912
40th OSB WQARF SitePhoenix, Arizona

Feasibility Study Report TABLE 2. OCTOBER 2020 -SEPTEMBER 2021 WATER LEVEL DATA, ECP 40th STREET AND OSBORN ROAD WQARF SITE
Well I.DADEQ
NumberADWR
Number Date
Measuring Point Elevation
(ft. AMSL)1
Depth to Groundwater
(ft. BMP)2
Groundwater Elevation
(ft. AMSL)1
Change Since Previous
(ft.) Comments5/13/2020 1176.67 50.09 1126.58 First Water Level9/21/2020 1176.67 50.04 1126.63 0.05
10/15/2019 1156.75 68.59 1088.16 -0.115/13/2020 1156.75 NM NM NM Flooded w/bugs9/21/2020 1156.75 69.70 1087.05 NM
10/15/2019 1157.28 66.80 1090.48 0.185/13/2020 1157.28 67.18 1090.10 -0.389/21/2020 1157.28 67.00 1090.28 0.18
10/15/2019 1156.28 66.70 1089.58 0.175/13/2020 1156.28 67.08 1089.20 -0.389/21/2020 1156.28 66.83 1089.45 0.25
10/15/2019 1152.84 70.91 1081.93 0.265/13/2020 1152.84 71.14 1081.70 -0.239/21/2020 1152.84 71.05 1081.79 0.09
Notes:
1. Feet above mean sea level (ft AMSL)
2. Feet below measuring point (ft BMP)
NM - not measured.
* indicates monitoring well associated with Former Mobil Station #18KDP, 3141 East Thomas Road, Phoenix, Arizona, LUST file number 3004.
MW-7* 60962 55-583961
MW-8* 81755 55-205093
MW-9* 81756 55-205094
MW-10* 81757 55-205095
BMW-22D 81926 55-923911
40th OSB WQARF SitePhoenix, Arizona

Feasibility Study Report Table 3 PCE, TCE, c-1,2-DCE, and CHLOROFORM ANALYTICAL RESULTS, OCTOBER 2019 -SEPTEMBER 2020
ECP 40th STREET AND OSBORN ROAD WQARF SITE
MP Depth SampleElevation Sampled Elevation
Well Name (ft AMSL)1(ft BMP)2 (ft AMSL)3 Sample Date PCE TCE c-1,2-DCE Chloroform
5.0 5.0 5.0 10041 1152.20 10/16/2019 <2.0 <2.0 <2.0 4.5 Changed due to lower water level41 1152.20 9/24/2020 <0.50 <0.50 <0.50 5.1
NC NC NC 0.610/16/2019 <2.0 <2.0 <2.0 6.49/24/2020 <0.50 <0.50 <0.50 8.9
NC NC NC 2.510/16/2019 NS NS NS NS Inaccessible9/24/2020 <0.50 <0.50 <0.50 0.69
NC NC NC NC10/16/2019 NS NS NS NS Inaccessible9/24/2020 <0.50 <0.50 <0.50 0.9
NC NC NC NC10/16/2019 <2.0 <2.0 <2.0 <2.0
10/16/2019(D) <2.0 <2.0 <2.0 <2.09/24/2020 <0.50 <0.50 <0.50 <0.50
NC NC NC NC10/16/2019 <2.0 <2.0 <2.0 3.89/24/2020 <0.50 <0.50 <0.50 1.9
NC NC NC -1.910/16/2019 <2.0 <2.0 <2.0 3.09/24/2020 0.55 <0.50 <0.50 2.0
NC NC NC -1.010/16/2019 <2.0 <2.0 <2.0 3.99/24/2020 <0.50 <0.50 <0.50 1.8
NC NC NC -2.110/16/2019 24 <2.0 <2.0 <2.09/24/2020 15 <0.50 <0.50 <0.50
9/24/2020(D) 22 <0.50 <0.50 <0.50-9 NC NC NC
10/16/2019 19 <2.0 <2.0 <2.09/24/2020 9.6 <0.50 <0.50 0.89
-9.4 NC NC NC10/16/2019 15 <2.0 <2.0 <2.09/24/2020 9.5 <0.50 <0.50 0.89
-5.5 NC NC NC10/16/2019 11 <2.0 <2.0 <2.09/24/2020 9.6 <0.50 <0.50 1.2
-1.4 NC NC NC10/16/2019 15 <2.0 <2.0 <2.09/24/2020 8.4 <0.50 <0.50 1.2
-6.6 NC NC NC
Comments/Other VOCs detected7
1108.90
∆ Last
∆ Last
∆ Last
∆ Last
57.4
90.7
96.8 1102.80
1087.03
1081.03
1075.03
1069.03
124.5
∆ Last
1199.53
Results4-6
∆ Last
∆ Last
∆ Last
∆ Last
136.5
Aquifer Water Quality Standard
BMW-02A
84.7
BMW-02B
∆ Last
1199.60
1114.90
BMW-02C
112.5
118.5
130.5
∆ Last
∆ Last
∆ Last
1063.03
BMW-01A 1193.20
1199.66
1193.59
72.5 1121.09
96.3 1097.29
1142.26
57.3 1135.90
BMW-01B
40th OSB WQARF SitePhoenix, AZ

Feasibility Study Report Table 3 PCE, TCE, c-1,2-DCE, and CHLOROFORM ANALYTICAL RESULTS, OCTOBER 2019 -SEPTEMBER 2020
ECP 40th STREET AND OSBORN ROAD WQARF SITE
MP Depth SampleElevation Sampled Elevation
Well Name (ft AMSL)1(ft BMP)2 (ft AMSL)3 Sample Date PCE TCE c-1,2-DCE Chloroform
5.0 5.0 5.0 100
Comments/Other VOCs detected7Results4-6
Aquifer Water Quality Standard 10/16/2019 120 2.0 <2.0 <2.09/24/2020 100 1.9 <2.0 0.57
-20 -0.1 NC NC10/16/2019 100 <2.0 <2.0 <2.09/24/2020 51 0.72 <0.50 0.54
-49 NC NC NC10/16/2019 89 <2.0 <2.0 <2.09/24/2020 51 0.89 <0.50 <0.50
-38 NC NC NC10/16/2019 93 <2.0 <2.0 <2.09/24/2020 55 0.84 <0.50 0.50
-38 NC NC NC10/16/2019 100 <2.0 <2.0 <2.09/24/2020 52 0.94 <0.50 <0.50
-48 NC NC NC10/16/2019 120 <2.0 <2.0 <2.09/24/2020 54 0.98 <0.50 <0.50
9/24/2020(D) 45 0.95 <0.50 <0.50-66 NC NC NC
8/24/2016 <1.0 <1.0 <1.0 <1.012/4/2018 <2.0 <2.0 <2.0 <2.0
10/16/2019 <2.0 <2.0 <2.0 <2.010/16/2019(D) <2.0 <2.0 <2.0 <2.0
9/24/2020 <0.50 <0.50 <0.50 <0.50NC NC NC NC
10/16/2019 <2.0 <2.0 <2.0 <2.09/24/2020 0.87 <0.50 <0.50 <0.50
NC NC NC NC35.5 1164.87 8/24/2016 <1.0 <1.0 <1.0 <1.0
12/4/2018 <2.0 <2.0 <2.0 <2.0 Changed due to lower water level10/16/2019 <2.0 <2.0 <2.0 <2.0
45 1155.37 9/24/2020 <0.50 <0.50 <0.50 <0.50 Changed due to lower water levelNC NC NC NC
10/16/2019 <2.0 <2.0 <2.0 <2.0NC NC NC NC
10/16/2019 <2.0 <2.0 <2.0 <2.010/16/2019(D) <2.0 <2.0 <2.0 <2.0
9/24/2020 <0.50 <0.50 <0.50 <0.50NC NC NC NC
BMW-03A
BMW-03B
BMW-04A
1201.09
∆ Last
∆ Last51.4
67.2
1200.37
1201.121105.62
1133.17
BMW-02E
∆ Last
∆ Last
∆ Last
160.0
1199.63
959.63
939.63
200.0
240.0
260.0
999.63
979.63
∆ Last
∆ Last
220.0
∆ Last
∆ Last
58
36.5 1163.87
1039.63
1019.63
∆ Last
95.5
1143.09
1148.97
∆ Last
180.0
40th OSB WQARF SitePhoenix, AZ

Feasibility Study Report Table 3 PCE, TCE, c-1,2-DCE, and CHLOROFORM ANALYTICAL RESULTS, OCTOBER 2019 -SEPTEMBER 2020
ECP 40th STREET AND OSBORN ROAD WQARF SITE
MP Depth SampleElevation Sampled Elevation
Well Name (ft AMSL)1(ft BMP)2 (ft AMSL)3 Sample Date PCE TCE c-1,2-DCE Chloroform
5.0 5.0 5.0 100
Comments/Other VOCs detected7Results4-6
Aquifer Water Quality Standard 10/16/2019 <2.0 <2.0 <2.0 <2.09/24/2020 <0.50 <0.50 <0.50 <0.50
NC NC NC NC10/16/2019 <2.0 <2.0 <2.0 <2.0 MTBE (94) -1.1 µg/L9/24/2020 <0.50 <0.50 <0.50 <0.50 MTBE (94) -1.4µg/L
NC NC NC NC10/16/2019 <2.0 <2.0 <2.0 <2.0 MTBE (94) -1.2 µg/L9/24/2020 <0.50 <0.50 <0.50 <0.50 MTBE (94) -1.4 µg/L
NC NC NC NC42.5 1171.77 10/16/2019 <2.0 <2.0 <2.0 <2.0 Changed due to lower water level43 1171.27 9/24/2020 <0.50 <0.50 <0.50 <0.50 Changed due to lower water level
NC NC NC NC10/16/2019 <2.0 <2.0 <2.0 <2.09/24/2020 0.70 <0.50 <0.50 0.72
NC NC NC NC10/16/2019 <2.0 <2.0 <2.0 <2.09/24/2020 0.76 <0.50 <0.50 0.67
NC NC NC NC10/16/2019 3.4 <2.0 <2.0 <2.09/25/2020 2.6 <0.50 <0.50 0.75
-0.8 NC NC NC10/16/2019 3.2 <2.0 <2.0 <2.09/25/2020 3.5 <0.50 <0.50 1.1
0.3 NC NC NC10/16/2019 11 <2.0 <2.0 <2.09/25/2020 21 <0.50 <0.50 <0.50
10 NC NC NC10/16/2019 14 <2.0 <2.0 <2.09/25/2020 16 <0.50 <0.50 <0.50
9/25/2020 (D) 19 <0.50 <0.50 <0.502 NC NC NC
12/4/2018 19 <2.0 <2.0 <2.010/16/2019 8.4 <2.0 <2.0 <2.0
10/16/2019 (D) 12 <2.0 <2.0 <2.09/25/2020 17 <0.50 <0.50 <0.50
8.6 NC NC NC
BMW-04B
BMW-09C
BMW-09D
185
205
225
∆ Last
∆ Last
∆ Last
1127.00
1103.00
∆ Last
1170.44
1170.44
985.44
965.44
81.2
∆ Last
87.5
BMW-07A
BMW-07B
100
98.3
1214.50
∆ Last
∆ Last
∆ Last
111.5
115.4
1200.32
1119.12
1102.02
1084.92
∆ Last
∆ Last
120 1050.44
∆ Last
1214.27
945.44
1070.44
40th OSB WQARF SitePhoenix, AZ

Feasibility Study Report Table 3 PCE, TCE, c-1,2-DCE, and CHLOROFORM ANALYTICAL RESULTS, OCTOBER 2019 -SEPTEMBER 2020
ECP 40th STREET AND OSBORN ROAD WQARF SITE
MP Depth SampleElevation Sampled Elevation
Well Name (ft AMSL)1(ft BMP)2 (ft AMSL)3 Sample Date PCE TCE c-1,2-DCE Chloroform
5.0 5.0 5.0 100
Comments/Other VOCs detected7Results4-6
Aquifer Water Quality Standard 10/16/2019 2.0 <2.0 <2.0 <2.09/25/2020 5.1 <0.50 <0.50 <0.50
3.1 NC NC NC10/16/2019 3.0 <2.0 <2.0 <2.09/25/2020 4.4 <0.50 <0.50 <0.50
1.4 NC NC NC10/16/2019 4.6 <2.0 <2.0 <2.09/25/2020 4.9 <0.50 <0.50 <0.50
0.3 NC NC NC10/16/2019 2.3 <2.0 <2.0 <2.09/24/2020 1.9 0.68 <0.50 <0.50
-0.4 NC NC NC10/16/2019 2.0 <2.0 <2.0 <2.09/24/2020 2.3 0.50 <0.50 <0.50
0.3 NC NC NC10/16/2019 <2.0 <2.0 <2.0 <2.09/24/2020 1.7 0.50 <0.50 <0.50
NC NC NC NC10/15/2019 5.9 <2.0 <2.0 <2.09/25/2020 1.3 <0.50 <0.50 1.3 Toluene (1000)-0.95 µg/L
-4.6 NC NC NC10/15/2019 <2.0 <2.0 <2.0 <2.09/25/2020 1.5 <0.50 <0.50 1.4 Toluene (1000)-1.2 µg/L
NC NC NC NC10/15/2019 <2.0 <2.0 <2.0 <2.09/25/2020 7.4 <0.50 <0.50 0.76
NC NC NC NC10/15/2019 5.1 <2.0 <2.0 <2.09/25/2020 12 <0.50 <0.50 0.51
6.9 NC NC NC10/15/2019 10 <2.0 <2.0 <2.09/25/2020 11 <0.50 <0.50 <0.509/25/20 (D) 12 <0.50 <0.50 0.50
1 NC NC NC10/15/2019 8.3 <2.0 <2.0 <2.09/25/2020 13 <0.50 <0.50 0.53
4.7 NC NC NC10/15/2019 4.0 <2.0 <2.0 <2.09/25/2020 13 <0.50 <0.50 <0.50
9.0 NC NC NC
BMW-14D
225
265
∆ Last
∆ Last
BMW-10D
∆ Last
∆ Last
235
910.93
∆ Last
176
156
∆ Last
BMW-11D
∆ Last
196
873.63
∆ Last
255
275
1180.11
1024.11
1004.11
984.11
1148.63
913.63
893.63
890.93
870.93
1135.93
1131.69
923.69
903.69
886.69
866.69
208
228
∆ Last
245
245
BMW-16D
265
∆ Last
∆ Last
∆ Last
∆ Last
40th OSB WQARF SitePhoenix, AZ

Feasibility Study Report Table 3 PCE, TCE, c-1,2-DCE, and CHLOROFORM ANALYTICAL RESULTS, OCTOBER 2019 -SEPTEMBER 2020
ECP 40th STREET AND OSBORN ROAD WQARF SITE
MP Depth SampleElevation Sampled Elevation
Well Name (ft AMSL)1(ft BMP)2 (ft AMSL)3 Sample Date PCE TCE c-1,2-DCE Chloroform
5.0 5.0 5.0 100
Comments/Other VOCs detected7Results4-6
Aquifer Water Quality Standard 10/16/2019 120 2.1 <2.0 <2.09/24/2020 130 2.4 <0.50 <0.50
10.0 0.3 NC NC10/16/2019 110 <2.0 <2.0 <2.09/24/2020 120 2.2 <0.50 <0.50
10.0 NC NC NC10/16/2019 110 2.0 <2.0 <2.09/24/2020 91 1.8 <0.50 <0.50
9/24/2020 (D) 110 1.9 <0.50 <0.50-19.0 NC NC NC
10/16/2019 100 <2.0 <2.0 <2.09/24/2020 76 1.6 <0.50 <0.50
-24.0 NC NC NC10/16/2019 81 <2.0 <2.0 <2.09/24/2020 75 1.9 <0.50 <0.50
-6.0 NC NC NC10/16/2019 4.8 <2.0 <2.0 <2.0 CDS (NE)-7.3 µg/L, Toluene (1000)-42 µg/L9/25/2020 16 <0.50 <0.50 0.54 Toluene (1000)-6.3 µg/L
11.2 NC NC NC10/16/2019 5.3 <2.0 <2.0 <2.0 CDS (NE)-6.6 µg/L, Toluene (1000)-37 µg/L
10/16/2019 (D) 8.8 <2.0 <2.0 <2.0 Toluene (1000)-9.4 µg/L9/25/2020 5.7 <0.50 <0.50 <0.50 Toluene (1000)-20 µg/L, MTBE (94)-1.5 µg/L, acetone (NE)-33 µg/L
9/25/2020 (D) 9.7 <0.50 <0.50 <0.50 Toluene (1000)-13 µg/L, MTBE (94)-0.56 µg/L0.4 NC NC NC
10/16/2019 3.9 <2.0 <2.0 <2.0 CDS (NE)-8.8 µg/L, Toluene (1000)-39 µg/L9/25/2020 5.1 <0.50 <0.50 <0.50 Toluene (1000)-21 µg/L, MTBE (94)-1.0 µg/L, acetone (NE)-15 µg/L
1.2 NC NC NC10/15/2019 <2.0 <2.0 <2.0 <2.0 CDS (NE)-6.8 µg/L, Toluene (1000)-23 µg/L9/25/2020 4.0 <0.50 <0.50 <0.50
NC NC NC NC10/15/2019 2.6 <2.0 <2.0 <2.0 Toluene (1000)-12 µg/L9/25/2020 5.1 <0.50 <0.50 <0.50
2.5 NC NC NC10/15/2019 <2.0 <2.0 <2.0 <2.0 CDS (NE)-9.0 µg/L, Toluene (1000)-28 µg/L9/25/2020 3.4 <0.50 <0.50 <0.50
NC NC NC NC
BMW-18D 1158.00
∆ Last
220 938.00
∆ Last
240 918.00
∆ Last
260 898.00
∆ Last
205 948.00
∆ Last
225 928.00
245 908.00
∆ Last
BMW-17D
BMW-19D 1153.00
1190.00
∆ Last
180 1010.00
210 980.00
∆ Last
235 955.00
∆ Last
140 1050.00
∆ Last
160 1030.00
∆ Last
40th OSB WQARF SitePhoenix, AZ

Feasibility Study Report Table 3 PCE, TCE, c-1,2-DCE, and CHLOROFORM ANALYTICAL RESULTS, OCTOBER 2019 -SEPTEMBER 2020
ECP 40th STREET AND OSBORN ROAD WQARF SITE
MP Depth SampleElevation Sampled Elevation
Well Name (ft AMSL)1(ft BMP)2 (ft AMSL)3 Sample Date PCE TCE c-1,2-DCE Chloroform
5.0 5.0 5.0 100
Comments/Other VOCs detected7Results4-6
Aquifer Water Quality Standard 5/15/2020 <2.0 <2.0 <2.0 <2.0 1,2,4-TMB (NE) - 2.8 µg/L, CDS (NE) - 6.4 µg/L, Toluene (1000) - 6.3 µg/L9/24/2020 <0.50 <0.50 <0.50 0.81 Toluene (1000) - 0.73 µg/L
NC NC NC NC5/15/2020 <2.0 <2.0 <2.0 <2.09/24/2020 <0.50 <0.50 <0.50 0.91
NC NC NC NC5/15/2020 <2.0 <2.0 <2.0 <2.09/24/2020 <0.50 <0.50 <0.50 0.81
NC NC NC NC5/15/2020 <2.0 <2.0 <2.0 <2.09/24/2020 <0.50 <0.50 <0.50 1.1
NC NC NC NC5/15/2020 <2.0 <2.0 <2.0 <2.09/24/2020 <0.50 <0.50 <0.50 <0.50 1,2,4-TMB (NE) - 0.75 µg/L, Toluene (1000) - 2.3 µg/L, Xylene (10,000) - 2.2 µg/L
NC NC NC NC5/15/2020 <2.0 <2.0 <2.0 <2.0 MTBE (94) - 2.7 µg/L9/25/2020 <0.50 <0.50 <0.50 0.65 MTBE (94) - 1.3 µg/L
NC NC NC NC5/15/2020 <2.0 <2.0 <2.0 <2.0 MTBE (94) - 2.5 µg/L9/25/2020 <0.50 <0.50 <0.50 0.85
NC NC NC NC5/15/2020 <2.0 <2.0 <2.0 <2.0 MTBE (94) - 2.4 µg/L9/25/2020 <0.50 <0.50 <0.50 0.53 MTBE (94) - 1.9 µg/L
NC NC NC NC
180 1012.44
∆ Last
∆ Last
210 982.44
∆ Last
230 962.44
190 986.02
BMW-21D 1176.02∆ Last
210 966.02
∆ Last
225 951.02
BMW-20D 1192.44
∆ Last
140 1052.44
∆ Last
160 1032.44
∆ Last
40th OSB WQARF SitePhoenix, AZ

Feasibility Study Report Table 3 PCE, TCE, c-1,2-DCE, and CHLOROFORM ANALYTICAL RESULTS, OCTOBER 2019 -SEPTEMBER 2020
ECP 40th STREET AND OSBORN ROAD WQARF SITE
MP Depth SampleElevation Sampled Elevation
Well Name (ft AMSL)1(ft BMP)2 (ft AMSL)3 Sample Date PCE TCE c-1,2-DCE Chloroform
5.0 5.0 5.0 100
Comments/Other VOCs detected7Results4-6
Aquifer Water Quality Standard 5/15/2020 98 4.8 <2.0 <2.0
5/15/2020 (D) 110 5.2 <2.0 <2.09/24/2020 50 3.1 <0.50 <0.50
9/24/2020 (D) 66 3.4 <0.50 0.65-48.0 -1.7 NC NC
160 1016.67 9/24/2020 92 4.2 <0.50 0.665/15/2020 110 5.0 <2.0 <2.09/24/2020 64 3.3 <0.50 0.61
-46.0 -1.7 NC NC5/15/2020 94 4.7 <2.0 <2.09/24/2020 88 4.2 <0.50 0.66
-6.0 -0.5 NC NC5/15/2020 52 3.3 <2.0 <2.09/24/2020 33 2.3 <0.50 0.51
-19.0 -1.0 NC NC
Notes:
7. The AWQS or remedial goal for other detected VOCs are shown in ().
BMW-22D 1176.67
∆ Last
132 1044.67
∆ Last
180 996.67
∆ Last
210 966.67
4. Volatile organic compound (VOC) concentrations reported in micrograms per liter (ug/L). DCE - dichloroethene, PCE -tetrachloroethene, TCE - trichloroethene, 1,2,4-TMB - 1,2,4-trimethylbenzene, CDS - carbon disulfide, MTBE - methyl-
* micropurge sample analyzed by non-compliance screening method. NA - not analyzed.
1. Measuring point (MP) elevation in feet above mean sea level (ft AMSL) 2. Sample Depth - feet below MP (ft BMP)3. Sample elevation in feet above mean sea level (ft AMSL)
5. (D) denotes duplicate result 6. ∆ denotes change since last and baseline sampling events for ISCO treatment zone wells. NC denotes no change.
∆ Last
225 951.67
40th OSB WQARF SitePhoenix, AZ

Table 4. Summary of Remedial Technology Screening and Retainage 40th Street and Osborn Road WQARF Site
Technology Media Comments Retained? MNA Groundwater Typically used when source has been
controlled, geochemical parameters are suitable, and plume is stable or shrinking. With the exception of biodegradation indicators, these components are present.
Yes
ERD Groundwater
Effective where in situ conditions can be manipulated to create reducing conditions and appropriate bacteria exist or can be introduced into groundwater.
No
Injected LGAC Groundwater
Effective as a source control and controlled migration technology. Requires multiple injection points. Is not practicable in a residential setting.
No
ISCO Groundwater
Effective as a source control and controlled migration technology. Requires multiple injection points. Is not be practicable in a residential setting.
No
ISCR Groundwater
Effective when groundwater flow can be directed through a treatment zone that is within depths of typical excavation/drilling equipment and structures or infrastructure do not interfere with implementation.
No
GWET Groundwater Typically used for plume control rather than mass removal due to expense associated with long-term operations.
Yes

Table 5. Groundwater Monitoring Program
40th Street & Osborn Road WQARF Site. Wells Used for Water Level Measurements
BMW-01B, BMW-02B, BMW-02C, BMW-03B, BMW-04B, BMW-05B, BMW-06B, BMW-07B, BMW-09C, BMW-09D, BMW-10D, BMW-11D, BMW-14D, BMW-16D, BMW-17D, BMW-19D, BMW-20D, BMW-21D, and BMW-22D
Wells Used for Sampling and Sample Depths
Well Identification
Screened Interval (ft bgs)
Sample ID S1 S2 S3 S4 S5 S6
Sample Depths (ft bgs)(A) BMW-01A 20-60 41 57.3 BMW-01B 70-100 72.5 96.3 BMW-02A 20-60 57.4 BMW-02B 70-100 84.7 90.7 96.8 BMW-02C 109.5-139.5 112.5 118.5 124.5 130.5 136.5 BMW-02E 155-265 160 180 200 220 240 260 BMW-03A 20-60 58 BMW-03B 70-100 95.5 BMW-04A 30-70 45 67.2 BMW-04B 78.8-118.8 81.2 98.3 115.4 BMW-07A 29.6-69.6 43 BMW-07B 85-115 87.5 111.5 BMW-09C 95-130 100 120 BMW-09D 180-230 185 205 225 BMW-10D 230-280 235 255 275 BMW-11D 151-211 156 176 196 BMW-14D 225-227 225 245 265 BMW-16D 205-275 208 228 245 265 BMW-17D 155-265 140 160 180 210 235 BMW-18D 235-285 220 240 260 BMW-19D 235-285 240 260 280 BMW-20D 135-245 140 160 180 210 230 BMW-21D 180-230 190 210 225 BMW-22D 130-230 132 160 180 210 225
Total 24 20 15 6 5 1 (A) Sample depths are from shallow to deeper ft bgs – feet below ground surface

Feasibility Short/Long Term Effectiveness Reliability Total Cost (-30%) (+50%)
ReferenceRemedy
SRP Well GWET System plus Contingency Grand
Canal GWET System. Grand Canal GWET system
installed within first 7 years of remedy.
Yes
GWET using a combination of wellhead treatment at the SRP well and the
contingency Grand Canal system is a well documented remedy for PCE plumes.
Considering the dimensions of the plume, it is the most feasible remedy.
Score = 5
OU-1 - GWET using a combination of wellhead treatment at the SRP well and the contingency Grand Canal system is
expected to be effective in the short term and long term.
Score = 5
The remedial measures are known and reliable
remediation technologies. Score = 5
The Reference Remedy is protective, in that it will decrease PCE concentrations to below cleanup
goals and continues to monitor and evaluate Site contamination through the collection of data.
Score = 5
The overall benefit is that SRP Well 17.9E-7.5N is returned to service and a
groundwater resource is returned to use. Remedy is expected to contain further
downgradient migration of the PCE plume. Flexible schedule for installation of the
Grand Canal system between Years 1-7 of the remedy provides a funding benefit to
ADEQ Score = 5
Likely. $7,031,000 $151,000 $7,182,000 $5,369,000 $11,474,000 5 30
More AggressiveRemedy
SRP Well GWET System plus Grand Canal GWET
System. Grand Canal GWET system installed Year 2 of
remedy.
Yes
GWET using a combination of wellhead treatment at the SRP well and the
contingency Grand Canal system is a well documented remedy for PCE plumes.
Considering the dimensions of the plume, it is the most feasible remedy.
Score = 5
OU-1 - GWET using a combination of wellhead treatment at the SRP well and the Grand Canal system is expected to be effective in the short term and long
term. Score = 5
The remedial measures are known and reliable
remediation technologies. Score = 5
The More Aggressive Remedy is protective, in that it will decrease PCE concentrations to below cleanup goals and continues to monitor and
evaluate Site contamination through the collection of data. Score = 5
The overall benefit is that SRP Well 17.9E-7.5N is returned to service and a
groundwater resource is returned to use. Remedy is expected to contain further
downgradient migration of the PCE plume. Score = 5
Likely. $5,931,000 $151,000 $6,082,000 $4,241,000 $9,075,000 5 30
Less AggressiveRemedy
Semiannual Monitoring of Groundwater Well Network
for Up to 250 YearsYes
Monitoring is very feasible as groundwater monitoring is currently conducted at the site.
Monitoring of the current well network is feasible
considering the current conditions of the plume.
Score = 5
Monitoring is a known and effective remedy given the condition of the plume; semiannual monitoring will
assess effectiveness. Considered a long-term remedy for the Site without implementation of contingency, which
results in the Reference Remedy. Score = 1
Monitoring is a known and reliable remediation
technology. Score = 5
The Less Aggressive Remedy is protective, in that it continues to monitor and evaluate
Site contamination through the collection of data. However, PCE plume is estimated to migrate downgradient within the term of the remedy
without contingency. Implementation of contingency results in the Reference Remedy.
Score = 1
Under the current conditions, provides less benefit than the Reference or More
Aggressive Alternative Remedies for the Site because it will take the longest period of time to remediate groundwater impacts. Plume also migrates downgradient without
implementation of contingency. Implementation of the contingency results in
the Reference Remedy. Score = 1
Moderately unlikely
>$12,054,000 (cost capped at 65 years due to total cost exceeds maximum
[+50%] cost for Reference Remedy
Contingency results in Reference Remedy, costs
not included.>$12,054,000 >$8,439,000 >$18,081,000 1 13
Abbreviations:WQARF = Water Quality Assurance Revolving Fund ISCO - In-situ Chemical OxidationGWET - Groundwater Extraction and Treatment O&M - Operation and MaintenancePCE = TetrachloroetheneO&M = operations and maintenance % = percent $ = United States dollarsScoring:Scores ranged from zero to five, with five indicating the most relative benefit and zero indicating the least relative or no benefit.Notes:Costs are rounded off to the nearest thousandCosts are based on 2020 dollar valuesCosts for O&M and contingencies include an assumed 3% annual escalation
Total Score Cost Score
Table 6 - Remedy EvaluationFeasibility Study Report
40th Street and Osborn Road WQARF SitePhoenix, Arizona
Estimated Cost (w/o Contingency)
Estimated Contingency Costs
Total Remedy Estimated Cost Including Contingency
Benefits Regulatory/PublicAcceptance
RemedialAlternative Groundwater
Will Alternative MeetRemedial
Objectives?
PracticabilityProtectiveness
(Risk)

Figures

!B
!B
!B
"/
"/
"/
"/
!A!A!A!A!A
!A
!A!A!A
!A!A
!A!A
!A
!A!A
!A!A
!A!A
!A!A
!A!A!A
!A!A
!A!A
!A
!A
!A
!A!A
!A
!A
!A !A
!A
!A
!A
!A
!A
!A
!A
!A
!A
!A
!A
!A
!A
!A!A!A
BMW-01ABMW-01B
40th St and Osborn RdWQARF Site
48th St and Indian School RdWQARF Site
BMW-19D
MW-7BMW-18D
BMW-17D
SMW-19A/B SMW-18
SMW-17
BMW-20D
BMW-21D
BMW-22D
SMW-02
SMW-07
SMW-05
SMW-03-60SMW-03-138
SMW-06SMW-11
SMW-12BMW-06ABMW-06B
BMW-05ABMW-05B
BMW-04ABMW-04B
BMW-2ABMW-2BBMW-2CBMW-2E
BMW-07ABMW-07B
BMW-11DBMW-09CBMW-09D
BMW-10BBMW-10D
BMW-14D
BMW-12BBMW-3ABMW-3B
SMW-04
SMW-08ECP-01
SMW-01ECP-02ECP-03
SRP19 E-8.1N
SRP19 E-7.6N
SRP18.6 E-7.6N
SRP17.9 E-7.5NBMW-08D
BMW-15D
SMW-14B
MW-1
MW-9
MW-8
MW-10
BMW-16D
Legend!A Groundwater Monitoring Well
"/ SRP Production Well
!B Boring Location - Abandoned
Path
: X:\P
roje
cts\
20-L
ongt
erm
Pro
ject
s\40
th S
t and
Osb
orn
and
48th
St a
nd In
dian
Sch
ool\M
XD
\40t
h St
reet
and
Osb
orn
Roa
d\Fe
asib
ility
Stu
dy R
epor
t\202
0_Q
3\Fi
gure
1_S
iteM
ap.m
xd
Area of Detail
0 1,500750
Feet ±
Site Map
Feasibility Study ReportECP 40th St & Osborn Rd WQARF Site
Phoenix, Arizona
The map shown here has been created with all due and reasonable care and is strictly for use withWood Environment & Infrastructure Solutions, Inc. Project Number 14-2020-2037. This map has not
been certified by a licensed land surveyor, and any third party use of this map comes without warranties ofany kind. Wood Environment & Infrastructure Solutions, Inc. assumes no liability, direct or indirect,
whatsoever for any such third party or unintended use.
14-2020-2037JC11/18/20201"= 1500'
Job No.PM:Date:Scale:
FIGURE1
Area of Detail
Notes:BMW-14D Groundwater Monitoring Well Identification
SRP Salt River ProjectWQARF Water Quality Assurance Revolving Fund

!B
!B
!B
"/
!A!A
!A!A
!A
!A!A
!A
!A
!A
!A
!A
!A
!A
!A
!A
!A
!A
!A
40th St and Osborn Rd
WQARF Site
48th St and Indian School Rd
WQARF Site
100
505
SRP17.9 E-7.5N
Legend!A Groundwater Monitoring Well
"/ SRP Production Well
!B Boring Location - Abandoned
Approximate Distribution of PCE (Dash Where Inferred)
Above 100 µg/L
Above 50 µg/L
Above 5 µg/L
Area of Detail
Site PCE Plume Map
Feasibility Study ReportECP 40th St & Osborn Rd WQARF Site
Phoenix, Arizona
The map shown here has been created with all due and reasonable care and is strictly for use withWood Environment & Infrastructure Solutions, Inc. Project Number 14-2020-2037. This map has not
been certified by a licensed land surveyor, and any third party use of this map comes without warranties ofany kind. Wood Environment & Infrastructure Solutions, Inc. assumes no liability, direct or indirect,
whatsoever for any such third party or unintended use.
14-2020-2037JC10/29/20201"= 1300'
Job No.PM:Date:Scale:
FIGURE2
Area of Detail
Notes:BMW-14D Groundwater Monitoring Well Identification
1.53 Results that are black are vertical profile sample results 1.3 Results that are blue are from September 2020 7.4 Results that are bolded and italicized exceed
the Aquifer Water Quality Standard of 5 µg/L16/19(D) Duplicate sample
µg/L Microgram per literft Feet
amsl Above Mean Sea Levelbgs Below Ground SurfacePCE Tetrachloroethene
WQARF Water Quality Assurance Revolving Fund
±0 1,300650
Feet
Pat
h: X
:\Pro
ject
s\20
-Lon
gter
m P
roje
cts\
40th
St a
nd O
sbor
n an
d 48
th S
t and
Indi
an S
choo
l\MX
D\4
0th
Stre
et a
nd O
sbor
n R
oad\
Gro
undw
ater
Mon
itorin
g Te
chni
cal M
emo\
2020
_Fal
l\Fig
ure2
_PC
EP
lum
eMap
.mxd
PCE (µg/L) Depth (� bgs)<0.5 17612 208
11/12(D) 22813 24513 265
BMW-16D
PCE (µg/L) Depth (� bgs)1 145
0.6 1651.53 185<0.25 2051.3 2251.5 2457.4 265
<0.25 285
BMW-14D
PCE (µg/L) Depth (� bgs)<0.25 133
0.6 1531.41 165<0.25 173<0.25 1931.49 2135.1 2354.4 2554.9 275
BMW-10D
PCE (µg/L) Depth (� bgs)1.4 1201.0 140
<1.0 1605.6 1804.8 20016 2209.7 2405.1 260
BMW-18D
PCE (µg/L) Depth (� bgs)<1.0 802.6 1003.5 120
PCE (µg/L) Depth (� bgs)0.35 142
12.66 16221 185
16/19(D) 20517 2254.3 2429.0 2612.15 281
BMW-09C
BMW-09D
BMW-15DAll samples collected from 42 to 215 � bgs were <0.25
µg/L for PCE
PCE (µg/L) Depth (� bgs)7.36 85<0.25 1052.66 1351.75 155<0.25 175<0.25 195<0.25 2140.74 240<0.25 255
SMW-14B
PCE (µg/L) Depth (� bgs)<1.0 68<1.0 88<1.0 108<1.0 128<1.0 150<1.0 170
<0.50 190<0.50 210<0.50 225<1.0 233
BMW-21D
PCE (µg/L) Depth (� bgs)<0.50 84.70.55 90.7<0.50 96.8
PCE (µg/L) Depth (� bgs)15/22(D) 112.5
9.6 118.59.5 124.59.6 130.58.4 136.5
PCE (µg/L) Depth (� bgs)100 16051 18051 20055 22052 240
54/45(D) 260
BMW-02E
BMW-02C
BMW-02B
PCE (µg/L) Depth (� bgs)<1.0 757.7 9532 115
50/66(D) 13292 16064 18088 21033 2251.3 235
BMW-22D
PCE (µg/L) Depth (� bgs)<0.25 123
1.9 1562.3 1761.7 196
<0.25 203<0.25 223
BMW-11D
PCE (µg/L) Depth (� bgs)<1.0 74<1.0 94<1.0 120
<0.50 140<0.50 160<0.50 180<0.50 210<0.50 230<1.0 234
BMW-20DPCE (µg/L) Depth (� bgs)
11 1203.2 141
46.2 160
BMW-08D
PCE (µg/L) Depth (� bgs)0.70 87.50.76 111.5
BMW-07B
PCE (µg/L) Depth (� bgs)<0.50 81.2<0.50 98.3<0.50 115.4
BMW-04B
PCE (µg/L) Depth (� bgs)0.87 95.5
BMW-03B
PCE (µg/L) Depth (� bgs)14 114130 140120 160
91/110(D) 18076 21075 2352.5 254
BMW-17D
PCE (µg/L) Depth (� bgs)<0.50 72.5<0.50 96.3
BMW-01B
PCE (µg/L) Depth (� bgs)<1.0 1203.2 140
<1.0 1604.6 1802.1 2004.0 2055.1 2253.4 245
BMW-19D

?
?
?
??
?? ?
????????
??
??
EAST OAK STREETN
OR
TH 3
6th
ST.
EAST THOMAS RD.N
OR
TH 3
2nd
ST.
NO
RTH
44t
h S
T.
NO
RTH
40t
h S
T.
GRAND CANAL
EAST INDIAN SCHOOL RD.N
OR
TH 2
4th
ST.
A'
A
EAST OSBORN RD.
FEETHORIZONTAL
SCALE
VE
RTIC
AL S
CA
LE
? ?
RE
VIS
ION
S:
PROJECT NO.
DRAWING NAME
PR
OJE
CT:
PH
ON
E:
4600
E. W
AS
HIN
GTO
N S
TRE
ET,
SU
ITE
600
PH
OE
NIX
, AR
IZO
NA
850
34P
HO
NE
: 6
02-7
33-6
000
FAX
:
6
02-7
33-6
100
Env
ironm
ent &
Infra
stru
ctur
e S
olut
ions
, Inc
.
SHEET NO.
DESIGNED BY:DRAWN BY:CHECKED BY:
14-2020-2037
40th
Stre
et a
nd O
sbor
n R
oad
WQ
AR
F S
ite P
hoen
ix, A
rizon
a
Cro
ss -
Sec
tion
A-A
'Fe
asib
ility
Stu
dy R
epor
t
3

? ?
EAST OAK STREETN
OR
TH 3
6th
ST.
EAST THOMAS RD.N
OR
TH 3
2nd
ST.
EAST OSBORN RD.
NO
RTH
40t
h S
T.
EAST INDIAN SCHOOL RD.
GRAND CANAL
NO
RTH
24t
h S
T.
B
B'
FEETHORIZONTAL
SCALE
VE
RTIC
AL S
CA
LE
? ?
RE
VIS
ION
S:
PROJECT NO.
DRAWING NAME
PR
OJE
CT:
PH
ON
E:
4600
E. W
AS
HIN
GTO
N S
TRE
ET,
SU
ITE
600
PH
OE
NIX
, AR
IZO
NA
850
34P
HO
NE
: 6
02-7
33-6
000
FAX
:
6
02-7
33-6
100
Env
ironm
ent &
Infra
stru
ctur
e S
olut
ions
, Inc
.
SHEET NO.
DESIGNED BY:DRAWN BY:CHECKED BY:
14-2020-2037
40th
Stre
et a
nd O
sbor
n R
oad
WQ
AR
F S
ite P
hoen
ix, A
rizon
a
Cro
ss -
Sec
tion
B-B
'Fe
asib
ility
Stu
dy R
epor
t
4

EAST OAK STREETN
OR
TH 3
6th
ST.
EAST THOMAS RD.N
OR
TH 3
2nd
ST.
EAST OSBORN RD.
NO
RTH
40t
h S
T.
EAST INDIAN SCHOOL RD.
GRAND CANAL
NO
RTH
24t
h S
T.
C
C'
FEETHORIZONTAL
SCALE
VE
RTIC
AL S
CA
LE
? ?
RE
VIS
ION
S:
PROJECT NO.
DRAWING NAME
PR
OJE
CT:
PH
ON
E:
4600
E. W
AS
HIN
GTO
N S
TRE
ET,
SU
ITE
600
PH
OE
NIX
, AR
IZO
NA
850
34P
HO
NE
: 6
02-7
33-6
000
FAX
:
6
02-7
33-6
100
Env
ironm
ent &
Infra
stru
ctur
e S
olut
ions
, Inc
.
SHEET NO.
DESIGNED BY:DRAWN BY:CHECKED BY:
14-2020-2037
40th
Stre
et a
nd O
sbor
n R
oad
WQ
AR
F S
ite P
hoen
ix, A
rizon
a
Cro
ss -
Sec
tion
C-C
'Fe
asib
ility
Stu
dy R
epor
t
5

@
!A!A!A!A!A
!A
!A!A!A
!A!A
!A!A
!A
!A!A
!A!A
!A!A
!A!A
!A!A!A
!A!A
!A!A
!A
!A
!A
!A!A
!A
!A
!A !A
!A
!A
!A
!A
!A
!A
!A
!A
!A
!A
!A
!A
!A!A!A
40th St and Osborn RdWQARF Site
48th St and Indian School RdWQARF Site
MW-101081.79
SMW-011199.4
MW-091089.45
MW-081090.275
BMW-02A1157.9
BMW-03A1161.1
SMW-121171.57
SMW-111180.52
SMW-061188.33
SMW-041197.24
SMW-051197.74
SMW-181182.49
SMW-171182.78
BMW-20D1143.58
BMW-09C1118.13
BMW-01B1153.38
BMW-01A1152.69
BMW-14D1055.52
BMW-10D1073.84
BMW-09D1117.96
BMW-11D1135.85
BMW-02C1157.82
BMW-04B1162.89
BMW-05B1169.91
BMW-06A1176.29
BMW-06B1176.49
BMW-22D1126.633
BMW-21D1124.271
BMW-19D1081.13
BMW-17D1139.40
BMW-10B1073.02
BMW-16D1048.86
BMW-07B1147.07
BMW-07A1147
MW-071087.05
SMW-071199.25
SMW-021206.56SMW-08
1200.34ECP-011199.59
ECP-031202.04
ECP-021202.25
SMW-16B1199.23
BMW-02B1157.85
BMW-04A1162.92
BMW-03B*1157.08
BMW-05A1169.85 SMW-19B
1178.45
SMW-19A1178.50
BMW-18D1087.59
BMW-02E1157.53
BMW-12B1167.36
SMW-03-0601192.7
SMW-03-1381192.62
Gradient = 0.01 ft/ft
1050
1205
1200
1055
1195
1060
1190
1065
1185
1070
1180
1075
1175
1080
1170
1085
1090
1165
1095
1135
1130
1140
1125
1120
1145
1115
1150
1155
1110
1160
1105
1100
Legend!A Wells
Groundwater Elevation Contour (ft amsl)
@Groundwater Flow Direction
Path
: X:\P
roje
cts\
20-L
ongt
erm
Pro
ject
s\40
th S
t and
Osb
orn
and
48th
St a
nd In
dian
Sch
ool\M
XD
\40t
h St
reet
and
Osb
orn
Roa
d\Fe
asib
ility
Stu
dy R
epor
t\202
0_Q
3\Fi
gure
6_G
W_E
lev.
mxd
Area of Detail
0 1,500750
Feet ±
September 2020Groundwater Elevation Map
Feasibility Study ReportECP 40th St & Osborn Rd WQARF Site
Phoenix, Arizona
The map shown here has been created with all due and reasonable care and is strictly for use withWood Environment & Infrastructure Solutions, Inc. Project Number 14-2020-2032. This map has not
been certified by a licensed land surveyor, and any third party use of this map comes without warranties ofany kind. Wood Environment & Infrastructure Solutions, Inc. assumes no liability, direct or indirect,
whatsoever for any such third party or unintended use.
14-2020-2032JC11/18/20201"= 1500'
Job No.PM:Date:Scale:
FIGURE6
Area of Detail
Notes:BMW-11D1136.19
Groundwater Monitoring Well IdentificationGroundwater Elevation (ft amsl)
* Groundwater elevation value excluded fromcontouring
ft Feetamsl Above Mean Sea Level
WQARF Water Quality Assurance Revolving Fund

Figure 7 Exposure Path DiagramFeasibility Study Report
40th Street and Osborn Road WQARF SitePhoenix, AZ
PRIMARY SECONDARY TRANSPORT EXPOSURE
SOURCES SOURCES MECHANISMS PATHWAY
Surficial SOIL IngestionSoils Wind Erosion Dermal Contact Dermal Contact
& Atmospheric or Ingestion
Dispersion
Off-SitePCE Vapors & AIR
Releases Atmospheric Particulate or Inhalation
Subsurface Dispersion Vapor Inhalation
Dry Cleaning Soil
Facilities Vapors &Leaking Enclosed-Space
Equipment Dissolved Accumulation
Sewer Groundwater
Discharge Plume Groundwater GROUNDWATER Ingestion
Soil Transport Potable Water Inhalation
Disposal Use Dermal Contact
Liquid Plume Mobile GROUNDWATER Ingestion
Free-Liquid Irrigation Inhalation
Migration Use Dermal Contact
Stormwater/ SURFACE WATER Ingestion
& Surface Water Irrigation Inhalation
Sediments Transport Dermal Contact
= absent/insignificant exposure = potentially complete exposure pathway
Surface Water
Worker
a dotted line indicates an incomplete or broken exposure pathway
Exposure Route Construction Worker Ecological WorkerResident Construction
Worker Resident Ecological
FutureRECEPTORS: CURRENT AND FUTURE LAND USE
Free-Phase
Current
8/4/2020Figure 7_CSM-40OSB

!?SRP17.9 E-7.5N
0 0.5 10.25
Miles
±CLIENT PROJECT
TITLE
DATE
March 2021
1:15,000
SCALE
PROJECT NO.
FIGUREModel Boundary Conditions
40th Street & Osborn Road Water Quality Assurance Revolving FundArizona Department of Environmental Quality
Service Layer Credits: Source: Esri, Maxar, GeoEye, Earthstar Geographics,CNES/Airbus DS, USDA, USGS, AeroGRID, IGN, and the GIS UserCommunity
Document Path: B:\Amec\Emily's Backup\1420202037 FY 2021 40th & Osborn WQARF TO #1\13 GIS\MXDs\Fig_08_boundary_conditions.mxd
1420202037
8
Legend
Model domain
PCE plume
!? SRP pumping well
Constant head1,044 - 1,050
1,051 - 1,100
1,101 - 1,150
1,151 - 1,200
1,201 - 1,250
4600 East Washington StreetSuite 600
Phoenix, AZ 85034

!?SRP17.9 E-7.5N
120011901180117011601150114011301120
1110
1100
1090
1060
10501080
1070
0 0.5 10.25
Miles
±CLIENT
Wood E&IS8519 Jefferson St NE
Albuquerque, NM 87113
PROJECT
TITLE
DATE
March 2021
1:15,000
SCALE
PROJECT NO.
FIGUREForward Particle Tracking Results
K = 5 ft/d
40th Street & Osborn Road Water Quality Assurance Revolving FundArizona Department of Environmental Quality
Service Layer Credits: Source: Esri, Maxar, GeoEye, Earthstar Geographics,CNES/Airbus DS, USDA, USGS, AeroGRID, IGN, and the GIS UserCommunity
Document Path: B:\Amec\Emily's Backup\1420202037 FY 2021 40th & Osborn WQARF TO #1\13 GIS\MXDs\Fig_09_K5_20210331.mxd
1420202037
9
Legend
Particle tracks
Particle arrows
Potentiometric surface (ft)
Model domain
PCE plume
!? SRP pumping well

!?SRP17.9 E-7.5N
1050
1200
1110
1060
1190
1180
1070
1080
1170
1090
11601110
1150
1100
1140
1130
1120
0 0.5 10.25
Miles
±CLIENT PROJECT
TITLE
DATE
June 2021
1:15,000
SCALE
PROJECT NO.
FIGURE
Forward Particle Tracking ResultsK = 5 ft/d10 Years
40th Street & Osborn Road Water Quality Assurance Revolving FundArizona Department of Environmental Quality
Service Layer Credits: Source: Esri, Maxar, GeoEye, Earthstar Geographics,CNES/Airbus DS, USDA, USGS, AeroGRID, IGN, and the GIS UserCommunity
Document Path: B:\Amec\Emily's Backup\1420202037 FY 2021 40th & Osborn WQARF TO #1\13 GIS\MXDs\Fig_10_forward_tracking_K5_10_yrs.mxd
1420202037
10
Legend
Potentiometric surface (ft)
Model domain
PCE plume
!? SRP pumping well
Particle tracksK = 5 ft/d
0.0 - 2.0 years
2.1 - 4.0 years
4.1 - 6.0 years
6.1 - 8.0 years
8.1 - 10.0 years
4600 East Washington StreetSuite 600
Phoenix, AZ 85034
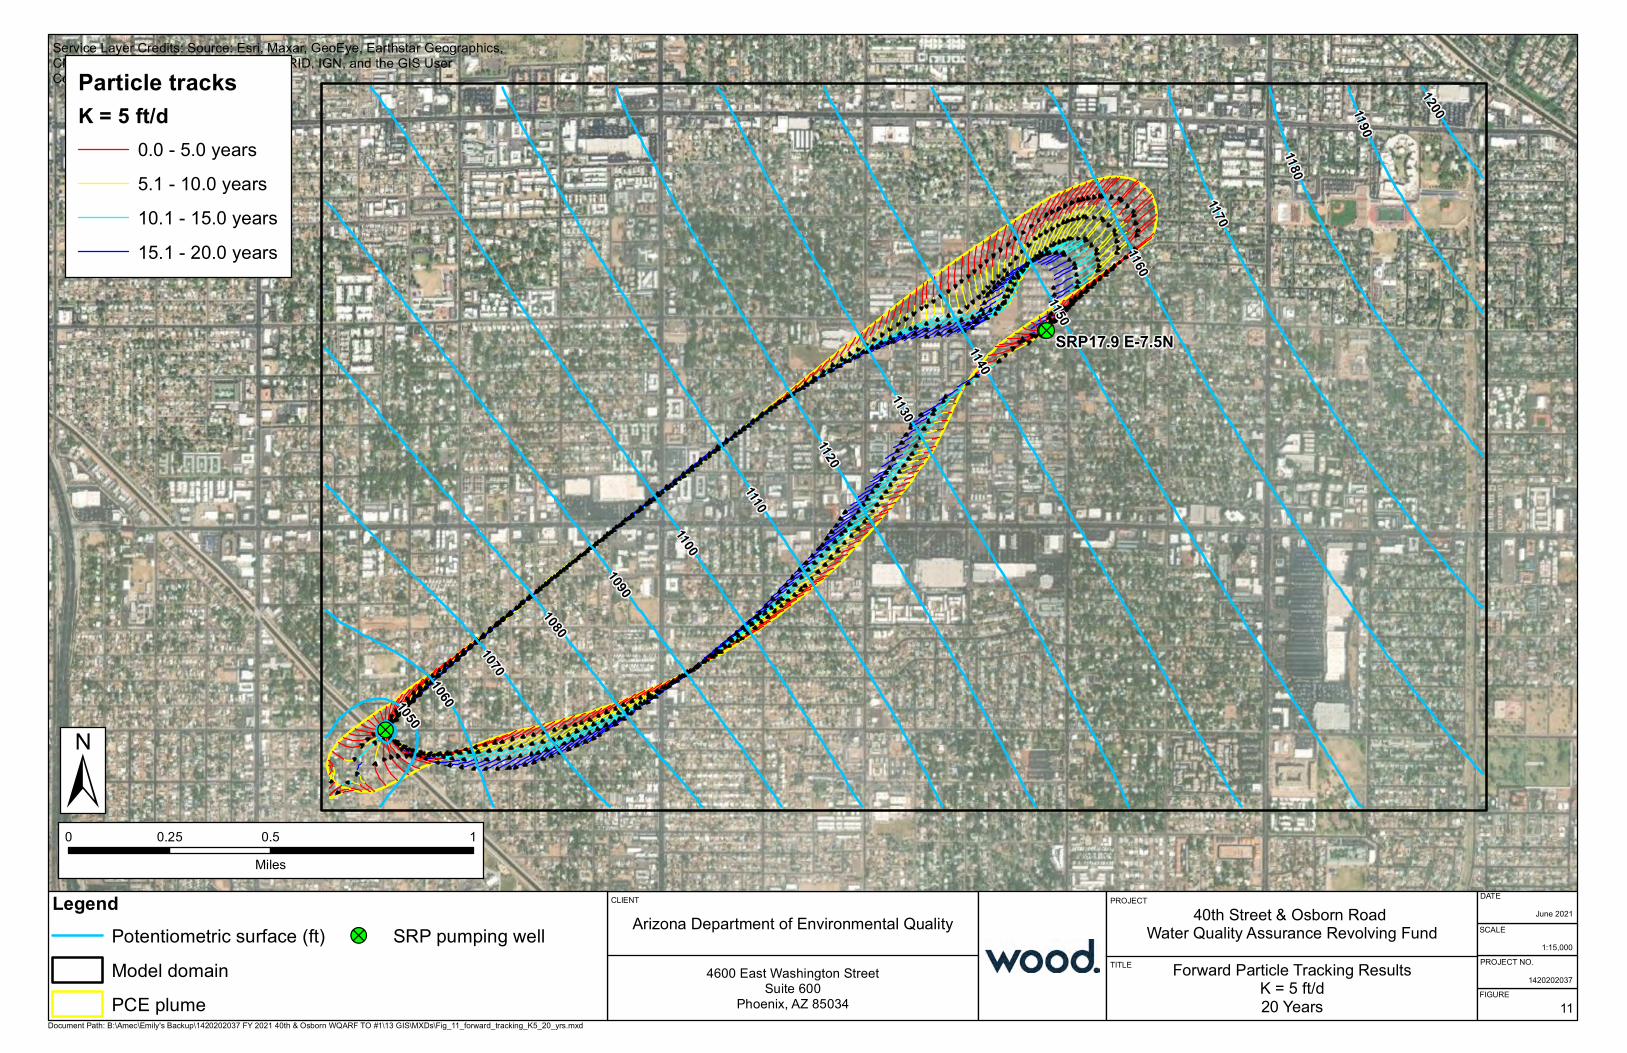
!?!?
!?
SRP17.9 E-7.5N
1190
1180
1170
1160
1150
1140
1130
1120
1110
1100
1090
1080
1070
10601050
1200
0 0.5 10.25
Miles
±CLIENT PROJECT
TITLE
DATE
June 2021
1:15,000
SCALE
PROJECT NO.
FIGURE
Forward Particle Tracking ResultsK = 5 ft/d20 Years
40th Street & Osborn Road Water Quality Assurance Revolving FundArizona Department of Environmental Quality
Service Layer Credits: Source: Esri, Maxar, GeoEye, Earthstar Geographics,CNES/Airbus DS, USDA, USGS, AeroGRID, IGN, and the GIS UserCommunity
Document Path: B:\Amec\Emily's Backup\1420202037 FY 2021 40th & Osborn WQARF TO #1\13 GIS\MXDs\Fig_11_forward_tracking_K5_20_yrs.mxd
1420202037
11
Legend
Potentiometric surface (ft)
Model domain
PCE plume
!? SRP pumping well
Particle tracksK = 5 ft/d
0.0 - 5.0 years
5.1 - 10.0 years
10.1 - 15.0 years
15.1 - 20.0 years
4600 East Washington StreetSuite 600
Phoenix, AZ 85034

Appendix A
Hydrographs and PCE Concentration Versus Time Graphs

1100
1120
1140
1160
1180
1200
1220
1240
1260
1280
1300
1.0
10.0
100.0
1000.0
10000.04/21
/200
8
6/3/2008
6/19
/200
8
10/1/200
8
12/17/20
08
1/19
/200
9
11/15/20
10
1/30
/201
3
10/23/20
13
5/20
/201
4
3/2/2015
4/29
/201
5
8/24
/201
6
11/30/20
18
4/23
/201
9
10/15/20
19
5/13
/202
0
Groun
dwater Elevatio
nft AMSL
Con
cent
ratio
n (u
g/L)
Well BMW-02B-96 PCE Concentration Trends
PCE PCE AWQS GWE GWE - groundwater elevationNon-detect plotted at detection limit

1100
1120
1140
1160
1180
1200
1220
1240
1260
1280
1300
1.00
10.00
100.00
1000.00
10000.00
05/01/15
04/01/16
03/01/17
02/01/18
01/01/19
12/01/19
Groun
dwater Elevatio
nft AMSL
Con
cent
ratio
n (u
g/L)
Well BMW-02C-112.5PCE Concentration Trends
PCE: 112.5 ft bgs PCE AWQS GWE GWE - groundwater elevation
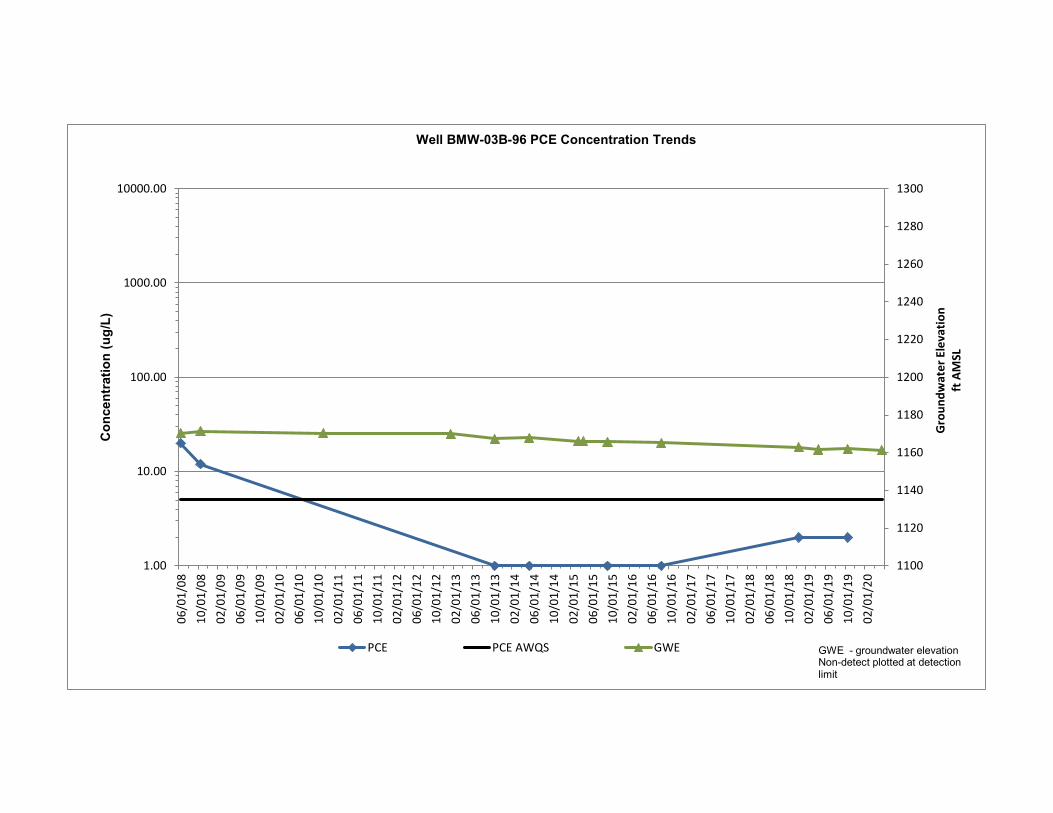
1100
1120
1140
1160
1180
1200
1220
1240
1260
1280
1300
1.00
10.00
100.00
1000.00
10000.0006
/01/08
10/01/08
02/01/09
06/01/09
10/01/09
02/01/10
06/01/10
10/01/10
02/01/11
06/01/11
10/01/11
02/01/12
06/01/12
10/01/12
02/01/13
06/01/13
10/01/13
02/01/14
06/01/14
10/01/14
02/01/15
06/01/15
10/01/15
02/01/16
06/01/16
10/01/16
02/01/17
06/01/17
10/01/17
02/01/18
06/01/18
10/01/18
02/01/19
06/01/19
10/01/19
02/01/20
Groun
dwater Elevatio
nft AMSL
Con
cent
ratio
n (u
g/L)
Well BMW-03B-96 PCE Concentration Trends
PCE PCE AWQS GWE GWE - groundwater elevationNon-detect plotted at detection limit

1080
1082
1084
1086
1088
1090
1092
1094
1096
1098
1100
1.0
10.0
100.0
1000.0
10000.09/8/2005
2/8/2006
7/8/2006
12/8/200
65/8/2007
10/8/200
73/8/2008
8/8/2008
1/8/2009
6/8/2009
11/8/200
94/8/2010
9/8/2010
2/8/2011
7/8/2011
12/8/201
15/8/2012
10/8/201
23/8/2013
8/8/2013
1/8/2014
6/8/2014
11/8/201
44/8/2015
9/8/2015
2/8/2016
7/8/2016
12/8/201
65/8/2017
10/8/201
73/8/2018
8/8/2018
1/8/2019
6/8/2019
11/8/201
94/8/2020
Groun
dwater Elevatio
nft AMSL
Con
cent
ratio
n (u
g/L)
Well MW-09 PCE Concentration Trends
PCE PCE AWQS GWE GWE - groundwater elevationNon-detect plotted at detection limit

Appendix B
Detailed Cost Estimates

Table B-1Estimated Costs for Less Aggressive Remedy
Feasibility Study Report40th St and Osborn Rd WQARF Site
Phoenix, AZ
$12,054,000 $8,439,000 $18,081,000
LS = lump sumGW - groundwater IDW - Investigation Derived-Wastesn/a - not applicable
Notes:
WQARF = Water Quality Assurance Revolving Fund % = percent
1. Total costs are rounded up to the nearest thousand dollars ($1000).2. Pricing is subject to commodity pricing increases. Contingencies for possible price escalation due to steel or other tariffs is not included.3. No estimated costs have been included for taxes or other fees relative to the project.
$6,000
Total Less Aggressive Alternative Remedy Costs $12,054,000 $8,439,000 $18,081,000Abbreviations:
$11,250
$11,972,000Annual Cost for GW Monitoring Subtotal $58,000 $41,000 $87,000Year 2-65 Total GW Monitoring Costs (3% annual escalation) $8,381,000 $17,958,000
Semiannual GW Monitoring/Reporting (all wells) 2 LS $25,000 $50,000 $35,000 $75,000
$36,000Estimated Capital Costs
Estimated GW Monitoring Annual Costs
Work Plan/Design 1 LS $24,000 $24,000 $17,000
$175,000
Quantity Unit Unit Cost1-3 Total Cost Estimated LowRange (-30%)
Estimated UpperRange (+50%)
Semi-Annual Monitoring
1 LS
Project Management/Oversignt/Administration 15% n/a n/a $8,000
$150,000$33,000
$9,000 $9,000 $6,000 $14,000Project Management/Oversight/Administration 15% n/a n/a $20,000 $14,000 $30,000
Capital Costs Subtotal $122,000 $263,000
Less Aggressive Alternative Remedy Capital and Monitoring Costs
Downgradient Performance Well InstallationMonitoring Well Installation and Oversight (includes vertical profile) 2 LS $50,000 $100,000 $70,000Survey, Permitting, Sampling and IDW Disposal 2 LS $11,000 $22,000 $15,000Tech Memo

Table B-2Estimated Costs for Reference Remedy
Feasibility Study Report40th St and Osborn Rd WQARF Site
Phoenix, AZ
$567,000 $399,000 $853,000
GWET System water withdrawal and use fees + annual ADWR report 1 LS $5,000 $5,000 $4,000 $8,000
Well and pump installation8 1 LS $192,000 $192,000
$53,000LGAC Cannister Purchase (2-10,000 lb units, manifold, and freight) 2 EA
$22,000 $16,000 $33,000GWET System monitoring analytical fees $3,000 $3,000 $3,000 $5,000GWET System O&M costs (Virgin LGAC) 1.0
SRP Well System Installation
$7,000 $24,000O&M Project Management/Oversight/Administration 15% n/a n/a $16,000
GWET O&M Labor and Reporting 1 LS
Estimated O&M Annual Costs
EA $22,000
Poor Quality Groundwater Withdrawal Permit Application + fee (one time)
Remedy Final DesignRemedy Final Design 1 LS $75,000 $75,000 $53,000 $113,000
$135,000 $288,000
LGAC Cannister Installation, including pads and piping6 1power drop installation9
$4,000 $8,000
LGAC Cannister Installation, including pads and piping5,6 1 LS $35,000 $35,000 $25,000 $53,000LGAC Cannister Purchase (2-20,000 lb units, manifold, and frieght) 2 EA $85,000 $170,000 $119,000 $255,000
$32,000
1 LS
$23,000 $48,000
Grand Canal System Installation7
GWET System O&M Plan 1 LS $5,000 $5,000$15,000 $15,000 $10,000 $23,000
$2,000 $2,000 $2,000 $3,000
SRP Well GWET System Capital Costs Subtotal
Virgin LGAC fill 2
$2,247,000
GWET System Installation Report (includes as-built drawings) 1 LS
$17,000 $17,000 $12,000 $17,000
$409,000 $289,000 $601,000
Project Management/Oversight/Administration
1
Total O&M Costs for Years 2-10 (3% annual escalation)11 $1,498,000 $1,049,000
Quantity Unit Unit Cost1-3 Total Cost Estimated LowRange (-30%)
Estimated UpperRange (+50%)
GWET (wellhead treatment) Estimated Capital Costs
EA $16,000
Grand Canal GWET System Capital Costs Subtotal - current value
15% n/a n/a $73,000 $51,000 $110,000
$10,000 $10,000 $7,000
Grand Canal GWET System - current
$76,000 $57,000
GWET System O&M costs (Virgin LGAC) 1.0 EA
$121,000 $66,000 $140,000
Remedial Progress Report 1 LS
Well rehabilitation and pump replacement4 1 LS $160,000 $160,000 $112,000 $240,000
GWET System electrical and land rental fees10 12 Months $4,000 $48,000 $34,000 $72,000
$43,000 $43,000 $31,000
$15,000
Annual Costs for GWET O&M Subtotal
LS
n/a $54,000 $38,000 $79,000
$81,000Virgin LGAC fill 2 EA $8,000 $16,000 $12,000 $24,000GWET System Installation Report (includes as-built drawings) 1 LS $15,000 $15,000 $10,000 $23,000
$38,000$27,000 $54,000
1 LS $30,000 $30,000 $21,000 $45,000
SRP Well GWET System
GWET System O&M Plan 1 LS $5,000 $5,000 $4,000 $8,000Project Management/Oversight/Administration 15% n/a
Grand Canal System Installation - assumes installed year 7 (3% annual escalation)7 $606,000 $427,000 $893,000
LS
$11,000 $11,000 $8,000 $17,000GWET System monitoring analytical fees 1 LS $3,000 $3,000 $3,000 $5,000GWET System electrical fees 12 Months $700 $9,000 $7,000 $14,000
$2,645,000
Remedial Progress Report 1 LS $10,000 $10,000 $7,000 $15,000O&M Project Management/Oversight/Administration 15% n/a n/a $8,000 $6,000 $13,000
Annual Cost for GWET O&M Subtotal - Start Year 7 (3% annual escalation)$95,000
GWET System water withdrawal and use fees + annual ADWR report 1 LS $3,000 $3,000 $3,000 $5,000GWET O&M Labor and Reporting 1 LS $17,000 $17,000 $12,000 $26,000
$117,000Annual Cost for GWET O&M Subtotal (current) $61,000 $46,000
Total O&M Costs for Years 8-24 (3% annual escalation)12 $1,763,000 $1,235,000

Table B-2Estimated Costs for Reference Remedy
Feasibility Study Report40th St and Osborn Rd WQARF Site
Phoenix, AZ
$5,858,000
$151,000 $105,000 $227,000
n/a n/a $8,000 $6,000 $12,000
Reference Remedy Costs (Including Contingencies) $7,182,000 $5,369,000
LS $11,000 $22,000 $15,000
Downgradient Performance Well Installation
Capital Costs Subtotal
Abbreviations:
WQARF = Water Quality Assurance Revolving Fund LF = linear feet% = percent LGAC = liquid phase granular activated carbon
1. Total costs are rounded up to the nearest thousand dollars ($1000).2. Pricing is subject to commodity pricing increases. Contingencies for possible price escalation due to steel or other tariffs is not included.3. No estimated costs have been included for taxes or other fees relative to the project.
GWET - groundwater extraction and treatment LS = lump sumGW - groundwater O&M = operations and maintenanceIDW - Investigation Derived-Wastes EA - each
Remedy Notes and Assumptions:
n/a - not applicable
7. Cost assumes Grand Canal GWET System is installed at Year 7 of the remedy based on 3% escalation. The cost decreases exponentially at 3% rate as time decreases.8. New extraction well installed with 300 gpm submersible pump.9. Installation of a power drop is required.10. Includes monthly private land rental fee of $2,000.11. Includes costs for two pump replacements12. Includes costs for three pump replacements
$11,474,000
$87,000Total GW Monitoring Costs for Years 2-26 (3% annual escalation) $2,400,000 $2,031,000 $4,352,000
O&M and Monitoring Costs Subtotal
Contingency Costs Subtotal $151,000 $105,000 $227,000
$4,438,000
Estimated Contingency CostsEstimated Capital Costs
2
Annual Cost for GW Monitoring Subtotal
$33,000Tech Memo 1 LS $9,000
Monitoring Well Installation and Oversight (includes vertical profile) 2 LS $50,000 $100,000 $70,000 $150,000Survey, Permitting, Sampling and IDW Disposal
$9,000 $6,000 $14,000
$9,501,000Reference Remedy Capital, O&M and Monitoring Costs $7,031,000 $5,264,000 $11,247,000
Project Management/Oversignt/Administration 15%Semiannual GW Monitoring/Reporting (all wells) 2 EA $25,000 $50,000 $35,000
$30,000
$75,000Estimated GW Monitoring Annual Costs
4. SRP Well 17.9E-7.5N is lined with a new casing and a new 700 gpm is installed. Assumes electrical service is present.5. Treated water discharge will be tied in to the existing production well conveyance pipeline.6. Treatment system will be installed on a 1-foot thick on grade concrete slab with secondary containment curbing enclosed in a masonry wall.
Project Management/Oversight/Administration 15% n/a n/a $20,000 $14,000
$58,000 $41,000

Table B-3Estimated Costs for More Aggressive Alternative Remedy
Feasibility Study Report40th St and Osborn Rd WQARF Site
Phoenix, AZ
SRP Well GWET System Capital Costs Subtotal $567,000 $392,000 $853,000
GWET System water withdrawal and use fees + annual ADWR report 1 LS $5,000 $5,000 $4,000 $8,000
Well and pump installation8 1 LS $192,000 $192,000 $135,000 $288,000
LGAC Cannister Installation, including pads and piping6 1
1 LS $2,000 $2,000 $2,000 $3,000
$22,000 $16,000 $33,000GWET System monitoring analytical fees $3,000 $3,000 $3,000 $5,000GWET System O&M costs (Virgin LGAC) 1.0
SRP Well System Installation
$7,000 $24,000O&M Project Management/Oversight/Administration 15% n/a n/a $16,000
GWET O&M Labor and Reporting 1 LS
Estimated O&M Annual Costs
EA $22,000
Poor Quality Groundwater Withdrawal Permit Application + fee (one time)
Remedy Final DesignRemedy Final Design 1 LS $75,000 $75,000 $53,000 $113,000
$4,000 $8,000
LGAC Cannister Installation, including pads and piping5,6 1 LS $35,000 $35,000 $25,000 $53,000LGAC Cannister Purchase (2-20,000 lb units, manifold, and frieght) 2 EA $85,000 $170,000 $119,000 $255,000
$32,000
$53,000LGAC Cannister Purchase (2-10,000 lb units, manifold, and freight) 2 EA $27,000 $54,000
$22,400 $48,000
Grand Canal System Installation7
GWET System O&M Plan 1 LS $5,000 $5,000$15,000 $15,000 $10,000 $23,000
Virgin LGAC fill 2
$2,247,000
GWET System Installation Report (includes as-built drawings) 1 LS
$17,000 $17,000 $12,000 $17,000
$409,000 $289,000 $601,000
Project Management/Oversight/Administration
1
Total O&M Costs for Years 2-10 (3% annual escalation)11 $1,498,000 $1,049,000
Quantity Unit Unit Cost1-3 Total Cost Estimated LowRange (-30%)
Estimated UpperRange (+50%)
GWET (wellhead treatment) Estimated Capital Costs
EA $16,000
Grand Canal GWET System Capital Costs Subtotal - current value
15% n/a n/a $73,000 $51,000 $110,000
$101,000
GWET System O&M costs (Virgin LGAC) 1.0
$10,000 $10,000 $7,000
Grand Canal GWET System - current
$65,000 $49,000
Annual Costs for GWET O&M Subtotal $121,000 $66,000 $140,000
Remedial Progress Report 1 LS
Grand Canal System Installation - assumes installed year 2 (3% annual escalation)7
Well rehabilitation and pump replacement4 1 LS $160,000 $160,000 $112,000 $240,000
GWET System electrical and land rental fees10 12 Months $4,000 $48,000 $34,000 $72,000
$43,000 $43,000 $31,000
$15,000
LS
n/a $54,000 $38,000 $79,000
$81,000Virgin LGAC fill 2 EA $8,000 $16,000 $12,000 $24,000GWET System Installation Report (includes as-built drawings) 1 LS $15,000 $15,000 $10,000 $23,000
$38,000
power drop installation9 1 LS $30,000 $30,000 $21,000 $45,000
SRP Well GWET System
GWET System O&M Plan 1 LS $5,000 $5,000 $4,000 $8,000Project Management/Oversight/Administration 15% n/a
$434,000 $307,000 $638,000
LS
EA $11,000 $11,000 $8,000 $17,000GWET System monitoring analytical fees 1 LS $3,000 $3,000 $3,000 $5,000GWET System electrical fees 12 Months $700 $9,000 $7,000 $14,000
Remedial Progress Report 1 LS $10,000 $10,000 $7,000 $15,000O&M Project Management/Oversight/Administration 15% n/a n/a $8,000 $6,000 $13,000
GWET System water withdrawal and use fees + annual ADWR report 1 LS $3,000 $3,000 $3,000 $5,000GWET O&M Labor and Reporting 1 LS $17,000 $17,000 $12,000 $26,000
Annual Cost for GWET O&M Subtotal (current) $61,000 $46,000 $95,000
Total O&M Costs for Years 3-19 (3% annual escalation)12 $1,532,000 $1,072,400 $2,298,000Annual Cost for GWET O&M Subtotal - Start Year 2 (NPV - Discounted 3%)

Table B-3Estimated Costs for More Aggressive Alternative Remedy
Feasibility Study Report40th St and Osborn Rd WQARF Site
Phoenix, AZ
$4,930,000
$151,000 $105,000 $227,000
n/a n/a $8,000 $6,000 $11,250
Reference Remedy Costs (Including Contingencies) $6,082,000 $4,241,000
LS $11,000 $22,000 $15,000
Downgradient Performance Well Installation
Capital Costs Subtotal
Abbreviations:
WQARF = Water Quality Assurance Revolving Fund LF = linear feet% = percent LGAC = liquid phase granular activated carbon
1. Total costs are rounded up to the nearest thousand dollars ($1000).2. Pricing is subject to commodity pricing increases. Contingencies for possible price escalation due to steel or other tariffs is not included.3. No estimated costs have been included for taxes or other fees relative to the project.
GWET - groundwater extraction and treatment LS = lump sumGW - groundwater O&M = operations and maintenanceIDW - Investigation Derived-Wastes EA - each
Remedy Notes and Assumptions:
n/a - not applicable
4. SRP Well 17.9E-7.5N is lined with a new casing and a new 700 gpm is installed. Assumes electrical service is present.
7. Cost assumes Grand Canal GWET System is installed at Year 2 of the remedy (3% annual escalation). The cost decreases exponentially at 3% rate as time decreases.8. New extraction well installed with 300 gpm submersible pump.9. Installation of a power drop is required.10. Includes monthly private land rental fee of $2,000.11. Includes costs for two pump replacements12. Includes costs for three pump replacements
$9,075,000
$87,000Total GW Monitoring Costs for Years 2-21 (Net Present Value - Discounted 3%) $1,714,000 $1,200,000 $2,571,000
O&M and Monitoring Costs Subtotal
Contingency Costs Subtotal $151,000 $105,000 $227,000
$3,437,000
Estimated Contingency CostsEstimated Capital Costs
2
Annual Cost for GW Monitoring Subtotal
$33,000Tech Memo 1 LS $9,000
Monitoring Well Installation and Oversight (includes vertical profile) 2 LS $50,000 $100,000 $70,000 $150,000Survey, Permitting, Sampling and IDW Disposal
$9,000 $6,000 $14,000
$58,000 $41,000
$7,357,000Reference Remedy Capital, O&M and Monitoring Costs $5,931,000 $4,136,000 $8,848,000
Project Management/Oversignt/Administration 15%Semiannual GW Monitoring/Reporting (all wells) 2 EA $25,000 $50,000 $35,000
$14,000 $30,000
$75,000Estimated GW Monitoring Annual Costs
5. Treated water discharge will be tied in to the existing production well conveyance pipeline.6. Treatment system will be installed on a 1-foot thick on grade concrete slab with secondary containment curbing enclosed in a masonry wall.
Project Management/Oversight/Administration 15% n/a n/a $20,000