calportland company, inc. - static.azdeq.gov
TRANSCRIPT

Environmental solutions delivered uncommonly well
PROJECT REPORT CalPortland Company, Inc. > Rillito, AZ
Arizona Department of Environmental Quality
Regional Haze Four-Factor Analysis
CALPORTLAND-RILLITO PLANT 11115 NORTH CASA GRANDE HIGHWAY
RILLITO, ARIZONA 85654
Prepared By:
TRINITY CONSULTANTS 3301 C Street
Suite 400 Sacramento, CA 95816
(916) 444-6666
November 2019 Updated June 2020
Project 190506.0052
CalPortland | Rillito Facility Four-Factor Analysis Trinity Consultants i
TABLE OF CONTENTS
1. EXECUTIVE SUMMARY 1-1
2. INTRODUCTION 2-1
3. BASELINE EMISSION RATES 3-1
4. FOUR-FACTOR ANALYSIS 4-1 Clinker to Overhead Crane Building – PM10 Controls .................................................................................. 4-1
Identification of Potential Control Technologies ........................................................................................................ 4-1 4.1.2. Elimination of Technically Infeasible Control Options ............................................................................................. 4-1 4.1.3. Rank of Remaining Control Technologies Based on Control Effectiveness ...................................................... 4-2 4.1.4. Evaluation of Impacts for Remaining Control Technologies ................................................................................. 4-2 4.1.5. Cost of Compliance ................................................................................................................................................................... 4-3 4.1.6. Timing of Compliance ............................................................................................................................................................. 4-3 4.1.7. Energy Impacts and Non-Air Quality Environmental Impacts ............................................................................. 4-3 4.1.8. Remaining Useful Life ............................................................................................................................................................. 4-3
Conclusion .................................................................................................................................................................................... 4-3 4.2. Unpaved Road Vehicle Traffic – PM10 Controls ............................................................................................ 4-3
4.2.1. Identification of Potential Control Technologies ........................................................................................................ 4-3 4.2.2. Elimination of Technically Infeasible Control Options ............................................................................................. 4-5 4.2.3. Rank of Remaining Control Technologies Based on Control Effectiveness ...................................................... 4-6 4.2.4. Evaluation of Impacts for Remaining Control Technology ..................................................................................... 4-6 4.2.5. Cost of Compliance ................................................................................................................................................................... 4-6 4.2.6. Timing of Compliance ............................................................................................................................................................. 4-7 4.2.7. Energy Impacts and Non-Air Quality Environmental Impacts ............................................................................. 4-7 4.2.8. Remaining Useful Life ............................................................................................................................................................. 4-7
Conclusion .................................................................................................................................................................................... 4-7 4.3. Paved Road Vehicle Traffic – PM10 Controls ................................................................................................. 4-7
4.3.1. Identification of Potential Control Technologies ........................................................................................................ 4-7 4.3.2. Elimination of Technically Infeasible Control Options ............................................................................................. 4-9 4.3.3. Rank of Remaining Control Technologies Based on Control Effectiveness ................................................... 4-10 4.3.4. Evaluation of Impacts for Remaining Control Technologies .............................................................................. 4-10 4.3.5. Cost of Compliance ................................................................................................................................................................ 4-10 4.3.6. Timing of Compliance .......................................................................................................................................................... 4-10 4.3.7. Energy Impacts and Non-Air Environmental Quality Impacts .......................................................................... 4-10 4.3.8. Remaining Useful Life .......................................................................................................................................................... 4-11
Conclusion ................................................................................................................................................................................. 4-11 4.4. Material Handling – PM10 Controls ............................................................................................................... 4-11
Identification of Potential Control Technologies ..................................................................................................... 4-11 4.4.2. Elimination of Technically Infeasible Control Options .......................................................................................... 4-11 4.4.3. Rank of Remaining Control Technologies Based on Control Effectiveness ................................................... 4-12 4.4.4. Evaluation of Impacts for Remaining Control Technologies .............................................................................. 4-12
4.5. Wind Erosion – Iron Stockpile – PM10 Controls ......................................................................................... 4-12 4.5.1. Identification of Potential Control Technologies ..................................................................................................... 4-12 4.5.2. Elimination of Technically Infeasible Control Options .......................................................................................... 4-14 4.5.3. Rank of Remaining Control Technologies Based on Control Effectiveness ................................................... 4-14 4.5.4. Evaluation of Impacts for Remaining Control Technologies .............................................................................. 4-15
CalPortland | Rillito Facility Four-Factor Analysis Trinity Consultants ii
4.6. Finish Mill Baghouses – PM10 Controls ........................................................................................................ 4-15 4.6.1. Identification of Potential Control Technologies ..................................................................................................... 4-15 4.6.2. Elimination of Technically Infeasible Control Options .......................................................................................... 4-15 4.6.3. Rank of Remaining Control Technologies Based on Control Effectiveness ................................................... 4-16 4.6.4. Evaluation of Impacts for Remaining Control Technologies .............................................................................. 4-16 4.6.5. Cost of Compliance ................................................................................................................................................................ 4-16 4.6.6. Timing of Compliance .......................................................................................................................................................... 4-16 4.6.7. Energy Impacts and Non-Air Quality Impacts........................................................................................................... 4-17 4.6.8. Remaining Useful Life .......................................................................................................................................................... 4-17
Conclusion ................................................................................................................................................................................. 4-17 4.7. Clinker Cooler – PM10 Controls ....................................................................................................................... 4-17
4.7.1. Identification of Potential Control Technologies ..................................................................................................... 4-17 4.7.2. Elimination of Technically Infeasible Control Options .......................................................................................... 4-17 4.7.3. Rank of Remaining Control Technologies Based on Control Effectiveness ................................................... 4-18 4.7.4. Evaluation of Impacts for Remaining Control Technologies .............................................................................. 4-18 4.7.5. Cost of Compliance ................................................................................................................................................................ 4-18 4.7.6. Timing of Compliance .......................................................................................................................................................... 4-18 4.7.7. Energy Impacts and Non-Air Quality Impacts........................................................................................................... 4-18 4.7.8. Remaining Useful Life .......................................................................................................................................................... 4-18
Conclusion ................................................................................................................................................................................. 4-19 4.8. Quarry Crusher – PM10 Controls .................................................................................................................... 4-19
4.8.1. Identification of Potential Control Technologies ..................................................................................................... 4-19 4.8.2. Elimination of Technically Infeasible Control Options .......................................................................................... 4-19 4.8.3. Rank of Remaining Control Technologies Based on Control Effectiveness ................................................... 4-19 4.8.4. Evaluation of Impacts for Remaining Control Technologies .............................................................................. 4-20 4.8.5. Cost of Compliance ................................................................................................................................................................ 4-20 4.8.6. Timing of Compliance .......................................................................................................................................................... 4-20 4.8.7. Energy Impacts and Non-Air Quality Impacts........................................................................................................... 4-20 4.8.8. Remaining Useful Life .......................................................................................................................................................... 4-20
Conclusion ................................................................................................................................................................................. 4-20 4.9. Blasting – NOX Controls ..................................................................................................................................... 4-20
5. SUMMARY & CONCLUSION 5-1
APPENDIX A: BAGHOUSE COST CALCULATIONS
APPENDIX B: FOUR-FACTOR ANALYSIS SPREADSHEET
CalPortland | Rillito Facility Four-Factor Analysis Trinity Consultants 1-1
1. EXECUTIVE SUMMARY
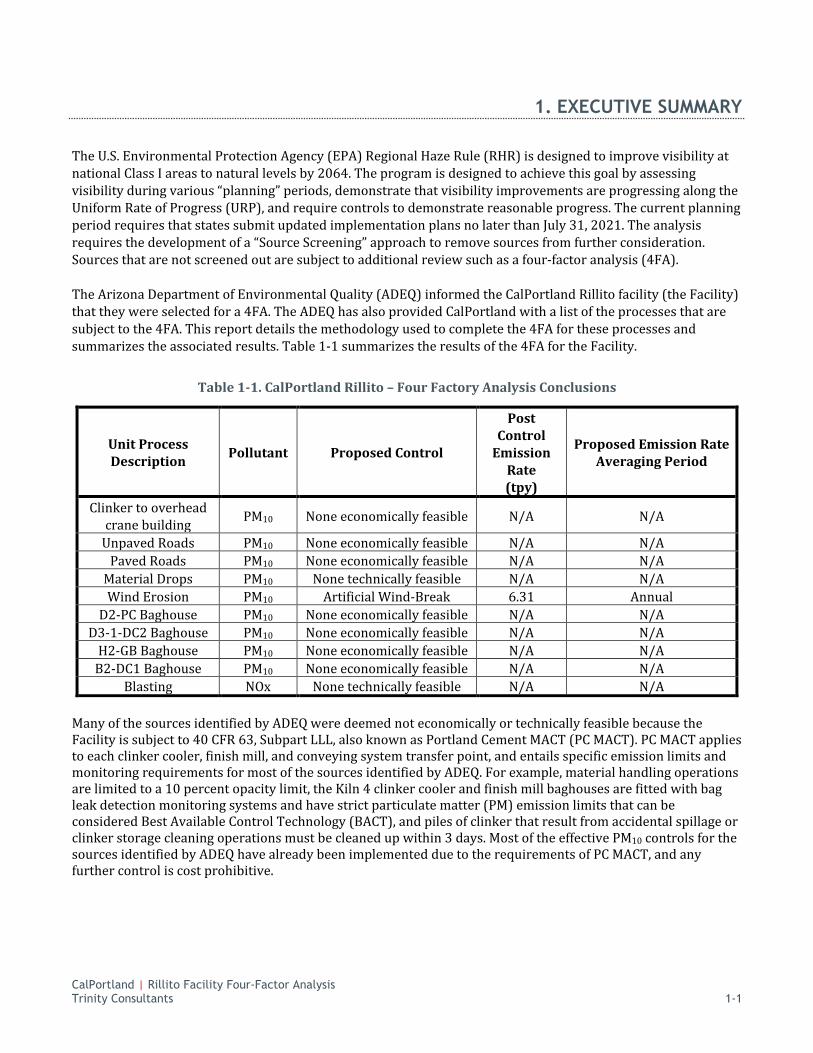
The U.S. Environmental Protection Agency (EPA) Regional Haze Rule (RHR) is designed to improve visibility at national Class I areas to natural levels by 2064. The program is designed to achieve this goal by assessing visibility during various “planning” periods, demonstrate that visibility improvements are progressing along the Uniform Rate of Progress (URP), and require controls to demonstrate reasonable progress. The current planning period requires that states submit updated implementation plans no later than July 31, 2021. The analysis requires the development of a “Source Screening” approach to remove sources from further consideration. Sources that are not screened out are subject to additional review such as a four-factor analysis (4FA). The Arizona Department of Environmental Quality (ADEQ) informed the CalPortland Rillito facility (the Facility) that they were selected for a 4FA. The ADEQ has also provided CalPortland with a list of the processes that are subject to the 4FA. This report details the methodology used to complete the 4FA for these processes and summarizes the associated results. Table 1-1 summarizes the results of the 4FA for the Facility.
Table 1-1. CalPortland Rillito – Four Factory Analysis Conclusions
Unit Process Description Pollutant Proposed Control
Post Control
Emission Rate (tpy)
Proposed Emission Rate Averaging Period
Clinker to overhead crane building PM10 None economically feasible N/A N/A
Unpaved Roads PM10 None economically feasible N/A N/A Paved Roads PM10 None economically feasible N/A N/A
Material Drops PM10 None technically feasible N/A N/A Wind Erosion PM10 Artificial Wind-Break 6.31 Annual
D2-PC Baghouse PM10 None economically feasible N/A N/A D3-1-DC2 Baghouse PM10 None economically feasible N/A N/A
H2-GB Baghouse PM10 None economically feasible N/A N/A B2-DC1 Baghouse PM10 None economically feasible N/A N/A
Blasting NOx None technically feasible N/A N/A
Many of the sources identified by ADEQ were deemed not economically or technically feasible because the Facility is subject to 40 CFR 63, Subpart LLL, also known as Portland Cement MACT (PC MACT). PC MACT applies to each clinker cooler, finish mill, and conveying system transfer point, and entails specific emission limits and monitoring requirements for most of the sources identified by ADEQ. For example, material handling operations are limited to a 10 percent opacity limit, the Kiln 4 clinker cooler and finish mill baghouses are fitted with bag leak detection monitoring systems and have strict particulate matter (PM) emission limits that can be considered Best Available Control Technology (BACT), and piles of clinker that result from accidental spillage or clinker storage cleaning operations must be cleaned up within 3 days. Most of the effective PM10 controls for the sources identified by ADEQ have already been implemented due to the requirements of PC MACT, and any further control is cost prohibitive.

CalPortland | Rillito Facility Four-Factor Analysis Trinity Consultants 2-1
2. INTRODUCTION
CalPortland operates a portland cement manufacturing plant in Rillito, Arizona. This report documents the results of a four-factor control technology analysis for oxides of nitrogen (NOx) and particulate matter smaller than 10 microns in diameter (PM10) sources at the Facility. The Facility operates under the jurisdiction of the air quality program of the Arizona Department of Environmental Quality (ADEQ). The U.S. Environmental Protection Agency (EPA) Regional Haze (RH) program is designed to improve visibility at national Class I areas (such as Superstition Wilderness) to natural levels by 2064. The program is designed to achieve this goal by assessing visibility during various “implementation” periods, demonstrate that visibility improvements are progressing along the Uniform Rate of Progress (URP), and require controls to demonstrate reasonable progress. As part of the first “implementation” period, states were required to submit implementation plans no later than December 17, 2007. The second “implementation” period requires that states submit updated implementation plans no later than July 31, 2021. In order to decide which sources are subject to RH requirements, a “Source Screening” approach was taken by the Arizona Department of Environmental Quality (ADEQ) in order to eliminate sources from additional consideration. The ADEQ preliminary “Source Screening” approach was based on a ratio of 2014 to 2017 annual emissions of visibility affecting pollutants (determined to be NOx, SO2, and PM10 for Arizona), known as “Q” in tons per year (tpy), and distance to Class I area, known as “d” in kilometers (km). Arizona has diverged from WRAP guidance regarding using a threshold of “Q/d > 10” to screen sources in and instead utilized a higher threshold of “Q/d > 20.” Based on the results of the initial “Q/d > 20” screening approach, the ADEQ identified the Facility as subject to the requirement to develop a “four-factor” analysis. The following sources at CalPortland were included in the four-factor analysis evaluated PM10 emissions:
Clinker to overhead crane building transfer points Vehicle traffic on paved and unpaved roads Material drops Wind erosion for the Sonoran hematite pile D2 Finish Mill D2-PC Baghouse D3 Finish Mill D3-1-DC2 Baghouse Kiln 4 Clinker Cooler H2-GB Baghouse Quarry Crusher B2-DC1 Baghouse
The following source will be evaluated for NOx emissions:
Blasting This report contains the “baseline” emission rates defined by EPA guidance1 as “source conditions assumed to be the starting point for the analysis of additional measures based on the four statutory factors and possibly visibility benefits.” that represent a realistic depiction of anticipated annual emissions. In addition, a four-factor analysis is provided for each of the aforementioned sources, which reviews the following four statutory factors:
Factor 1. Costs of compliance
1 Per EPA “Draft Guidance on Progress Tracking Metrics, Long‐Term Strategies, Reasonable Progress Goals and Other Requirements for Regional Haze State Implementation Plans for the Second Implementation Period”, July 2016.
CalPortland | Rillito Facility Four-Factor Analysis Trinity Consultants 2-2
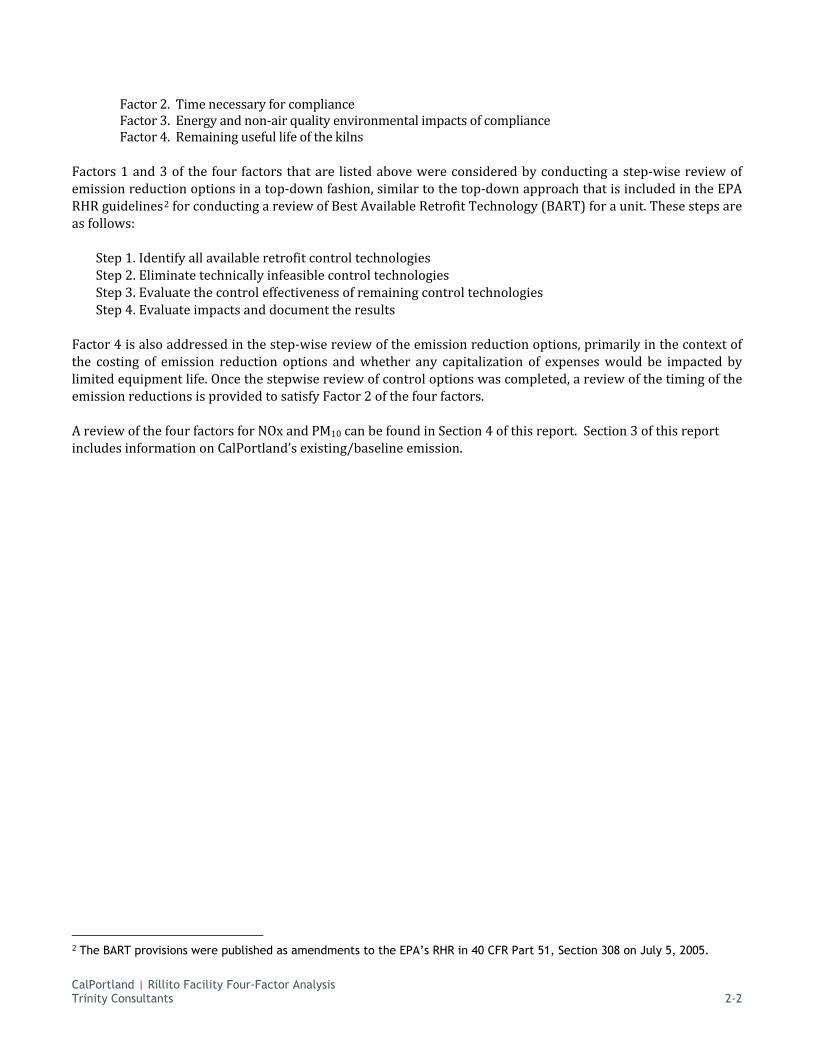
Factor 2. Time necessary for compliance Factor 3. Energy and non-air quality environmental impacts of compliance Factor 4. Remaining useful life of the kilns
Factors 1 and 3 of the four factors that are listed above were considered by conducting a step-wise review of emission reduction options in a top-down fashion, similar to the top-down approach that is included in the EPA RHR guidelines2 for conducting a review of Best Available Retrofit Technology (BART) for a unit. These steps are as follows:
Step 1. Identify all available retrofit control technologies Step 2. Eliminate technically infeasible control technologies Step 3. Evaluate the control effectiveness of remaining control technologies Step 4. Evaluate impacts and document the results
Factor 4 is also addressed in the step-wise review of the emission reduction options, primarily in the context of the costing of emission reduction options and whether any capitalization of expenses would be impacted by limited equipment life. Once the stepwise review of control options was completed, a review of the timing of the emission reductions is provided to satisfy Factor 2 of the four factors. A review of the four factors for NOx and PM10 can be found in Section 4 of this report. Section 3 of this report includes information on CalPortland’s existing/baseline emission.
2 The BART provisions were published as amendments to the EPA’s RHR in 40 CFR Part 51, Section 308 on July 5, 2005.
CalPortland | Rillito Facility Four-Factor Analysis Trinity Consultants 3-1
3. BASELINE EMISSION RATES
Pursuant to 40 CFR 51.308(d)(3)(iv), states are responsible for identifying the sources that contribute to the most impaired days (MID) in the Class I areas. To accomplish this, the ADEQ reviewed 2014 emission inventory data for sources of PM10, NOx, and SO2, and developed a “source screening” approach using a “Q/d” analysis, to remove sources from further consideration. In this analysis “Q” is the aggregate tons per year of PM10, NOx, and SO2, and “d” is the distance (km) of a facility to a Class I area. Arizona utilized guidance from the Western Regional Air Partnership (WRAP) regarding using a threshold of “Q/d > 10” to screen out insignificant sources. Additionally, the ADEQ evaluated 2018 facility operations and emissions to determine which processes have installed an “effective control” within the last five years. Those processes which have an “effective control” were deferred from further evaluation during this planning period.3 Based on the results of the initial “Q/d > 10” and “effective control” screening approach, ADEQ identified the Facility is not “screened out” and as subject to the requirements to develop a 4FA. For facilities that are subject to the requirement to develop a 4FA, ADEQ determined that the 4FA must be completed for processes at these facilities contributing to the top 80% of the “Q” emissions. The Facility is in Pima County, Arizona. The nearest class I area is Saguaro Wilderness, located approximately 8 kilometers from the facility. Table 3-1 and 3-2 contain a list of the top 80% processes that are subject to the 4FA based on ADEQ communication.4 This section summarizes emission rates that were used as baseline rates in the four factor analyses presented in Section 4 of this report. These baseline emission rates were provided by ADEQ, except for the baghouses, which were modified to represent expected vendor guarantees as opposed to stack testing information which was provided in past emission inventories. Source tests show actual emission rates are significantly below the grain loading rates used in the analysis.
3 ADEQ 2021 Regional Haze State Implementation Plan Source Screening Methodology 4 Per “Four Factor Processes” spreadsheet received September 2019.
CalPortland | Rillito Facility Four-Factor Analysis Trinity Consultants 3-2
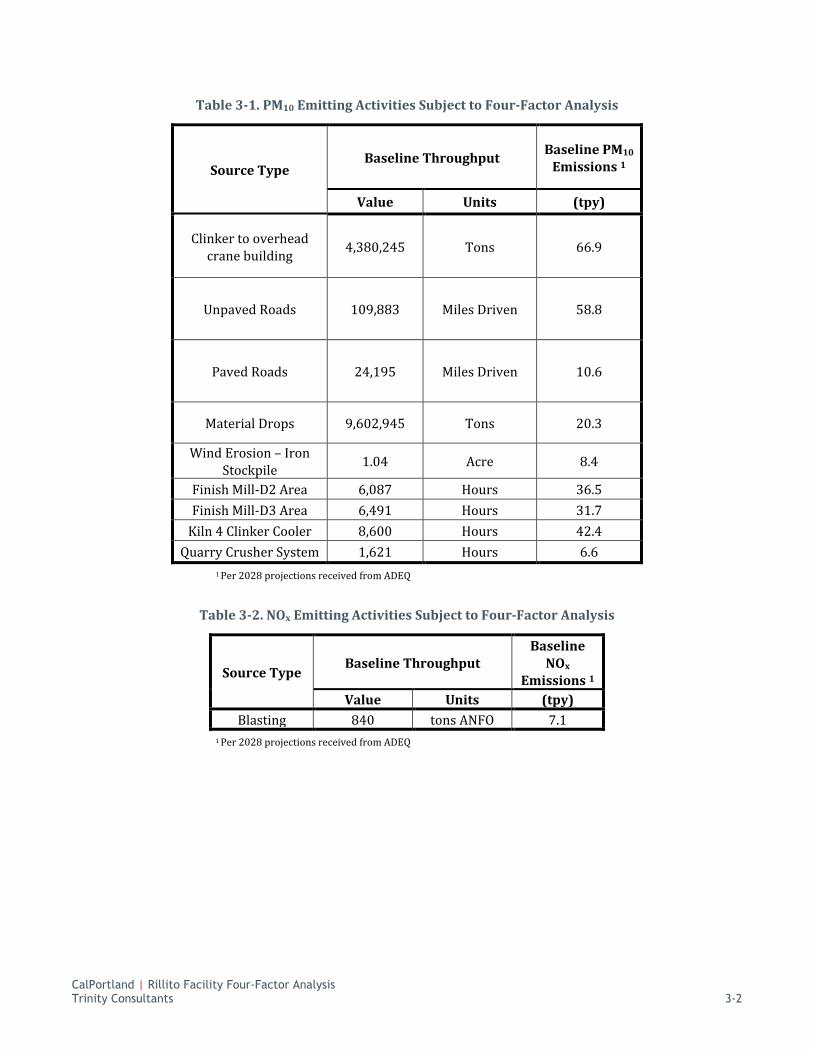
Table 3-1. PM10 Emitting Activities Subject to Four-Factor Analysis
Source Type Baseline Throughput Baseline PM10
Emissions 1
Value Units (tpy)
Clinker to overhead crane building 4,380,245 Tons 66.9
Unpaved Roads 109,883 Miles Driven 58.8
Paved Roads 24,195 Miles Driven 10.6
Material Drops 9,602,945 Tons 20.3
Wind Erosion – Iron Stockpile 1.04 Acre 8.4
Finish Mill-D2 Area 6,087 Hours 36.5 Finish Mill-D3 Area 6,491 Hours 31.7
Kiln 4 Clinker Cooler 8,600 Hours 42.4 Quarry Crusher System 1,621 Hours 6.6
1 Per 2028 projections received from ADEQ
Table 3-2. NOx Emitting Activities Subject to Four-Factor Analysis
Source Type Baseline Throughput
Baseline NOx
Emissions 1 Value Units (tpy)
Blasting 840 tons ANFO 7.1 1 Per 2028 projections received from ADEQ
CalPortland | Rillito Facility Four-Factor Analysis Trinity Consultants 4-1
4. FOUR-FACTOR ANALYSIS
CLINKER TO OVERHEAD CRANE BUILDING – PM10 CONTROLS This section presents the stepwise review of control options for PM10 for clinker to overhead crane building conveyor transfer point.
Identification of Potential Control Technologies
The Clinker to Overhead Crane Building emission sources are clinker material handling sources that handle clinker within a building that is enclosed on three sides. One side of the building is open to allow for crane movement in and out of the building. As such, CalPortland reviewed the feasibility of installing the following PM10 control technologies for reduction of PM10 from these material handling sources:
Fabric Filter Baghouse Full Enclosure
In order to identify all feasible control technologies, the RACT/BACT/LAER Clearinghouse (RBLC) database, Western Regional Air Partnership (WRAP) guidance5, as well as technical literature was reviewed. Using these sources, potentially applicable PM10 control technologies for clinker material transfers were identified based on the principles of control technology and engineering experience for conveyors at cement plants. Step 1 of the top-down control review is to identify available retrofit control options. Each control technology is described in detail below:
Full Enclosure
Enclosure is one of the control techniques used for material handling sources.6 The sources in the overhead crane building already achieve 75% control due to its location in a three-sided enclosure. As such, full enclosure of the building would represent the maximum achievable control for these sources.
Fabric Filter Baghouse
Fabric filter baghouses work by filtering fugitive PM10 emissions through a filter bag. The collected particles are periodically removed from the bag through a pulse jet or reverse flow mechanism.
4.1.2. Elimination of Technically Infeasible Control Options
Step 2 of the top-down control review is to eliminate technically infeasible PM10 control options that were identified in the first step. The technical feasibility of each of the control options is reviewed below:
4.1.2.1. Full Enclosure Feasibility
The overhead crane building is designed to allow the overhead crane to exit on either end of the building. In order to implement full enclosure of the building, modifications will have to be made to the overhead crane building
5 Per WRAP Fugitive Dust Handbook, 2006, https://www.wrapair.org/forums/dejf/fdh/content/FDHandbook_Rev_06.pdf 6 RBLC database

CalPortland | Rillito Facility Four-Factor Analysis Trinity Consultants 4-2
while still allowing for maintenance of the crane and loader/haul truck access at either end. These modifications will include the following:
• Extension of the building on the east end to accommodate crane maintenance (through roof ports/hatches). The top portion of the east face of the building (50 to 60% of the total building height) will be enclosed. The east face will include a roll-up door on the bottom to provide access to haul trucks, maintenance equipment, and other vehicles or equipment, as necessary.
• Enclosure of the building on the west end. The top portion (50 to 70% of the total building height) of the west end face will be enclosed. The west face will remain open on the bottom to facilitate loader traffic (moving clinker in and out of the building) and other equipment access as needed.
• Structural changes and/or reinforcements to the building to accommodate the additional weight of the extended building and walls, as well as changes to the wind loading of the structure.
• For the building to be fully enclosed, dust collection will be required to maintain visibility for the crane operators to ensure their health and safety. The building will not be able to structurally support new dust collection equipment either on top of or inside the structure. That said, the Facility may be able to re-purpose the existing H5-5 baghouse (for Kilns 1, 2, and 3) to provide dust collection for the clinker storage building.
o Note that to repurpose the H5-5 baghouse for fugitive dust collection, additional ducting will need to be installed at the east end of the building to connect to the existing ducting at the end of Kilns 1, 2, and 3/inlet to the H5-5 baghouse.
Full enclosure of the building is a technically feasible control measure; however, the cost associated with rebuilding the overhead crane building would be likely cost-prohibitive making it economically infeasible. The cost concerns associated with this control technology are discussed further in Section 4.1.4.
4.1.2.2. Fabric Filter Baghouse Feasibility
The building structure cannot safely support or house a baghouse, and the building is not currently fully enclosed. As noted in section 4.1.2.1 above, even after restructuring the building to allow for a full enclosure, it will not be structurally capable of accommodating a baghouse. Therefore, installing a new baghouse is not a technically feasible option for this analysis.
4.1.3. Rank of Remaining Control Technologies Based on Control Effectiveness
Step 3 of the top-down control review is to rank the technically feasible options according to effectiveness. Full enclosure of the overhead crane building is the only technically feasible control technology.
4.1.4. Evaluation of Impacts for Remaining Control Technologies
The fourth step of the top-down control review is the impact analysis. The impact analysis considers the:
Cost of compliance; Time necessary to comply with the control; Energy impacts and non-air quality impacts; and The remaining useful life of the source.
Below, the cost of compliance for full enclosure of the overhead crane building was estimated.

CalPortland | Rillito Facility Four-Factor Analysis Trinity Consultants 4-3
4.1.5. Cost of Compliance
The total annual cost to fully enclose the overhead crane building is $127,565, which is based on a capital cost of $1,076,037 for reconstructing the east and west end of the overhead crane building, representing an annualized cost of $84,523 based on a 7.86% recovery factor. Additional operating costs include administration, taxes, and insurance. These costs contribute $84,523 annually. Therefore, based on an annual cost of $127,565 and an associated PM10 reduction of 16.06 tpy, the cost of compliance for the implementation of a full enclosure is $7,945/ton. Therefore, it is economically infeasible for CalPortland to restructure the overhead crane building to allow for a full enclosure.
4.1.6. Timing of Compliance
The estimated time of compliance is 6 months which is based on time needed to design and reconstruct the overhead crane building.
4.1.7. Energy Impacts and Non-Air Quality Environmental Impacts
CalPortland expects that the associated energy and non-air quality impacts will be minimal.
4.1.8. Remaining Useful Life
CalPortland estimates that the source and controls will remain in service for a 20-year amortization period.
Conclusion
The estimated cost to rebuild the overhead crane building is economically infeasible.
4.2. UNPAVED ROAD VEHICLE TRAFFIC – PM10 CONTROLS This section presents the stepwise review of control options for PM10 for unpaved vehicle traffic at the Facility.
4.2.1. Identification of Potential Control Technologies
CalPortland reviewed the feasibility of installing the following control technologies for reduction of PM10 from unpaved road traffic:
Development of traffic management plans, speed limits, and speed bumps; Application of additional water; Application and maintenance of surface gravel; Paving the road surfaces; and Application of chemical dust suppressant.
In order to identify all feasible control technologies, the RBLC database, ADEQ’s Draft List of Potential PM10 Controls for Nonpoint Source Sectors7, WRAP guidance8, as well as technical literature was reviewed. Using these sources, potentially applicable PM10 control technologies for unpaved road vehicle traffic at CalPortland were identified based on the principles of control technology and engineering experience for unpaved road vehicle traffic.
7 ADEQ Draft List of PM10 for non-point source sectors, paved road dust and unpaved road dust 8 Per WRAP Fugitive Dust Handbook, 2006, https://www.wrapair.org/forums/dejf/fdh/content/FDHandbook_Rev_06.pdf

CalPortland | Rillito Facility Four-Factor Analysis Trinity Consultants 4-4
Step 1 of the top-down control review is to identify available retrofit control options for unpaved road vehicle traffic for PM10. Each control technology is described in detail below.9
4.2.1.1. Traffic Management Plans, speed limits and speed bumps
Traffic management plans include the implementation of speed limits and the construction of speed bumps or limiting the amount traffic on road to reduce PM10 emissions associated with vehicle travel on unpaved roads. Reducing the speed at which haul trucks travel from 50 km/h to 30 km/h would reduce air pollution.10 An example of traffic management plan could be restricting road travel to only certain vehicle types. 11
4.2.1.2. Additional Water Application
Applying additional water to unpaved roads would assist in the reduction of PM10 emissions associated with vehicle traffic. Water acts as a dust suppressant by forming cohesive moisture films among the discrete grains of surface material. Moisture content depends on the frequency of water application, the amount of vehicle travel along the routes, the amount of water applied to the surface, and evaporation rates. Vehicle traffic intensifies the drying process by increasing air movement over the surface which increases the evaporation rate and reduces the moisture content.12 It is also important to note that water is more cost effective than chemical suppressants in the case of temporary roads which are common at quarries.13
4.2.1.3. Applying and Maintaining Surface Gravel
Applying and maintaining surface gravel could assist in the reduction of PM10 emissions associated with vehicle travel by reducing the silt content of the traffic routes. Covering the road surface with a material of lower silt content, such as gravel, would result in reduced PM10 emissions. The control efficiency associated with graveling unpaved roads depends on the silt content. This control is only effective if the silt content is already high enough to result in a reduction in roadway silt content, i.e. higher control efficiency.14
4.2.1.4. Paving the Road Surface
Paving the roads would assist in the reduction of PM10 emissions associated with vehicle travel. Pavement reduces PM10 emissions by changing the physical characteristics of the existing road surface material and forming a hardened surface that binds particles together. Paving is highly effective; however, the high initial cost can be prohibitive in addition to the infeasibility of paving for industrial road subject to heavy vehicles and/or spillage of material in transport. 15
4.2.1.5. Applying Chemical Dust Suppressant
Applying chemical dust suppressant would assist in the reduction of PM10 emissions associated with vehicle travel. Chemical dust suppressants may last several months when applied to unpaved roads.16 When compared to plain water under summertime conditions, the reapplication frequency of water ranges from minutes or hours
9 AP-42 reduction percentages cited in this report were taken from AP-42, Chapter 1, External Combustion Sources, unless otherwise noted.
10 K. Ahn, H. Rakha Transportation Research Part D, page 412 11 EPA Control of Open Fugitive Dust Sources, page 3-6, https://www3.epa.gov/ttn/chief/old/ap42/ch13/s025/reference/ref_10c13s025_1995.pdf 12 WRAP Fugitive Dust Handbook, 2006, page 1-3 13 Ibid, page 6-9 14 EPA Control of Open Fugitive Dust Sources, page 3-11 15 WRAP Fugitive Dust Handbook, 2006 Pg 6-9 16 Ibid, page 1-8

CalPortland | Rillito Facility Four-Factor Analysis Trinity Consultants 4-5
while the reapplication frequency of chemical dust suppressants ranges from several weeks to a few months.17 Chemical dust suppressants reduce PM10 emissions by changing the physical characteristics of the existing road surface material and forming a hardened surface that binds particles together.18 Chemical dust suppressants provide a PM10 control efficiency of about 80% when applied at regular intervals of 2 weeks to 1 month. If chemical dust suppressant is not applied regularly, the silt content of loose material on a controlled surface may be substantially higher than when the surface was uncontrolled and may lead to an increase in emissions.
4.2.2. Elimination of Technically Infeasible Control Options
Step 2 of the top-down control review is to eliminate technically infeasible PM10 control options that were identified in the first step. The technical feasibility of each control option is reviewed below.
4.2.2.1. Traffic Management Feasibility
A traffic management plan is already in effect at the Facility. The Facility is already using the most efficient traffic patterns and roadways possible. Additional restrictions would impede facility operation and bottleneck facility processes. Additional speed restrictions would also require more vehicles than are currently in use, representing an increase in not only PM10 emissions, but also NOx and sulfur oxide (SOx) emissions. Therefore, the current control methodology is a technically feasible option, but no additional changes can be made.
4.2.2.2. Additional Water Application Feasibility
The current baseline emission rate for road watering has been demonstrated to be a 65% control efficiency. An 86% reduction in PM10 emissions can be achieved with additional watering, representing an overall 95% PM10 control efficiency. However, the amount of water that would be required to meet an overall 95% control efficiency is not available at the Facility, as the amount of water that can be obtained is limited by the local aquifer, the number of production wells, the wellhead pumps, and existing infrastructure for filling the existing water trucks. As such, additional water application is not a technically feasible control option.
4.2.2.3. Application and Maintenance of Surface Gravel Feasibility
As previously mentioned, application of gravel is only feasible if the silt content is high enough to result in a meaningful control efficiency. The current silt content at CalPortland (6.4%)19 is equivalent to the silt content that would be achieved by applying gravel to the unpaved road. As such, the application of gravel is a technically feasible option with no associated PM10 reduction.
4.2.2.4. Paved Road Surface Feasibility
The quarry roads cannot be paved as the weight and size of the haul trucks would destroy the pavement. In order to accommodate the frequency and weight of the trucks that would need to travel on paved roads, an 18-inch concrete foundation would need to be poured for a rebar supported asphalt roadway. Additionally, haul roads will change as the quarry pit is developed. Therefore, this not a technically feasible control option.
17 Ibid, page 6-10 18 Ibid, page 6-12 19 6.4% is a conservative value obtained from the “Field Tests of Unpaved Road Dust Control” report that was conducted for CalPortland, dated March 13, 2006, with project No. 310559.1.002. Most of the silt content percentages in the report are far below 6.4%.

CalPortland | Rillito Facility Four-Factor Analysis Trinity Consultants 4-6
4.2.2.5. Chemical Dust Suppressant Feasibility
The application of chemical dust suppressants would reduce PM10 emissions on the unpaved roads. Currently, a high efficiency lignin-based dust suppressant is being applied and alternated with water. Magnesium chloride is another chemical dust suppressant used for unpaved PM10 road emission reduction. However, magnesium chloride is corrosive and can damage equipment at the plant. In addition, it less effective at dust control than lignin-based dust suppressant. Therefore, chemical dust suppressant is already implemented and is a technically feasible option.
4.2.3. Rank of Remaining Control Technologies Based on Control Effectiveness
Step 3 of the top-down control review is to rank the technically feasible options according to effectiveness. Table 4-1 provides a ranking of the control levels for the controls listed in the previous section.
Table 4-1. Control Effectiveness of Technically Feasible Unpaved Road Travel PM10 Control Technologies
Control Technology Estimated Control Level (%)
Develop traffic management plans, speed limits, speed bumps
Base Case
Apply chemical dust suppressant Base Case
Application and maintenance of surface gravel 0%
Additional water application 86%1
1 Additional control based on 95% overall PM10 control
4.2.4. Evaluation of Impacts for Remaining Control Technology
The fourth step of the top-down control review is the impact analysis. The impact analysis considers the:
Cost of compliance; Time necessary to comply with the control; Energy impacts and non-air quality impacts; and The remaining useful life of the source.
Given that the development of traffic management plans, speed limits, speed bumps, the application of chemical dust suppressant, and application and maintenance of surface gravel all represent no associated reduction in PM10 emissions, these control technologies are considered cost infeasible. Below, the cost of compliance for additional water application was estimated using published methods and vendor quotes
4.2.5. Cost of Compliance
The total annual cost for additional water application to unpaved roads is $1,062,186, which is based on a capital cost of $3,160,000 for eight trucks, representing an annualized cost of $248,219 based on a 7.86% recovery factor. Additional operating costs include administration, taxes, and insurance, and the fixed operating cost of obtaining the additional water required to achieve an overall 95% PM10 control. These costs contribute $126,400 and $687,567 annually, respectively. Therefore, based on an annual cost of $1,062,186 and an
CalPortland | Rillito Facility Four-Factor Analysis Trinity Consultants 4-7
associated PM10 reduction of 50.37 tpy, the cost of compliance for the implementation of additional water application is $21,086/ton. However, as mentioned previously, it would not be possible for CalPortland to obtain the amount of water that would be necessary to achieve this control efficiency.
4.2.6. Timing of Compliance
The estimated time of compliance is 3 years which is based on procurement of equipment and implementation of new operations.
4.2.7. Energy Impacts and Non-Air Quality Environmental Impacts
The reduction of PM10 emissions would see an increase in other criteria pollutants and greenhouse gases from the additional tailpipe emissions.
4.2.8. Remaining Useful Life
CalPortland estimates that the source and controls will remain in service for a 20-year amortization period.
Conclusion
It is cost infeasible and technically infeasible for CalPortland to implement additional water application on the unpaved road surfaces at the Facility. The infrastructure does not exist to pump and fill the number of water trucks that would be necessary to apply the amount of water needed, and the amount of water truck traffic required would severely impede facility operations. Additionally, the estimated cost is economically infeasible.
4.3. PAVED ROAD VEHICLE TRAFFIC – PM10 CONTROLS This section presents the stepwise review of control options for PM10 for paved road vehicle travel at CalPortland.
4.3.1. Identification of Potential Control Technologies
CalPortland reviewed the feasibility of installing the following control technologies for reduction of PM10 from paved road traffic:
Cover haul trucks; Pave, vegetate, or chemically stabilize access points where unpaved traffic surfaces adjoin paved roads; Route traffic around and rapidly clean up non-preventable dust on paved roads; Require improved material specification for and reduction of usage of skid control sand or salt; Require curbing and pave or stabilize shoulders of paved roads; Provide for storm water drainage to prevent erosion of dirt or sand onto paved roads Stabilize medians of paved roads; Ensure stabilization of unpaved roads during weed abatement and vegetation management activities;
and Employ PM10 certified street sweepers

CalPortland | Rillito Facility Four-Factor Analysis Trinity Consultants 4-8
In order to identify all feasible control technologies, the RACT/BACT/LAER Clearinghouse (RBLC) database, WRAP guidance20, as well as technical literature was reviewed. Using these sources, potentially applicable PM10 control technologies for paved road vehicle traffic. Step 1 of the top-down control review is to identify available retrofit control options. Each control technology is described in detail below:
4.3.1.1. Cover Haul Trucks
Covering haul trucks would assist in the reduction of PM10 emissions associated with haul truck travel. Haul truck coverage is a preventive control implemented to prevent material from being deposited onto surface.21 It is one of the control methods recommended by ADEQ PM10 controls to prevent unpaved road spills. 22
4.3.1.2. Pave, Vegetate, or chemically stabilize access points
Paving or vegetating the paved road reduces PM10 emissions. Alternatively, oil or chemical suppressants can be applied and maintained. This control method limits visible dust opacity emissions to 20%.23 For the application of this PM10 control method, a threshold of an average daily vehicle trips of 500 or more must be met.
4.3.1.3. Route Traffic Around and Rapidly Clean up Non‐Preventable Dust.
Routing traffic and rapidly cleaning up non-preventable dust is an efficient PM10 control technology. If the wind or water born deposition is cleaned up within 24 hours, a 100% control efficiency can be applied.24 This assumes that before traffic resumes the entire spill is cleaned up.
4.3.1.4. Require Curbing and Pave or Stabilize Shoulders
An average shoulder width of either 4ft or 8ft can be required to reduce PM10 emissions. Alternatively, curbing adjacent to and contiguous with a paved lane or shoulder can be applied.25 The third control option is construction of intersections, auxiliary entry and exit lanes adjacent and contiguous with a paved roadway. These controls will limit visible dust emissions to 20% dust opacity and maintain stabilize surface.
4.3.1.5. Provide for Storm Water Drainage to Prevent Erosion of Dirt or Sand Roads
Storm water control is recommended for erosion from stormwater washing onto streets. This control method would assist in PM10 reduction associated with paved road travel.
4.3.1.6. Employ PM10 Certified Street Sweepers.
Implementing street sweeping programs with PM10 efficient vacuum units (14-day frequency) can reduce paved road PM10 emissions by up to 26%.26 PM10 vacuum sweeping is a mitigative control that removes surface deposition by entraining particles in a moving air stream.27 The removed particles are collected in a hopper and
20 Per “Supplementary Information for Four Factor Analyses by WRAP States”, May 2009. 21 WRAP Fugitive Dust Handbook Section 5, Table 5.5, https://www.wrapair.org/forums/dejf/fdh/content/Ch5-Paved_Roads_Rev06.pdf 22 ADEQ Draft List of PM10 for non-point source sectors, paved road dust and unpaved road dust 23 WRAP Fugitive Dust Handbook Section 5, Table 5.6, https://www.wrapair.org/forums/dejf/fdh/content/Ch5-Paved_Roads_Rev06.pdf 24 Ibid, Table 5.5 25 WRAP Fugitive Dust Handbook Section 5, Table 5.6, https://www.wrapair.org/forums/dejf/fdh/content/Ch5-Paved_Roads_Rev06.pdf 26 Ibid 27 EPA Control of Open Fugitive Dust Sources, page 2-22

CalPortland | Rillito Facility Four-Factor Analysis Trinity Consultants 4-9
a filter system in an open loop exhausts the air. Alternatively, a regenerative sweep can be employed where the air is continuously recycled. For efficient PM10 removal, the sweepers are equipped with gutter and other brooms. 28
4.3.2. Elimination of Technically Infeasible Control Options
Step 2 of the top-down control review is to eliminate technically infeasible PM10 control options that were identified in the first step. The technical feasibility of each control option is reviewed below.
4.3.2.1. Cover Haul Trucks Feasibility
Covers are not available to accommodate the size of the haul trucks at CalPortland. In addition, requiring operators to cover haul trucks would pose a safety hazard as they would have to exit the vehicles in order to roll the cover down. There aren’t any known implementations of covering haul trucks.
4.3.2.2. Pave, Vegetate, Or Chemically Stabilize Access Points Feasibility
CalPortland has already implemented this control methodology; therefore, is a technically feasible option.
4.3.2.3. Route Traffic and Rapidly Clean Up Non‐Preventable Dust Feasibility
CalPortland is required by PC MACT to clean-up any clinker spills within three days29, but CalPortland conducts clean-up of spills daily, as necessary. Increased clean-up frequencies do not represent a feasible control technology as the implementation of new routes for rerouting traffic would prevent efficient vehicle traffic along the roadways. The paved roadways are in space confined areas as well, which would severely restrict operations if traffic would need to be stopped at an increased frequency in order to clean up dust spills.
4.3.2.4. Require Curbing and Pave or Stabilize Shoulders Feasibility
The weight and intensity of haul truck traffic would quickly destroy any stabilizing shoulders on paved roads. As a such, frequent replacement of the pavement or stabilization of the shoulders would be required since it would be quickly be degraded by the weight and movement of the trucks. Due to these considerations, this is not a technically feasible control option.
4.3.2.5. Provide for Storm Drainage to Prevent Erosion of Dirt or Sand Feasibility
This control technology is already being implemented at the Facility and is a technically feasible control technology.
4.3.2.6. Employ PM10 Certified Street Sweepers Feasibility
Application of PM10 certified street sweepers is a technically feasible option and can be implemented to reduce PM10 emissions. However, PM10 certified street sweepers can have internal cementation issues with the addition of water to the dry materials normally present at cement plants.
28 Ibid 29 Pursuant to Permit No. 61522, Condition IV.B.5

CalPortland | Rillito Facility Four-Factor Analysis Trinity Consultants 4-10
4.3.3. Rank of Remaining Control Technologies Based on Control Effectiveness
Step 3 of the top-down control review is to rank the technically feasible options according to effectiveness. Table 4-2 provides a ranking of the control levels for the controls listed in the previous section.
Table 4-2. Control Effectiveness of Technically Feasible Unpaved Road Travel PM10 Control Technologies
Control Technology Estimated Control Level (%)
Provide for storm water drainage to prevent erosion of dirt or sand
Base Case
Pave, vegetate, or chemically stabilize access points where unpaved traffic surfaces adjoin paved roads
Base Case
Employ PM10 certified street sweepers 26%1
1 Per WRAP Fugitive Dust Handbook Section 5, Table 5.5
4.3.4. Evaluation of Impacts for Remaining Control Technologies
The fourth step of the top-down control review is the impact analysis. The impact analysis considers the:
Cost of compliance; Time necessary to comply with the control; Energy impacts and non-air quality impacts; and The remaining useful life of the source.
Given that providing for storm water drainage to prevent erosion of dirt or sand, and paving, vegetating, or chemically stabilizing access points where unpaved traffic surfaces adjoin paved roads are all currently being implemented, these control technologies are considered cost infeasible.
4.3.5. Cost of Compliance
The capital cost associated with obtaining PM10 certified street sweepers is $250,000, which represents a $19,638 annualized cost at a 7.86% recovery cost factor. Additional operating costs include administration, taxes, and insurance, and the fixed operating cost of operating the street sweeper. These costs contribute $10,000 and $12,500 annually, respectively. Therefore, based on an annual cost of $42,138 and an associated PM10 reduction of 2.75 tpy, the cost of compliance for the implementation of certified PM10 street sweepers is $15,333/ton.
4.3.6. Timing of Compliance
The estimated time of compliance is 3 years which is based on procurement of equipment and implementation of new operations.
4.3.7. Energy Impacts and Non-Air Environmental Quality Impacts
The reduction of PM10 emissions would see an increase in other criteria pollutants and greenhouse gases from the additional tailpipe emissions.

CalPortland | Rillito Facility Four-Factor Analysis Trinity Consultants 4-11
4.3.8. Remaining Useful Life
CalPortland estimates that the source and controls will remain in service for a 20-year amortization period.
Conclusion
It is cost infeasible to implement a certified PM10 street sweeper at the Facility. While the annual costs are relatively low compared to other control technologies, the amount of PM10 that is controlled by the street sweeper is also low, and the reduction in a minimal amount of PM10 emissions is economically infeasible.
4.4. MATERIAL HANDLING – PM10 CONTROLS
Identification of Potential Control Technologies
CalPortland reviewed the feasibility of installing the following control technologies for reduction of PM10 from material handling sources:
Water Sprays Baghouse Full or Partial Enclosure
In order to identify all feasible control technologies, the RACT/BACT/LAER Clearinghouse (RBLC) database, WRAP guidance30, as well as technical literature was reviewed. Using these sources, potentially applicable PM10 control technologies for material drops were identified based on the principles of control technology and engineering experience for material handling. Each control technology is described in detail below.
4.4.1.1. Water Sprays
Water Sprays are commonly used to increase the moisture content of the material. If continuously applied the moisture content will increase leading to a reduction of ambient PM10 concentrations.
4.4.1.2. Baghouse
Fabric filter baghouses work by filtering fugitive PM10 emissions through a filter bag. The collected particles are periodically removed from the bag through a pulse jet or reverse flow mechanism.
4.4.1.3. Full or Partial Enclosure
Full or partial enclosure is commonly applied as a control measure for material drops. This control method can be as efficient as 90% at reducing PM10 emissions. 31
4.4.2. Elimination of Technically Infeasible Control Options
Step 2 of the top-down control review is to eliminate technically infeasible PM10 control options that were identified in the first step.
30 Per “Supplementary Information for Four Factor Analyses by WRAP States”, May 2009. 31
CalPortland | Rillito Facility Four-Factor Analysis Trinity Consultants 4-12
The technical feasibility of each of the control options identified in the previous section is reviewed below.
4.4.2.1. Water Sprays Feasibility
The location and operations of the material drops impedes the ability to apply additional controls. Water sprays are not a technically feasible control for this analysis. The materials without control cannot become damp because the material will clump and cause issues with operations. Additional moisture affects the quality of the product, it causes plugging in the pre-heater tower, and causes other process related difficulties that in the long run will add more NOx and SOx due to the moisture that would have to be driven off and additional process upsets that cause excess emissions with a breakdown. Additionally, for a source like Clinker Conveyor Bypass (Truck) – Clinker Conveyor Bypass Bin to Truck Transfer, water cannot be applied to clinker. Lastly, most quarry material transfers would require additional water trucks to water loading material into the haul truck at the rock face. These trucks would generate more dust, NOx, and CO emissions for each truck.
4.4.2.2. Full Enclosure Feasibility
The location of the material drops impedes the ability to apply additional controls. This is not technically feasible control for this analysis. For example, the Alumina at Plant (Loader) – Loader to D4 Hopper transfer point cannot be enclosed, as enclosing this process for a baghouse is not physically feasible as there would be no way to get the material into the hopper. Additionally, spraying this material causes clogs/clumps in the hopper, on the conveyors, and in the storage bin.
4.4.2.3. Baghouse Feasibility
The location and operations of the material drops impedes the ability to apply additional controls. This is not technically feasible control for this analysis.
4.4.3. Rank of Remaining Control Technologies Based on Control Effectiveness
There are no technologically feasible controls.
4.4.4. Evaluation of Impacts for Remaining Control Technologies
The cost of compliance for control technology was not estimated as no technically feasible controls were identified.
4.5. WIND EROSION – IRON STOCKPILE – PM10 CONTROLS This section presents the stepwise review of control options for PM10 for wind erosion from the iron stockpile at the Facility.
4.5.1. Identification of Potential Control Technologies
CalPortland reviewed the feasibility of installing the following control technologies for reduction of PM10 from iron stockpile wind erosion:
Applying water;

CalPortland | Rillito Facility Four-Factor Analysis Trinity Consultants 4-13
Applying chemical dust suppressant; Erecting artificial windbreak; Planting trees or shrubs as windbreak; Compacting piles; and Covering piles with tarps.
In order to identify all feasible control technologies, the RBLC database, WRAP guidance32, as well as technical literature was reviewed. Using these sources, potentially applicable PM10 control technologies for windblown dust from stockpiles were identified based on the principles of control technology and engineering experience. Each control technology is described in detail below.33
4.5.1.1. Additional Water Application
Applying additional water to the stockpile would assist in the reduction of PM10 emissions associated with wind erosion. Applying water to the surface of the stockpile stabilizes the erodible surface by increasing the moisture content of the material being stored. 34 Watering the pile can reduce the PM10 emissions by 90%. 35
4.5.1.2. Applying Chemical Dust Suppressant
Applying chemical dust suppressant would assist in the reduction of PM10 emissions associated with wind erosion. The chemical dust suppressant stabilizes the surface of the material, reducing the amount of wind-blown dust that is generated.
4.5.1.3. Erecting Artificial Windbreak
Erecting an artificial windbreak would assist in the reduction of PM10 emissions associated with windblown dust from the stockpile. A three-sided enclosure with 50% porosity shields the pile from the ambient wind and reduces PM10 emissions by 75%. 36,37
4.5.1.4. Planting Trees or Shrubs as Windbreak
Planting trees or shrubs as windbreak would assist in the reduction of PM10 emissions associated with windblown dust from the stockpile much in the same way an artificial wind-break would.
4.5.1.5. Compacting Piles
Compacting the pile could assist in the reduction of PM10 emissions associated with windblown dust from the stockpile.
32 Per “Supplementary Information for Four Factor Analyses by WRAP States”, May 2009. 33 AP-42 reduction percentages cited in this report were taken from AP-42, Chapter 1, External Combustion Sources, unless otherwise noted.
34 WRAP Fugitive Dust Handbook, 2006 Pg 9-8 35 Fitz, D., K. Bumiller, 2000. Evaluation of Watering to Control Dust in High Winds, J.AWMA, April. 36 WRAP Fugitive Dust Handbook, 2006 Pg 9-8 37 Sierra Research, 2003. Final BACM Technological and Economic Feasibility Analysis, report prepared for the San Joaquin Valley Unified Air Pollution Control District, March 21.

CalPortland | Rillito Facility Four-Factor Analysis Trinity Consultants 4-14
4.5.1.6. Covering Piles with Tarps
Covering the stockpile would assist in the reduction of PM10 emissions associated with windblown dust. Utilizing tarps to cover piles provides shelter from the ambient wind and can provide a control efficiency of 90% for PM10
emissions. 35
4.5.2. Elimination of Technically Infeasible Control Options
Step 2 of the top-down control review is to eliminate technically infeasible PM10 control options that were identified in the first step. The technical feasibility of each of the control options identified in the previous section is reviewed below.
4.5.2.1. Water Application Feasibility
Sonoran hematite is a very fine material, and water application would cause clumping of the material. Clumping causes operational issues, such as clogging and plugging of process equipment. Therefore, water application is not a technically feasible control method.
4.5.2.2. Chemical Dust Suppressant Feasibility
All the issues that exist with water spraying also exist for chemical dust suppressants. Therefore, this not a technically feasible option.
4.5.2.3. Erection of Artificial Windbreak Feasibility
The iron stockpile was moved to a horseshoe pit with windbreak on three sides and this control is currently being implemented. Therefore, this is a technically feasible control option representing 75% control.
4.5.2.4. Planting Trees or Shrubs as Windbreak Feasibility
The artificial windbreak represents a 75% control at no cost, making it the most cost-effective control technology. Planting trees or shrubs as a windbreak would represent a 25% control efficiency38 at a greater cost. Therefore, planting trees or shrubs is not evaluated further as a technically feasible control option as a windbreak since a more effective windbreak control technology has already been implemented.
4.5.2.5. Pile Compaction Feasibility
The iron stockpile is actively used with material being added to and removed from the area. This makes pile compaction operationally infeasible to implement thereby rendering it a technically infeasible control option.
4.5.2.6. Pile Coverage Feasibility
As noted above in section 4.5.2.5, the iron stockpile is actively used with material being added and removed frequently. Coverage of the pile with a tarp or other means will impede with operational activities at CalPortland; therefore, this is not a feasible control technology.
4.5.3. Rank of Remaining Control Technologies Based on Control Effectiveness
The currently implemented and operating PM10 controls are the most cost-effective option for PM10 emission reduction and control at this facility.
38 25% control efficiency according to WRAP Fugitive Dust Handbook.
CalPortland | Rillito Facility Four-Factor Analysis Trinity Consultants 4-15
4.5.4. Evaluation of Impacts for Remaining Control Technologies
The artificial windbreak is the only feasible control technology. The cost of compliance for control technology was not estimated as the use of an artificial windbreak has already been implemented and represents a reduction of 6.31 tpy of PM10 at no additional operating cost. In the upcoming Title V renewal application (due in September 2020) CalPortland will update the permit to include the artificial windbreak as an enforceable requirement for the iron stockpile.
4.6. FINISH MILL BAGHOUSES – PM10 CONTROLS This section presents the stepwise review of control options for the reduction of PM10 emissions from the D2-PC and D3-1-DC2 finish mill baghouses.
4.6.1. Identification of Potential Control Technologies
CalPortland reviewed the feasibility of installing the following control technologies for reduction of PM10 from the finish mill baghouses:
Baghouses with Lower Grain Loading Rates
In order to identify all feasible control technologies, the RACT/BACT/LAER Clearinghouse (RBLC) database, WRAP guidance39, as well as technical literature was reviewed. Using these sources, potentially achievable PM10 grain loading rates were identified based on the principles of control technology and engineering experience for finish mills. Step 1 of the top-down control review is to identify available retrofit control options. Each control technology is described in detail below:
4.6.1.1. Baghouse
Fabric filter baghouses work by filtering fugitive PM10 emissions through a filter bag. The collected particles are periodically removed from the bag through a pulse jet or reverse flow mechanism.
4.6.2. Elimination of Technically Infeasible Control Options
Step 2 of the top-down control review is to eliminate technically infeasible PM10 control options that were identified in the first step. The technical feasibility of each of the control options identified in the previous section is reviewed below.
4.6.2.1. Lowering Grain Loading Rate Feasibility
CalPortland already utilizes the D2-PC and D3-1-DC2 baghouses for the finish mills. The tested grain loading rates are low, therefore CalPortland is assuming the baghouses currently operate under a vendor guaranteed grain loading rate of 0.01 gr/dscf. Based on review of other similar sources at other portland cement facilities, a grain loading rate of 0.005 gr/dscf is achievable. Therefore, this control technology is feasible.
39 Per “Supplementary Information for Four Factor Analyses by WRAP States”, May 2009.
CalPortland | Rillito Facility Four-Factor Analysis Trinity Consultants 4-16
4.6.3. Rank of Remaining Control Technologies Based on Control Effectiveness
There is only one feasible control technology that was reviewed for the finish mill baghouses.
4.6.4. Evaluation of Impacts for Remaining Control Technologies
The fourth step of the top-down control review is the impact analysis. The impact analysis considers the:
Cost of compliance; Time necessary to comply with the control; Energy impacts and non-air quality impacts; and The remaining useful life of the source.
4.6.5. Cost of Compliance
The cost of implementing lower grain loading baghouses at each of the finish mills are reviewed separately.
D2‐PC Baghouse Cost
The total annual cost of operating a new baghouse with a lower grain loading rate for D2-PC is estimated at $535,231 based on Section 6, Chapter 1 of EPA’s Control Cost Manual40. The calculations associated with determining the annual cost are attached in Appendix A. These calculations do not include additional costs associated with the dismantling and removal of the existing baghouse, which would be difficult and costly due to its location. Given an assumed existing grain loading rate of 0.01 gr/dscf reduced to an achievable grain loading rate of 0.005 gr/dscf, this baghouse would achieve an 18.26 tpy reduction of PM10 emissions. Therefore, the cost of compliance for the implementation of a lower grain loading rate is $29,310 per ton of PM10 reduced.
D3‐1‐DC2 Baghouse Cost
The total annual cost of operating a new baghouse with a lower grain loading rate for D3-1-DC2 is estimated at $487,584 based on Section 6, Chapter 1 of EPA’s Control Cost Manual41. The calculations associated with determining the annual cost are attached in Appendix A. These calculations do not include additional costs associated with the dismantling and removal of the existing baghouse, which would be difficult and costly due to its location. Given an assumed existing grain loading rate of 0.01 gr/dscf reduced to an achievable grain loading rate of 0.005 gr/dscf, this baghouse would achieve a 15.85 tpy reduction of PM10 emissions. Therefore, the cost of compliance for the implementation of a lower grain loading rate is $30,763 per ton of PM10 reduced.
4.6.6. Timing of Compliance
The estimated time of compliance is 3 years which is based on procurement of equipment and implementation of new operations.
40 https://www3.epa.gov/ttn/ecas/docs/cs6ch1.pdf 41 https://www3.epa.gov/ttn/ecas/docs/cs6ch1.pdf

CalPortland | Rillito Facility Four-Factor Analysis Trinity Consultants 4-17
4.6.7. Energy Impacts and Non-Air Quality Impacts
No associated energy and non-air quality impacts are assessed because the control technology is simply an improved version of controls that already exist at the sources.
4.6.8. Remaining Useful Life
CalPortland estimates that the source and controls will remain in service for a 20-year amortization period.
Conclusion
It is cost infeasible to implement lower grain loading rate baghouses at the finish mills. The annual costs are high due to the requirement to install new baghouses and the reduction in PM10 emissions is low as the baghouses currently operate at low grain loading rates.
4.7. CLINKER COOLER – PM10 CONTROLS This section presents the stepwise review of control options for the reduction of PM10 emissions from the H2-GB Kiln 4 Clinker Cooler baghouse.
4.7.1. Identification of Potential Control Technologies
CalPortland reviewed the feasibility of installing the following control technologies for reduction of PM10 from the Kiln 4 clinker cooler baghouse:
Baghouses with Lower Grain Loading Rates
In order to identify all feasible control technologies, the RACT/BACT/LAER Clearinghouse (RBLC) database, WRAP guidance42, as well as technical literature was reviewed. Using these sources, potentially achievable PM10 grain loading rates were identified based on the principles of control technology and engineering experience for clinker coolers. Step 1 of the top-down control review is to identify available retrofit control options. Each control technology is described in detail below:
4.7.1.1. Baghouse
Fabric filter baghouses work by filtering fugitive PM10 emissions through a filter bag. The collected particles are periodically removed from the bag through a pulse jet or reverse flow mechanism.
4.7.2. Elimination of Technically Infeasible Control Options
Step 2 of the top-down control review is to eliminate technically infeasible PM10 control options that were identified in the first step. The technical feasibility of each of the control options identified in the previous section is reviewed below.
42 Per “Supplementary Information for Four Factor Analyses by WRAP States”, May 2009.

CalPortland | Rillito Facility Four-Factor Analysis Trinity Consultants 4-18
4.7.2.1. Lowering Grain Loading Rate Feasibility
CalPortland already utilizes the H2-GB baghouse for the clinker cooler. The tested grain loading rates are low, therefore CalPortland is assuming the baghouse currently operates under a vendor guaranteed grain loading rate of 0.01 gr/dscf. Based on review of other similar sources at other portland cement facilities, a grain loading rate of 0.005 gr/dscf is achievable. Therefore, this control technology is feasible.
4.7.3. Rank of Remaining Control Technologies Based on Control Effectiveness
There is only one feasible control technology that was reviewed for the Kiln 4 clinker cooler baghouse.
4.7.4. Evaluation of Impacts for Remaining Control Technologies
The fourth step of the top-down control review is the impact analysis. The impact analysis considers the:
Cost of compliance; Time necessary to comply with the control; Energy impacts and non-air quality impacts; and The remaining useful life of the source.
4.7.5. Cost of Compliance
The total annual cost of operating a new baghouse with a lower grain loading rate for H2-GB is estimated at $638,954 based on Section 6, Chapter 1 of EPA’s Control Cost Manual43. The calculations associated with determining the annual cost are attached in Appendix A. These calculations do not include additional costs associated with the dismantling and removal of the existing baghouse, which would be difficult and costly due to its location. Given an assumed existing grain loading rate of 0.01 gr/dscf reduced to an achievable grain loading rate of 0.005 gr/dscf, this baghouse would achieve a 21.19 tpy reduction of PM10 emissions. Therefore, the cost of compliance for the implementation of a lower grain loading rate is $30,149 per ton of PM10 reduced.
4.7.6. Timing of Compliance
The estimated time of compliance is 3 years which is based on procurement of equipment and implementation of new operations.
4.7.7. Energy Impacts and Non-Air Quality Impacts
No associated energy and non-air quality impacts are assessed because the control technology is simply an improved version of controls that already exist at the source.
4.7.8. Remaining Useful Life
CalPortland estimates that the source and controls will remain in service for a 20-year amortization period.
43 https://www3.epa.gov/ttn/ecas/docs/cs6ch1.pdf
CalPortland | Rillito Facility Four-Factor Analysis Trinity Consultants 4-19
Conclusion
It is cost infeasible to implement a lower grain loading rate baghouse at the Kiln 4 clinker cooler. The annual costs are high due to the requirement to install a new baghouse and the reduction in PM10 emissions is low as the baghouse currently operates at a low grain loading rate.
4.8. QUARRY CRUSHER – PM10 CONTROLS This section presents the stepwise review of control options for the reduction of PM10 emissions from the B2-DC1 Quarry Crusher baghouse.
4.8.1. Identification of Potential Control Technologies
CalPortland reviewed the feasibility of installing the following control technologies for reduction of PM10 from the B2-DC1 baghouse:
Baghouses with Lower Grain Loading Rates
In order to identify all feasible control technologies, the RACT/BACT/LAER Clearinghouse (RBLC) database, WRAP guidance44, as well as technical literature was reviewed. Using these sources, potentially achievable PM10 grain loading rates were identified based on the principles of control technology and engineering experience for quarry crusher baghouses. Step 1 of the top-down control review is to identify available retrofit control options. Each control technology is described in detail below:
4.8.1.1. Baghouse
Fabric filter baghouses work by filtering fugitive PM10 emissions through a filter bag. The collected particles are periodically removed from the bag through a pulse jet or reverse flow mechanism.
4.8.2. Elimination of Technically Infeasible Control Options
Step 2 of the top-down control review is to eliminate technically infeasible PM10 control options that were identified in the first step. The technical feasibility of each of the control options identified in the previous section is reviewed below.
4.8.2.1. Lowering Grain Loading Rate Feasibility
CalPortland already utilizes the B2-DC1 baghouse for the quarry crusher. The tested grain loading rates are low, therefore CalPortland is assuming the baghouse currently operates under a vendor guaranteed grain loading rate of 0.05 gr/dscf. Based on review of other similar sources at other portland cement facilities, a grain loading rate of 0.005 gr/dscf is achievable. Therefore, this control technology is feasible.
4.8.3. Rank of Remaining Control Technologies Based on Control Effectiveness
There is only one feasible control technology that was reviewed for the quarry crusher baghouse.
44 Per “Supplementary Information for Four Factor Analyses by WRAP States”, May 2009.

CalPortland | Rillito Facility Four-Factor Analysis Trinity Consultants 4-20
4.8.4. Evaluation of Impacts for Remaining Control Technologies
The fourth step of the top-down control review is the impact analysis. The impact analysis considers the:
Cost of compliance; Time necessary to comply with the control; Energy impacts and non-air quality impacts; and The remaining useful life of the source.
4.8.5. Cost of Compliance
The total annual cost of operating a new baghouse with a lower grain loading rate for B2-DC1 is estimated at $171,346 based on Section 6, Chapter 1 of EPA’s Control Cost Manual45. The calculations associated with determining the annual cost are attached in Appendix A. These calculations do not include additional costs associated with the dismantling and removal of the existing baghouse, which would be difficult and costly due to its location. Given an assumed existing grain loading rate of 0.05 gr/dscf reduced to an achievable grain loading rate of 0.005 gr/dscf, this baghouse would achieve a 5.92 tpy reduction of PM10 emissions. Therefore, the cost of compliance for the implementation of a lower grain loading rate is $28,966 per ton of PM10 reduced.
4.8.6. Timing of Compliance
The estimated time of compliance is 3 years which is based on procurement of equipment and implementation of new operations.
4.8.7. Energy Impacts and Non-Air Quality Impacts
No associated energy and non-air quality impacts are assessed because the control technology is simply an improved version of controls that already exist at the source.
4.8.8. Remaining Useful Life
CalPortland estimates that the source and controls will remain in service for a 20-year amortization period.
Conclusion
It is cost infeasible to implement a lower grain loading rate baghouse at the quarry crusher. The annual costs are high due to the requirement to install a new baghouse and the reduction in PM10 emissions is low as the baghouse currently operates at a low grain loading rate.
4.9. BLASTING – NOX CONTROLS
CalPortland hires contractors to do the mixing and preparation of the blasting medium. The blasting medium is pre-mixed, and the formula cannot be altered by CalPortland. Additionally, there are safety concerns with regards
45 https://www3.epa.gov/ttn/ecas/docs/cs6ch1.pdf

CalPortland | Rillito Facility Four-Factor Analysis Trinity Consultants 4-21
to implementing controls during the blasting operations. Also, no blasting control methods were available through the RBLC; therefore, there are no technically feasible NOx control options for quarry blasting.

CalPortland | Rillito Facility Four-Factor Analysis Trinity Consultants 5-1
5. SUMMARY & CONCLUSION
CalPortland has reviewed the four factors for each of the PM10 and NOx sources identified by ADEQ and found that all available control technologies are either technically or economically infeasible, except for implementation of a three-sided enclosure for the Sonoran hematite stockpile. The table below summarizes the findings for each source.
Unit Process Description Pollutant Proposed Control
Post Control
Emission Rate (tpy)
Proposed Emission Rate Averaging Period
Clinker to overhead crane building PM10 None economically feasible N/A N/A
Unpaved Roads PM10 None economically feasible N/A N/A Paved Roads PM10 None economically feasible N/A N/A
Material Drops PM10 None technically feasible N/A N/A Wind Erosion PM10 Artificial Wind-Break 6.31 Annual
D2-PC Baghouse PM10 None economically feasible N/A N/A D3-1-DC2 Baghouse PM10 None economically feasible N/A N/A
H2-GB Baghouse PM10 None economically feasible N/A N/A B2-DC1 Baghouse PM10 None economically feasible N/A N/A
Blasting NOx None technically feasible N/A N/A Additionally, Appendix B contains information specific to each source and control technology, outlining the associated factors for each.

CalPortland | Rillito Facility Four-Factor Analysis Trinity Consultants
APPENDIX A: BAGHOUSE COST CALCULATIONS

Table1.CapitalCostsforFabricFilterSystematD2FinishMillD2‐PCBaghouseCostItem Factor Cost
Purchased equipment cost Fabric Filter (with insulation) EC A $266,352.00Bags and cages A 44,195.89$ Auxiliary equipment A 50,000.00$
Sum=A 360,547.89$
Instrumentation 0.10 A 36,054.79$ Sales taxes 0.03 A 10,816.44$ Freight 0.05 A 18,027.39$ Purchased Equipment Cost, PEC B=1.18 A 425,446.50$
Foundations & supports 0.04 B 17,017.86$ Handling & erection 0.50 B 212,723.25$ Electrical 0.08 B 34,035.72$ Piping 0.01 B 4,254.47$ Insulation for ductwork 0.07 B 29,781.26$ Painting 0.04 B 17,017.86$ Direct installation cost 0.74 B 314,830.41$
Site preparation As required, SP -Buildings As required, Bldg. -
TotalDirectCost 1.74 B + SP + Bldg. 740,276.92$IndirectCosts(installation)Engineering 0.10 B 42,544.65$ Construction and field expense 0.20 B 85,089.30$ Contractor fees 0.10 B 42,544.65$ Start-up 0.01 B 4,254.47$ Performance test 0.01 B 4,254.47$ Contingencies 0.03 B 12,763.40$
TotalIndirectCost,IC 0.45 B 191,450.93$TotalCapitalInvestment=DC+IC 2.19 B + SP + Bldg. 931,728$
DirectInstallationCosts
DirectCosts

Table2.AnnualCostsforFabricFilterSystemCostItem Calculations Cost Units References
DirectAnnualCosts,DC
Operator 26,265.41$ $ dollars EPA cost manual, Table 1.11, page 1-55Supervisor 15% of operator 3,939.81$ $ dollars EPA cost manual, Table 1.11, page 1-55Operating materials -
Labor 13,497.92$ $ dollarsMaterial 100% of maintenance labor 13,497.92$ $ dollarsCB bag and cages X 1.081 47,731.56$ $ dollars Initial bag cost including taxes and freight ($)Maintenance labor rate 29.65$ $ dollars Including overhead, EPA cost manual, page 1-5210 min per bag (rounded up) 298 hoursCL 8,835.70$ $ dollars EPA cost manual, page 1-52CRFB Capital recovery factor for a 4.75% interest rate and a 2 year bag life 53.59% factor EPA cost manual Equation 1.13, page 1-46Replacement parts, bags 4,750.95$ $/year EPA cost manual, Equation 1.13, page 1-46
Electricity 103,498.11$ $ dollars EPA cost manual, Equation 1.14, page 1-47
Compressed air (dried and filtered) 2 25,565.40$ $ dollars EPA cost manual, Table 1.11, page 1-55WasteDisposal as $25/ton on-site for essentially 100% collection 456.53$ $ dollars EPA cost manual, Table 1.11, page 1-56
TotalDC (rounded) 191,472$ $ dollars
Overhead 60% of sum of operating, supv., & maint. labor & maint. Materials 34,320.64$ $ dollars EPA cost manual, Table 1.11, page 1-56Administrative Charges 2% of Total Capital Investment 18,634.56$ $ dollars EPA cost manual, Table 1.11, page 1-57Property Tax 1% of Total Capital Investment 9,317.28$ $ dollars EPA cost manual, Table 1.11, page 1-58Insurance 1% of Total Capital Investment 9,317.28$ $ dollars EPA cost manual, Table 1.11, page 1-59Capital Recovery CRF*(TCI-CB-CL) 82,606.41$ $ dollars EPA cost manual, Table 1.11, page 1-60TotalIC(rounded) 154,196.16$ EPA cost manual, Equation 1.16TotalAnnualCost(1998) 345,668$ CalculatedTotalAnnualCost(2018) 535,231$ Calculated1. The 1.08 factor is for freight and sales taxes2 Typical consumption is about 2 scfm/1,000 cfm of gas filtered, page 1-483 The capital recovery cost factor, CRF, is a function of the fabric filter or equipment life and the opportunity cost of the capital (i.e., interest rate). For example, for a 20-year equipment life and a 4.75% interest rate, CRF = 0.07855
Operatinglabor
IndirectAnnualCosts,IC
Maintenance
Utilities
2 ℎ𝑠ℎ𝑖𝑓𝑡
3 𝑠ℎ𝑖𝑓𝑡𝑠𝑑𝑎𝑦
254 𝑑𝑎𝑦𝑠𝑦𝑟
$17.26ℎ
1 ℎ𝑠ℎ𝑖𝑓𝑡
3 𝑠ℎ𝑖𝑓𝑡𝑠𝑑𝑎𝑦
254 𝑑𝑎𝑦𝑠𝑦𝑟
$17.74ℎ
𝐶𝑅𝐶 𝐶 𝐶 𝐶𝑅𝐹
0.000181 140,000 𝑎𝑐𝑓𝑚 10 𝑖𝑛 𝐻 𝑂 6,087 ℎ𝑦𝑟
$ 0.0671𝑘𝑊ℎ
2 𝑠𝑐𝑓𝑚1,000 𝑎𝑐𝑓𝑚 140,000 𝑎𝑐𝑓𝑚
$0.251,000 𝑠𝑐𝑓
60 𝑚𝑖𝑛ℎ
6,087 ℎ𝑦𝑟
0.005 𝑔𝑟𝑓𝑡
1 𝑙𝑏7,000 𝑔𝑟 140,000 𝑓𝑡
60 𝑚𝑖𝑛ℎ
6,087 ℎ𝑦𝑟
1 𝑡𝑜𝑛2,000 𝑙𝑏
$25𝑡𝑜𝑛

ChemicalEngineeringPlantCostIndexYear Index
1985 325.3
1995 381.1
1996 381.7
1997 386.5
1998 389.5
1999 391.8
2000 394.1
2001 394.3
2002 395.6
2003 402.0
2004 444.2
2005 468.2
2006 499.6
2007 525.4
2008 575.4
2009 521.9
2010 550.8
2011 593.2
2012 584.6
2013 567.3
2014 576.1
2015 556.8
2016 541.7
2017 567.5
2018 603.1
2019 ‐
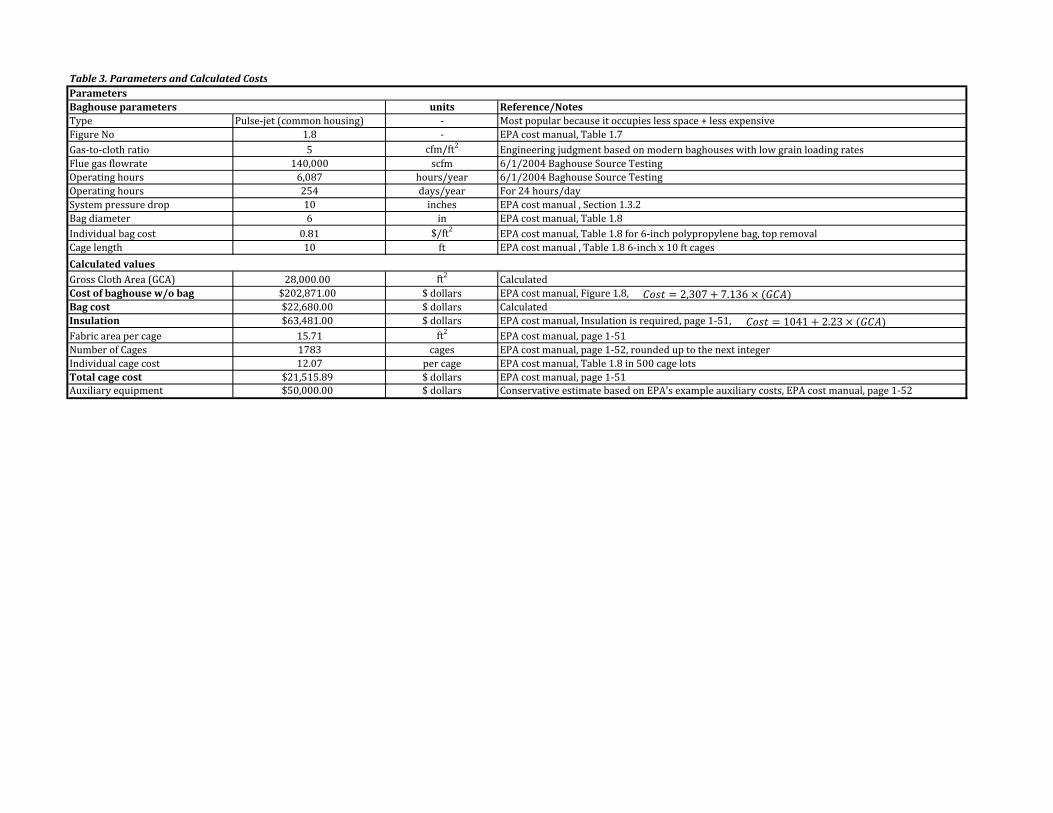
Table3.ParametersandCalculatedCosts
units Reference/NotesType Pulse-jet (common housing) - Most popular because it occupies less space + less expensive Figure No 1.8 - EPA cost manual, Table 1.7Gas-to-cloth ratio 5 cfm/ft2 Engineering judgment based on modern baghouses with low grain loading ratesFlue gas flowrate 140,000 scfm 6/1/2004 Baghouse Source TestingOperating hours 6,087 hours/year 6/1/2004 Baghouse Source TestingOperating hours 254 days/year For 24 hours/daySystem pressure drop 10 inches EPA cost manual , Section 1.3.2Bag diameter 6 in EPA cost manual, Table 1.8 Individual bag cost 0.81 $/ft2 EPA cost manual, Table 1.8 for 6-inch polypropylene bag, top removalCage length 10 ft EPA cost manual , Table 1.8 6-inch x 10 ft cages
Gross Cloth Area (GCA) 28,000.00 ft2 CalculatedCostofbaghousew/obag $202,871.00 $ dollars EPA cost manual, Figure 1.8, Bagcost $22,680.00 $ dollars CalculatedInsulation $63,481.00 $ dollars EPA cost manual, Insulation is required, page 1-51, Fabric area per cage 15.71 ft2 EPA cost manual, page 1-51Number of Cages 1783 cages EPA cost manual, page 1-52, rounded up to the next integer Individual cage cost 12.07 per cage EPA cost manual, Table 1.8 in 500 cage lotsTotalcagecost $21,515.89 $ dollars EPA cost manual, page 1-51Auxiliary equipment $50,000.00 $ dollars Conservative estimate based on EPA's example auxiliary costs, EPA cost manual, page 1-52
Calculatedvalues
ParametersBaghouseparameters
𝐶𝑜𝑠𝑡 2,307 7.136 𝐺𝐶𝐴
𝐶𝑜𝑠𝑡 1041 2.23 𝐺𝐶𝐴

Table1.CapitalCostsforFabricFilterSystematD3FinishMillD3‐1‐DC2BaghouseCostItem Factor Cost
Purchased equipment cost Fabric Filter (with insulation) EC A $217,418.23Bags and cages A 35,972.92$ Auxiliary equipment A 50,000.00$
Sum=A 303,391.15$
Instrumentation 0.10 A 30,339.12$ Sales taxes 0.03 A 9,101.73$ Freight 0.05 A 15,169.56$ Purchased Equipment Cost, PEC B=1.18 A 358,001.56$
Foundations & supports 0.04 B 14,320.06$ Handling & erection 0.50 B 179,000.78$ Electrical 0.08 B 28,640.12$ Piping 0.01 B 3,580.02$ Insulation for ductwork 0.07 B 25,060.11$ Painting 0.04 B 14,320.06$ Direct installation cost 0.74 B 264,921.15$
Site preparation As required, SP -Buildings As required, Bldg -
TotalDirectCost 1.74 B + SP + Bldg 622,922.71$IndirectCosts(installation)Engineering 0.10 B 35,800.16$ Construction and field expense 0.20 B 71,600.31$ Contractor fees 0.10 B 35,800.16$ Start-up 0.01 B 3,580.02$ Performance test 0.01 B 3,580.02$ Contingencies 0.03 B 10,740.05$
TotalIndirectCost,IC 0.45 B 161,100.70$TotalCapitalInvestment=DC+IC 2.19 B + SP + Bldg. 784,023$
DirectInstallationCosts
DirectCosts

Table2.AnnualCostsforFabricFilterSystemCostItem Calculations Cost Units References
DirectAnnualCosts,DC
Operator 28,008.67$ $ dollars EPA cost manual, Table 1.11, page 1-55Supervisor 15% of operator 4,201.30$ $ dollars EPA cost manual, Table 1.11, page 1-55Operating materials -
Labor 14,393.79$ $ dollarsMaterial 100% of maintenance labor 14,393.79$ $ dollarsCB bag and cages X 1.081 38,850.76$ $ dollars Initial bag cost including taxes and freight ($)Maintenance labor rate 29.65$ $ dollars Including overhead, EPA cost manual, page 1-5210 min per bag (rounded up) 242 hoursCL 7,175.30$ $ dollars EPA cost manual, page 1-52CRFB Capital recovery factor for a 4.75% interest rate and a 2 year bag life 53.59% factor EPA cost manual Equation 1.13, page 1-46Replacement parts, bags 3,861.14$ $/year EPA cost manual, Equation 1.13, page 1-46
Electricity 89,832.74$ $ dollars EPA cost manual, Equation 1.14, page 1-47
Compressed air (dried and filtered)2 22,189.87$ $ dollars EPA cost manual, Table 1.11, page 1-55WasteDisposal as $25/ton on-site for essentially 100% collection 396.25$ $ dollars EPA cost manual, Table 1.11, page 1-56
TotalDC (rounded) 177,278$ $ dollars
Overhead 60% of sum of operating, supv., & maint. labor & maint. Materials 36,598.53$ $ dollars EPA cost manual, Table 1.11, page 1-56Administrative Charges 2% of Total Capital Investment 15,680.47$ $ dollars EPA cost manual, Table 1.11, page 1-57Property Tax 1% of Total Capital Investment 7,840.23$ $ dollars EPA cost manual, Table 1.11, page 1-58Insurance 1% of Total Capital Investment 7,840.23$ $ dollars EPA cost manual, Table 1.11, page 1-59Capital Recovery CRF*(TCI-CB-CL) 69,659.57$ $ dollars EPA cost manual, Table 1.11, page 1-60TotalIC(rounded) 137,619.04$ EPA cost manual, Equation 1.16TotalAnnualCost(1998) 314,897$ CalculatedTotalAnnualCost(2018) 487,584$ Calculated1. The 1.08 factor is for freight and sales taxes2 Typical consumption is about 2 scfm/1,000 cfm of gas filtered, page 1-483 The capital recovery cost factor, CRF, is a function of the fabric filter or equipment life and the opportunity cost of the capital (i.e., interest rate). For example, for a 20-year equipment life and a 4.75% interest rate, CRF = 0.07855
Operatinglabor
IndirectAnnualCosts,IC
Maintenance
Utilities
2 ℎ𝑠ℎ𝑖𝑓𝑡
3 𝑠ℎ𝑖𝑓𝑡𝑠𝑑𝑎𝑦
270 𝑑𝑎𝑦𝑠𝑦𝑟
$17.26ℎ
1 ℎ𝑠ℎ𝑖𝑓𝑡
3 𝑠ℎ𝑖𝑓𝑡𝑠𝑑𝑎𝑦
270 𝑑𝑎𝑦𝑠𝑦𝑟
$17.74ℎ
𝐶𝑅𝐶 𝐶 𝐶 𝐶𝑅𝐹
0.000181 113,952 𝑎𝑐𝑓𝑚 10 𝑖𝑛 𝐻 𝑂 6,491 ℎ𝑦𝑟
$ 0.0671𝑘𝑊ℎ
2 𝑠𝑐𝑓𝑚1,000 𝑎𝑐𝑓𝑚 113,952 𝑎𝑐𝑓𝑚
$0.251,000 𝑠𝑐𝑓
60 𝑚𝑖𝑛ℎ
6,491 ℎ𝑦𝑟
0.005 𝑔𝑟𝑓𝑡
1 𝑙𝑏7,000 𝑔𝑟 113,952 𝑓𝑡
60 𝑚𝑖𝑛ℎ
6.941 ℎ𝑦𝑟
1 𝑡𝑜𝑛2,000 𝑙𝑏
$25𝑡𝑜𝑛
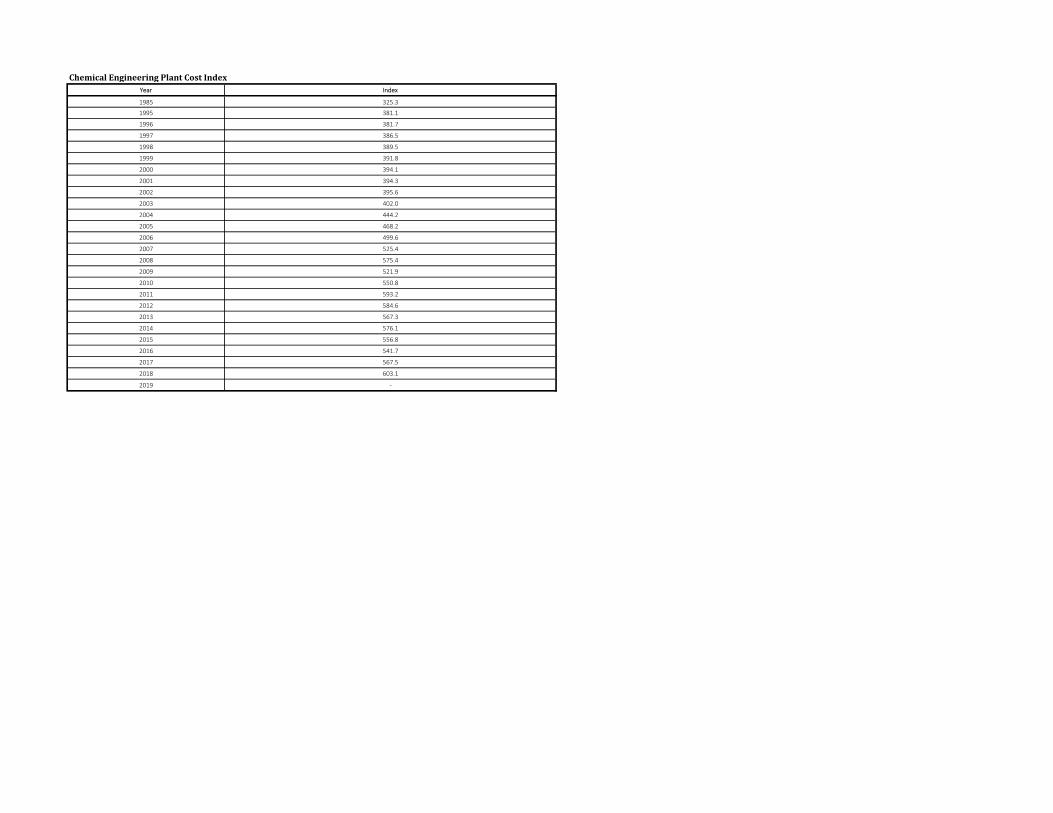
ChemicalEngineeringPlantCostIndexYear Index
1985 325.3
1995 381.1
1996 381.7
1997 386.5
1998 389.5
1999 391.8
2000 394.1
2001 394.3
2002 395.6
2003 402.0
2004 444.2
2005 468.2
2006 499.6
2007 525.4
2008 575.4
2009 521.9
2010 550.8
2011 593.2
2012 584.6
2013 567.3
2014 576.1
2015 556.8
2016 541.7
2017 567.5
2018 603.1
2019 ‐
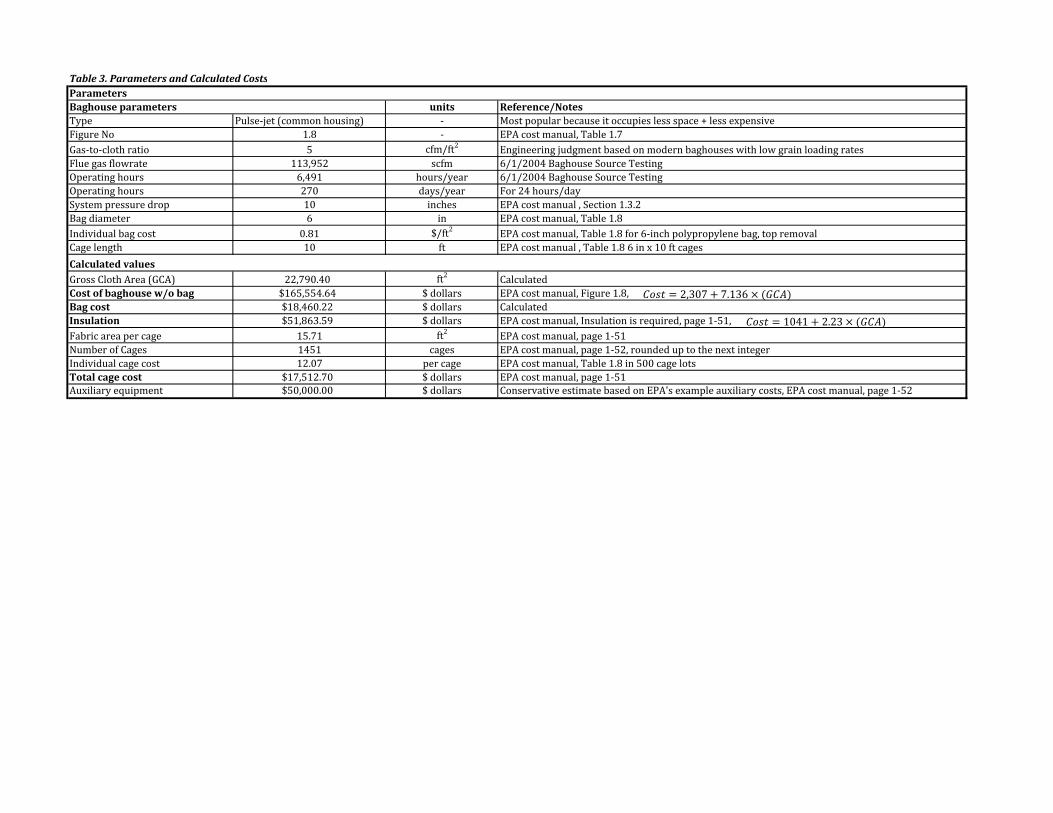
Table3.ParametersandCalculatedCosts
units Reference/NotesType Pulse-jet (common housing) - Most popular because it occupies less space + less expensive Figure No 1.8 - EPA cost manual, Table 1.7Gas-to-cloth ratio 5 cfm/ft2 Engineering judgment based on modern baghouses with low grain loading ratesFlue gas flowrate 113,952 scfm 6/1/2004 Baghouse Source TestingOperating hours 6,491 hours/year 6/1/2004 Baghouse Source TestingOperating hours 270 days/year For 24 hours/daySystem pressure drop 10 inches EPA cost manual , Section 1.3.2Bag diameter 6 in EPA cost manual, Table 1.8 Individual bag cost 0.81 $/ft2 EPA cost manual, Table 1.8 for 6-inch polypropylene bag, top removalCage length 10 ft EPA cost manual , Table 1.8 6 in x 10 ft cages
Gross Cloth Area (GCA) 22,790.40 ft2 CalculatedCostofbaghousew/obag $165,554.64 $ dollars EPA cost manual, Figure 1.8, Bagcost $18,460.22 $ dollars CalculatedInsulation $51,863.59 $ dollars EPA cost manual, Insulation is required, page 1-51, Fabric area per cage 15.71 ft2 EPA cost manual, page 1-51Number of Cages 1451 cages EPA cost manual, page 1-52, rounded up to the next integer Individual cage cost 12.07 per cage EPA cost manual, Table 1.8 in 500 cage lotsTotalcagecost $17,512.70 $ dollars EPA cost manual, page 1-51Auxiliary equipment $50,000.00 $ dollars Conservative estimate based on EPA's example auxiliary costs, EPA cost manual, page 1-52
Calculatedvalues
ParametersBaghouseparameters
𝐶𝑜𝑠𝑡 2,307 7.136 𝐺𝐶𝐴
𝐶𝑜𝑠𝑡 1041 2.23 𝐺𝐶𝐴
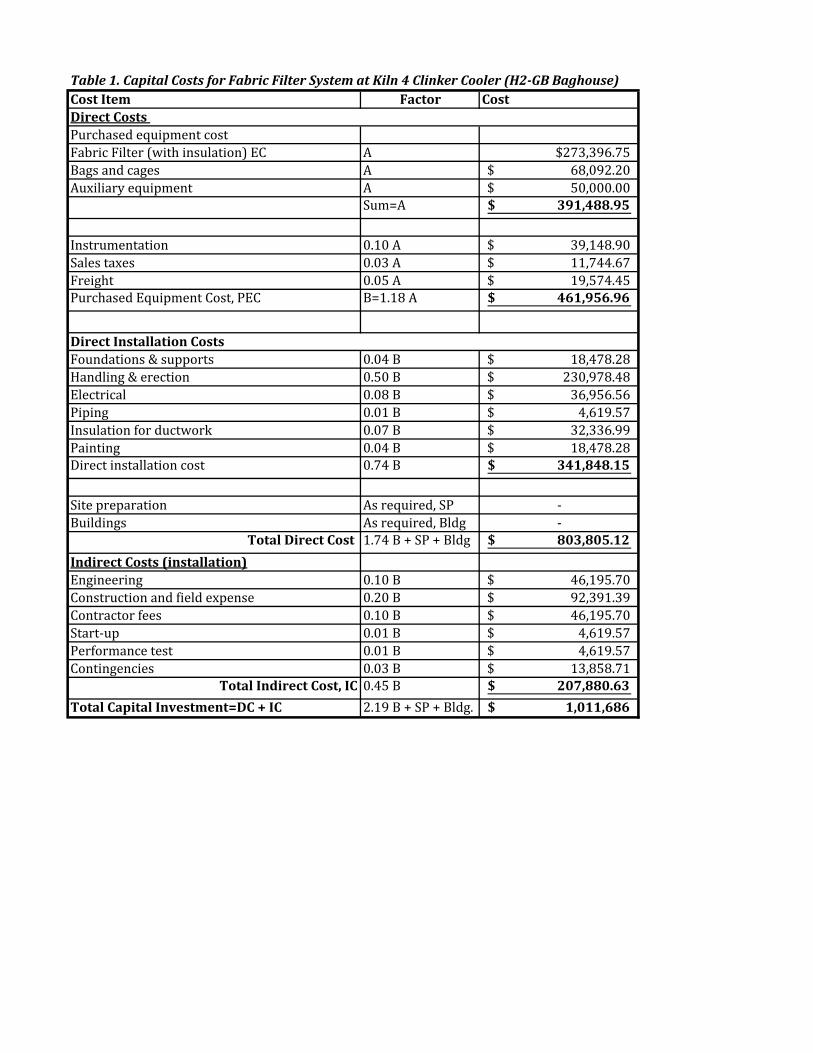
Table1.CapitalCostsforFabricFilterSystematKiln4ClinkerCooler(H2‐GBBaghouse)CostItem Factor Cost
Purchased equipment cost Fabric Filter (with insulation) EC A $273,396.75Bags and cages A 68,092.20$ Auxiliary equipment A 50,000.00$
Sum=A 391,488.95$
Instrumentation 0.10 A 39,148.90$ Sales taxes 0.03 A 11,744.67$ Freight 0.05 A 19,574.45$ Purchased Equipment Cost, PEC B=1.18 A 461,956.96$
Foundations & supports 0.04 B 18,478.28$ Handling & erection 0.50 B 230,978.48$ Electrical 0.08 B 36,956.56$ Piping 0.01 B 4,619.57$ Insulation for ductwork 0.07 B 32,336.99$ Painting 0.04 B 18,478.28$ Direct installation cost 0.74 B 341,848.15$
Site preparation As required, SP -Buildings As required, Bldg -
TotalDirectCost 1.74 B + SP + Bldg 803,805.12$IndirectCosts(installation)Engineering 0.10 B 46,195.70$ Construction and field expense 0.20 B 92,391.39$ Contractor fees 0.10 B 46,195.70$ Start-up 0.01 B 4,619.57$ Performance test 0.01 B 4,619.57$ Contingencies 0.03 B 13,858.71$
TotalIndirectCost,IC 0.45 B 207,880.63$TotalCapitalInvestment=DC+IC 2.19 B + SP + Bldg. 1,011,686$
DirectInstallationCosts
DirectCosts

Table2.AnnualCostsforFabricFilterSystemCostItem Calculations Cost Units References
DirectAnnualCosts,DC
Operator 37,109.00$ $ dollars EPA cost manual, Table 1.11, page 1-55Supervisor 15% of operator 5,566.35$ $ dollars EPA cost manual, Table 1.11, page 1-55Operating materials -
Labor 19,070.50$ $ dollarsMaterial 100% of maintenance labor 19,070.50$ $ dollarsCB bag and cages X 1.081 73,539.58$ $ dollars Initial bag cost including taxes and freight ($)Maintenance labor rate 29.65$ $ dollars Including overhead, EPA cost manual, page 1-5210 min per bag (rounded up) 306 hoursCL 9,072.90$ $ dollars EPA cost manual, page 1-52CRFB Capital recovery factor for a 4.75% interest rate and a 2 year bag life 53.59% factor EPA cost manual Equation 1.13, page 1-46Replacement parts, bags 4,878.06$ $/year EPA cost manual, Equation 1.13, page 1-46
Electricity 120,115.04$ $ dollars EPA cost manual, Equation 1.14, page 1-47
Compressed air (dried and filtered) 2 29,670.00$ $ dollars EPA cost manual, Table 1.11, page 1-55WasteDisposal as $25/ton on-site for essentially 100% collection 529.82$ $ dollars EPA cost manual, Table 1.11, page 1-56
TotalDC (rounded) 236,009$ $ dollars
Overhead 60% of sum of operating, supv., & maint. labor & maint. Materials 48,489.81$ $ dollars EPA cost manual, Table 1.11, page 1-56Administrative Charges 2% of Total Capital Investment 20,233.72$ $ dollars EPA cost manual, Table 1.11, page 1-57Property Tax 1% of Total Capital Investment 10,116.86$ $ dollars EPA cost manual, Table 1.11, page 1-58Insurance 1% of Total Capital Investment 10,116.86$ $ dollars EPA cost manual, Table 1.11, page 1-59Capital Recovery CRF*(TCI-CB-CL) 87,695.23$ $ dollars EPA cost manual, Table 1.11, page 1-60TotalIC(rounded) 176,652.47$ EPA cost manual, Equation 1.16TotalAnnualCost(1998) 412,662$ CalculatedTotalAnnualCost(2018) 638,964$ Calculated1. The 1.08 factor is for freight and sales taxes2 Typical consumption is about 2 scfm/1,000 cfm of gas filtered, page 1-483 The capital recovery cost factor, CRF, is a function of the fabric filter or equipment life and the opportunity cost of the capital (i.e., interest rate). For example, for a 20-year equipment life and a 4.75% interest rate, CRF = 0.07855
Operatinglabor
IndirectAnnualCosts,IC
Maintenance
Utilities
2 ℎ𝑠ℎ𝑖𝑓𝑡
3 𝑠ℎ𝑖𝑓𝑡𝑠𝑑𝑎𝑦
358 𝑑𝑎𝑦𝑠𝑦𝑟
$17.26ℎ
1 ℎ𝑠ℎ𝑖𝑓𝑡
3 𝑠ℎ𝑖𝑓𝑡𝑠𝑑𝑎𝑦
358 𝑑𝑎𝑦𝑠𝑦𝑟
$17.74ℎ
𝐶𝑅𝐶 𝐶 𝐶 𝐶𝑅𝐹
0.000181 115,000 𝑎𝑐𝑓𝑚 10 𝑖𝑛 𝐻 𝑂 8,600 ℎ𝑦𝑟
$ 0.0671𝑘𝑊ℎ
2 𝑠𝑐𝑓𝑚1,000 𝑎𝑐𝑓𝑚 115,000 𝑎𝑐𝑓𝑚
$0.251,000 𝑠𝑐𝑓
60 𝑚𝑖𝑛ℎ
8,600 ℎ𝑦𝑟
0.005 𝑔𝑟𝑓𝑡
1 𝑙𝑏7,000 𝑔𝑟 115,000 𝑓𝑡
60 𝑚𝑖𝑛ℎ
8,600 ℎ𝑦𝑟
1 𝑡𝑜𝑛2,000 𝑙𝑏
$25𝑡𝑜𝑛

ChemicalEngineeringPlantCostIndexYear Index
1985 325.3
1995 381.1
1996 381.7
1997 386.5
1998 389.5
1999 391.8
2000 394.1
2001 394.3
2002 395.6
2003 402.0
2004 444.2
2005 468.2
2006 499.6
2007 525.4
2008 575.4
2009 521.9
2010 550.8
2011 593.2
2012 584.6
2013 567.3
2014 576.1
2015 556.8
2016 541.7
2017 567.5
2018 603.1
2019 ‐

Table3.ParametersandCalculatedCosts
units Reference/NotesType Pulse-jet (common housing) - Most popular because it occupies less space + less expensive Figure No 1.8 - EPA cost manual, Table 1.7Gas-to-cloth ratio 4 cfm/ft2 Engineering judgment based on modern baghouses with low grain loading ratesFlue gas flowrate 115,000 scfm 6/1/2004 Baghouse Source TestingOperating hours 8,600 hours/year 6/1/2004 Baghouse Source TestingOperating hours 358 days/year For 24 hours/daySystem pressure drop 10 inches EPA cost manual , Section 1.3.2Bag diameter 6 in EPA cost manual, Table 1.8 Individual bag cost 1.6 $/ft2 EPA cost manual, Table 1.8 for 6-inch fiberglass bag, top removalCage length 10 ft EPA cost manual , Table 1.8 6 in x 10 ft cages
Gross Cloth Area (GCA) 28,750.00 ft2 CalculatedCostofbaghousew/obag $208,243.25 $ dollars EPA cost manual, Figure 1.8, Bagcost $46,000.00 $ dollars CalculatedInsulation $65,153.50 $ dollars EPA cost manual, Insulation is required, page 1-51, Fabric area per cage 15.71 ft2 EPA cost manual, page 1-51Number of Cages 1830 cages EPA cost manual, page 1-52, rounded up to the next integer Individual cage cost 12.07 per cage EPA cost manual, Table 1.8 in 500 cage lotsTotalcagecost $22,092.20 $ dollars EPA cost manual, page 1-51Auxiliary equipment $50,000.00 $ dollars Conservative estimate based on EPA's example auxiliary costs, EPA cost manual, page 1-52
Calculatedvalues
ParametersBaghouseparameters
𝐶𝑜𝑠𝑡 2,307 7.136 𝐺𝐶𝐴
𝐶𝑜𝑠𝑡 1041 2.23 𝐺𝐶𝐴

Table1.CapitalCostsforFabricFilterSystematQuarryPrimaryCrusherB2‐DC1BaghouseCostItem Factor Cost
Purchased equipment cost Fabric Filter (with insulation) EC A $38,894.87Bags and cages A 5,973.39$ Auxiliary equipment A 50,000.00$
Sum=A 94,868.26$
Instrumentation 0.10 A 9,486.83$ Sales taxes 0.03 A 2,846.05$ Freight 0.05 A 4,743.41$ Purchased Equipment Cost, PEC B=1.18 A 111,944.55$
Foundations & supports 0.04 B 4,477.78$ Handling & erection 0.50 B 55,972.27$ Electrical 0.08 B 8,955.56$ Piping 0.01 B 1,119.45$ Insulation for ductwork 0.07 B 7,836.12$ Painting 0.04 B 4,477.78$ Direct installation cost 0.74 B 82,838.96$
Site preparation As required, SP -Buildings As required, Bldg -
TotalDirectCost 1.74 B + SP + Bldg 194,783.51$IndirectCosts(installation)Engineering 0.10 B 11,194.45$ Construction and field expense 0.20 B 22,388.91$ Contractor fees 0.10 B 11,194.45$ Start-up 0.01 B 1,119.45$ Performance test 0.01 B 1,119.45$ Contingencies 0.03 B 3,358.34$
TotalIndirectCost,IC 0.45 B 50,375.05$TotalCapitalInvestment=DC+IC 2.19 B + SP + Bldg. 245,159$
DirectInstallationCosts
DirectCosts
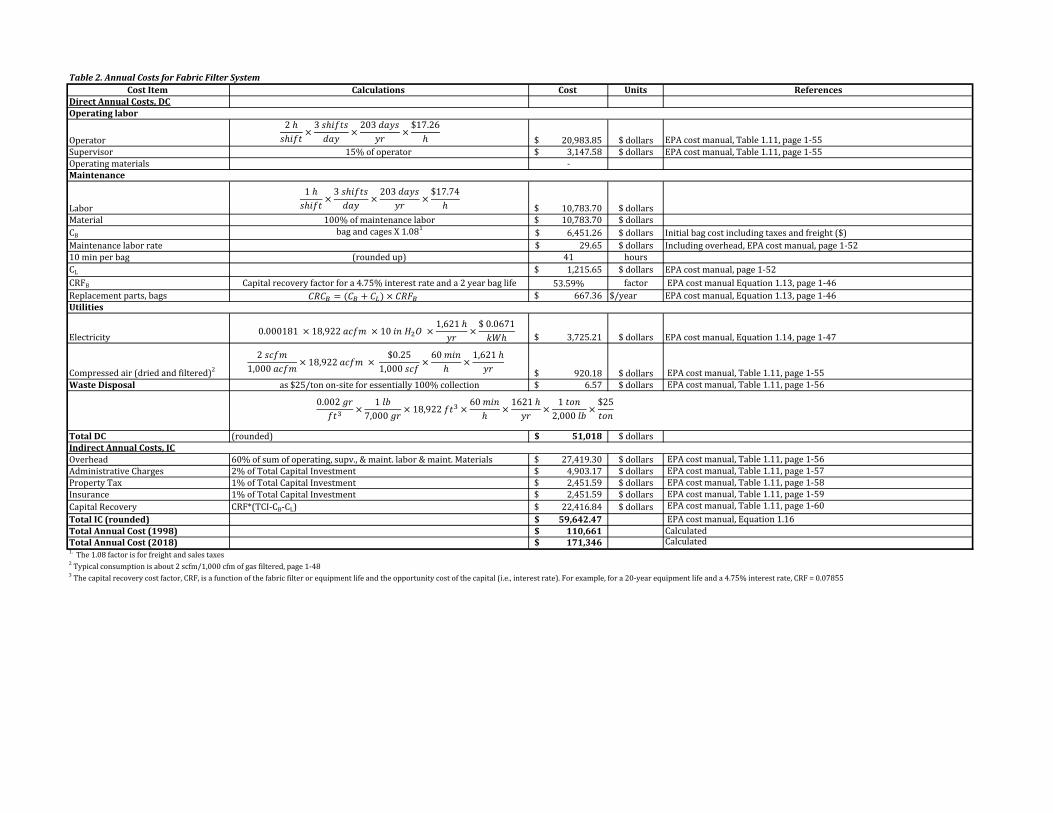
Table2.AnnualCostsforFabricFilterSystemCostItem Calculations Cost Units References
DirectAnnualCosts,DC
Operator 20,983.85$ $ dollars EPA cost manual, Table 1.11, page 1-55Supervisor 15% of operator 3,147.58$ $ dollars EPA cost manual, Table 1.11, page 1-55Operating materials -
Labor 10,783.70$ $ dollarsMaterial 100% of maintenance labor 10,783.70$ $ dollarsCB bag and cages X 1.081 6,451.26$ $ dollars Initial bag cost including taxes and freight ($)Maintenance labor rate 29.65$ $ dollars Including overhead, EPA cost manual, page 1-5210 min per bag (rounded up) 41 hoursCL 1,215.65$ $ dollars EPA cost manual, page 1-52CRFB Capital recovery factor for a 4.75% interest rate and a 2 year bag life 53.59% factor EPA cost manual Equation 1.13, page 1-46Replacement parts, bags 667.36$ $/year EPA cost manual, Equation 1.13, page 1-46
Electricity 3,725.21$ $ dollars EPA cost manual, Equation 1.14, page 1-47
Compressed air (dried and filtered)2 920.18$ $ dollars EPA cost manual, Table 1.11, page 1-55WasteDisposal as $25/ton on-site for essentially 100% collection 6.57$ $ dollars EPA cost manual, Table 1.11, page 1-56
TotalDC (rounded) 51,018$ $ dollars
Overhead 60% of sum of operating, supv., & maint. labor & maint. Materials 27,419.30$ $ dollars EPA cost manual, Table 1.11, page 1-56Administrative Charges 2% of Total Capital Investment 4,903.17$ $ dollars EPA cost manual, Table 1.11, page 1-57Property Tax 1% of Total Capital Investment 2,451.59$ $ dollars EPA cost manual, Table 1.11, page 1-58Insurance 1% of Total Capital Investment 2,451.59$ $ dollars EPA cost manual, Table 1.11, page 1-59Capital Recovery CRF*(TCI-CB-CL) 22,416.84$ $ dollars EPA cost manual, Table 1.11, page 1-60TotalIC(rounded) 59,642.47$ EPA cost manual, Equation 1.16TotalAnnualCost(1998) 110,661$ CalculatedTotalAnnualCost(2018) 171,346$ Calculated1. The 1.08 factor is for freight and sales taxes2 Typical consumption is about 2 scfm/1,000 cfm of gas filtered, page 1-483 The capital recovery cost factor, CRF, is a function of the fabric filter or equipment life and the opportunity cost of the capital (i.e., interest rate). For example, for a 20-year equipment life and a 4.75% interest rate, CRF = 0.07855
Operatinglabor
IndirectAnnualCosts,IC
Maintenance
Utilities
2 ℎ𝑠ℎ𝑖𝑓𝑡
3 𝑠ℎ𝑖𝑓𝑡𝑠𝑑𝑎𝑦
203 𝑑𝑎𝑦𝑠𝑦𝑟
$17.26ℎ
1 ℎ𝑠ℎ𝑖𝑓𝑡
3 𝑠ℎ𝑖𝑓𝑡𝑠𝑑𝑎𝑦
203 𝑑𝑎𝑦𝑠𝑦𝑟
$17.74ℎ
𝐶𝑅𝐶 𝐶 𝐶 𝐶𝑅𝐹
0.000181 18,922 𝑎𝑐𝑓𝑚 10 𝑖𝑛 𝐻 𝑂 1,621 ℎ𝑦𝑟
$ 0.0671𝑘𝑊ℎ
2 𝑠𝑐𝑓𝑚1,000 𝑎𝑐𝑓𝑚
18,922 𝑎𝑐𝑓𝑚 $0.25
1,000 𝑠𝑐𝑓60 𝑚𝑖𝑛
ℎ1,621 ℎ𝑦𝑟
0.002 𝑔𝑟𝑓𝑡
1 𝑙𝑏7,000 𝑔𝑟
18,922 𝑓𝑡60 𝑚𝑖𝑛
ℎ1621 ℎ𝑦𝑟
1 𝑡𝑜𝑛2,000 𝑙𝑏
$25𝑡𝑜𝑛

ChemicalEngineeringPlantCostIndexYear Index
1985 325.3
1995 381.1
1996 381.7
1997 386.5
1998 389.5
1999 391.8
2000 394.1
2001 394.3
2002 395.6
2003 402.0
2004 444.2
2005 468.2
2006 499.6
2007 525.4
2008 575.4
2009 521.9
2010 550.8
2011 593.2
2012 584.6
2013 567.3
2014 576.1
2015 556.8
2016 541.7
2017 567.5
2018 603.1
2019 ‐

Table3.ParametersandCalculatedCosts
units Reference/NotesType Pulse-jet (common housing) - Most popular because it occupies less space + less expensive Figure No 1.8 - EPA cost manual, Table 1.7Gas-to-cloth ratio 5 cfm/ft2 Engineering judgment based on modern baghouses with low grain loading ratesFlue gas flowrate 18,922 scfm 6/1/2004 Baghouse Source TestingOperating hours 1,621 hours/year 6/1/2004 Baghouse Source TestingOperating hours 203 days/year For 8 hours/daySystem pressure drop 10 inches EPA cost manual , Section 1.3.2Bag diameter 6 in EPA cost manual, Table 1.8 Individual bag cost 0.81 $/ft2 EPA cost manual, Table 1.8 for 6-inch polypropylene bag, top removalCage length 10 ft EPA cost manual , Table 1.8 6-in x 10 ft cages
Gross Cloth Area (GCA) 3,784.40 ft2 CalculatedCostofbaghousew/obag $29,414.66 $ dollars EPA cost manual, Figure 1.8, Bagcost $3,065.36 $ dollars CalculatedInsulation $9,480.21 $ dollars EPA cost manual, Insulation is required, page 1-51, Fabric area per cage 15.71 ft2 EPA cost manual, page 1-51Number of Cages 241 cages EPA cost manual, page 1-52, rounded up to the next integer Individual cage cost 12.07 per cage EPA cost manual, Table 1.8 in 500 cage lotsTotalcagecost $2,908.03 $ dollars EPA cost manual, page 1-51Auxiliary equipment $50,000.00 $ dollars Conservative estimate based on EPA's example auxiliary costs, EPA cost manual, page 1-52
Calculatedvalues
ParametersBaghouseparameters
𝐶𝑜𝑠𝑡 2,307 7.136 𝐺𝐶𝐴
𝐶𝑜𝑠𝑡 1041 2.23 𝐺𝐶𝐴

CalPortland | Rillito Facility Four-Factor Analysis Trinity Consultants
APPENDIX B: FOUR-FACTOR ANALYSIS SPREADSHEET

Regional Haze ‐ Four‐Factor Analysis
Table1a.CalPortlandRillito‐4FA‐Summary‐PM 10 SourcesBaselinePM10
Emissions1
Type OperationID Value Units (tpy)
ControlType Baghouse FullEnclosure
Cost of Compliance ($/tpy) $7,945
Time Necessary for Compliance 0.5Energy and Non-Air Environmental Impacts Minimal
Remaining Useful Life of the Source 20
ControlType
Developtrafficmanagementplans,speedlimits,speed
bumps
AdditionalWaterApplicationtoUnpaved
Roads
ApplyChemicalDustSuppressanttoUnpaved
RoadsApplyandMaintainSurfaceGraveltoUnpavedRoads
Cost of Compliance ($/tpy) Already Implemented $21,086 Already Implemented No improvement in emissions
Time Necessary for Compliance N/A 3 N/A N/A
Energy and Non-Air Environmental Impacts N/A
The reduction of PM10
emissions would see an increase in other criteria
pollutant emissions along with hazardous air pollutants and greenhouse gases from the
additional tailpipe emissions.
N/A N/A
Remaining Useful Life of the Source N/A 20 N/A N/A
ControlType
Pave,vegetate,orchemicallystabilizeaccesspointswhereunpavedtrafficsurfacesadjoinpavedroads
Provideforstormwaterdrainagetopreventerosionofdirtorsandontopaved
roadsEmployPM10certifiedstreet
sweepers
Cost of Compliance ($/tpy) Already Implemented Already Implemented $15,333Time Necessary for Compliance N/A N/A 3
Energy and Non-Air Environmental Impacts N/A N/A
The reduction of PM10
emissions would see an increase in other criteria
pollutant emissions along with hazardous air pollutants and greenhouse gases from the
additional tailpipe emissions.
Remaining Useful Life of the Source N/A N/A 20
TechnicallyFeasibleControls
No technologically feasible controls
identified
Unpaved Roads Various 109,883 VMT 58.8
Paved Roads Various 24,195 VMT 10.6
SourceCharacteristics BaselineThroughput
FourFactorAnalysisStatutoryFactor
Clinker to OH Crane
BLDGVarious 4,380,245 tons 66.9
CalPortland Page 1 of 2 Rillito

Regional Haze ‐ Four‐Factor Analysis
Table1a.CalPortlandRillito‐4FA‐Summary‐PM 10 SourcesBaselinePM10
Emissions1
Type OperationID Value Units (tpy) TechnicallyFeasibleControls
SourceCharacteristics BaselineThroughput
FourFactorAnalysisStatutoryFactorControlType
Cost of Compliance ($/tpy)Time Necessary for Compliance
Energy and Non-Air Environmental ImpactsRemaining Useful Life of the Source
ControlType ErectArtificialWindbreakCost of Compliance ($/tpy) $0
Time Necessary for Compliance 0Energy and Non-Air Environmental Impacts N/A
Remaining Useful Life of the Source N/AControlType LowerGrainLoading
Cost of Compliance ($/tpy) $29,310Time Necessary for Compliance 3
Energy and Non-Air Environmental Impacts N/ARemaining Useful Life of the Source 20
ControlType LowerGrainLoadingCost of Compliance ($/tpy) $30,763
Time Necessary for Compliance 3Energy and Non-Air Environmental Impacts N/A
Remaining Useful Life of the Source 20ControlType LowerGrainLoading
Cost of Compliance ($/tpy) $30,149Time Necessary for Compliance 3
Energy and Non-Air Environmental Impacts N/ARemaining Useful Life of the Source 20
ControlType LowerGrainLoadingCost of Compliance ($/tpy) $28,966
Time Necessary for Compliance 3Energy and Non-Air Environmental Impacts N/A
Remaining Useful Life of the Source 20
No technically feasible controls identified
Finish Milling-D3 area
D3-1-DC2 6,491 hours 31.7
Quarry Crusher System
B2-DC1 1,621 hours 6.6
Wind Erosion WindIron 1.04 acres 8.4
Kiln 4 Clinker Cooler
H2-GB 8,600 hours 42.4
Finish Milling-D2 area
D2-PC 6,087 hours 36.5
Material Drops Various 9,602,945 tons 20.3
CalPortland Page 2 of 2 Rillito

Regional Haze ‐ Four‐Factor Analysis
Table1b.CalPortland‐Rillito‐4FA‐Summary‐NOxsourcesBaselineNOxEmissions
Type OperationID Value Unit (tpy)ControlType
Cost of Compliance ($/tpy)Time Necessary for Compliance
Energy and Non-Air Environmental ImpactsRemaining Useful Life of the Source
SourceCharacteristics BaselineThroughput
FourFactorAnalysisStatutoryFactorTechnicallyFeasible
Controls
Blasting Blasting 840 tons ANFO 7.1 No technically feasible controls identified
CalPortland Page 3 of 14 Rillito
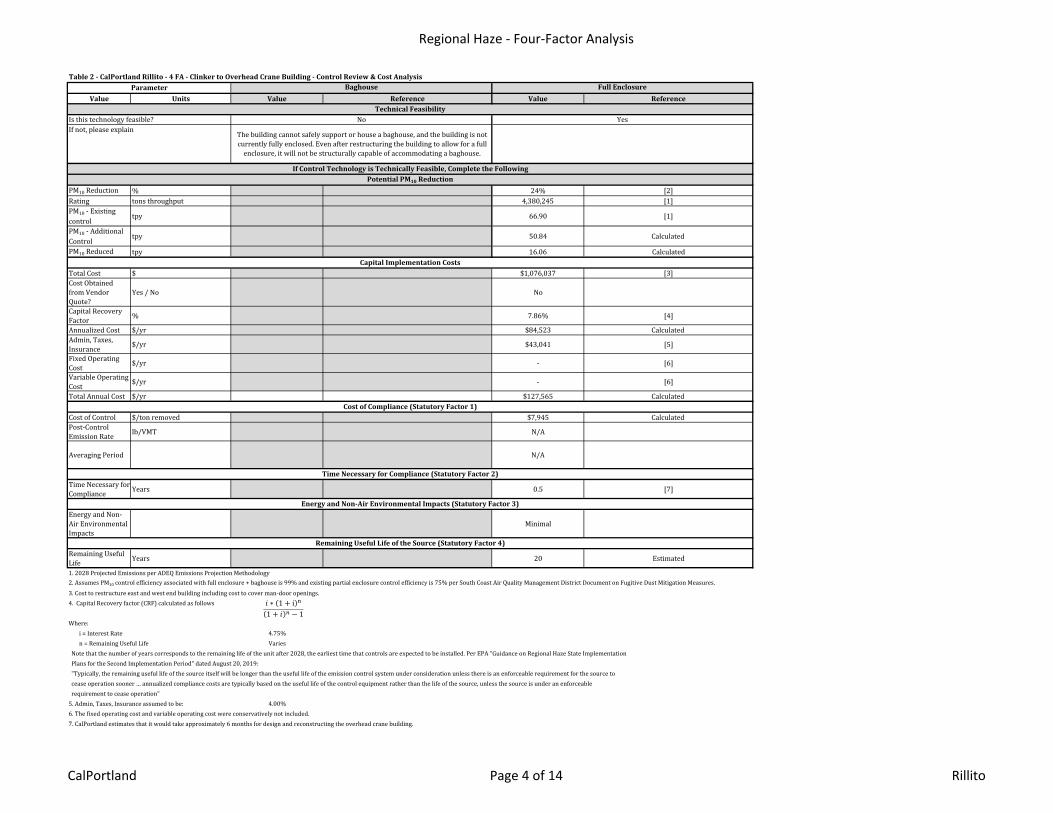
Regional Haze ‐ Four‐Factor Analysis
Table2‐CalPortlandRillito‐4FA‐ClinkertoOverheadCraneBuilding‐ControlReview&CostAnalysis
Value Units Value Reference Value Reference
Is this technology feasible?If not, please explain
PM10 Reduction % 24% [2]Rating tons throughput 4,380,245 [1]PM10 - Existing control
tpy 66.90 [1]
PM10 - Additional Control
tpy 50.84 Calculated
PM10 Reduced tpy 16.06 Calculated
Total Cost $ $1,076,037 [3]Cost Obtained from Vendor Quote?
Yes / No No
Capital Recovery Factor % 7.86% [4]
Annualized Cost $/yr $84,523 Calculated Admin, Taxes, Insurance $/yr $43,041 [5]
Fixed Operating Cost $/yr - [6]
Variable Operating Cost $/yr - [6]
Total Annual Cost $/yr $127,565 Calculated
Cost of Control $/ton removed $7,945 Calculated Post-Control Emission Rate lb/VMT N/A
Averaging Period N/A
Time Necessary for Compliance Years 0.5 [7]
Energy and Non-Air Environmental Impacts
Minimal
Remaining Useful Life Years 20 Estimated
1. 2028 Projected Emissions per ADEQ Emissions Projection Methodology2. Assumes PM10 control efficiency associated with full enclosure + baghouse is 99% and existing partial enclosure control efficiency is 75% per South Coast Air Quality Management District Document on Fugitive Dust Mitigation Measures.3. Cost to restructure east and west end building including cost to cover man-door openings. 4. Capital Recovery factor (CRF) calculated as follows
Where:i = Interest Rate 4.75%n = Remaining Useful Life Varies
Note that the number of years corresponds to the remaining life of the unit after 2028, the earliest time that controls are expected to be installed. Per EPA "Guidance on Regional Haze State Implementation Plans for the Second Implementation Period" dated August 20, 2019: "Typically, the remaining useful life of the source itself will be longer than the useful life of the emission control system under consideration unless there is an enforceable requirement for the source to cease operation sooner … annualized compliance costs are typically based on the useful life of the control equipment rather than the life of the source, unless the source is under an enforceable requirement to cease operation"5. Admin, Taxes, Insurance assumed to be: 4.00%6. The fixed operating cost and variable operating cost were conservatively not included.7. CalPortland estimates that it would take approximately 6 months for design and reconstructing the overhead crane building.
TimeNecessaryforCompliance(StatutoryFactor2)
EnergyandNon‐AirEnvironmentalImpacts(StatutoryFactor3)
RemainingUsefulLifeoftheSource(StatutoryFactor4)
PotentialPM10Reduction
CapitalImplementationCosts
CostofCompliance(StatutoryFactor1)
FullEnclosureParameter Baghouse
TechnicalFeasibility
IfControlTechnologyisTechnicallyFeasible,CompletetheFollowing
YesNo
The building cannot safely support or house a baghouse, and the building is not currently fully enclosed. Even after restructuring the building to allow for a full
enclosure, it will not be structurally capable of accommodating a baghouse.
𝑖 ∗ 1 i1 𝑖 1
CalPortland Page 4 of 14 Rillito

Regional Haze ‐ Four‐Factor Analysis
Table3‐CalPortlandRillito‐4FA‐VehicularTraffic‐UnpavedRoads‐ControlReview&CostAnalysis
Value Units Value Reference Value Reference Value Reference Value Reference Value Reference
PM10 Reduction % 0% Already Implemented 86% [2] 0% [7] 0% [8]Rating VMT 109,883 [1] 109,883 [1] 109,883 [1] 109,883 [1]PM10 - No control tpy 58.77 [1] 58.77 [1] 58.77 [1] 58.77 [1]PM10 - Additional Control
tpy 35.25 Calculated 8.40 [3] 35.25 Calculated 35.25 Calculated
PM10 Reduced tpy 23.52 Calculated 50.37 Calculated 23.52 Calculated 23.52 Calculated
Total Cost $ - - $3,160,000 Cost of 8 trucks - - - -
Cost Obtained from Vendor Quote? Yes / No
- -
No
- - - -Capital Recovery Factor % - - 7.86% [4] - - - -Annualized Cost $/yr - - $248,219 Calculated - - - -
Admin, Taxes, Insurance $/yr - - $126,400 [5] - - - -Fixed Operating Cost $/yr - - $687,567 [6] - - - -Variable Operating Cost $/yr - - - - - - - -Total Annual Cost $/yr - - $1,062,186 Calculated - - - -
Cost of Control $/ton removed ND - $21,086 Calculated ND - ND -Post-Control Emission Rate lb/VMT 0.64 Calculated 0.15 Calculated 0.64 Calculated 0.64 Calculated
Averaging Period
Time Necessary for Compliance Years 3
Estimate based on procurement of equipment and
implementation of new operations
Energy and Non-Air Environmental Impacts
Remaining Useful Life Years 20 Estimated1. 2028 Projected Emissions per ADEQ Emissions Projection Methodology2. Additional control based on 95% overall PM10 control.3. Based on 95% control, which is achievable based on the upper limit of AP-42 Section 13.2.2, Figure 13.2.2-5.4. Capital Recovery factor (CRF) calculated as follows
Where:i = Interest Rate 4.75%n = Remaining Useful Life Varies
Note that the number of years corresponds to the remaining life of the unit after 2028, the earliest time that controls are expected to be installed. Per EPA "Guidance on Regional Haze State Implementation Plans for the Second Implementation Period" dated August 20, 2019: "Typically, the remaining useful life of the source itself will be longer than the useful life of the emission control system under consideration unless there is an enforceable requirement for the source to cease operation sooner … annualized compliance costs are typically based on the useful life of the control equipment rather than the life of the source, unless the source is under an enforceable requirement to cease operation"5. Admin, Taxes, Insurance assumed to be: 4.00% Per EPA Air Pollution Control Cost Manual, Sixth Ed., 2002, Sect. 2.5.5.8, pg 2-346. Fixed operating cost accounts for the cost difference in water required, along with a 5% annual maintenance costs based on capital cost of water trucks.7. CalPortland uses a lignin based chemical suppressant. Magnesium chloride cannot be used as it causes damage to operating equipment onsite.8. The current silt content of the haul roads of 6.4% is equivalent to the lowest silt content of gravel from WRAP Fugitive Dust Handbook
IfControlTechnologyisTechnicallyFeasible,CompletetheFollowingPotentialPM10Reduction
CapitalImplementationCosts
TechnicalFeasibility
The quarry roads cannot be paved as the weight and size of the haul trucks would destroy the pavement. Additionally, haul roads change as the mine is developed.
Additional CommentsThis control method is already being used at the
CalPortland Rillito facility. Additional restrictions would impede with facility
operation and bottleneck facility processes.
The additional number of water trucks necessary, along with the amount of additional traffic would interfere with facility operations.
This is already being implemented and CalPortland is using a high efficiency lignin
based dust suppressant
The current silt content (6.4%) is equivalent to the silt content that would be achieved by
applying gravel to the unpaved roads. As such, there would be no associated PM10 reduction.
UnpavedPavetheRoadSurfaceofUnpavedRoads
Quarry roads cannot be pavedIs this technology feasible? Yes Yes Yes Yes No
ParameterDeveloptrafficmanagementplans,speed
limits,speedbumpsAdditionalWaterApplicationtoUnpaved
RoadsApplyChemicalDustSuppressantto
UnpavedRoadsApplyandMaintainSurfaceGravelto
UnpavedRoadsRoadSurface Unpaved Unpaved Unpaved Unpaved
If not, please explain
Energy and Non-Air Environmental Impacts (Statutory Factor 3)
Remaining Useful Life of the Source (Statutory Factor 4)
Cost of Compliance (Statutory Factor 1)
Time Necessary for Compliance (Statutory Factor 2)
The reduction of PM10 emissions would see an increase in other criteria pollutant emissions
along with hazardous air pollutants and greenhouse gases from the additional tailpipe
emissions.
𝑖 ∗ 1 i1 𝑖 1
CalPortland Page 5 of 14 Rillito
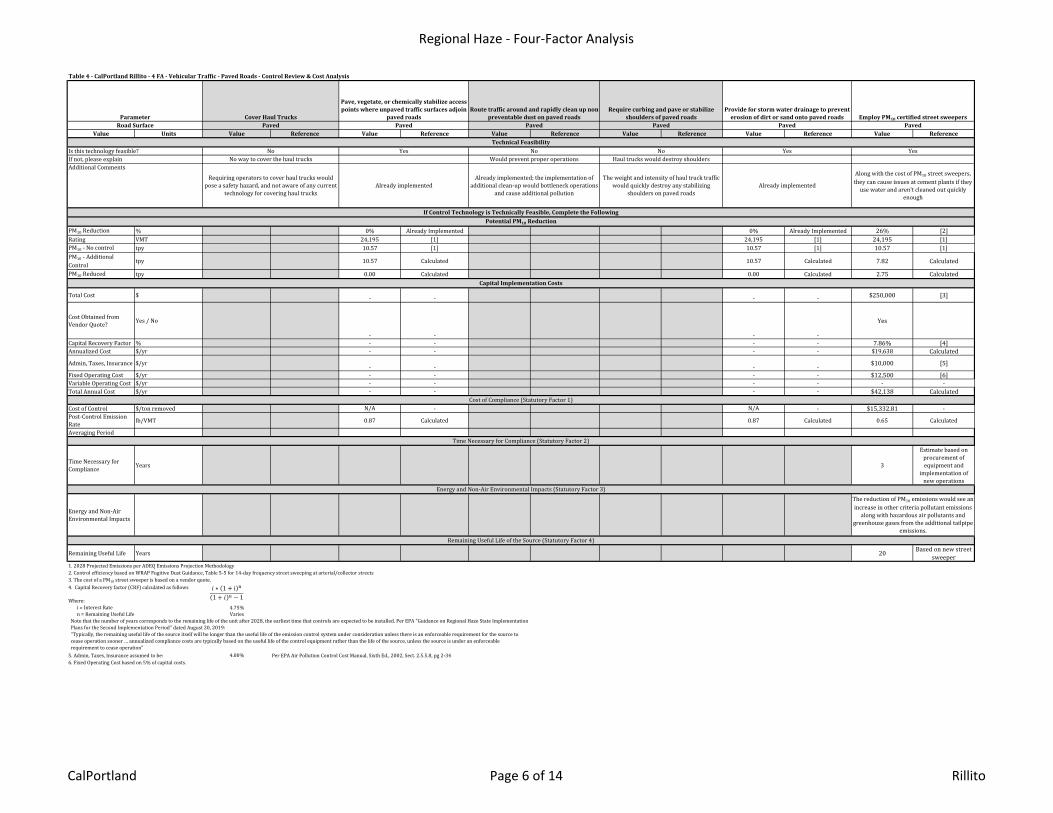
Regional Haze ‐ Four‐Factor Analysis
Table4‐CalPortlandRillito‐4FA‐VehicularTraffic‐PavedRoads‐ControlReview&CostAnalysis
Value Units Value Reference Value Reference Value Reference Value Reference Value Reference Value Reference
PM10 Reduction % 0% Already Implemented 0% Already Implemented 26% [2]Rating VMT 24,195 [1] 24,195 [1] 24,195 [1]PM10 - No control tpy 10.57 [1] 10.57 [1] 10.57 [1]PM10 - Additional Control
tpy 10.57 Calculated 10.57 Calculated 7.82 Calculated
PM10 Reduced tpy 0.00 Calculated 0.00 Calculated 2.75 Calculated
Total Cost $ - - - - $250,000 [3]
Cost Obtained from Vendor Quote? Yes / No
- - - -
Yes
Capital Recovery Factor % - - - - 7.86% [4]Annualized Cost $/yr - - - - $19,638 Calculated
Admin, Taxes, Insurance $/yr - - - - $10,000 [5]
Fixed Operating Cost $/yr - - - - $12,500 [6]Variable Operating Cost $/yr - - - - - -Total Annual Cost $/yr - - - - $42,138 Calculated
Cost of Control $/ton removed N/A - N/A - $15,332.81 -Post-Control Emission Rate lb/VMT 0.87 Calculated 0.87 Calculated 0.65 Calculated
Averaging Period
Time Necessary for Compliance Years 3
Estimate based on procurement of equipment and
implementation of new operations
Energy and Non-Air Environmental Impacts
Remaining Useful Life Years 20 Based on new street sweeper
1. 2028 Projected Emissions per ADEQ Emissions Projection Methodology2. Control efficiency based on WRAP Fugitive Dust Guidance, Table 5-5 for 14-day frequency street sweeping at arterial/collector streets3. The cost of a PM10 street sweeper is based on a vendor quote.4. Capital Recovery factor (CRF) calculated as follows
Where:i = Interest Rate 4.75%n = Remaining Useful Life Varies
Note that the number of years corresponds to the remaining life of the unit after 2028, the earliest time that controls are expected to be installed. Per EPA "Guidance on Regional Haze State Implementation Plans for the Second Implementation Period" dated August 20, 2019: "Typically, the remaining useful life of the source itself will be longer than the useful life of the emission control system under consideration unless there is an enforceable requirement for the source to cease operation sooner … annualized compliance costs are typically based on the useful life of the control equipment rather than the life of the source, unless the source is under an enforceable requirement to cease operation"5. Admin, Taxes, Insurance assumed to be: 4.00% Per EPA Air Pollution Control Cost Manual, Sixth Ed., 2002, Sect. 2.5.5.8, pg 2-346. Fixed Operating Cost based on 5% of capital costs.
Remaining Useful Life of the Source (Statutory Factor 4)
IfControlTechnologyisTechnicallyFeasible,CompletetheFollowingPotentialPM10Reduction
CapitalImplementationCosts
Cost of Compliance (Statutory Factor 1)
Time Necessary for Compliance (Statutory Factor 2)
Energy and Non-Air Environmental Impacts (Statutory Factor 3)The reduction of PM10 emissions would see an increase in other criteria pollutant emissions
along with hazardous air pollutants and greenhouse gases from the additional tailpipe
emissions.
Along with the cost of PM10 street sweepers, they can cause issues at cement plants if they
use water and aren't cleaned out quickly enough
Requiring operators to cover haul trucks would pose a safety hazard, and not aware of any current
technology for covering haul trucksAlready implemented
Already implemented; the implementation of additional clean-up would bottleneck operations
and cause additional pollution
The weight and intensity of haul truck traffic would quickly destroy any stabilizing
shoulders on paved roads
Is this technology feasible?
Additional Comments
Yes YesIf not, please explain No way to cover the haul trucks
No Yes No NoWould prevent proper operations Haul trucks would destroy shoulders
Already implemented
TechnicalFeasibility
EmployPM10certifiedstreetsweepersRoadSurface Paved Paved
CoverHaulTrucks
Pave,vegetate,orchemicallystabilizeaccesspointswhereunpavedtrafficsurfacesadjoin
pavedroadsRoutetrafficaroundandrapidlycleanupnon‐
preventabledustonpavedroadsRequirecurbingandpaveorstabilize
shouldersofpavedroadsProvideforstormwaterdrainagetopreventerosionofdirtorsandontopavedroadsParameter
Paved Paved Paved Paved
𝑖 ∗ 1 i1 𝑖 1
CalPortland Page 6 of 14 Rillito

Regional Haze ‐ Four‐Factor Analysis
Table5‐CalPortlandRillito‐4FA‐MaterialDrops‐ControlReview&CostAnalysis
Value Units Value Reference Value Reference Value Reference
PM10 Reduction %Rating Tons throughput
PM10 - No control tpy
PM10 - Control tpyPM10 Reduced tpy
Total Cost $Cost Obtained from Vendor Quote?
Yes / No
Capital Recovery Factor %
Annualized Cost $/yrAdmin, Taxes, Insurance $/yr
Fixed Operating Cost $/yr
Variable Operating Cost $/yr
Total Annual Cost $/yr
Cost of Control $/ton removedPost-Control Emission Rate lb/VMT
Averaging Period
Time Necessary for Compliance Years
Energy and Non-Air Environmental Impacts
Remaining Useful Life Years
Parameter WaterSprays Full or Partial EnclosureBaghouse
If not, please explain
TechnicalFeasibilityIs this technology feasible? No
The location and operations of the material drops impedes the ability to apply additional controls. Water sprays are not a technically feasible control for this analysis. The materials without control cannot become damp because the material will clump and cause issues with operations. Additional moisture affects the quality of the product, it causes plugging in the pre-heater tower, and causes other process related difficulties that in the long run will add more NOx and SOx due to
the moisture that would have to be driven off and additional process upsets that cause excess emissions with a breakdown.
Additionally, for a source like Clinker Conveyor Bypass (Truck) – Clinker Conveyor Bypass Bin to Truck Transfer, water cannot be applied to clinker.
Lastly, most quarry material transfers would require additional water trucks to water loading material into the haul truck at the rock face. These trucks would generate more dust, NOx, and CO emissions for each truck.
The location of the material drops impedes the ability to apply additional controls. This is not technically feasible control for this analysis. For example, the Alumina at Plant (Loader) – Loader to D4 Hopper
transfer point cannot be enclosed, as enclosing this process for a baghouse is not physically feasible as there would be no way to get the material into the hopper. Additionally, spraying this material causes
clogs/clumps in the hopper, on the conveyors, and in the storage bin.
The location and operations of the material drops impedes the ability to
apply additional controls.
RemainingUsefulLifeoftheSource(StatutoryFactor4)
IfControlTechnologyisTechnicallyFeasible,CompletetheFollowingPotentialPM10Reduction
CapitalImplementationCosts
CostofCompliance(StatutoryFactor1)
TimeNecessaryforCompliance(StatutoryFactor2)
EnergyandNon‐AirEnvironmentalImpacts(StatutoryFactor3)
CalPortland Page 7 of 14 Rillito

Regional Haze ‐ Four‐Factor Analysis
Table6.CalPortlandRillito‐4FA‐WindErosion‐ControlReview&CostAnalysis
Value Units Value Reference Value Reference Value Reference Value Reference Value Reference Value Reference
PM10 Reduction % 75% [2]Rating Acres of piles 1.04 [1]
PM10 - No control tpy 8.41 [1]
PM10 - Control tpy 2.10 CalculatedPM10 Reduced tpy 6.31 Calculated
Total Cost $ - -Cost Obtained from Vendor Quote?
Yes / No - -
Capital Recovery Factor % - -
Annualized Cost $/yr - -Admin, Taxes, Insurance $/yr - -
Fixed Operating Cost $/yr - -
Variable Operating Cost $/yr - -
Total Annual Cost $/yr - -
Cost of Control $/ton removed - -Post-Control Emission Rate lb/acre - -
Averaging Period - -
Time Necessary for Compliance Years 0 Control is already
implemented
Energy and Non-Air Environmental Impacts
- -
Remaining Useful Life Years N/A Located in a pit
1. 2028 Projected Emissions per ADEQ Emissions Projection Methodology2. Control based on South Coast Air Quality Management District Document on Fugitive Dust Mitigation Measures
PileCompaction CoverwithTarps
TechnicalFeasibilityIs this technology feasible? No No Yes Yes Yes Yes
Parameter AdditionalWaterApplicationApplyChemicalDust
Suppressant ErectArtificialWindbreakPlantTreesorShrubsas
Windbreak
If not, please explain Sonoran hematite is a very fine material, and water application
would cause clumping of the material. Clumping causes operational issues, such as
clogging and plugging of process equipment.
All the issues that exist with water spraying also exist for chemical dust suppressants.
The iron tailings pile are being moved to a horseshoe pit with windbreak on 3 sides - this control is currently being
implemented
An artificial wind-break is being implemented. These control technologies Pile coverage would require additional equipment, operational overhead, and incurred
costs.
RemainingUsefulLifeoftheSource(StatutoryFactor4)
IfControlTechnologyisTechnicallyFeasible,CompletetheFollowingPotentialPM10Reduction
CapitalImplementationCosts
CostofCompliance(StatutoryFactor1)
TimeNecessaryforCompliance(StatutoryFactor2)
EnergyandNon‐AirEnvironmentalImpacts(StatutoryFactor3)
CalPortland Page 8 of 14 Rillito

Regional Haze ‐ Four‐Factor Analysis
Table7.CalPortlandRillito‐4FA‐Blasting‐ControlReview&CostAnalysis
Value Units Value Reference Value Reference Value Reference Value Reference
NOx Reduction %Rating tons explosiveNOx - No control tpyNOx - Controlled tpyNOx Reduced tpy
Total Cost $Cost Obtained from Vendor Quote?
Yes / No
Capital Recovery Factor %
Annualized Cost $/yrAdmin, Taxes, Insurance $/yr
Fixed Operating Cost $/yr
Variable Operating Cost $/yr
Total Annual Cost $/yr
Cost of Control $/ton removedPost-Control Emission Rate lb/lb explosive
Averaging Period
Time Necessary for Compliance Years
Energy and Non-Air Environmental Impacts
Remaining Useful Life Years
Parameter
InductionofBlastAdditives:Aluminumpowder;coaldust;
ureaorexcessfueloil WaterContaminationReduction ConfinementEnhancement DrillCuttingContaminationReduction
Is this technology feasible? NoIf not, please explain ANFO is purchased from contractor and prepared offsite
TechnicalFeasibility
RemainingUsefulLifeoftheSource(StatutoryFactor4)
IfControlTechnologyisTechnicallyFeasible,CompletetheFollowingPotentialNOxReduction
CapitalImplementationCosts
CostofCompliance(StatutoryFactor1)
TimeNecessaryforCompliance(StatutoryFactor2)
EnergyandNon‐AirEnvironmentalImpacts(StatutoryFactor3)
CalPortland Page 9 of 14 Rillito

Regional Haze ‐ Four‐Factor Analysis
Table8‐CalPortlandRillito‐4FA‐D2FinishMillD2‐PCBaghouse‐ControlReview&CostAnalysis
Value Units Value Reference
Current Guaranteed Grain Loading
gr/dscf 0.01 [2]
Updated Grain Loading gr/dscf 0.005 [3]
Flow dscf 140,000 [1]Operating Hours hrs 6,087 [1]PM10 - Current Control
tpy 36.52 Calculated
PM10 - Potential Control
tpy 18.26 Calculated
PM10 Reduced tpy 18.26 Calculated
Total Cost $ - -
Cost Obtained from Vendor Quote? Yes / No - -
Capital Recovery Factor % - -
Annualized Cost $/yr - -Admin, Taxes, Insurance $/yr - -
Fixed Operating Cost $/yr - -
Variable Operating Cost $/yr - -
Total Annual Cost $/yr $535,231 Calculated using EPA Cost Manual
Cost of Control $/ton removed $29,310 CalculatedPost-Control Emission Rate gr/dscf 0.005 Calculated
Time Necessary for Compliance Years 3 Estimated based on permitting process and
purchase from vendors
Energy and Non-Air Environmental Impacts
Remaining Useful Life Years 20 EPA Cost Manual
1. 2028 Projected Emissions per ADEQ Emissions Projection Methodology2. Baseline emissions from baghouses are based on conservative grain loading rates that would be guaranteed by vendors.3. Achievable grain loading rate based on RACT/BACT/LAER Clearinghouse information.
N/A
RemainingUsefulLifeoftheSource(StatutoryFactor4)
IfControlTechnologyisTechnicallyFeasible,CompletetheFollowingPotentialPM10Reduction
CapitalImplementationCosts
CostofCompliance(StatutoryFactor1)
TimeNecessaryforCompliance(StatutoryFactor2)
EnergyandNon‐AirEnvironmentalImpacts(StatutoryFactor3)
If not, please explain
Parameter LowerGrainLoadingRate
TechnicalFeasibilityIs this technology feasible? Yes
CalPortland Page 10 of 14 Rillito

Regional Haze ‐ Four‐Factor Analysis
Table9‐CalPortlandRillito‐4FA‐D3FinishMillD3‐1‐DC2Baghouse‐ControlReview&CostAnalysis
Value Units Value Reference
Current Guaranteed Grain Loading
gr/dscf 0.01 [2]
Updated Grain Loading gr/dscf 0.005 [3]
Flow dscf 113,952 [1]Operating Hours hrs 6,491 [1]PM10 - Current Control
tpy 31.70 Calculated
PM10 - Potential Control
tpy 15.85 Calculated
PM10 Reduced tpy 15.85 Calculated
Total Cost $ - -
Cost Obtained from Vendor Quote? Yes / No - -
Capital Recovery Factor % - -
Annualized Cost $/yr - -Admin, Taxes, Insurance $/yr - -
Fixed Operating Cost $/yr - -
Variable Operating Cost $/yr - -
Total Annual Cost $/yr $487,584 Calculated using EPA Cost Manual
Cost of Control $/ton removed $30,763 CalculatedPost-Control Emission Rate gr/dscf 0.005 Calculated
Time Necessary for Compliance Years 3 Estimated based on permitting process and
purchase from vendors
Energy and Non-Air Environmental Impacts
Remaining Useful Life Years 20 EPA Cost Manual
1. 2028 Projected Emissions per ADEQ Emissions Projection Methodology2. Baseline emissions from baghouses are based on conservative grain loading rates that would be guaranteed by vendors.3. Achievable grain loading rate based on RACT/BACT/LAER Clearinghouse information.
N/A
RemainingUsefulLifeoftheSource(StatutoryFactor4)
IfControlTechnologyisTechnicallyFeasible,CompletetheFollowingPotentialPM10Reduction
CapitalImplementationCosts
CostofCompliance(StatutoryFactor1)
TimeNecessaryforCompliance(StatutoryFactor2)
EnergyandNon‐AirEnvironmentalImpacts(StatutoryFactor3)
If not, please explain
Parameter LowerGrainLoadingRate
TechnicalFeasibilityIs this technology feasible? Yes
CalPortland Page 11 of 14 Rillito

Regional Haze ‐ Four‐Factor Analysis
Table10‐CalPortlandRillito‐4FA‐Kiln4ClinkerCoolerH2‐GBBaghouse‐ControlReview&CostAnalysis
Value Units Value Reference
Current Guaranteed Grain Loading
gr/dscf 0.01 [2]
Updated Grain Loading gr/dscf 0.005 [3]
Flow dscf 115,000 [1]Operating Hours hrs 8,600 [1]PM10 - Current Control
tpy 42.39 Calculated
PM10 - Potential Control
tpy 21.19 Calculated
PM10 Reduced tpy 21.19 Calculated
Total Cost $ - -
Cost Obtained from Vendor Quote? Yes / No - -
Capital Recovery Factor % - -
Annualized Cost $/yr - -Admin, Taxes, Insurance $/yr - -
Fixed Operating Cost $/yr - -
Variable Operating Cost $/yr - -
Total Annual Cost $/yr $638,954 Calculated using EPA Cost Manual
Cost of Control $/ton removed $30,149 CalculatedPost-Control Emission Rate gr/dscf 0.005 Calculated
Time Necessary for Compliance Years 3 Estimated based on permitting process and
purchase from vendors
Energy and Non-Air Environmental Impacts
Remaining Useful Life Years 20 EPA Cost Manual
1. 2028 Projected Emissions per ADEQ Emissions Projection Methodology2. Baseline emissions from baghouses are based on conservative grain loading rates that would be guaranteed by vendors.3. Achievable grain loading rate based on RACT/BACT/LAER Clearinghouse information.
N/A
RemainingUsefulLifeoftheSource(StatutoryFactor4)
IfControlTechnologyisTechnicallyFeasible,CompletetheFollowingPotentialPM10Reduction
CapitalImplementationCosts
CostofCompliance(StatutoryFactor1)
TimeNecessaryforCompliance(StatutoryFactor2)
EnergyandNon‐AirEnvironmentalImpacts(StatutoryFactor3)
If not, please explain
Parameter LowerGrainLoadingRate
TechnicalFeasibilityIs this technology feasible? Yes
CalPortland Page 12 of 14 Rillito

Regional Haze ‐ Four‐Factor Analysis
Table11‐CalPortlandRillito‐4FA‐QuarryCrusherB2‐DC1Baghouse‐ControlReview&CostAnalysis
Value Units Value Reference
Current Guaranteed Grain Loading
gr/dscf 0.05 [2]
Updated Grain Loading gr/dscf 0.005 [3]
Flow dscf 18,922 [1]Operating Hours hrs 1,621 [1]PM10 - Current Control
tpy 6.57 Calculated
PM10 - Potential Control
tpy 0.66 Calculated
PM10 Reduced tpy 5.92 Calculated
Total Cost $ - -
Cost Obtained from Vendor Quote? Yes / No - -
Capital Recovery Factor % - -
Annualized Cost $/yr - -Admin, Taxes, Insurance $/yr - -
Fixed Operating Cost $/yr - -
Variable Operating Cost $/yr - -
Total Annual Cost $/yr $171,346 Calculated using EPA Cost Manual
Cost of Control $/ton removed $28,966 CalculatedPost-Control Emission Rate gr/dscf 0.005 Calculated
Time Necessary for Compliance Years 3 Estimated based on permitting process and
purchase from vendors
Energy and Non-Air Environmental Impacts
Remaining Useful Life Years 20 EPA Cost Manual
1. 2028 Projected Emissions per ADEQ Emissions Projection Methodology2. Baseline emissions from baghouses are based on conservative grain loading rates that would be guaranteed by vendors.3. Achievable grain loading rate based on RACT/BACT/LAER Clearinghouse information.
Parameter LowerGrainLoadingRate
Is this technology feasible? YesIf not, please explain
RemainingUsefulLifeoftheSource(StatutoryFactor4)
TechnicalFeasibility
IfControlTechnologyisTechnicallyFeasible,CompletetheFollowingPotentialPM10Reduction
CapitalImplementationCosts
CostofCompliance(StatutoryFactor1)
TimeNecessaryforCompliance(StatutoryFactor2)
EnergyandNon‐AirEnvironmentalImpacts(StatutoryFactor3)
N/A
CalPortland Page 13 of 14 Rillito

Regional Haze ‐ Four‐Factor Analysis
TableA.CalPortlandRillito‐ParametersforControlAnalysisParameter Value Units Notes
Median Reclaim Water Cost in AZ 0.001 $/gal https://efc.sog.unc.edu/sites/default/files/2017/2017%20Arizona%20Water%20&%20Wastewater%20Rates%20Report_0.pdfMedian Reclaim Water Cost in AZ 0.209 $/ton http://www.townofkearny.com/water.htmlWater application rate for Program C - Quarry Roads 0.64 gal/yd2 Facility Dust Control PlanWater application rate for Program C - Plant/Quarry Roads 0.16 gal/yd2 Facility Dust Control PlanWater application rate for Program C - Plant Roads 0.40 gal/yd2 Facility Dust Control PlanChemical Suppressant Control Efficiency for Program C 46% % Control Facility Dust Control PlanWater Application Control for 95% Total Unpaved Road Control 91% % Control CalculatedPotential Average Hourly Daytime Evaporation Rate 0.515 mm/hr Facility Dust Control PlanTime between applications 12 hours Facility Dust Control PlanQuarry Road System hourly traffic rate 38.1 vehicles/hr Facility Dust Control PlanPlant/Quarry Road System hourly traffic rate 9.6 vehicles/hr Facility Dust Control PlanPlant Road System hourly traffic rate 23.8 vehicles/hr Facility Dust Control PlanWater Application Rate for 95% Total Unpaved Road Control - Quarry 4.49 gal/yd2 CalculatedWater Application Rate for 95% Total Unpaved Road Control - Plant/Quarry 1.13 gal/yd2 CalculatedWater Application Rate for 95% Total Unpaved Road Control - Plant 2.81 gal/yd2 CalculatedUnpaved Road VMT Converted to yards for Quarry Roads 15,795,883 yd/yr 2028 BaselineUnpaved Road VMT Converted to yards for Plant/Quarry Roads 3,948,971 yd/yr 2028 BaselineUnpaved Road VMT Converted to yards for Plant Roads 9,872,427 yd/yr 2028 BaselineUnpaved Road Square Footage for Quarry Roads 157,958,827 yd2 Calculated - VMT converted to yards times 10 yard road width (estimated)Unpaved Road Square Footage for Quarry/Plant Roads 39,489,707 yd2 Calculated - VMT converted to yards times 10 yard road width (estimated)Unpaved Road Square Footage for Plant Roads 98,724,267 yd2 Calculated - VMT converted to yards times 10 yard road width (estimated)Baseline 2028 Projected Gallon Application for Quarry Roads 101,093,649 gal/yr CalculatedBaseline 2028 Projected Gallon Application for Quarry/Plant Roads 6,318,353 gal/yr CalculatedBaseline 2028 Projected Gallon Application for Plant Roads 39,489,707 gal/yr CalculatedBaseline 2028 Costs for Quarry Roads 87,951 $/yr CalculatedBaseline 2028 Costs for Quarry/Plant Roads 5,497 $/yr CalculatedBaseline 2028 Costs for Plant Roads 34,356 $/yr CalculatedIncreased Watering Gallon Application for Quarry Roads 709,790,851 gal/yr CalculatedIncreased Watering Gallon Application for Quarry/Plant Roads 44,711,235 gal/yr CalculatedIncreased Watering Gallon Application for Plant Roads 277,116,507 gal/yr CalculatedIncreased Watering Costs for Quarry Roads 617,518 $/yr CalculatedIncreased Watering Gallon Application for Quarry/Plant Roads 38,899 $/yr CalculatedIncreased Watering Gallon Application for Plant Roads 241,091 $/yr CalculatedCost of Watering Truck 395,000 $ https://www.machinerytrader.com/listings/construction-equipment/for-sale/27306867/2013-cat-740bAdditional Water Trucks necessary 8 Trucks Calculated based on additional water application necessaryAdditional Truck Capital Cost 3,160,000 $ CalculatedCost of Certified PM10 Street Sweeper 250,000 $ Quote from vendorPM10 Street Sweeper Control Efficiency 26 % https://www.wrapair.org/forums/dejf/fdh/content/Ch5-Paved_Roads_Rev06.pdfPM10 Emission Factor for Iron Stockpile 44.31 lb/acre-day 2018 EI
CalPortland Page 14 of 14 Rillito