feasibility of using ground penetrating radar (gpr)...
TRANSCRIPT
South DakotaDepartment of TransportationOffice of Research
Connecting South Dakota and the Nation
SD2005-05-F
Feasibility of Using Ground Penetrating Radar (GPR)
for Pavements, Utilities, and Bridges Prepared by INFRASENSE, Inc. 14 Kensington Road Arlington, MA 02476 August 2006
DISCLAIMER The contents of this report reflect the views of the authors who are responsible for the facts and accuracy of the data presented herein. The contents do not necessarily reflect the official views or policies of the South Dakota Department of Transportation, the State Transportation Commission, or the Federal Highway Administration. This report does not constitute a standard, specification, or regulation.
ACKNOWLEDGEMENTS This work was performed under the supervision of the SD2005-05 Technical Panel:
Phil Clements ....................Planning and Programming Jason Engbrecht .........................................Aeronautics Tom Gilsrud ...........................................Bridge Design Darin Hodges............................. Materials & Surfacing Dennis Johnson ...............................................Research Tom Lemhkuhl.............................................Operations
Bob Longbons ...............Planning and Programs Ken Marks ......... Transportation Inventory Mgt. Ron McMahon.........................................FHWA Paul Nelson................................... Pierre Region Lisa Rombough . Transportation Inventory Mgt. Dan Johnston ........................................Research
The authors would like to acknowledge Wiley Cunagin and Mike Hammons of Applied Research Associates for their contributions to the two surveys and to the cost-benefit analysis, and Doria Kutrubus of Radar Solutions International for her contribution to the Geotechnical demonstration. The work was performed in cooperation with the United States Department of Transportation, Federal Highway Administration.
TECHNICAL REPORT STANDARD TITLE PAGE 1. Report No. SD2005-05-F
2. Government Accession No.
3. Recipient's Catalog No.
4. Title and Subtitle Feasibility of Using Ground Penetrating Radar (GPR) for Pavements, Utilities, and Bridges
5. Report Date August 31, 2006
6. Performing Organization Code
7. Author(s) Principal Investigators
8. Performing Organization Report No.
9. Performing Organization Name and Address Infrasense, Inc 14 Kensington Road Arlington, MA 02476
10. Work Unit No.
11. Contract or Grant No. SDDOT 2005-05
12. Sponsoring Agency Name and Address South Dakota Department of Transportation Office of Research 700 East Broadway Avenue Pierre, SD 57501-2586
13. Type of Report and Period Covered Final Report June 1, 2005 – August 31, 2006
14. Sponsoring Agency Code
15. Supplementary Notes An executive summary is published separately as SD2005-05-X. 16. Abstract The objective of the project was to evaluate the feasibility and benefit of using Ground Penetrating Radar (GPR) for the evaluation of pavements, bridges, and utilities. The evaluation was carried out through a literature review, a survey of SDDOT personnel, a survey of the use of GPR by other state agencies, a series of demonstration projects, a cost/benefit analysis, and a utilization plan. The literature review and surveys indicated that the most common and effective transportation applications of GPR are for pavement thickness and bridge deck condition evaluations. The demonstration projects focused on these two applications, and on geotechnical applications for fault detection and evaluation of subgrade moisture content. The bridge deck evaluation showed that the GPR technology worked well for determining corrosion-induced delamination in overlaid decks with slab-on-girder construction, but was less effective on one-way slab bridges. The pavement evaluations, conducted on two AC and one PCC section, demonstrated the ability to accurately measure and plot pavement layer thickness. The subgrade moisture evaluation showed good correlation between GPR and boring data, and demonstrated the ability of GPR to map out variations of subgrade moisture content. The fault evaluation did not produce positive results, due to the attenuation caused by the high clay content in South Dakota soil. A cost-benefit analysis has been conducted for different scenarios shows benefit/cost ratios range from 1.98 for the bare deck delamination evaluation (GPR vs. sounding) to 113 for thickness quality assurance of new pavement. The analysis also shows the tradeoffs between using outside consultants vs. doing the work in-house. A utilization and equipment plan recommends that SDDOT initially use consultants for the lower volumes of startup work, and then move into owning and operating equipment and analyzing data when then volume increase warrants the additional investment. 17. Keywords Ground penetrating radar, GPR, pavement, bridge decks
18. Distribution Statement No restrictions. This document is available to the public from the sponsoring agency.
19. Security Classification (of this report) Unclassified
20. Security Classification (of this page) Unclassified
21. No. of Pages 119
22. Price

SD2005-05 AUGUST 31, 2006 FEASIBILITY OF USING GROUND PENETRATING RADAR PAGE i
Table of Contents
PAGE
1. EXECUTIVE SUMMARY....................................................................................................... 1
2. PROBLEM DESCRIPTION .................................................................................................... 7
3. OBJECTIVES ....................................................................................................................... 9
4. LITERATURE REVIEW ........................................................................................................ 11 4.1 GPR Application Studies 4.2 GPR Equipment and Software
5. SURVEY OF SDDOT PERSONNEL ...................................................................................... 17
6. SURVEY OF OTHER STATE AGENCIES ............................................................................... 19
7. TEST AND DEMONSTRATION PROJECTS ............................................................................ 21 7.1 Description of Test Sections 7.2 Data Collection 7.3 Data Analysis 7.4 Results of Data Analysis
8. COST-BENEFIT ANALYSIS .................................................................................................. 37 8.1 Computation of Cost 8.2 Cost Comparison Scenarios 8.3 Benefit Scenarios 8.4 Summary
9. UTILIZATION AND EQUIPMENT PLAN ................................................................................ 51 9.1 SDDOT Owning and Operating vs. Use of a Consultant 9.2 Staging of Implementation 9.3 Acquisition of a GPR System 9.4 Training Recommendations
10. FINDINGS AND CONCLUSIONS ............................................................................................ 57
11. IMPLEMENTATION RECOMMENDATIONS .......................................................................... 59
12. ANALYSIS OF RESEARCH BENEFITS .................................................................................. 61
13. REFERENCES ...................................................................................................................... 63
SD2005-05 AUGUST 31, 2006 FEASIBILITY OF USING GROUND PENETRATING RADAR PAGE ii
PAGE
APPENDIX A ............................................................................................................................. A.1 Interviews with SDDOT Personnel
APPENDIX B.............................................................................................................................. B.1 Results of Survey of Other State Agencies
APPENDIX C ............................................................................................................................. C.1 Principles of Ground Penetrating Radar for Bridge Deck and Pavement Evaluation
APPENDIX D ............................................................................................................................. D.1 Samples of GPR Data Antelope Creek Bridge (NB, Right Shoulder) I-90, MRM 244.75 Bridge using 1 GHz Antenna (WB, Inside Lane) I-90, MRM 244.75 Bridge using 2 GHz Antenna (EB along lane divider) US 18, MRM 242 – 250 AC Pavement (EB, Right Wheelpath) US 18, MRM 254 – 262 PCC Pavement (EB, Right Wheelpath)
APPENDIX E.............................................................................................................................. E.1 Bridge Deck Condition Maps Antelope Creek Bridge I-90, MRM 244.75 Bridge using 2 GHz Antenna Chapelle Creek Bridge
APPENDIX F .............................................................................................................................. F.1 Pavement Layer Thickness Plots SD 44 EB, MRM 80 to94.6 (1 of 2) SD 44 EB, MRM 80 to94.6 (2 of 2) US18 EB, MRM 242 to250.6 (1 of 2) US18 EB, MRM 242 to250.6 (2 of 2) US18 EB, MRM 254 to262 (1 of 2) US18 EB, MRM 254 to262 (2 of 2)
APPENDIX G ............................................................................................................................. G.1 Maps of Geotechnical Results Lees Corner SD, Subgrade Moisture, Area 1 Lees Corner SD, Subgrade Moisture, Area 2 Fault Survey (1 of 2) Fault Survey (2 of 2)
SD2005-05 AUGUST 31, 2006 FEASIBILITY OF USING GROUND PENETRATING RADAR PAGE iii
PAGE
List of Tables: Table 1 – Review of Published GPR Pavement Studies .................................................... 13 Table 2 – Review of Published GPR Bridge Deck Studies................................................ 14 Table 3 – Summary of Commercial GPR Equipment ........................................................ 15 Table 4 – Summary of Commercial GPR Software ........................................................... 15 Table 5 – Schedule of Data Collection............................................................................... 24 Table 6 – Pavement Testing/Sampling Protocol ................................................................ 26 Table 7 – Summary of Bridge Deck Results ...................................................................... 33 Table 8 – Comparison of GPR and Core Results ............................................................... 33 Table 9 – Costs of Equipment and Software ...................................................................... 38 Table 10 – Cost of Training, Maintenance, and Repair ..................................................... 39 Table 11 – Unit Costs for Consultant ................................................................................. 40 Table 12 – SDDOT Cost Estimate for One Week of Data Collection with Analysis ........ 41 Table 13 – Consultant Cost Estimate for One Week of Data Collection with Analysis .... 42 Table 14 – Comparison of Consultant Cost to SDDOT Costs for One Week Data Collection and Analysis ................................................... 42 Table 15 – SD 44 Layer Thicknesses as Determined by GPR........................................... 44 Table 16 – Backcalculation Results ................................................................................... 45 Table 17 – Cost for Chain Dragging a 5000 sf. Bridge Deck ............................................ 47 Table 18 – Benefit of Using GPR to Reduce Thickness Variability.................................. 50 Table 19 – Summary of Benefit Cost Analyses ................................................................. 50 Table 20 – Break Point for use of Consultants................................................................... 52 Table 21 – Available Highway GPR Systems.................................................................... 53 Table B.1 – List of Individuals and Agencies Contacted and Contact Status....................B-15 Table C.1 – GPR Velocities and Dielectric Constants for Pavement Materials ................C-3
SD2005-05 AUGUST 31, 2006 FEASIBILITY OF USING GROUND PENETRATING RADAR PAGE iv
PAGE List of Figures: Figure 1 – Field Setup of Horn Antenna Equipment.......................................................... 25 Figure 2 – Location of Fault Survey................................................................................... 27 Figure 3 – Sample GPR Data from Chapelle Creek Bridge, with Layer Processing ......... 28 Figure 4 – Sample GPR Data from SD 44, with Layer Processing.................................... 29 Figure 5 – Sample 200 MHz Data File from Fault Survey at offset 14N .......................... 30 Figure 6 – Sample of GPR Data from Site 2 near MRM 276.5 ......................................... 31 Figure 7 – Correlation Between GPR and Boring Data – Site 2 near MRM 276.5 ........... 31 Figure 8 – GPR vs. Cores ................................................................................................... 34 Figure 9 – Cores Taken from SD 44 .................................................................................. 35 Figure 10 – Time Depth Slice from 2.7-3.6 feet (200 MHz Antenna)............................... 36 Figure 11 – Sample Moisture Content Data, SD34 near MRM 277 .................................. 36 Figure 12 – Pay Factor vs. Thickness Deviation for Different COV's............................... 45 Figure 13 – Total Survey Costs vs. Number of Decks ....................................................... 51 Figure 14 – Total Survey Costs vs. Number of Lane Miles............................................... 52 Figure 15 – Integrated 2 GHz GPR Horn with FWD......................................................... 54 Figure 16 – Dual Noggin Ground-Coupled Sensors and Software System ....................... 54 Figure 17 – "RoadMap" Ground-Coupled GPR System.................................................... 55 Figure 18 – Data Analysis Screen from "Road Doctor" by Roadscanners ........................ 56 Figure C.1 – Structure of the GPR Signal for Concrete Bridge Decks ..............................C-2 Figure C.2 – Structure of the GPR Signal for Pavements ..................................................C-2
SD2005-05 AUGUST 31, 2006 FEASIBILITY OF USING GROUND PENETRATING RADAR PAGE 1
1. EXECUTIVE SUMMARY OBJECTIVES The objectives of this project were to (1) provide the SDDOT a comprehensive assessment of GPR technologies for transportation infrastructure; (2) develop a cost-benefit appraisal of the applicability and merit of acquiring GPR capabilities for routine applications; and (3) develop an implementation plan including costs and recommendations for equipment, application, training, and personnel requirements. GPR TECHNOLOGY ASSESSMENT LITERATURE REVIEW AND SURVEYS OF STATE PERSONNEL The project was carried out by initially conducting a literature review, and supplementing this review with a survey of GPR practices of other state highway agencies. The primary applications reported in the literature and by other states are measurement of pavement thickness, bridge deck delamination, and depth of reinforcing steel. The reported advantages of GPR are the ability to scan large areas quickly, the ability to minimize coring and traffic control, the detection of conditions not detectable by other means, and the discovery of unknown subsurface conditions prior to construction. The reported disadvantages include the set up time required, need for experienced operators for optimal results, and the complexity of equipment and data analysis. Five of the twelve state agencies responding to the survey perform GPR studies using state forces. The remaining agencies contract the work to consultants and state universities. In order to customize the results of the project to the SDDOT needs, members of the SDDOT staff were interviewed to assess their needs, interests, concerns, and preferences. The primary interests were to provide layer thickness for backcalculation, determine layer thickness and representative sections with fewer cores at network level, categorize pavement type (thick vs. thin), determine pavement thickness for design of process-in-place (PIP) rehabilitation, determine (salvage) quantities for plans, detect bridge deck deterioration at reasonable speed, reduce exposure of coring crews, detect subgrade moisture and sinkholes, and identify pavement stripping, air voids, and reinforcement location. The preference for SDDOT implementation of the technology is to train SDDOT staff to perform the data collection and analysis, provided it is feasible to obtain sufficient use of the technology to justify the investment in personnel and equipment. DEMONSTRATION PROJECTS Three demonstration projects were designed based on the interview feedback. The projects were classified as bridge deck evaluations, pavement evaluations, and geotechnical evaluations. The bridge deck evaluations consisted of one bare concrete deck, one concrete overlaid deck, and one asphalt overlaid deck. The bare deck and the concrete-overlaid decks were one-way slabs, and the asphalt-overlaid deck was a slab on steel girders. The bridge deck evaluation produced results showing concrete deterioration due to corrosion and ASR, rebar depth, concrete overlay delamination, and concrete and asphalt overlay thickness. ASR and concrete overlay delamination results were compared to results obtained by SDDOT staff using chain drag.
SD2005-05 AUGUST 31, 2006 FEASIBILITY OF USING GROUND PENETRATING RADAR PAGE 2
The bridge deck evaluation showed that the GPR technology worked well for determining corrosion-induced delamination in overlaid decks with slab-on-girder construction. The evaluation capability is diminished with one-way slab bridges due to the lack of a uniform mat of transverse steel for reference. The evaluation for ASR damage showed agreement with chain drag results in overall quantity estimates, but discrepancies in the location of the damaged areas. The GPR evaluation of PCC overlay delamination did not appear to agree with chain drag results. The GPR data was used to map the overlay thicknesses for the two overlaid decks and the rebar cover for all three decks, and the results appeared to agree with expected conditions. The pavement evaluation consisted of two asphalt pavements over granular base, and one concrete pavement over a bituminous base. The object of the evaluation was to determine the thickness of pavement layers. Cores were taken from each section for correlation with the GPR data, and FWD data was collected as well. The pavement evaluations demonstrated the ability to accurately measure and plot pavement layer thickness. The evaluation showed that the average difference between GPR and core results to be between 0.75, 0.40, and 0.45 inches for the two AC and one PCC section, respectively. The mean deviation between the GPR and core results for the AC base on the PCC section was 1.69 inches. In general, where there were large deviations between GPR and core values, the GPR gave the larger values, and the difference appeared to be due to portions of the core that remained in the hole. The geotechnical evaluation consisted of a subgrade moisture study on two adjacent pavement sections, and a subsurface fault evaluation. The subgrade moisture evaluation demonstrated the ability of GPR to map out variations of subgrade moisture content. The GPR data correlated well with boring data, and the correlation was used to calibrate the GPR data for moisture content. The fault evaluation did not produce positive results. It appears that the high clay content in South Dakota soil attenuates the GPR signal to the point that no useful data can be returned below 3 to 4 feet. COST/BENEFIT EVALUATION A cost-benefit evaluation of the application of GPR has been conducted. The analysis first looked into the costs of implementing a GPR survey program using both SDDOT equipment and labor and the alternative of using an outside consultant. These cost figures were then used to determine benefit/cost ratios for three scenarios: (1) pavement thickness evaluation for rehabilitation design; (2) bridge deck delamination evaluation for bare and overlaid decks; and (3) pavement thickness evaluation for quality assurance in newly constructed pavements. The results are shown below.
GPR APPLICATION SCENARIO BENEFIT/COST RATIO
Thickness Evaluation for Pavement Rehab 34.4
Condition Evaluation for M&R of Bridge Decks Bare Concrete Decks 1.98 Overlaid Decks 8.9
Thickness Evaluation for QA of New Pavement 57-113 UTILIZATION AND EQUIPMENT PLAN
SD2005-05 AUGUST 31, 2006 FEASIBILITY OF USING GROUND PENETRATING RADAR PAGE 3
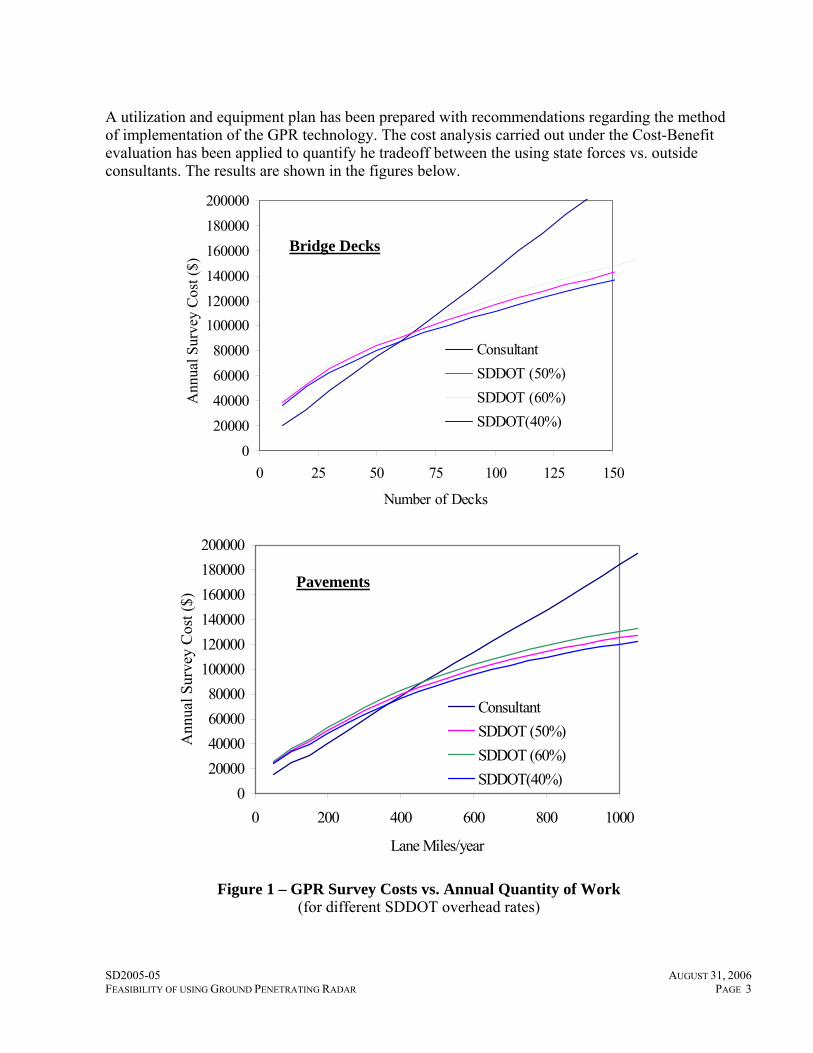
A utilization and equipment plan has been prepared with recommendations regarding the method of implementation of the GPR technology. The cost analysis carried out under the Cost-Benefit evaluation has been applied to quantify he tradeoff between the using state forces vs. outside consultants. The results are shown in the figures below.
0
20000
40000
60000
80000
100000120000
140000
160000
180000
200000
0 25 50 75 100 125 150
Number of Decks
Ann
ual S
urve
y C
ost (
$)
ConsultantSDDOT (50%)SDDOT (60%)SDDOT(40%)
020000400006000080000
100000120000140000160000180000200000
0 200 400 600 800 1000
Lane Miles/year
Ann
ual S
urve
y C
ost (
$)
ConsultantSDDOT (50%)SDDOT (60%)SDDOT(40%)
Figure 1 – GPR Survey Costs vs. Annual Quantity of Work (for different SDDOT overhead rates)
Bridge Decks
Pavements
SD2005-05 AUGUST 31, 2006 FEASIBILITY OF USING GROUND PENETRATING RADAR PAGE 4
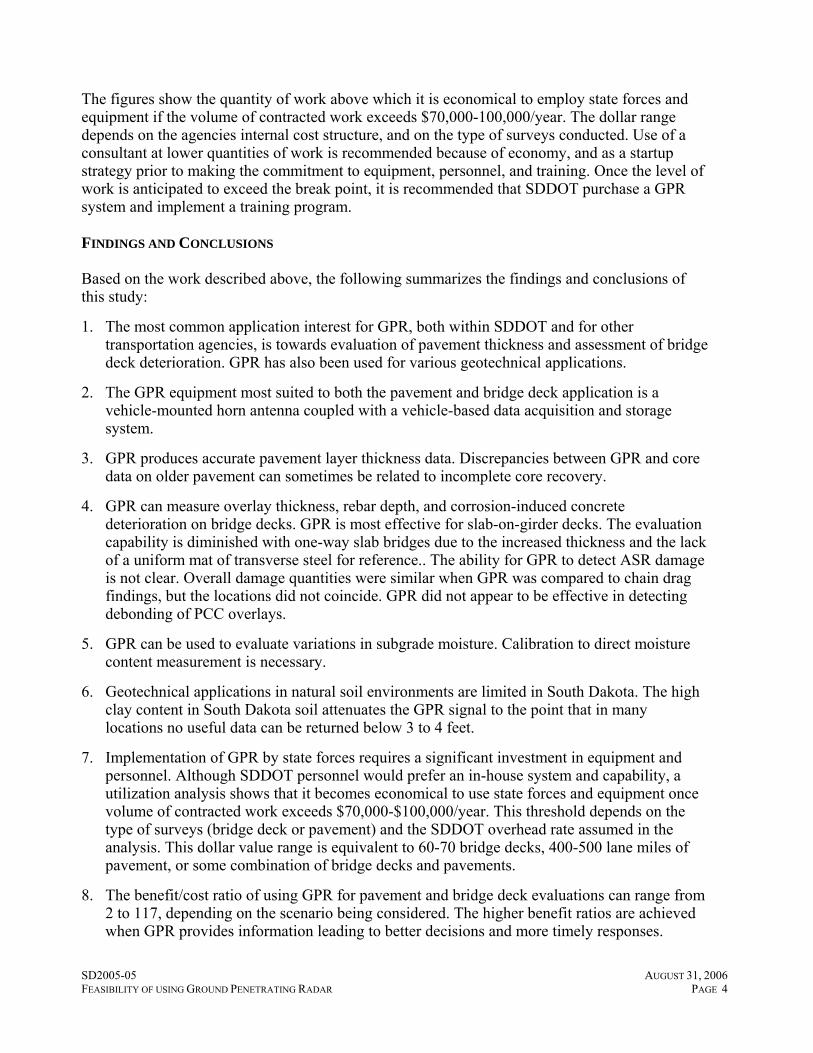
The figures show the quantity of work above which it is economical to employ state forces and equipment if the volume of contracted work exceeds $70,000-100,000/year. The dollar range depends on the agencies internal cost structure, and on the type of surveys conducted. Use of a consultant at lower quantities of work is recommended because of economy, and as a startup strategy prior to making the commitment to equipment, personnel, and training. Once the level of work is anticipated to exceed the break point, it is recommended that SDDOT purchase a GPR system and implement a training program. FINDINGS AND CONCLUSIONS Based on the work described above, the following summarizes the findings and conclusions of this study:
1. The most common application interest for GPR, both within SDDOT and for other transportation agencies, is towards evaluation of pavement thickness and assessment of bridge deck deterioration. GPR has also been used for various geotechnical applications.
2. The GPR equipment most suited to both the pavement and bridge deck application is a vehicle-mounted horn antenna coupled with a vehicle-based data acquisition and storage system.
3. GPR produces accurate pavement layer thickness data. Discrepancies between GPR and core data on older pavement can sometimes be related to incomplete core recovery.
4. GPR can measure overlay thickness, rebar depth, and corrosion-induced concrete deterioration on bridge decks. GPR is most effective for slab-on-girder decks. The evaluation capability is diminished with one-way slab bridges due to the increased thickness and the lack of a uniform mat of transverse steel for reference.. The ability for GPR to detect ASR damage is not clear. Overall damage quantities were similar when GPR was compared to chain drag findings, but the locations did not coincide. GPR did not appear to be effective in detecting debonding of PCC overlays.
5. GPR can be used to evaluate variations in subgrade moisture. Calibration to direct moisture content measurement is necessary.
6. Geotechnical applications in natural soil environments are limited in South Dakota. The high clay content in South Dakota soil attenuates the GPR signal to the point that in many locations no useful data can be returned below 3 to 4 feet.
7. Implementation of GPR by state forces requires a significant investment in equipment and personnel. Although SDDOT personnel would prefer an in-house system and capability, a utilization analysis shows that it becomes economical to use state forces and equipment once volume of contracted work exceeds $70,000-$100,000/year. This threshold depends on the type of surveys (bridge deck or pavement) and the SDDOT overhead rate assumed in the analysis. This dollar value range is equivalent to 60-70 bridge decks, 400-500 lane miles of pavement, or some combination of bridge decks and pavements.
8. The benefit/cost ratio of using GPR for pavement and bridge deck evaluations can range from 2 to 117, depending on the scenario being considered. The higher benefit ratios are achieved when GPR provides information leading to better decisions and more timely responses.
SD2005-05 AUGUST 31, 2006 FEASIBILITY OF USING GROUND PENETRATING RADAR PAGE 5
IMPLEMENTATION RECOMMENDATIONS Based on the Utilization and Equipment Plan presented in Section 9, the following are the implementation recommendations. 1. Use of SDDOT forces vs. Consultants It is recommended that SDDOT use of a consultant initially to develop experience with the work product, the equipment, and the methodology. Once consultant survey costs exceed $70,000 – 100,000 per year, it is recommended that SDDOT acquire and operate their own equipment, and carry out their own data analysis. 2. Equipment and Software It is recommended that SDDOT utilize a horn antenna GPR system. One such system that is currently available in the US is the GSSI Model 4105 horn antenna used with the SIR-20 acquisition and control system. Data analysis software such as "BridgeScan" and RoadScan" should also be acquired with this equipment. 3. Personnel Requirements Should SDDOT purchase GPR equipment and software, it is recommended that at least one FTE be assigned to the operation of the equipment and the data analysis. The total number of FTE's assigned to the GPR system operation will ultimately depend on the utilization of the system. 4. Training It is recommended that SDDOT initially utilize the full amount of training offered by the manufacturer, and that they supplement this training with ongoing analysis training and procedure revies. The manufacturer's training generally encompasses the use of the equipment and an introduction to the software. It is recommended that at least two members of the SDDOT staff be directly involved in this training, so that there is there is backup if someone is not available. Once SDDOT personnel becomes familiar with the the GPR system, it is recommended that a consultant be brought in for data analysis training and periodic reviews of methods and procedures. It is important to recognize that it takes some time to be fully functional with highway GPR, and that training is a critical part of this functionality. 5. Combining FWD and GPR Since SDDOT currently owns and operates an FWD, it is recommended that the GPR data used for FWD backcalculation be collected independently of the FWD vehicle. This approach provides more flexibility and does not require an integrated vehicle. Care must be exercised to ensure that GPR thicknesses used for FWD analysis are at the correct locations.

SD2005-05 AUGUST 31, 2006 FEASIBILITY OF USING GROUND PENETRATING RADAR PAGE 6
SD2005-05 AUGUST 31, 2006 FEASIBILITY OF USING GROUND PENETRATING RADAR PAGE 7
2. PROBLEM DESCRIPTION SDDOT has been interested in the possibilities of employing ground penetrating radar as a routine tool for multiple purposes for several years. GPR has a variety of applications of interest, including:
Pavement surveys for layer thickness and base layer material properties Bridge deck condition surveys for delamination and steel depth Construction quality control, steel depth and alignment and utility location Geotechnical applications
Although the technology offers significant promise of cost effective applications for pavements and bridges, there have been ongoing questions regarding implementation and interpretation software capabilities, as well as selection of appropriate radar systems for various uses. Originally developed for geotechnical evaluations and mine detection, GPR was introduced for highway applications in the early 1980's. Some initial highway applications, such as to detection of voids under joints in concrete pavements, were over-promoted and not particularly successful. In the late '80s and early '90's, GPR capabilities for assessment of highway structures was researched in further depth, and the capabilities and limitations of the technology became better understood. Work by the New England Transportation Consortium, Ontario Ministry of Transportation, and the Strategic Highway Research Program (SHRP) helped to establish the capabilities of GPR for bridge deck condition assessment, and work by the Texas Transportation Institute (TTI) and by SHRP helped to establish the capabilities of GPR for pavement evaluation. GPR has since become the subject of ongoing study by universities and research institutes and GPR evaluation studies have been carried out by over 15 highway agencies (see Tables 1 and 2). With all of this study as background, GPR has started to become a "mainstream" technology. The primary areas of current GPR highway applications are for pavement layer thickness evaluation, bridge deck condition assessment, measurement of depth of rebar, and dowel location. Numerous studies have confirmed that GPR can be used to accurately determine pavement layer thickness. The level of accuracy has been shown to depend on the type of pavement structure and on the degree of calibration used. The data has been used for rehabilitation design, FWD backcalculation, and pavement management. GPR has recently been explored for QA of new pavement construction, and for detection of moisture damage in asphalt pavement. GPR has also been documented as a technique for assessment of bridge deck deterioration. GPR was originally developed for asphalt-overlaid decks, since these decks do not readily lend themselves to traditional testing. It was subsequently extended to PCC overlaid decks, and to bare concrete decks. The use of GPR for bridge deck deterioration assessment is based on a relationship between the electromagnetic properties of the deck and mechanical damage. This relationship is not as straightforward as that used for pavement thickness and rebar depth measurement. GPR studies show that GPR can be a useful tool for estimating total repair quantities and general areas of deterioration, but less capable of pinpointing specific repair locations. Accuracy studies report that GPR is able to determine deterioration quantities to within ± 5% of the deck area. The accuracy of these predictions can depend on the availability of supporting information, such as from underside inspections, cores, and other measurements.
SD2005-05 AUGUST 31, 2006 FEASIBILITY OF USING GROUND PENETRATING RADAR PAGE 8
The use of GPR for detection of depth of reinforcement and location of dowel bars is fairly well established, and is being carried out by numerous agencies for QA of new deck construction and for other purposes. GPR is routinely used for utility detection and for geotechnical investigations. The effectiveness in utility application depends heavily on the characteristics of the overlying soil, and the nature of the target. The SDDOT has implemented the study presented in this report in order to assess the current state of GPR technology and available systems for different uses. Once this is accomplished, the proposed utilization of this technology by the Department can move forward in a rational way, if the research suggests the technology is ready for deployment. The study also seeks to examine the suitability of different configurations for different applications, provide a cost-benefit analysis and make recommendations for purchase and deployment of one or more radar systems depending on results. The results should clearly delineate the shortcomings of various systems and applications, and provide a realistic context for usage.
SD2005-05 AUGUST 31, 2006 FEASIBILITY OF USING GROUND PENETRATING RADAR PAGE 9
3. OBJECTIVES The objectives of the project were as follows:
1. Provide a comprehensive assessment of GPR technologies with regard to current and potential applications for transportation infrastructure.
2. Develop a cost-benefit appraisal of the applicability and merit of acquiring GPR capabilities for routine applications as appropriate.
3. Develop an implementation plan including costs and recommendations for equipment, application, training, personnel requirements, and maintenance.
The approach has been to investigate and demonstrate the application of GPR to SDDOT's pavements, bridge decks and utility and geotechnical evaluations so that SDDOT can effectively utilize the technology in the future. In order to achieve this objective, a review of previous work is presented so that SDDOT will see their efforts in the context of other experiences. In addition, a survey of SDDOT personnel has been carried out through personal contact and interviews, to clarify SDDOT's needs, procedures, and interests. This survey served to develop an understanding of the state's needs and expectations, and served to organize demonstration applications to meet these needs. In addition, a survey of GPR work in other agencies has been carried out so that SDDOT has the benefit of these other experiences and can avoid repeating what didn't work elsewhere. Application demonstrations have been designed and carried out to address the key variables both from SDDOT applications perspective, and from the GPR perspective. The applications have focused on bridge deck, pavement, and geotechnical applications. A cost-benefit analysis has been presented considering both full GPR system operation and processing by SDDOT, as well as contracting the GPR work to consultants. Each of these approaches has benefits, limitations, and costs, and these depend on the application and on the total amount of GPR work conducted. An equipment and utilization plan is presented addressing equipment purchase, operator training, software options, software/interpretation training, and staffing requirements.

SD2005-05 AUGUST 31, 2006 FEASIBILITY OF USING GROUND PENETRATING RADAR PAGE 10
SD2005-05 AUGUST 31, 2006 FEASIBILITY OF USING GROUND PENETRATING RADAR PAGE 11
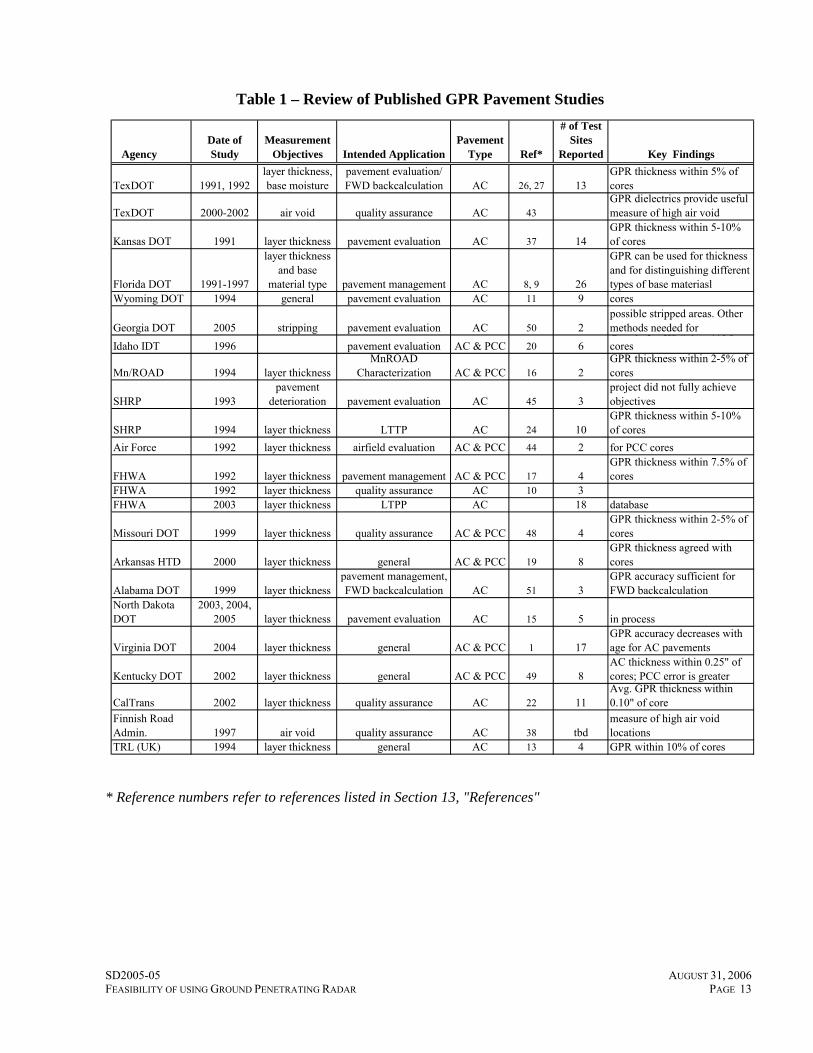
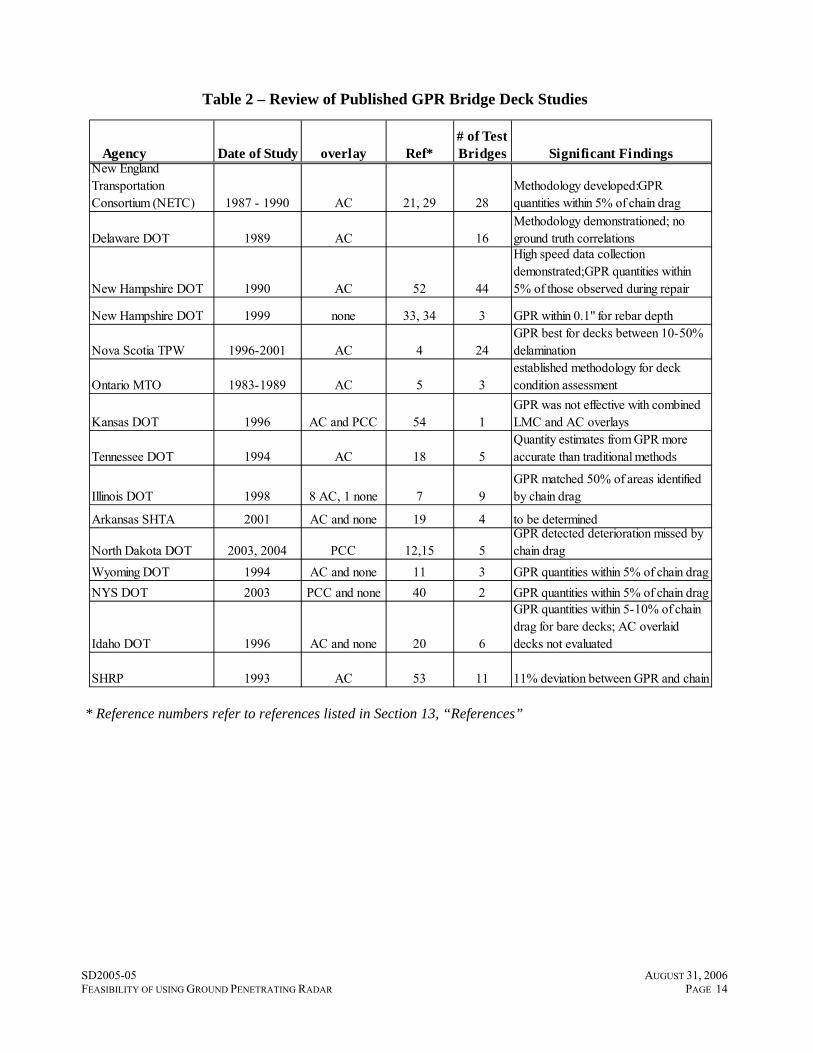
4. Literature Review The objective of this task has been to synthesize a comprehensive but concise review of literature dealing with the applications of GPR to pavements, bridge decks, and highway related geotechnical studies. While GPR has been in existence for over 30 years, the past 20 years have seen significant developments in GPR hardware and software, and in the application of the technology for pavements and bridge decks. The review has been divided into two parts: 1) GPR Application Studies, and 2) GPR Equipment and Software. The following sections describe these two subtasks in further detail. 4.1 GPR Application Studies Applications of GPR to pavements and bridge decks have been studied by a number of state, federal, and international agencies over the past 15 years, and specifications for the use of GPR have been prepared by ASTM and by other agencies. Tables 1 and 2 below provide a representative lists of studies that have been carried out. Table 1 summarizes a number of GPR application studies to pavements. The measurement objectives pursued in these studies included pavement thickness, pavement deterioration (eg., stripping), and pavement density or air void. Other studies, such as voids under concrete pavements and rebar dowel placement, have also been performed. The application goals of these studies have been for pavement evaluation for rehabilitation design, layer thickness evaluation for FWD backcalculation, pavement structure inventories for pavement management systems, and quality control and assurance of new pavement construction. For pavements, the primary focus has been the measurement of pavement thickness. Almost all of the published pavement thickness studies have been carried out using horn antennas. The studies have generally compared the GPR results to cores, and have shown differences that range from 2-10%. The lower differences (2-5%) are generally associated with newly constructed pavements, while the bigger differences are generally associated with older pavements. For bridge decks, the primary focus has been the measurement of delamination. Study focuses have ranged from determining overall deterioration quantities, to detailed mapping and comparison of delaminated areas. Most of the studies confirm that GPR provides a reasonable assessment of the overall quantity of deteriorated concrete. Studies conducted in Nova Scotia have identified that GPR quantity estimates for overlaid decks are most effective for deterioration quantities in the 10-50% range. Other studies that have sought to compare mapped locations have had mixed success, and the use of GPR for identifying localized area for removal and repair is questionable. Geotechnical applications have been carried out since GPR was first introduced in the early 1970's. These applications have included detecting groundwater, identifying bedrock, locating and mapping faults, locating utilities and underground storage tanks, and mapping contaminants. While there have been many applications, there are very few studies available which characterize the accuracy of these applications. One of the most comprehensive presentations of these capabilities has been compiled by Ulrkisen (47). GPR is generally known to be accurate for detecting and locating underground pipes, as long as the pipe appears clearly in the data. The
SD2005-05 AUGUST 31, 2006 FEASIBILITY OF USING GROUND PENETRATING RADAR PAGE 12
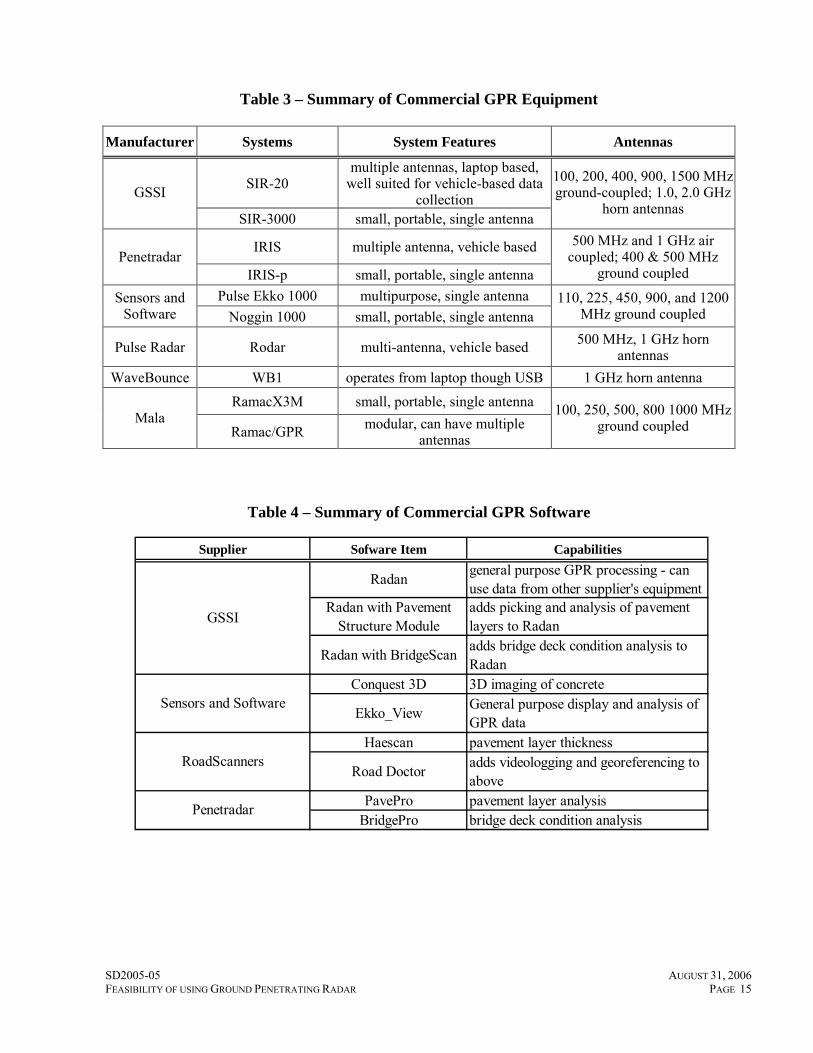
difficulty with GPR in these and other geotechnical applications is recognizing the object or target to be detected. Often the target is obscured by other reflectors, or is simply not detectable due to attenuation in the overburden soil. 4.2 GPR Equipment and Software Companies supplying GPR equipment and software are relatively few in number, and summaries of the key hardware and software providers relevant to this project are provided in Tables 3 and 4. The GPR "system" is the element that controls the data acquisition and stores and displays the data. The antenna is the element that transmits the GPR pulse and receives the GPR echoes. The antenna is primarily characterized by its frequency, and by whether it is ground- or air-coupled. The lower the frequency of the antenna, the greater the depth of penetration. The higher the frequency, the more able it is to resolve thin layers and shallow objects. Ground-coupled antennas are designed to operate in direct contact with the soil, concrete, or pavement. Once lifted from the surface, the efficiency of the antenna drops dramatically. The air-coupled antenna, on the other hand, is designed to radiate directly into air, and is generally operated 1 to 2 feet above the pavement surface. Because of the direct contact, ground-coupled antennas are able to radiate more energy into the ground than air-coupled antennas. Because of the standoff from the pavement surface, the air-coupled antenna data can be used to calculate the dielectric constant and velocity of the GPR wave in the pavement. This calculation can not be carried out with ground-coupled antennas. Amongst the GPR systems, there are two types: small, portable, single antenna systems, and larger, vehicle mounted, multi-antenna systems. The smaller systems are useful for geotechnical applications where mobility and portability is important. The larger systems are useful for highway applications where speed of data collection and the possibility of multiple antennas is useful.
SD2005-05 AUGUST 31, 2006 FEASIBILITY OF USING GROUND PENETRATING RADAR PAGE 13
Table 1 – Review of Published GPR Pavement Studies
* Reference numbers refer to references listed in Section 13, "References"
AgencyDate of Study
Measurement Objectives Intended Application
Pavement Type Ref*
# of Test Sites
Reported Key Findings
TexDOT 1991, 1992layer thickness, base moisture
pavement evaluation/ FWD backcalculation AC 26, 27 13
GPR thickness within 5% of cores
TexDOT 2000-2002 air void quality assurance AC 43GPR dielectrics provide useful measure of high air void
Kansas DOT 1991 layer thickness pavement evaluation AC 37 14GPR thickness within 5-10% of cores
Florida DOT 1991-1997
layer thickness and base
material type pavement management AC 8, 9 26
GPR can be used for thickness and for distinguishing different types of base materiasl
Wyoming DOT 1994 general pavement evaluation AC 11 9 cores
Georgia DOT 2005 stripping pavement evaluation AC 50 2possible stripped areas. Other methods needed for
Idaho IDT 1996 pavement evaluation AC & PCC 20 6G t c ess w t 7% ocores
Mn/ROAD 1994 layer thicknessMnROAD
Characterization AC & PCC 16 2GPR thickness within 2-5% of cores
SHRP 1993pavement
deterioration pavement evaluation AC 45 3project did not fully achieve objectives
SHRP 1994 layer thickness LTTP AC 24 10GPR thickness within 5-10% of cores
Air Force 1992 layer thickness airfield evaluation AC & PCC 44 2 for PCC cores
FHWA 1992 layer thickness pavement management AC & PCC 17 4GPR thickness within 7.5% of cores
FHWA 1992 layer thickness quality assurance AC 10 3FHWA 2003 layer thickness LTPP AC 18 database
Missouri DOT 1999 layer thickness quality assurance AC & PCC 48 4GPR thickness within 2-5% of cores
Arkansas HTD 2000 layer thickness general AC & PCC 19 8GPR thickness agreed with cores
Alabama DOT 1999 layer thicknesspavement management, FWD backcalculation AC 51 3
GPR accuracy sufficient for FWD backcalculation
North Dakota DOT
2003, 2004, 2005 layer thickness pavement evaluation AC 15 5 in process
Virginia DOT 2004 layer thickness general AC & PCC 1 17GPR accuracy decreases with age for AC pavements
Kentucky DOT 2002 layer thickness general AC & PCC 49 8AC thickness within 0.25" of cores; PCC error is greater
CalTrans 2002 layer thickness quality assurance AC 22 11Avg. GPR thickness within 0.10" of core
Finnish Road Admin. 1997 air void quality assurance AC 38 tbd
measure of high air void locations
TRL (UK) 1994 layer thickness general AC 13 4 GPR within 10% of cores
SD2005-05 AUGUST 31, 2006 FEASIBILITY OF USING GROUND PENETRATING RADAR PAGE 14
Table 2 – Review of Published GPR Bridge Deck Studies
* Reference numbers refer to references listed in Section 13, “References”
Agency Date of Study overlay Ref*# of Test Bridges Significant Findings
New England Transportation Consortium (NETC) 1987 - 1990 AC 21, 29 28
Methodology developed:GPR quantities within 5% of chain drag
Delaware DOT 1989 AC 16Methodology demonstrationed; no ground truth correlations
New Hampshire DOT 1990 AC 52 44
High speed data collection demonstrated;GPR quantities within 5% of those observed during repair
New Hampshire DOT 1999 none 33, 34 3 GPR within 0.1" for rebar depth
Nova Scotia TPW 1996-2001 AC 4 24GPR best for decks between 10-50% delamination
Ontario MTO 1983-1989 AC 5 3established methodology for deck condition assessment
Kansas DOT 1996 AC and PCC 54 1GPR was not effective with combined LMC and AC overlays
Tennessee DOT 1994 AC 18 5Quantity estimates from GPR more accurate than traditional methods
Illinois DOT 1998 8 AC, 1 none 7 9GPR matched 50% of areas identified by chain drag
Arkansas SHTA 2001 AC and none 19 4 to be determined
North Dakota DOT 2003, 2004 PCC 12,15 5GPR detected deterioration missed by chain drag
Wyoming DOT 1994 AC and none 11 3 GPR quantities within 5% of chain dragNYS DOT 2003 PCC and none 40 2 GPR quantities within 5% of chain drag
Idaho DOT 1996 AC and none 20 6
GPR quantities within 5-10% of chain drag for bare decks; AC overlaid decks not evaluated
SHRP 1993 AC 53 11 11% deviation between GPR and chain
SD2005-05 AUGUST 31, 2006 FEASIBILITY OF USING GROUND PENETRATING RADAR PAGE 15
Table 3 – Summary of Commercial GPR Equipment
Manufacturer Systems System Features Antennas
SIR-20 multiple antennas, laptop based,
well suited for vehicle-based data collection GSSI
SIR-3000 small, portable, single antenna
100, 200, 400, 900, 1500 MHz ground-coupled; 1.0, 2.0 GHz
horn antennas
IRIS multiple antenna, vehicle based Penetradar
IRIS-p small, portable, single antenna
500 MHz and 1 GHz air coupled; 400 & 500 MHz
ground coupled Pulse Ekko 1000 multipurpose, single antenna Sensors and
Software Noggin 1000 small, portable, single antenna 110, 225, 450, 900, and 1200
MHz ground coupled
Pulse Radar Rodar multi-antenna, vehicle based 500 MHz, 1 GHz horn antennas
WaveBounce WB1 operates from laptop though USB 1 GHz horn antenna RamacX3M small, portable, single antenna
Mala Ramac/GPR modular, can have multiple
antennas
100, 250, 500, 800 1000 MHz ground coupled
Table 4 – Summary of Commercial GPR Software
Supplier Sofware Item Capabilities
Radan general purpose GPR processing - can use data from other supplier's equipment
Radan with Pavement Structure Module
adds picking and analysis of pavement layers to Radan
Radan with BridgeScan adds bridge deck condition analysis to Radan
Conquest 3D 3D imaging of concrete
Ekko_View General purpose display and analysis of GPR data
Haescan pavement layer thickness
Road Doctor adds videologging and georeferencing to above
PavePro pavement layer analysisBridgePro bridge deck condition analysis
RoadScanners
Penetradar
Sensors and Software
GSSI

SD2005-05 AUGUST 31, 2006 FEASIBILITY OF USING GROUND PENETRATING RADAR PAGE 16
SD2005-05 AUGUST 31, 2006 FEASIBILITY OF USING GROUND PENETRATING RADAR PAGE 17
5. SURVEY OF SDDOT PERSONNEL Seven groups were interviewed in a series of one-hour sessions on June 9 and 10, 2005. The purpose of the interviews was to understand SDDOT's background and interest in GPR and their expectations for the project. This information would be used to structure the project to best meet SDDOT's needs and objectives. A structured series of questions was developed. The groups interviewed represented senior participants from pavement and bridge design, management, and maintenance, airport, materials, road inventory, geotechnical, and Pierre and Rapid City regions. A complete summary of the responses to each of the survey questions is presented in Appendix A. The following summarizes the interview responses to the key areas covered in the survey. Familiarity with GPR: The direct familiarity of the group with GPR ranged from none, to attendance of the Marc Loken-MnDOT workshop last year, to exposure to a couple of past research projects. Indirect experience included exposure to literature, conference presentations, AASHTO and research panel meetings, and a FHWA demonstration. The biggest reservation about GPR is whether or not it really works and will provide useful and consistent accuracy, be easy to use, interpret, and understand. The desired outcomes of this project would be to provide layer thickness for backcalculation, determine layer thickness and representative sections with fewer cores at network level, categorize pavement type (thick vs. thin), determine (salvage) quantities for plans, detect bridge deck deterioration at reasonable speed, to reduce exposure of coring crews, detect subgrade moisture and sinkholes, and identify pavement stripping, air voids, and reinforcement location. Current methodologies involve using cores, DCP, chain drag, pachometer, visual inspection, split spoon for subgrade condition, and existing plans. Information Gained from GPR surveys would be used to obtain accurate data for pavement management, developing scopes of work, monitoring changes of condition with time, plotting bridge deterioration and calculating quantities, estimating salvage quantities, and evaluating types of mitigation that needs to be done for the subgrade prior to resurfacing, The priorities of the project should be on bridge deck deterioration and pavement thickness and reinforcement location. The project should determine applications that will work reliably, and specify how to implement GPR for these applications. The selected applications should be supported by evidence from cores and other known information. Preference for SDDOT Implementation is to train SDDOT staff to perform the data collection and analysis, provided it is feasible to obtain sufficient use of the technology to justify the investment in personnel and equipment. Candidate Projects Include:
Pavements—SD 248, SD 44 by Scenic, US 18 East of Winner, SD 262 from Alexandria to Bridgewater, and I-90 CRCP, SD 12 east of Aberdeen for dowel bar depth and alignment, Pierre Airport.
SD2005-05 AUGUST 31, 2006 FEASIBILITY OF USING GROUND PENETRATING RADAR PAGE 18
Bridge Decks—should include asphalt mat, bare deck, and rigid overlay with a debond problem; rubberized asphalt chip seal (RACS), epoxy chip seal. One specific location was US 83 at Mission Antelope Creek Geotechnical—identifying the depth of quartzite in the Sioux Falls area; determining ground water level in the Aberdeen area; using both ground coupled and air coupled antennae over a fault zone on SD 34 and SD 14; evaluating an inverted crown problem (i.e., outside of roadway swelled) at Lee’s Corner on SD 34 (check moisture levels on inside and outside)
SD2005-05 AUGUST 31, 2006 FEASIBILITY OF USING GROUND PENETRATING RADAR PAGE 19
6. SURVEY OF OTHER STATE AGENCIES The state survey produced responses from Alabama, California, Colorado, Florida, Georgia, Illinois, Kansas, Missouri, Nevada, North Carolina, Oklahoma, and Texas The survey included sixteen questions designed to provide information on the extent and characteristics of GPR usage within the states. The responses to each of these questions are summarized in the following sections. What groups within your State have experience with Ground Penetrating Radar (GPR)? The groups with experience using GPR varied widely among the States. The groups identified fall generally into the following categories Materials, Design, Maintenance, Construction, Geotechnical, Pavement Management, Research, and Archaeology. These groups may be located in the central office and/or the district offices. How long has GPR been used by your agency? The respondents reported length of usage from occasional demonstrations of the technology to decades. States reporting significant usage included California, Florida, Georgia, Illinois, Kansas, Missouri, North Carolina, and Texas. Do you perform GPR work using States forces or through a contractor(s). Five of the twelve state responding perform GPR studies using state forces. The remaining use consultants, including contracting with state universities. For what applications has GPR been used by your agency? The states reported using GPR for all or some of the following applications:
Pavement surveys for layer thickness and base layer material properties Pavement forensic studies Detection of voids under PCC pavement Bridge deck condition surveys for delamination and steel depth Construction quality control, steel depth and alignment and utility location Geotechnical
Several states use GPR for all or most of these applications. Additional applications include archaeological studies, cooperation with law enforcement for forensic purposes, and location of utilities. Has GPR been effective in the application(s) for which it has been used by your agency? Most of the states that have committed to using GPR report that it has been successful. They indicate that GPR is an optimum method for performing studies that are time consuming and costly or may not be possible at all using other technologies.
SD2005-05 AUGUST 31, 2006 FEASIBILITY OF USING GROUND PENETRATING RADAR PAGE 20
What are the advantages and disadvantages of the GPR equipment that your agency has used versus other methods for obtaining the same data? What other methods have you used? Advantages of GPR reported by the states included the ability to scan large areas in a short period of time. Other advantages include speed of acquisition, low cost for data acquisition, and high sample density. The nondestructive nature of the technology was also noted, especially as compared to pavement coring. Some states noted that GPR can do tasks that other approaches cannot, including detection of moist areas under the pavement. Discovery of unknown subsurface conditions prior to design and construction was identified. The disadvantages include the set up time required, need for experienced operators for optimal results, complexity of equipment, and limited depth capability. The level of precision and accuracy was questioned. The need to perform highway surveys at highway speeds was mentioned as a desirable attribute that would eliminate the requirement for traffic control. Other methods specified included coring, dynamic core penetrometer, trenching, hand sounding, and thermography. What are the cost related characteristics of the GPR equipment that your agency uses? The states responded to this question with cost information. Those state that use a consultant of contractor to perform GPR related surveys generally did not report costs for those services. Illinois reported that surveys cost 40 cents per square foot. Those states reporting initial cost gave a range of values. Florida reported $300,000 for all new equipment and software, including the vehicle. Texas reported $106,680, including $30,000 for the radar hardware itself. Florida uses one FTE for GPR surveys while Texas uses two operators per vehicle. The states reported minimal maintenance expenses. The production rates varied. Florida has used its GPR system to acquire network level thickness data. Texas performs about 33 miles per day for forensics projects but 100-200 miles per day for layer thickness determination. Illinois reported less than half a day to survey a bridge. The time required for data analysis was reported as about one hour per 100 meter square grid for area mapping. Texas indicated that surveys require approximately ten minutes per mile, depending on the complexity of the underlying structure. The number of layers and subsurface anomalies can increase processing time. Complexity of the equipment and data acquisition system—software requirements and support The states reported that the equipment and software require trained and experienced operators. The operators should understand both how to operate the equipment and software and the engineering principles concerning the pavement and/or structure being surveyed.
SD2005-05 AUGUST 31, 2006 FEASIBILITY OF USING GROUND PENETRATING RADAR PAGE 21
Calibration requirements Calibration requirements varied from daily calibration as a part of the setup to annual vehicle calibration for vehicles. What procedures/protocols do you follow in using GPR equipment? Before data collection, metal plates under the air launched antenna are used to set signal level within an acceptable range. A distance measuring instrument, if used, is also calibrated. What procedures/protocols do you follow in interpreting GPR data? Formal procedures and protocols were not reported. Several options were reported, including:
Excel spreadsheets Radan 6.5 Graphic representation of data Custom software provided by consultants
What test(s) has your agency performed concerning the repeatability and/or accuracy of GPR equipment? What were the results? Most of the respondents reported checking the accuracy of GPR versus ground truth data. Cores were frequently used to provide the reference data. Most states reported that the data are generally repeatable. Accuracy results were mixed. Texas reported “precision for thickness is approximately ± 0.1 inches for measurements within the top 16 inches or so.” Have you used GPR for construction project quality control? How? States reported the use or investigation of GPR for construction quality control for:
Verification of steel reinforcement location Top layer thickness for hot mix overlay
What types/brands of GPR equipment have been used by your agency? States reported use of the following GPR equipment:
GSSI WaveBounce Penetradar HERMES II Sensors and Software Pulse Radar
What properties has your agency measured using GPR? Properties measured by the states included:
Dimensions of concrete Location of rebar Depth of rebar Location of voids Delamination on bridge decks Material velocity and depth of burial Forensic sink hole location Asphalt thickness surveys Stripping is asphalt Moisture in subgrade soils
SD2005-05 AUGUST 31, 2006 FEASIBILITY OF USING GROUND PENETRATING RADAR PAGE 22
At what frequencies do your GPR antennae operate? The reported operational frequencies included:
50 MHz, 80 MHz, 100 MHz, 250 MHz, 400 MHz, 500 MHz, 900 MHz, 1.0 GHz, 1.5 GHz, and 2.0 GHz
What software does your agency use for interpreting GPR data? The data interpretation software reported by the states included:
Microsoft Excel GSSI Radan Sensors and Software products (EKKO View Deluxe, EKKO Mapper, Transform) Terra from Pulse Radar Road Structure assessment from GSSI ColorMap software (developed by TTI).
SD2005-05 AUGUST 31, 2006 FEASIBILITY OF USING GROUND PENETRATING RADAR PAGE 23
7. TEST AND DEMONSTRATION PROJECTS 7.1 Description of the Test Sections 7.1.1 Bridge Decks Below is a brief description of each bridge based on SDDOT records and visual observations. Chapelle Creek Bridge This bridge is 196.5 feet long with a 30-foot wide roadway. It has 5 spans, and is located on SD 34 near MRM 232. The concrete deck is 6 inches thick with a nominal 2-inch thick asphalt overlay. The specified rebar cover is 1.25 inches. The deck is supported on steel girders, and the bridge has no skew. The bridge was originally constructed in 1949. The AC overlay was added in 2002. There was no available record of any deck repair. Data from an underside visual survey was available from the SDDOT. Antelope Creek Bridge This bridge is 112 feet long with a 52-foot wide roadway, and carries 2 lanes in each direction. It has 3 spans, and is located in Mission on US 83. The deck and superstructure is a continuous concrete slab whose thickness ranges from approximately 12 inches at the abutments and mid-span, to 18 inches at the piers. The bridge appears to have been constructed in 1980. Of concern in this bridge is the appearance of ASR on the surface and subsurface of the bridge. WB Overpass on I-90 at MRM 244.75 This bridge is 119 feet long with a 38-foot wide roadway that carries 2 lanes of traffic in the westbound direction. The bridge has 3 spans. The deck and superstructure is a continuous concrete slab whose thickness ranges from approximately 15 inches at the abutments and mid-span, to 20 inches at the piers. The deck was originally constructed in 1969, and a 2-inch thick LMC overlay was added in 1979. Of concern here is the debonding of the overlay. A chain-drag map showing locations of debonded overlay was available from the SDDOT. 7.1.2 Pavement Sections SD 44, MRM 88-95, near Scenic This section was nominally 4 inches of AC over 5 inches of lime-=treated aggregate. It was patched in 1999 and 2001. US 18, MRM 242-250, west of Winner This section is nominally 8 inches of AC over a 9 inch gravel base. US 18, MRM 254-262, east of Winner This section is nominally 8 inches of PCC over 5 inches of AC and 3 inches of lime treated aggregate.
SD2005-05 AUGUST 31, 2006 FEASIBILITY OF USING GROUND PENETRATING RADAR PAGE 24
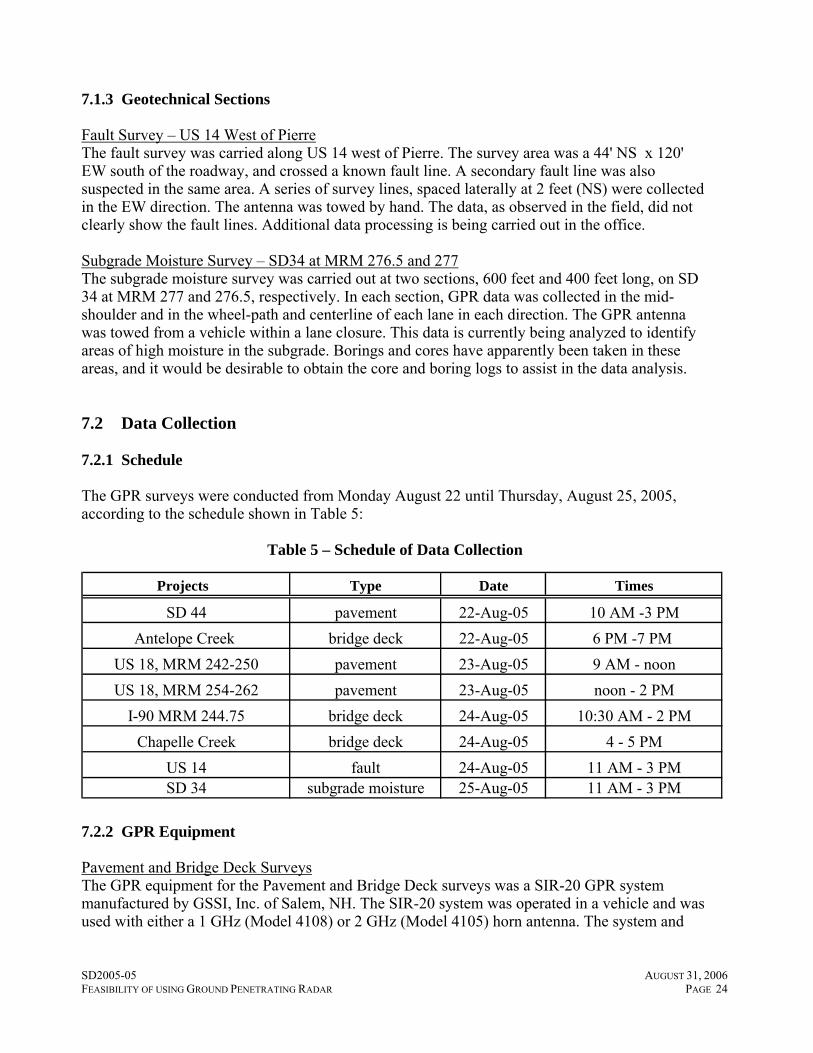
7.1.3 Geotechnical Sections Fault Survey – US 14 West of Pierre The fault survey was carried along US 14 west of Pierre. The survey area was a 44' NS x 120' EW south of the roadway, and crossed a known fault line. A secondary fault line was also suspected in the same area. A series of survey lines, spaced laterally at 2 feet (NS) were collected in the EW direction. The antenna was towed by hand. The data, as observed in the field, did not clearly show the fault lines. Additional data processing is being carried out in the office. Subgrade Moisture Survey – SD34 at MRM 276.5 and 277 The subgrade moisture survey was carried out at two sections, 600 feet and 400 feet long, on SD 34 at MRM 277 and 276.5, respectively. In each section, GPR data was collected in the mid-shoulder and in the wheel-path and centerline of each lane in each direction. The GPR antenna was towed from a vehicle within a lane closure. This data is currently being analyzed to identify areas of high moisture in the subgrade. Borings and cores have apparently been taken in these areas, and it would be desirable to obtain the core and boring logs to assist in the data analysis. 7.2 Data Collection 7.2.1 Schedule The GPR surveys were conducted from Monday August 22 until Thursday, August 25, 2005, according to the schedule shown in Table 5:
Table 5 – Schedule of Data Collection
Projects Type Date Times
SD 44 pavement 22-Aug-05 10 AM -3 PMAntelope Creek bridge deck 22-Aug-05 6 PM -7 PM
US 18, MRM 242-250 pavement 23-Aug-05 9 AM - noonUS 18, MRM 254-262 pavement 23-Aug-05 noon - 2 PM
I-90 MRM 244.75 bridge deck 24-Aug-05 10:30 AM - 2 PMChapelle Creek bridge deck 24-Aug-05 4 - 5 PM
US 14 fault 24-Aug-05 11 AM - 3 PMSD 34 subgrade moisture 25-Aug-05 11 AM - 3 PM
7.2.2 GPR Equipment Pavement and Bridge Deck Surveys The GPR equipment for the Pavement and Bridge Deck surveys was a SIR-20 GPR system manufactured by GSSI, Inc. of Salem, NH. The SIR-20 system was operated in a vehicle and was used with either a 1 GHz (Model 4108) or 2 GHz (Model 4105) horn antenna. The system and
SD2005-05 AUGUST 31, 2006 FEASIBILITY OF USING GROUND PENETRATING RADAR PAGE 25
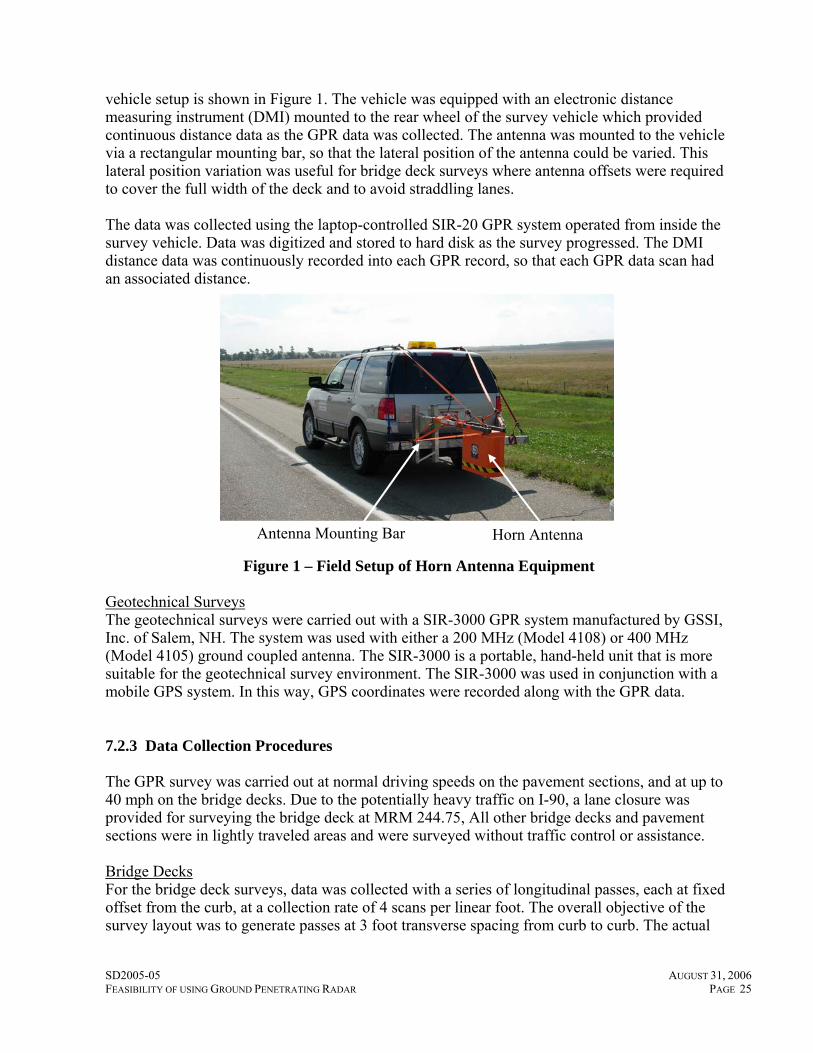
vehicle setup is shown in Figure 1. The vehicle was equipped with an electronic distance measuring instrument (DMI) mounted to the rear wheel of the survey vehicle which provided continuous distance data as the GPR data was collected. The antenna was mounted to the vehicle via a rectangular mounting bar, so that the lateral position of the antenna could be varied. This lateral position variation was useful for bridge deck surveys where antenna offsets were required to cover the full width of the deck and to avoid straddling lanes. The data was collected using the laptop-controlled SIR-20 GPR system operated from inside the survey vehicle. Data was digitized and stored to hard disk as the survey progressed. The DMI distance data was continuously recorded into each GPR record, so that each GPR data scan had an associated distance.
Chapter 2 Chapter 3 Chapter 4 Chapter 5
Figure 1 – Field Setup of Horn Antenna Equipment Geotechnical Surveys The geotechnical surveys were carried out with a SIR-3000 GPR system manufactured by GSSI, Inc. of Salem, NH. The system was used with either a 200 MHz (Model 4108) or 400 MHz (Model 4105) ground coupled antenna. The SIR-3000 is a portable, hand-held unit that is more suitable for the geotechnical survey environment. The SIR-3000 was used in conjunction with a mobile GPS system. In this way, GPS coordinates were recorded along with the GPR data. 7.2.3 Data Collection Procedures The GPR survey was carried out at normal driving speeds on the pavement sections, and at up to 40 mph on the bridge decks. Due to the potentially heavy traffic on I-90, a lane closure was provided for surveying the bridge deck at MRM 244.75, All other bridge decks and pavement sections were in lightly traveled areas and were surveyed without traffic control or assistance. Bridge Decks For the bridge deck surveys, data was collected with a series of longitudinal passes, each at fixed offset from the curb, at a collection rate of 4 scans per linear foot. The overall objective of the survey layout was to generate passes at 3 foot transverse spacing from curb to curb. The actual
Horn Antenna Antenna Mounting Bar
SD2005-05 AUGUST 31, 2006 FEASIBILITY OF USING GROUND PENETRATING RADAR PAGE 26
location of each pass was determined approximately by visual reference using lane markers and other visual reference points. For the driving speed surveys, data collection for each pass was initiated about 100 feet before the vehicle reached the actual start of the deck. All decks were surveyed with the 1 GHz horn antenna. An additional survey with the 2 GHz horn antenna was carried out on the I-90 bridge. Pavements For the pavement sections, GPR data was collected in both travel directions and in both the right and left wheelpaths of each tested lane. The data collection rate was 1 scan per foot of travel. Marks were manually placed in the data at mileposts and other locations requiring referencing. FWD data was collected immediately following the GPR data collection, and the FWD data collection was followed by coring. The following protocol was implemented for the FWD testing and coring as shown in Table 6.
Table 6 – Pavement Testing/Sampling Protocol
Site Direction FWD Cores
SD 44 EB At MRM's and 0.2 mile intervals from MRM's
At MRM's and 0.2, 0.6, and 0.8 miles from MRM
SD 44 WB At 0.1, 0.3, … mile intervals from MRM 94 + 0.8 mi none
US 18, MRM 242-250 EB At MRM's and 0.2 mile
intervals from MRM's At MRM's and 0.6 miles from MRM
US 18, MRM 242-250 WB At 0.1, 0.3, … mile intervals
from MRM 250 none
US 18, MRM 254-262 EB At MRM's and 0.2 mile
intervals from MRM's At MRM's
US 18, MRM 254-262 WB At 0.1, 0.3, … mile intervals
from MRM 262 none
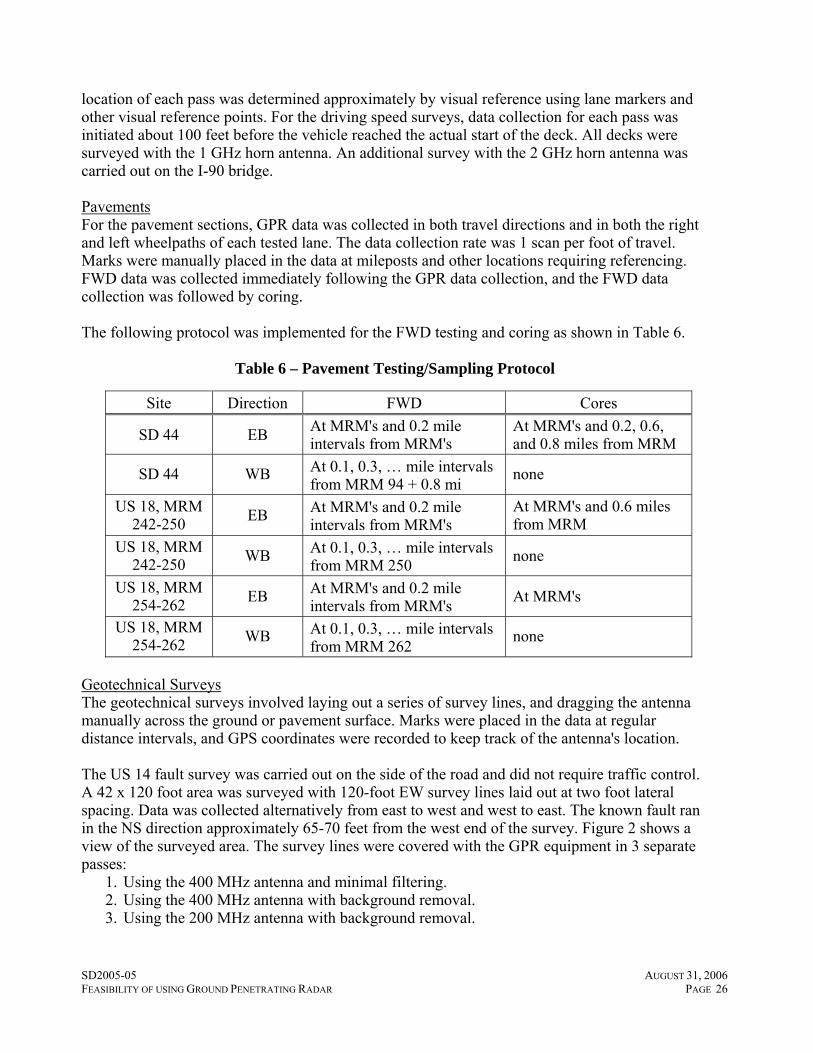
Geotechnical Surveys The geotechnical surveys involved laying out a series of survey lines, and dragging the antenna manually across the ground or pavement surface. Marks were placed in the data at regular distance intervals, and GPS coordinates were recorded to keep track of the antenna's location. The US 14 fault survey was carried out on the side of the road and did not require traffic control. A 42 x 120 foot area was surveyed with 120-foot EW survey lines laid out at two foot lateral spacing. Data was collected alternatively from east to west and west to east. The known fault ran in the NS direction approximately 65-70 feet from the west end of the survey. Figure 2 shows a view of the surveyed area. The survey lines were covered with the GPR equipment in 3 separate passes:
1. Using the 400 MHz antenna and minimal filtering. 2. Using the 400 MHz antenna with background removal. 3. Using the 200 MHz antenna with background removal.
SD2005-05 AUGUST 31, 2006 FEASIBILITY OF USING GROUND PENETRATING RADAR PAGE 27
The data from Step 1 with the 400 MHz antenna did not reveal useful data regarding the fault, and the background removal was implemented to try to bring out more subtle features. This also did not appear to be successful, and the final recourse was to the lower frequency 200 MHz antenna.
(a) View of surveyed area looking East (b) View of Fault Looking SE
Figure 2 – Location of Fault Survey The SD 34 subgrade moisture survey was carried out on the pavement surface and required a lane closure carry out the survey. Two sections were surveyed – one at MRM 277 (600 feet long) and the other at MRM 276.5 (400 feet long). The full width of the road was surveyed at each section, with parallel survey lines spaced laterally at approximately 3 feet, including passes in the wheelpaths and lane lines. Each test section was selected to coincide with prior borings. The data collection was carried out with the 400 MHz antenna. GPS data was collected during both Geotechnical surveys. The GPS data was used to put the GPR data on a uniform distance scale for subsequent processing. 7.3 Data Analysis 7.3.1 Bridge Decks The data was analyzed according to the GPR analysis principles described in Appendix A. The specifics of the analysis for this project are discussed below. The bridge deck analysis was carried out with Infrasense's WinDECAR® using the following steps:
1. Identification of the beginning and the end of the deck in each radar file, and check of the radar distance measurement against the known length and other features within the deck;
Fault Line
SD2005-05 AUGUST 31, 2006 FEASIBILITY OF USING GROUND PENETRATING RADAR PAGE 28
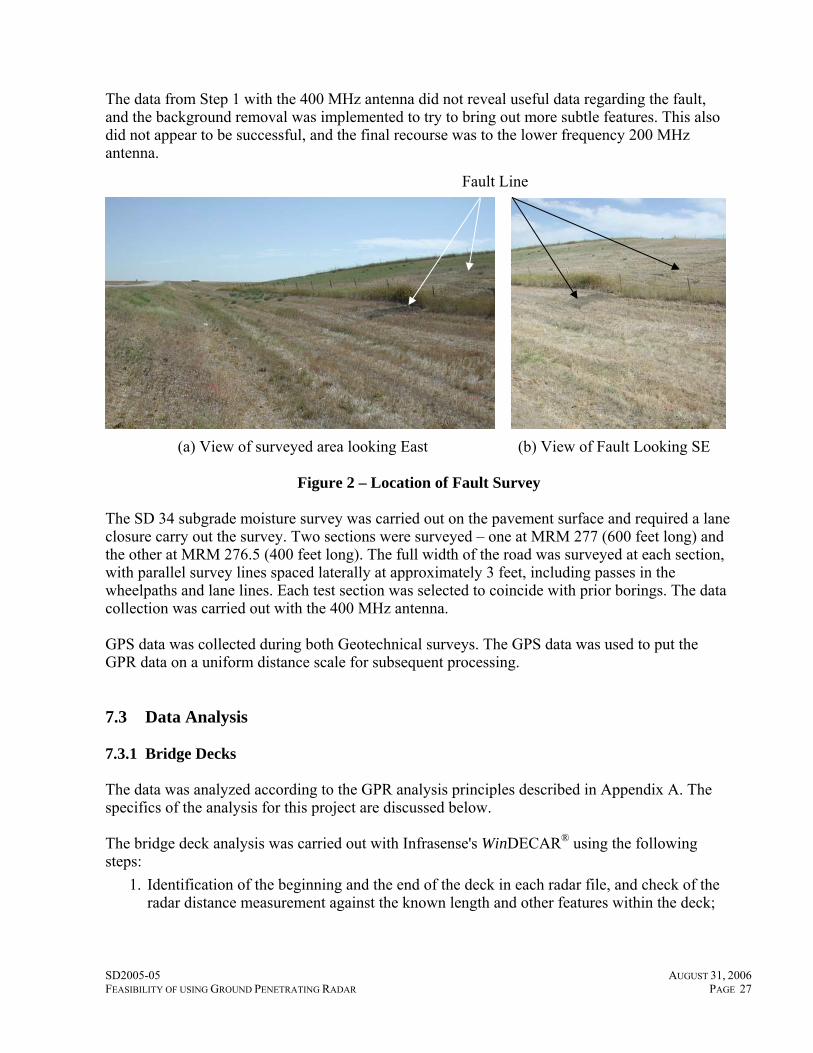
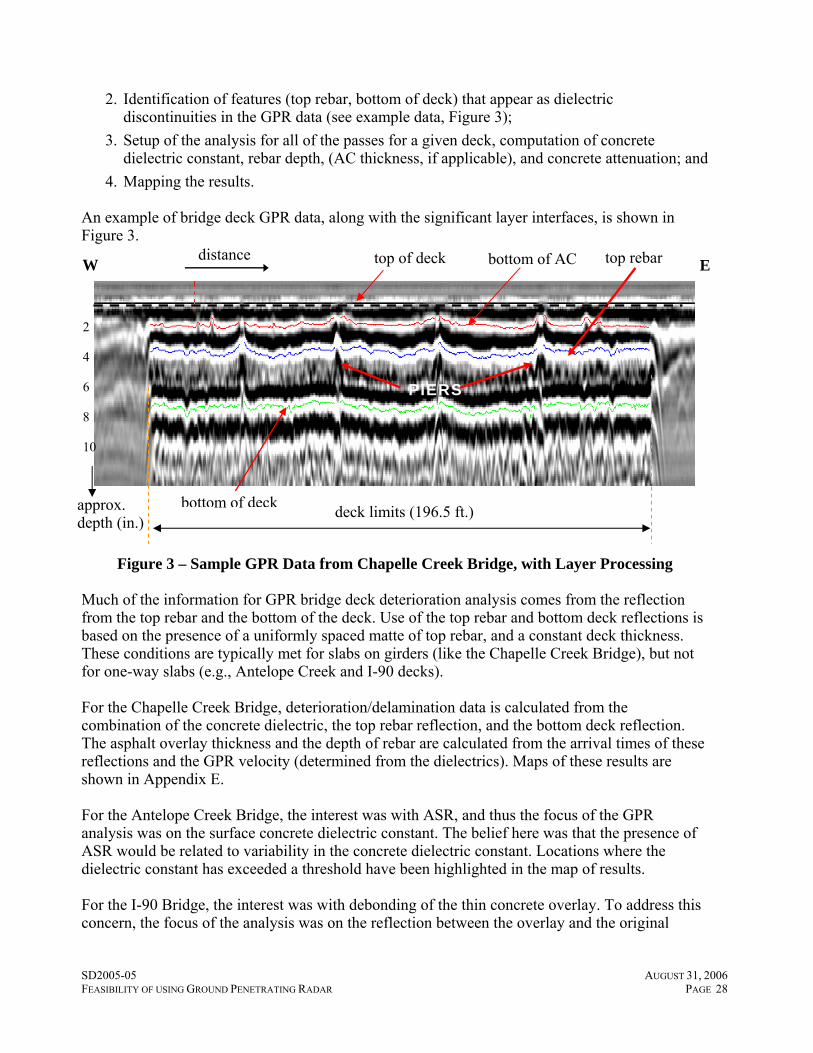
2. Identification of features (top rebar, bottom of deck) that appear as dielectric discontinuities in the GPR data (see example data, Figure 3);
3. Setup of the analysis for all of the passes for a given deck, computation of concrete dielectric constant, rebar depth, (AC thickness, if applicable), and concrete attenuation; and
4. Mapping the results.
An example of bridge deck GPR data, along with the significant layer interfaces, is shown in Figure 3.
Figure 3 – Sample GPR Data from Chapelle Creek Bridge, with Layer Processing Much of the information for GPR bridge deck deterioration analysis comes from the reflection from the top rebar and the bottom of the deck. Use of the top rebar and bottom deck reflections is based on the presence of a uniformly spaced matte of top rebar, and a constant deck thickness. These conditions are typically met for slabs on girders (like the Chapelle Creek Bridge), but not for one-way slabs (e.g., Antelope Creek and I-90 decks). For the Chapelle Creek Bridge, deterioration/delamination data is calculated from the combination of the concrete dielectric, the top rebar reflection, and the bottom deck reflection. The asphalt overlay thickness and the depth of rebar are calculated from the arrival times of these reflections and the GPR velocity (determined from the dielectrics). Maps of these results are shown in Appendix E. For the Antelope Creek Bridge, the interest was with ASR, and thus the focus of the GPR analysis was on the surface concrete dielectric constant. The belief here was that the presence of ASR would be related to variability in the concrete dielectric constant. Locations where the dielectric constant has exceeded a threshold have been highlighted in the map of results. For the I-90 Bridge, the interest was with debonding of the thin concrete overlay. To address this concern, the focus of the analysis was on the reflection between the overlay and the original
top of deck distance top rebar
bottom of deck
PIERS
approx. depth (in.)
deck limits (196.5 ft.)
W Ebottom of AC
2 4 6 8 10
SD2005-05 AUGUST 31, 2006 FEASIBILITY OF USING GROUND PENETRATING RADAR PAGE 29
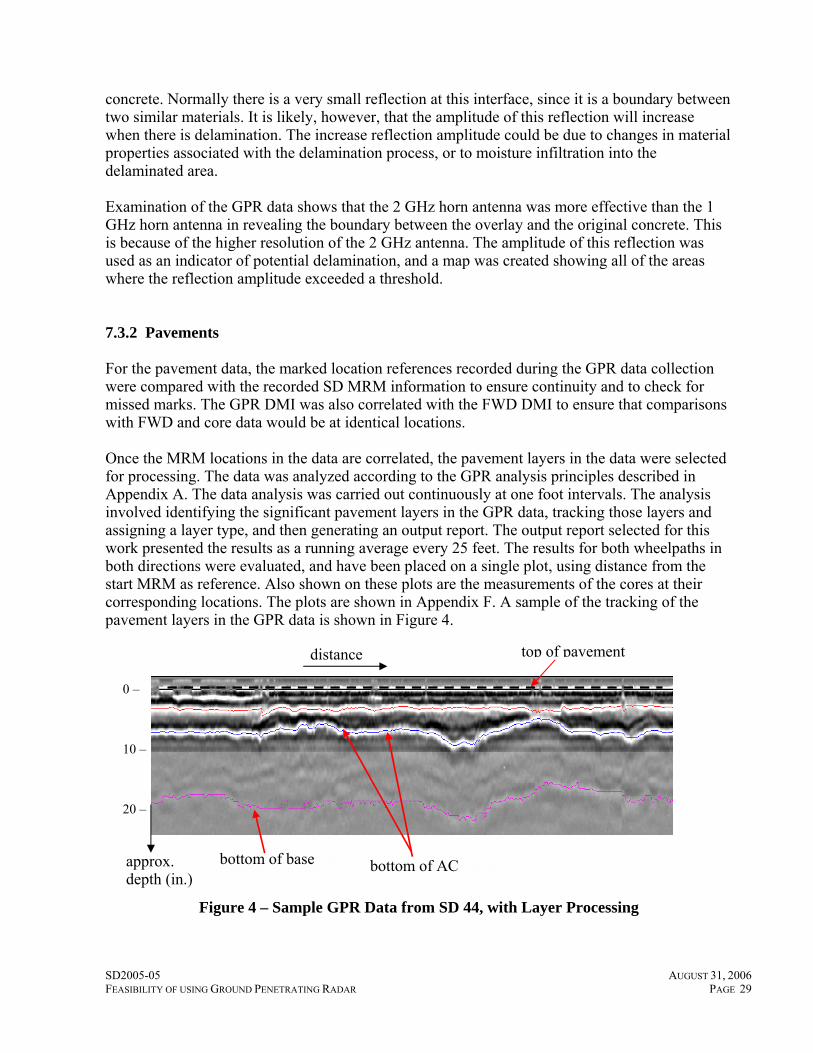
concrete. Normally there is a very small reflection at this interface, since it is a boundary between two similar materials. It is likely, however, that the amplitude of this reflection will increase when there is delamination. The increase reflection amplitude could be due to changes in material properties associated with the delamination process, or to moisture infiltration into the delaminated area. Examination of the GPR data shows that the 2 GHz horn antenna was more effective than the 1 GHz horn antenna in revealing the boundary between the overlay and the original concrete. This is because of the higher resolution of the 2 GHz antenna. The amplitude of this reflection was used as an indicator of potential delamination, and a map was created showing all of the areas where the reflection amplitude exceeded a threshold. 7.3.2 Pavements For the pavement data, the marked location references recorded during the GPR data collection were compared with the recorded SD MRM information to ensure continuity and to check for missed marks. The GPR DMI was also correlated with the FWD DMI to ensure that comparisons with FWD and core data would be at identical locations. Once the MRM locations in the data are correlated, the pavement layers in the data were selected for processing. The data was analyzed according to the GPR analysis principles described in Appendix A. The data analysis was carried out continuously at one foot intervals. The analysis involved identifying the significant pavement layers in the GPR data, tracking those layers and assigning a layer type, and then generating an output report. The output report selected for this work presented the results as a running average every 25 feet. The results for both wheelpaths in both directions were evaluated, and have been placed on a single plot, using distance from the start MRM as reference. Also shown on these plots are the measurements of the cores at their corresponding locations. The plots are shown in Appendix F. A sample of the tracking of the pavement layers in the GPR data is shown in Figure 4.
Figure 4 – Sample GPR Data from SD 44, with Layer Processing
approx. depth (in.)
distance top of pavement
bottom of AC bottom of base
0 – 10 – 20 –
SD2005-05 AUGUST 31, 2006 FEASIBILITY OF USING GROUND PENETRATING RADAR PAGE 30
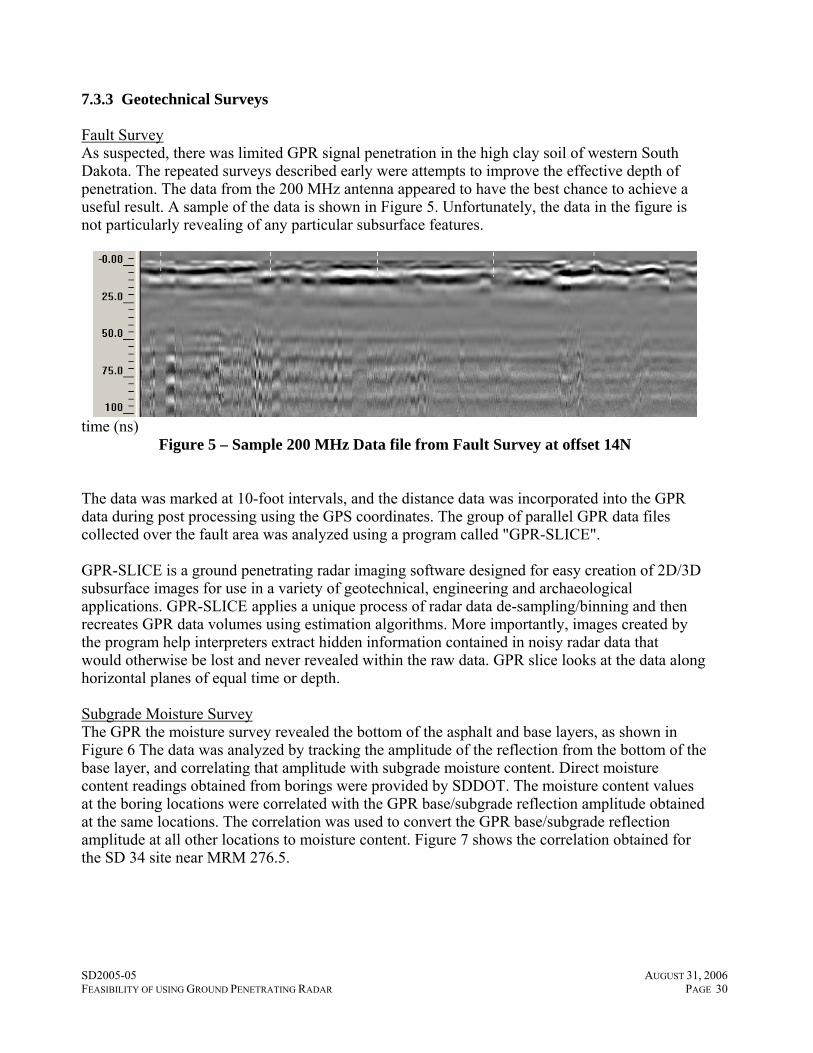
7.3.3 Geotechnical Surveys Fault Survey As suspected, there was limited GPR signal penetration in the high clay soil of western South Dakota. The repeated surveys described early were attempts to improve the effective depth of penetration. The data from the 200 MHz antenna appeared to have the best chance to achieve a useful result. A sample of the data is shown in Figure 5. Unfortunately, the data in the figure is not particularly revealing of any particular subsurface features.
time (ns)
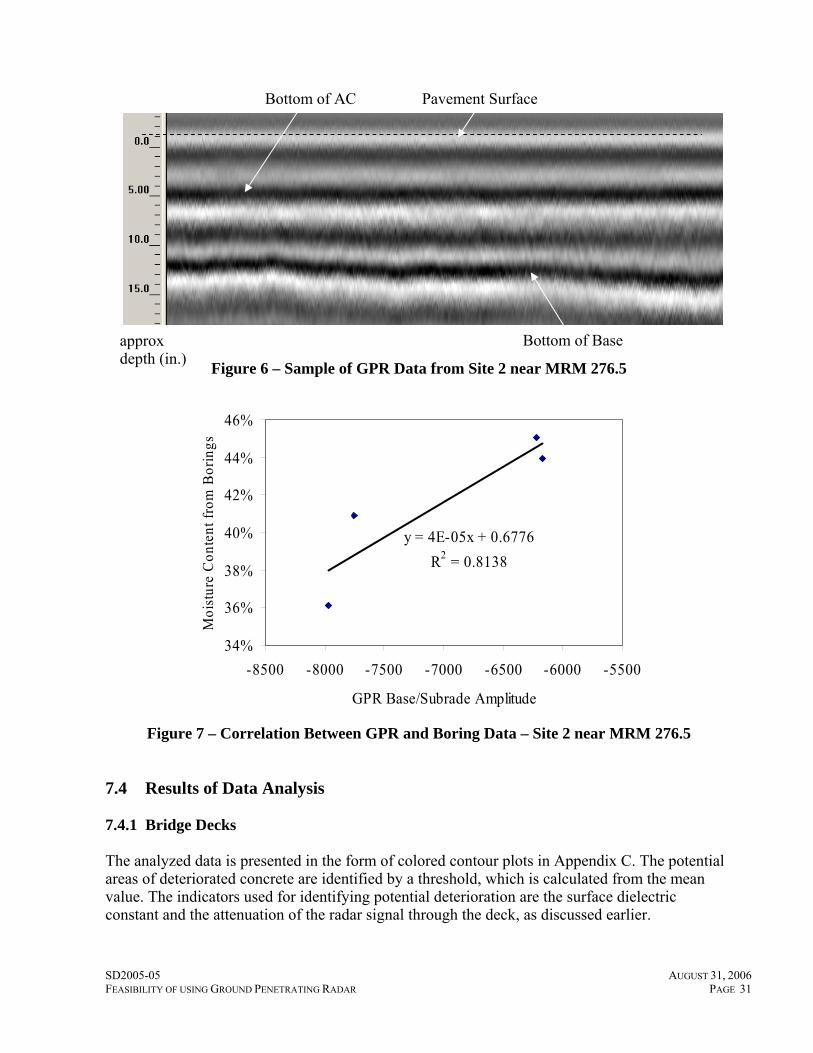
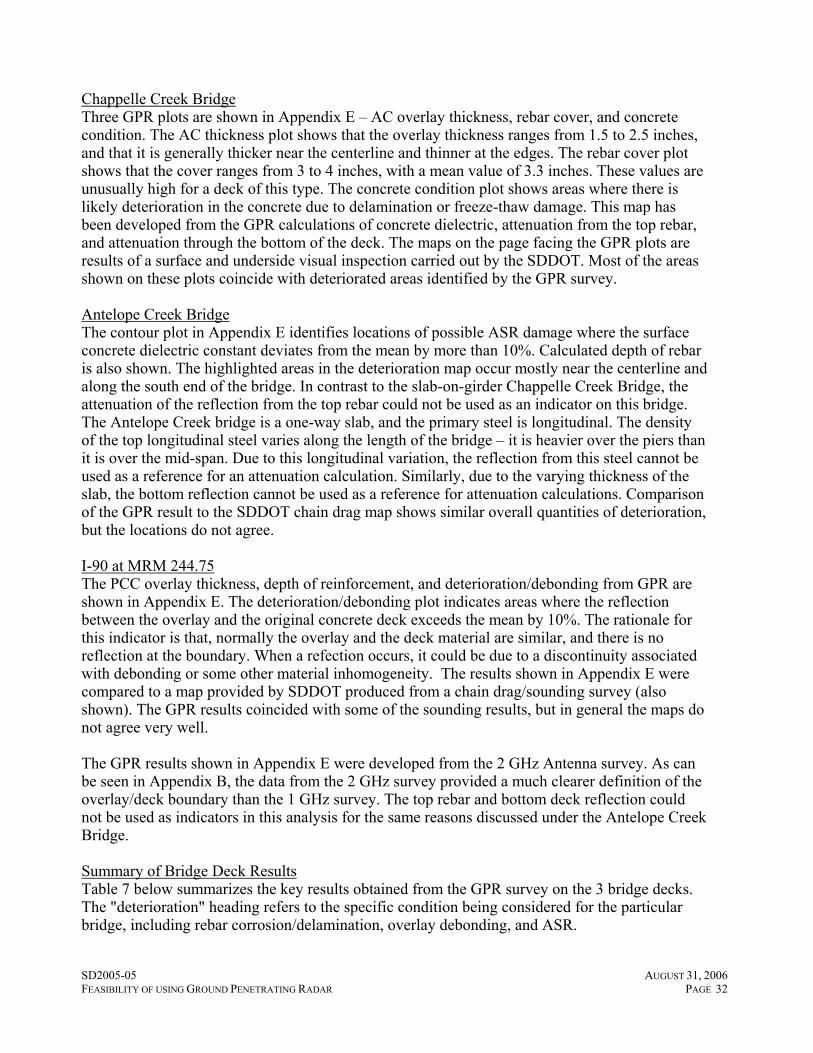
Figure 5 – Sample 200 MHz Data file from Fault Survey at offset 14N The data was marked at 10-foot intervals, and the distance data was incorporated into the GPR data during post processing using the GPS coordinates. The group of parallel GPR data files collected over the fault area was analyzed using a program called "GPR-SLICE". GPR-SLICE is a ground penetrating radar imaging software designed for easy creation of 2D/3D subsurface images for use in a variety of geotechnical, engineering and archaeological applications. GPR-SLICE applies a unique process of radar data de-sampling/binning and then recreates GPR data volumes using estimation algorithms. More importantly, images created by the program help interpreters extract hidden information contained in noisy radar data that would otherwise be lost and never revealed within the raw data. GPR slice looks at the data along horizontal planes of equal time or depth. Subgrade Moisture Survey The GPR the moisture survey revealed the bottom of the asphalt and base layers, as shown in Figure 6 The data was analyzed by tracking the amplitude of the reflection from the bottom of the base layer, and correlating that amplitude with subgrade moisture content. Direct moisture content readings obtained from borings were provided by SDDOT. The moisture content values at the boring locations were correlated with the GPR base/subgrade reflection amplitude obtained at the same locations. The correlation was used to convert the GPR base/subgrade reflection amplitude at all other locations to moisture content. Figure 7 shows the correlation obtained for the SD 34 site near MRM 276.5.
SD2005-05 AUGUST 31, 2006 FEASIBILITY OF USING GROUND PENETRATING RADAR PAGE 31
Figure 6 – Sample of GPR Data from Site 2 near MRM 276.5
y = 4E-05x + 0.6776R2 = 0.8138
34%
36%
38%
40%
42%
44%
46%
-8500 -8000 -7500 -7000 -6500 -6000 -5500
GPR Base/Subrade Amplitude
Moi
stur
e C
onte
nt fr
om B
orin
gs
Figure 7 – Correlation Between GPR and Boring Data – Site 2 near MRM 276.5 7.4 Results of Data Analysis 7.4.1 Bridge Decks The analyzed data is presented in the form of colored contour plots in Appendix C. The potential areas of deteriorated concrete are identified by a threshold, which is calculated from the mean value. The indicators used for identifying potential deterioration are the surface dielectric constant and the attenuation of the radar signal through the deck, as discussed earlier.
Pavement Surface Bottom of AC
Bottom of Base approx depth (in.)
SD2005-05 AUGUST 31, 2006 FEASIBILITY OF USING GROUND PENETRATING RADAR PAGE 32
Chappelle Creek Bridge Three GPR plots are shown in Appendix E – AC overlay thickness, rebar cover, and concrete condition. The AC thickness plot shows that the overlay thickness ranges from 1.5 to 2.5 inches, and that it is generally thicker near the centerline and thinner at the edges. The rebar cover plot shows that the cover ranges from 3 to 4 inches, with a mean value of 3.3 inches. These values are unusually high for a deck of this type. The concrete condition plot shows areas where there is likely deterioration in the concrete due to delamination or freeze-thaw damage. This map has been developed from the GPR calculations of concrete dielectric, attenuation from the top rebar, and attenuation through the bottom of the deck. The maps on the page facing the GPR plots are results of a surface and underside visual inspection carried out by the SDDOT. Most of the areas shown on these plots coincide with deteriorated areas identified by the GPR survey. Antelope Creek Bridge The contour plot in Appendix E identifies locations of possible ASR damage where the surface concrete dielectric constant deviates from the mean by more than 10%. Calculated depth of rebar is also shown. The highlighted areas in the deterioration map occur mostly near the centerline and along the south end of the bridge. In contrast to the slab-on-girder Chappelle Creek Bridge, the attenuation of the reflection from the top rebar could not be used as an indicator on this bridge. The Antelope Creek bridge is a one-way slab, and the primary steel is longitudinal. The density of the top longitudinal steel varies along the length of the bridge – it is heavier over the piers than it is over the mid-span. Due to this longitudinal variation, the reflection from this steel cannot be used as a reference for an attenuation calculation. Similarly, due to the varying thickness of the slab, the bottom reflection cannot be used as a reference for attenuation calculations. Comparison of the GPR result to the SDDOT chain drag map shows similar overall quantities of deterioration, but the locations do not agree. I-90 at MRM 244.75 The PCC overlay thickness, depth of reinforcement, and deterioration/debonding from GPR are shown in Appendix E. The deterioration/debonding plot indicates areas where the reflection between the overlay and the original concrete deck exceeds the mean by 10%. The rationale for this indicator is that, normally the overlay and the deck material are similar, and there is no reflection at the boundary. When a refection occurs, it could be due to a discontinuity associated with debonding or some other material inhomogeneity. The results shown in Appendix E were compared to a map provided by SDDOT produced from a chain drag/sounding survey (also shown). The GPR results coincided with some of the sounding results, but in general the maps do not agree very well. The GPR results shown in Appendix E were developed from the 2 GHz Antenna survey. As can be seen in Appendix B, the data from the 2 GHz survey provided a much clearer definition of the overlay/deck boundary than the 1 GHz survey. The top rebar and bottom deck reflection could not be used as indicators in this analysis for the same reasons discussed under the Antelope Creek Bridge. Summary of Bridge Deck Results Table 7 below summarizes the key results obtained from the GPR survey on the 3 bridge decks. The "deterioration" heading refers to the specific condition being considered for the particular bridge, including rebar corrosion/delamination, overlay debonding, and ASR.
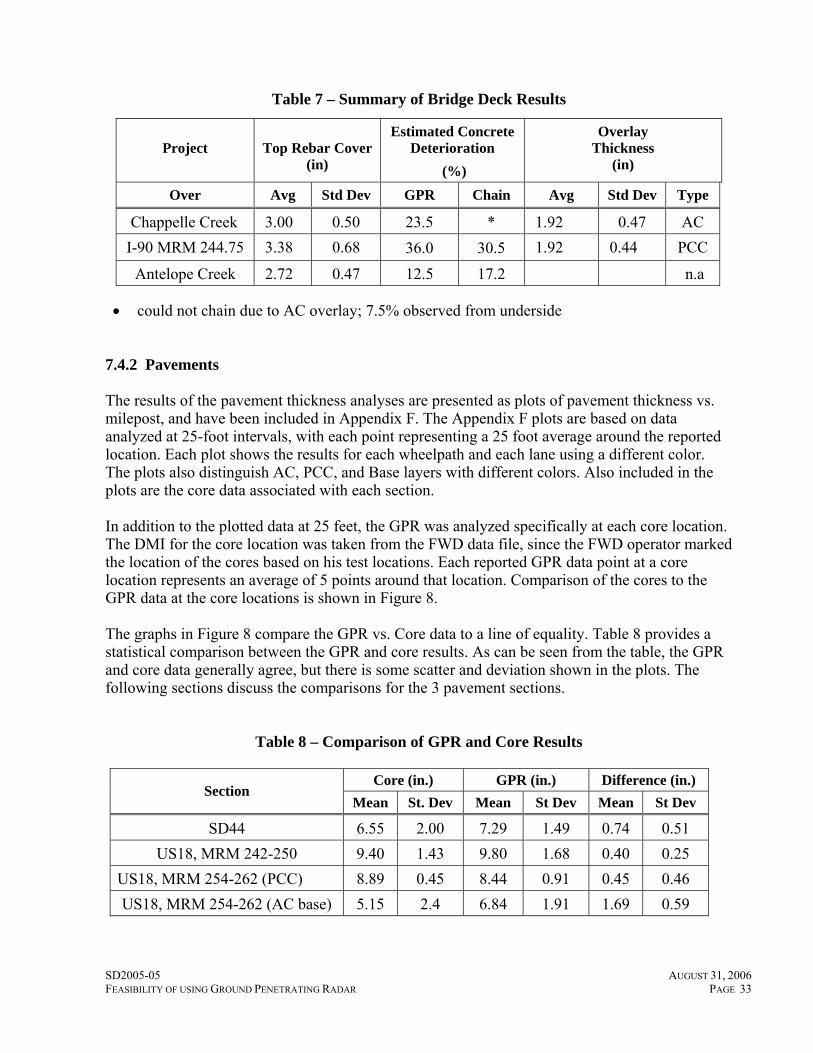
SD2005-05 AUGUST 31, 2006 FEASIBILITY OF USING GROUND PENETRATING RADAR PAGE 33
Table 7 – Summary of Bridge Deck Results
• could not chain due to AC overlay; 7.5% observed from underside
7.4.2 Pavements The results of the pavement thickness analyses are presented as plots of pavement thickness vs. milepost, and have been included in Appendix F. The Appendix F plots are based on data analyzed at 25-foot intervals, with each point representing a 25 foot average around the reported location. Each plot shows the results for each wheelpath and each lane using a different color. The plots also distinguish AC, PCC, and Base layers with different colors. Also included in the plots are the core data associated with each section. In addition to the plotted data at 25 feet, the GPR was analyzed specifically at each core location. The DMI for the core location was taken from the FWD data file, since the FWD operator marked the location of the cores based on his test locations. Each reported GPR data point at a core location represents an average of 5 points around that location. Comparison of the cores to the GPR data at the core locations is shown in Figure 8. The graphs in Figure 8 compare the GPR vs. Core data to a line of equality. Table 8 provides a statistical comparison between the GPR and core results. As can be seen from the table, the GPR and core data generally agree, but there is some scatter and deviation shown in the plots. The following sections discuss the comparisons for the 3 pavement sections.
Table 8 – Comparison of GPR and Core Results
Core (in.) GPR (in.) Difference (in.) Section
Mean St. Dev Mean St Dev Mean St Dev
SD44 6.55 2.00 7.29 1.49 0.74 0.51 US18, MRM 242-250 9.40 1.43 9.80 1.68 0.40 0.25
US18, MRM 254-262 (PCC) 8.89 0.45 8.44 0.91 0.45 0.46 US18, MRM 254-262 (AC base) 5.15 2.4 6.84 1.91 1.69 0.59
Project
Top Rebar Cover
(in)
Estimated Concrete Deterioration
(%)
Overlay Thickness
(in)
Over Avg Std Dev GPR Chain Avg Std Dev Type
Chappelle Creek 3.00 0.50 23.5 * 1.92 0.47 AC I-90 MRM 244.75 3.38 0.68 36.0 30.5 1.92 0.44 PCC
Antelope Creek 2.72 0.47 12.5 17.2 n.a
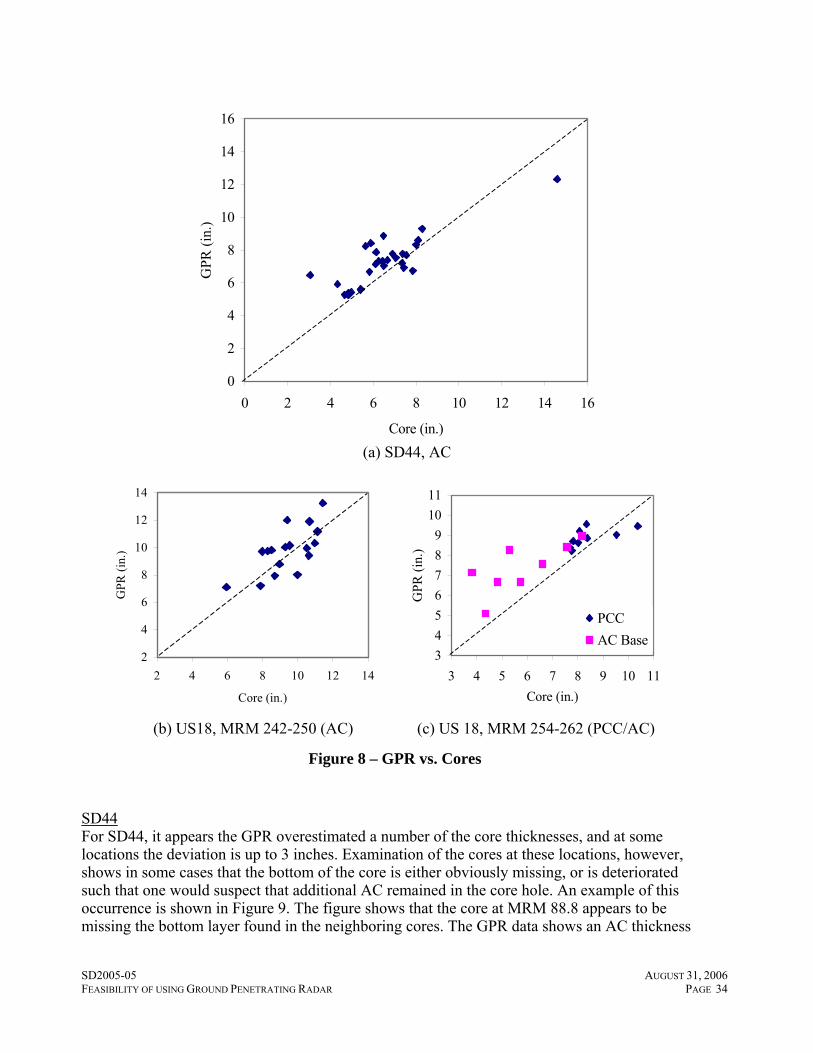
SD2005-05 AUGUST 31, 2006 FEASIBILITY OF USING GROUND PENETRATING RADAR PAGE 34
0
2
4
6
8
10
12
14
16
0 2 4 6 8 10 12 14 16
Core (in.)
GPR
(in.
)
(a) SD44, AC
2
4
6
8
10
12
14
2 4 6 8 10 12 14
Core (in.)
GPR
(in.
)
3456789
1011
3 4 5 6 7 8 9 10 11Core (in.)
GPR
(in.
)
PCCAC Base
(b) US18, MRM 242-250 (AC) (c) US 18, MRM 254-262 (PCC/AC)
Figure 8 – GPR vs. Cores
SD44 For SD44, it appears the GPR overestimated a number of the core thicknesses, and at some locations the deviation is up to 3 inches. Examination of the cores at these locations, however, shows in some cases that the bottom of the core is either obviously missing, or is deteriorated such that one would suspect that additional AC remained in the core hole. An example of this occurrence is shown in Figure 9. The figure shows that the core at MRM 88.8 appears to be missing the bottom layer found in the neighboring cores. The GPR data shows an AC thickness
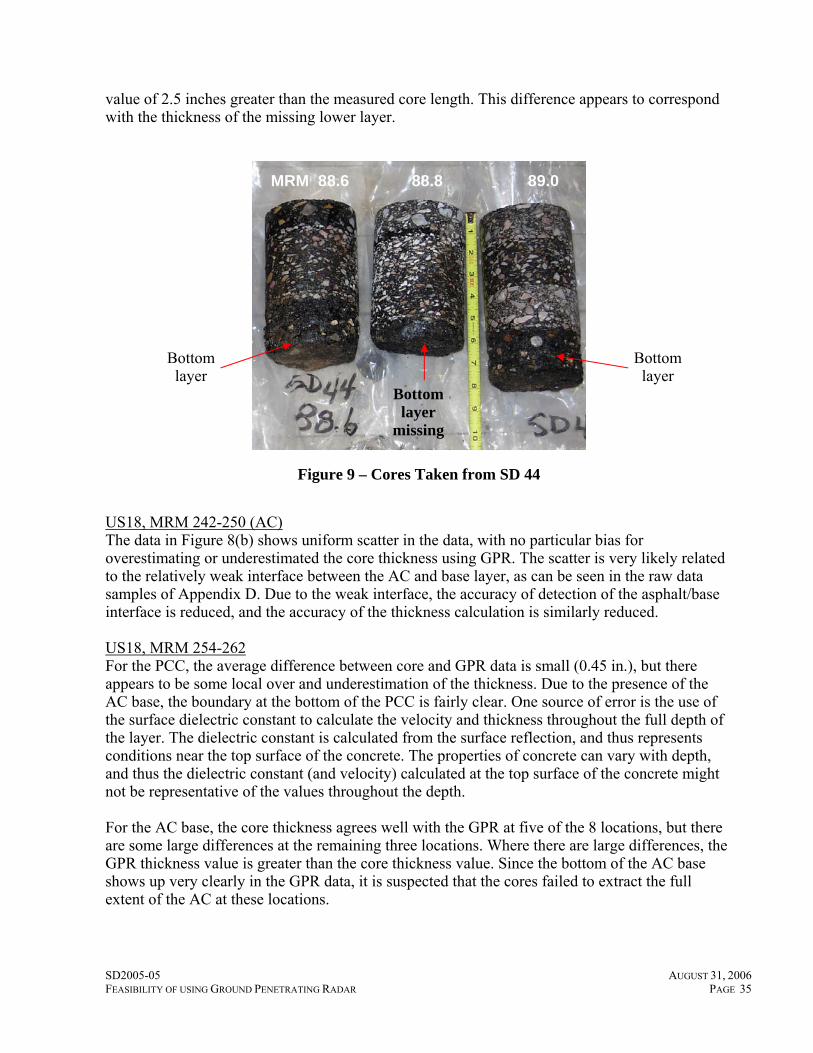
SD2005-05 AUGUST 31, 2006 FEASIBILITY OF USING GROUND PENETRATING RADAR PAGE 35
value of 2.5 inches greater than the measured core length. This difference appears to correspond with the thickness of the missing lower layer.
Figure 9 – Cores Taken from SD 44
US18, MRM 242-250 (AC) The data in Figure 8(b) shows uniform scatter in the data, with no particular bias for overestimating or underestimated the core thickness using GPR. The scatter is very likely related to the relatively weak interface between the AC and base layer, as can be seen in the raw data samples of Appendix D. Due to the weak interface, the accuracy of detection of the asphalt/base interface is reduced, and the accuracy of the thickness calculation is similarly reduced. US18, MRM 254-262 For the PCC, the average difference between core and GPR data is small (0.45 in.), but there appears to be some local over and underestimation of the thickness. Due to the presence of the AC base, the boundary at the bottom of the PCC is fairly clear. One source of error is the use of the surface dielectric constant to calculate the velocity and thickness throughout the full depth of the layer. The dielectric constant is calculated from the surface reflection, and thus represents conditions near the top surface of the concrete. The properties of concrete can vary with depth, and thus the dielectric constant (and velocity) calculated at the top surface of the concrete might not be representative of the values throughout the depth. For the AC base, the core thickness agrees well with the GPR at five of the 8 locations, but there are some large differences at the remaining three locations. Where there are large differences, the GPR thickness value is greater than the core thickness value. Since the bottom of the AC base shows up very clearly in the GPR data, it is suspected that the cores failed to extract the full extent of the AC at these locations.
MRM 88.6 88.8 89.0
Bottom layer
missing
Bottom layer
Bottom layer
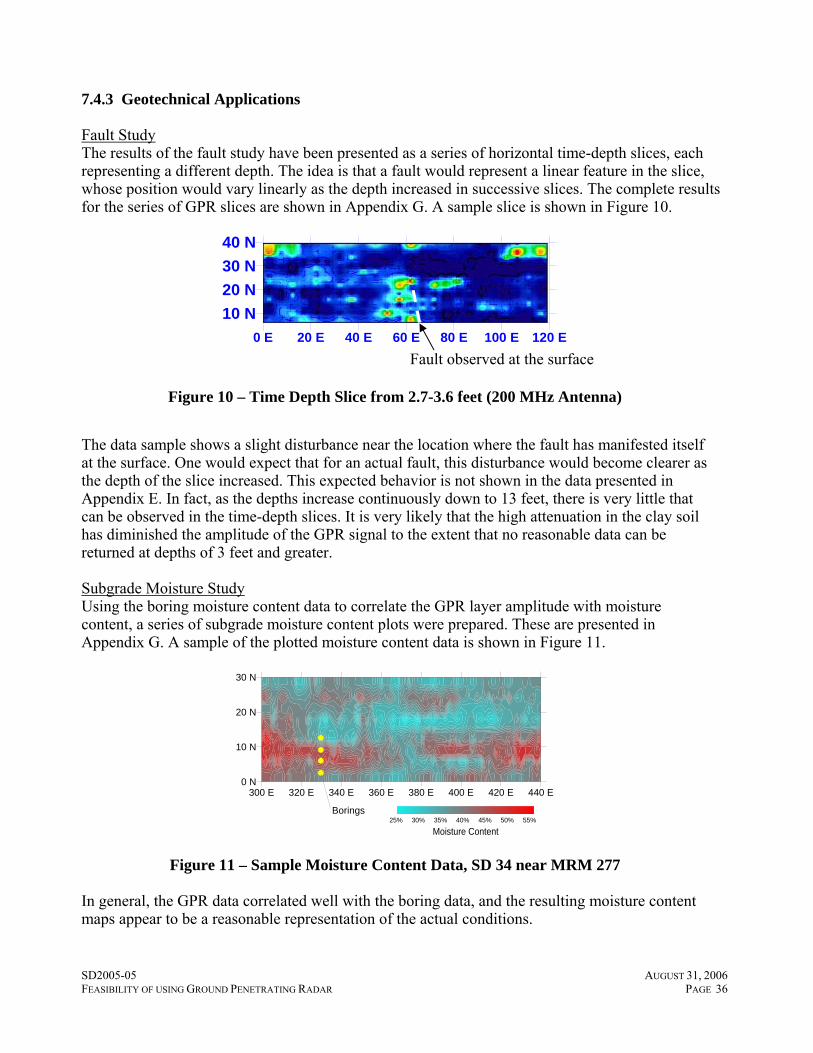
SD2005-05 AUGUST 31, 2006 FEASIBILITY OF USING GROUND PENETRATING RADAR PAGE 36
7.4.3 Geotechnical Applications Fault Study The results of the fault study have been presented as a series of horizontal time-depth slices, each representing a different depth. The idea is that a fault would represent a linear feature in the slice, whose position would vary linearly as the depth increased in successive slices. The complete results for the series of GPR slices are shown in Appendix G. A sample slice is shown in Figure 10.
0 E 20 E 40 E 60 E 80 E 100 E 120 E
10 N20 N30 N40 N
Figure 10 – Time Depth Slice from 2.7-3.6 feet (200 MHz Antenna)
The data sample shows a slight disturbance near the location where the fault has manifested itself at the surface. One would expect that for an actual fault, this disturbance would become clearer as the depth of the slice increased. This expected behavior is not shown in the data presented in Appendix E. In fact, as the depths increase continuously down to 13 feet, there is very little that can be observed in the time-depth slices. It is very likely that the high attenuation in the clay soil has diminished the amplitude of the GPR signal to the extent that no reasonable data can be returned at depths of 3 feet and greater. Subgrade Moisture Study Using the boring moisture content data to correlate the GPR layer amplitude with moisture content, a series of subgrade moisture content plots were prepared. These are presented in Appendix G. A sample of the plotted moisture content data is shown in Figure 11.
300 E 320 E 340 E 360 E 380 E 400 E 420 E 440 E0 N
10 N
20 N
30 N
25% 30% 35% 40% 45% 50% 55%
Moisture Content
Borings
Figure 11 – Sample Moisture Content Data, SD 34 near MRM 277 In general, the GPR data correlated well with the boring data, and the resulting moisture content maps appear to be a reasonable representation of the actual conditions.
Fault observed at the surface
SD2005-05 AUGUST 31, 2006 FEASIBILITY OF USING GROUND PENETRATING RADAR PAGE 37
8. Cost-Benefit Analysis Infrasense, together with its sub-consultant Applied Research Associates (ARA) completed a benefit/cost analysis to determine the potential economic benefits of using GPR for pavement and bridge rehabilitation projects. Factors considered included the GPR operating arrangements, number of full time staff required to maintain continuity in GPR data collection and processing, and quality and quantity of data available from traditional (non-GPR) data collection and analysis approaches. The following GPR applications were addressed in this analysis:
1. Pavement layer thickness survey for rehabilitation design. 2. Bridge deck condition surveys. 3. Pavement layer thickness for construction quality control.
The direct benefits of using GPR were estimated based on the value of acquiring certain data that are only available using GPR technology or are otherwise available in limited quantities from traditional approaches. The estimates for using GPR have taken into consideration the complexity and cost of the GPR technology as well as the training and expertise required for processing data. The following operating arrangements were considered for this study:
1. SDDOT owns and operates GPR equipment and interprets GPR data 2. SDDOT hires a consultant to collect and interpret GPR data
A key issue is the level of agency commitment required to ensure the availability and continuity of qualified staff to conduct GPR surveys and analyze the GPR data that is collected. State agencies have typically found that one or two full time staff members are required to provide continuity of capabilities with GPR operation. The cost of using GPR must be weighed against the benefits of acquiring data that could not otherwise be obtained. These benefits are discussed in the following sections. 8.1 Computation of Cost Equivalent uniform annual costs (EUAC) were determined for both GPR technology and traditional data collection and analysis approaches for each of the following:
1. Capital cost (initial purchase of equipment and software) 2. Personnel Training and Equipment Maintenance 3. Equipment Operating Expenses (personnel, travel and vehicle operation) 4. Interest expense
The analysis period was selected to be five years except as specified in the subsequent discussion. Cost estimates were developed for each major element associated with GPR data collection and analysis. The initial costs use a base year of 2006. To convert initial costs to EUAC, Equation 1 was used.
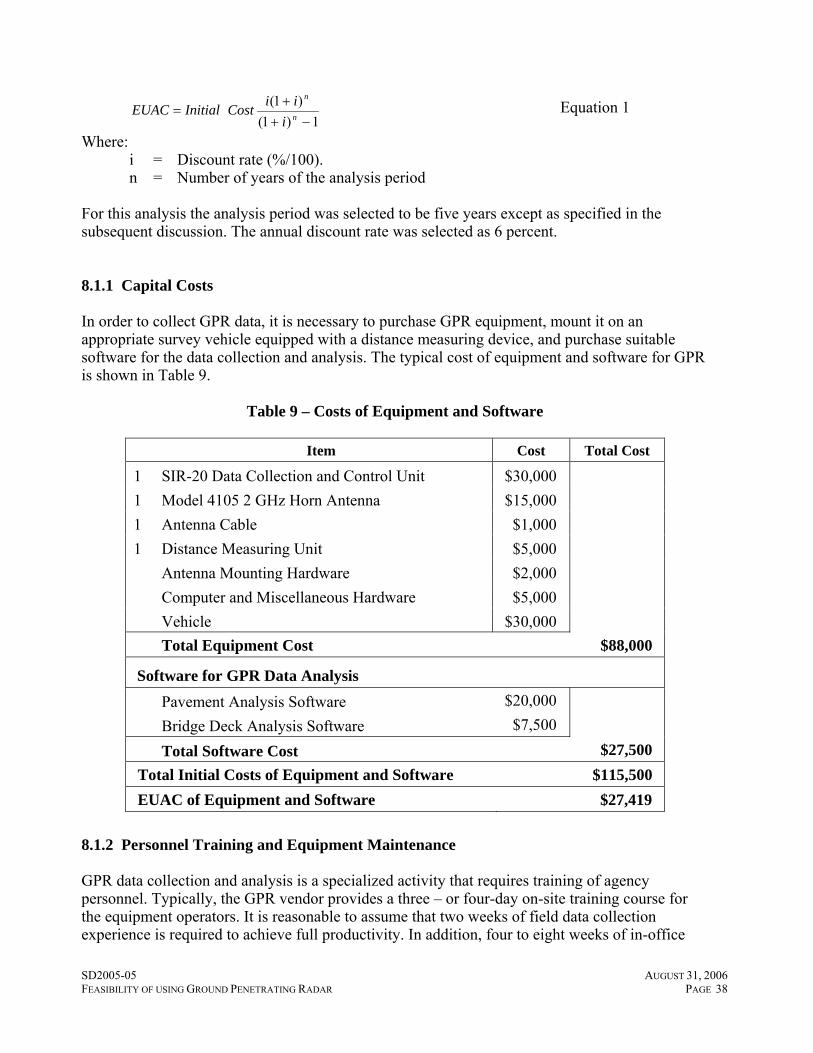
SD2005-05 AUGUST 31, 2006 FEASIBILITY OF USING GROUND PENETRATING RADAR PAGE 38
1)1()1(−+
+= n
n
iiiCostInitialEUAC Equation 1
Where: i = Discount rate (%/100). n = Number of years of the analysis period
For this analysis the analysis period was selected to be five years except as specified in the subsequent discussion. The annual discount rate was selected as 6 percent. 8.1.1 Capital Costs In order to collect GPR data, it is necessary to purchase GPR equipment, mount it on an appropriate survey vehicle equipped with a distance measuring device, and purchase suitable software for the data collection and analysis. The typical cost of equipment and software for GPR is shown in Table 9.
Table 9 – Costs of Equipment and Software
Item Cost Total Cost
1 SIR-20 Data Collection and Control Unit $30,000 1 Model 4105 2 GHz Horn Antenna $15,000 1 Antenna Cable $1,000 1 Distance Measuring Unit $5,000 Antenna Mounting Hardware $2,000 Computer and Miscellaneous Hardware $5,000 Vehicle $30,000 Total Equipment Cost $88,000
Software for GPR Data Analysis Pavement Analysis Software $20,000
Bridge Deck Analysis Software $7,500
Total Software Cost $27,500 Total Initial Costs of Equipment and Software $115,500 EUAC of Equipment and Software $27,419
8.1.2 Personnel Training and Equipment Maintenance GPR data collection and analysis is a specialized activity that requires training of agency personnel. Typically, the GPR vendor provides a three – or four-day on-site training course for the equipment operators. It is reasonable to assume that two weeks of field data collection experience is required to achieve full productivity. In addition, four to eight weeks of in-office
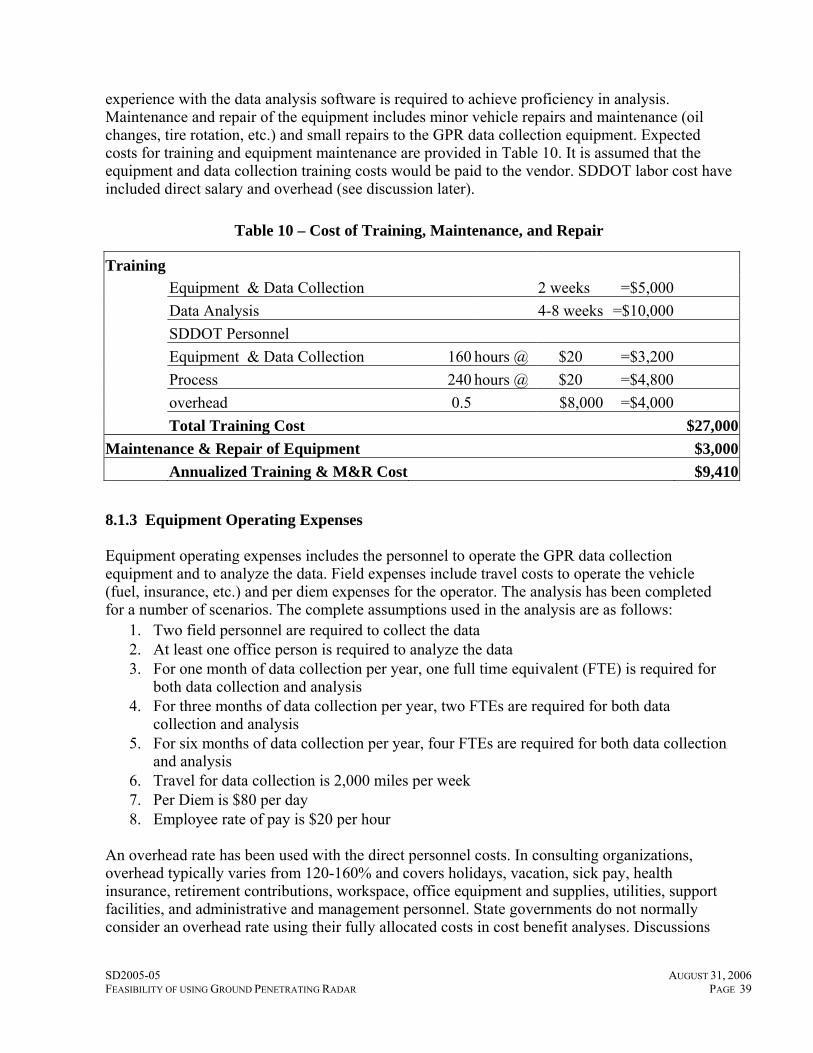
SD2005-05 AUGUST 31, 2006 FEASIBILITY OF USING GROUND PENETRATING RADAR PAGE 39
experience with the data analysis software is required to achieve proficiency in analysis. Maintenance and repair of the equipment includes minor vehicle repairs and maintenance (oil changes, tire rotation, etc.) and small repairs to the GPR data collection equipment. Expected costs for training and equipment maintenance are provided in Table 10. It is assumed that the equipment and data collection training costs would be paid to the vendor. SDDOT labor cost have included direct salary and overhead (see discussion later).
Table 10 – Cost of Training, Maintenance, and Repair
Training Equipment & Data Collection 2 weeks =$5,000 Data Analysis 4-8 weeks =$10,000 SDDOT Personnel Equipment & Data Collection 160 hours @ $20 =$3,200 Process 240 hours @ $20 =$4,800 overhead 0.5 $8,000 =$4,000 Total Training Cost $27,000Maintenance & Repair of Equipment $3,000 Annualized Training & M&R Cost $9,410
8.1.3 Equipment Operating Expenses Equipment operating expenses includes the personnel to operate the GPR data collection equipment and to analyze the data. Field expenses include travel costs to operate the vehicle (fuel, insurance, etc.) and per diem expenses for the operator. The analysis has been completed for a number of scenarios. The complete assumptions used in the analysis are as follows:
1. Two field personnel are required to collect the data 2. At least one office person is required to analyze the data 3. For one month of data collection per year, one full time equivalent (FTE) is required for
both data collection and analysis 4. For three months of data collection per year, two FTEs are required for both data
collection and analysis 5. For six months of data collection per year, four FTEs are required for both data collection
and analysis 6. Travel for data collection is 2,000 miles per week 7. Per Diem is $80 per day 8. Employee rate of pay is $20 per hour
An overhead rate has been used with the direct personnel costs. In consulting organizations, overhead typically varies from 120-160% and covers holidays, vacation, sick pay, health insurance, retirement contributions, workspace, office equipment and supplies, utilities, support facilities, and administrative and management personnel. State governments do not normally consider an overhead rate using their fully allocated costs in cost benefit analyses. Discussions
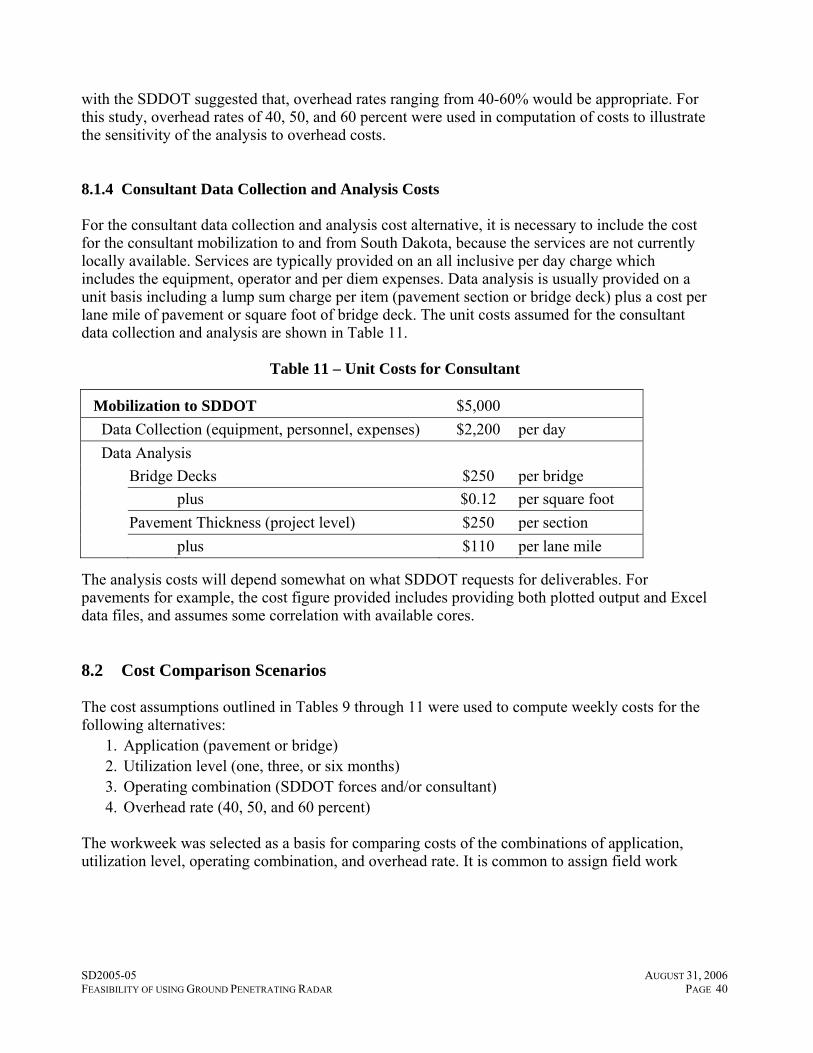
SD2005-05 AUGUST 31, 2006 FEASIBILITY OF USING GROUND PENETRATING RADAR PAGE 40
with the SDDOT suggested that, overhead rates ranging from 40-60% would be appropriate. For this study, overhead rates of 40, 50, and 60 percent were used in computation of costs to illustrate the sensitivity of the analysis to overhead costs. 8.1.4 Consultant Data Collection and Analysis Costs For the consultant data collection and analysis cost alternative, it is necessary to include the cost for the consultant mobilization to and from South Dakota, because the services are not currently locally available. Services are typically provided on an all inclusive per day charge which includes the equipment, operator and per diem expenses. Data analysis is usually provided on a unit basis including a lump sum charge per item (pavement section or bridge deck) plus a cost per lane mile of pavement or square foot of bridge deck. The unit costs assumed for the consultant data collection and analysis are shown in Table 11.
Table 11 – Unit Costs for Consultant
Mobilization to SDDOT $5,000 Data Collection (equipment, personnel, expenses) $2,200 per day Data Analysis
Bridge Decks $250 per bridge plus $0.12 per square foot Pavement Thickness (project level) $250 per section plus $110 per lane mile
The analysis costs will depend somewhat on what SDDOT requests for deliverables. For pavements for example, the cost figure provided includes providing both plotted output and Excel data files, and assumes some correlation with available cores. 8.2 Cost Comparison Scenarios The cost assumptions outlined in Tables 9 through 11 were used to compute weekly costs for the following alternatives:
1. Application (pavement or bridge) 2. Utilization level (one, three, or six months) 3. Operating combination (SDDOT forces and/or consultant) 4. Overhead rate (40, 50, and 60 percent)
The workweek was selected as a basis for comparing costs of the combinations of application, utilization level, operating combination, and overhead rate. It is common to assign field work
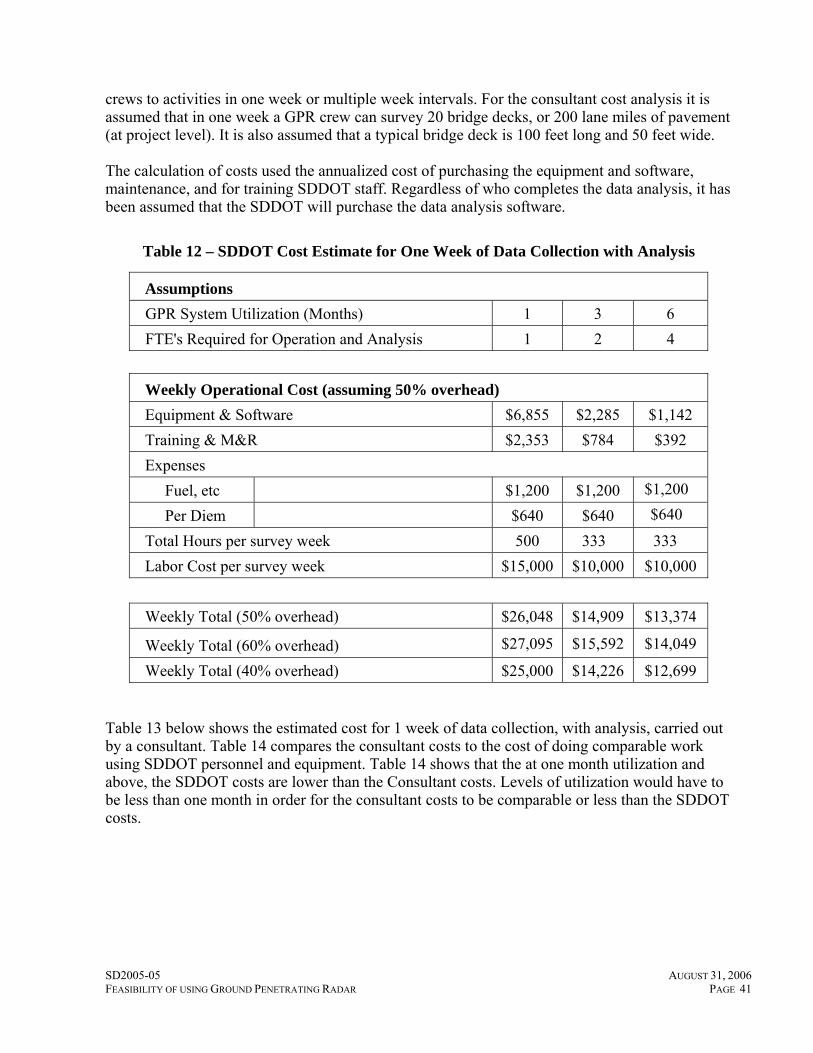
SD2005-05 AUGUST 31, 2006 FEASIBILITY OF USING GROUND PENETRATING RADAR PAGE 41
crews to activities in one week or multiple week intervals. For the consultant cost analysis it is assumed that in one week a GPR crew can survey 20 bridge decks, or 200 lane miles of pavement (at project level). It is also assumed that a typical bridge deck is 100 feet long and 50 feet wide. The calculation of costs used the annualized cost of purchasing the equipment and software, maintenance, and for training SDDOT staff. Regardless of who completes the data analysis, it has been assumed that the SDDOT will purchase the data analysis software.
Table 12 – SDDOT Cost Estimate for One Week of Data Collection with Analysis
Assumptions GPR System Utilization (Months) 1 3 6 FTE's Required for Operation and Analysis 1 2 4
Weekly Operational Cost (assuming 50% overhead) Equipment & Software $6,855 $2,285 $1,142 Training & M&R $2,353 $784 $392 Expenses Fuel, etc $1,200 $1,200 $1,200
Per Diem $640 $640 $640
Total Hours per survey week 500 333 333 Labor Cost per survey week $15,000 $10,000 $10,000 Weekly Total (50% overhead) $26,048 $14,909 $13,374
Weekly Total (60% overhead) $27,095 $15,592 $14,049
Weekly Total (40% overhead) $25,000 $14,226 $12,699
Table 13 below shows the estimated cost for 1 week of data collection, with analysis, carried out by a consultant. Table 14 compares the consultant costs to the cost of doing comparable work using SDDOT personnel and equipment. Table 14 shows that the at one month utilization and above, the SDDOT costs are lower than the Consultant costs. Levels of utilization would have to be less than one month in order for the consultant costs to be comparable or less than the SDDOT costs.
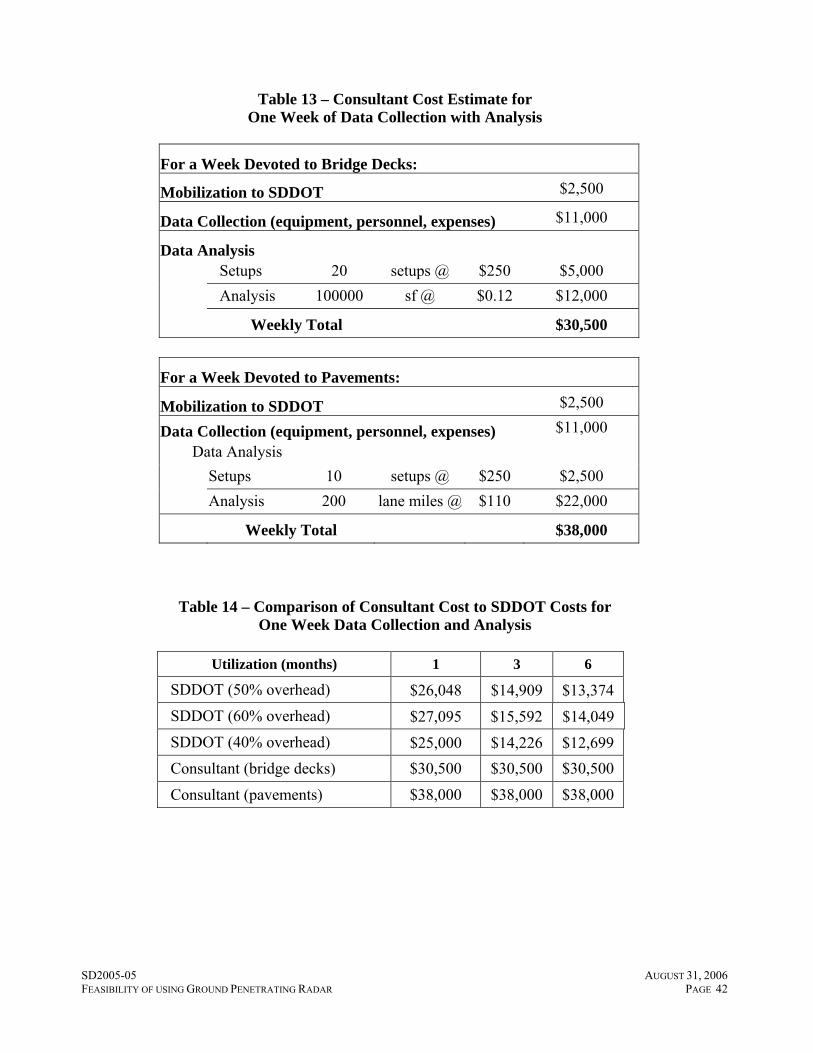
SD2005-05 AUGUST 31, 2006 FEASIBILITY OF USING GROUND PENETRATING RADAR PAGE 42
Table 13 – Consultant Cost Estimate for One Week of Data Collection with Analysis
For a Week Devoted to Bridge Decks:
Mobilization to SDDOT $2,500
Data Collection (equipment, personnel, expenses) $11,000
Data Analysis Setups 20 setups @ $250 $5,000 Analysis 100000 sf @ $0.12 $12,000
Weekly Total $30,500
For a Week Devoted to Pavements:
Mobilization to SDDOT $2,500
Data Collection (equipment, personnel, expenses) $11,000 Data Analysis
Setups 10 setups @ $250 $2,500 Analysis 200 lane miles @ $110 $22,000
Weekly Total $38,000
Table 14 – Comparison of Consultant Cost to SDDOT Costs for
One Week Data Collection and Analysis
Utilization (months) 1 3 6
SDDOT (50% overhead) $26,048 $14,909 $13,374 SDDOT (60% overhead) $27,095 $15,592 $14,049 SDDOT (40% overhead) $25,000 $14,226 $12,699 Consultant (bridge decks) $30,500 $30,500 $30,500
Consultant (pavements) $38,000 $38,000 $38,000
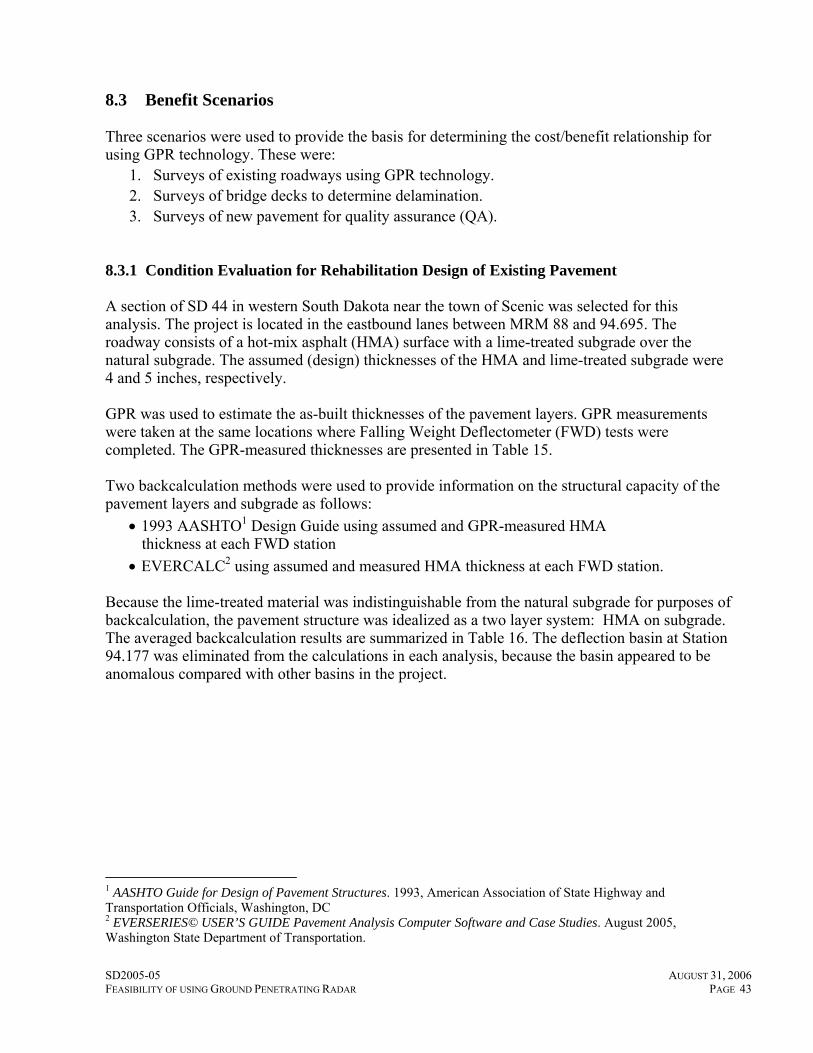
SD2005-05 AUGUST 31, 2006 FEASIBILITY OF USING GROUND PENETRATING RADAR PAGE 43
8.3 Benefit Scenarios Three scenarios were used to provide the basis for determining the cost/benefit relationship for using GPR technology. These were:
1. Surveys of existing roadways using GPR technology. 2. Surveys of bridge decks to determine delamination. 3. Surveys of new pavement for quality assurance (QA).
8.3.1 Condition Evaluation for Rehabilitation Design of Existing Pavement A section of SD 44 in western South Dakota near the town of Scenic was selected for this analysis. The project is located in the eastbound lanes between MRM 88 and 94.695. The roadway consists of a hot-mix asphalt (HMA) surface with a lime-treated subgrade over the natural subgrade. The assumed (design) thicknesses of the HMA and lime-treated subgrade were 4 and 5 inches, respectively. GPR was used to estimate the as-built thicknesses of the pavement layers. GPR measurements were taken at the same locations where Falling Weight Deflectometer (FWD) tests were completed. The GPR-measured thicknesses are presented in Table 15. Two backcalculation methods were used to provide information on the structural capacity of the pavement layers and subgrade as follows:
• 1993 AASHTO1 Design Guide using assumed and GPR-measured HMA thickness at each FWD station
• EVERCALC2 using assumed and measured HMA thickness at each FWD station. Because the lime-treated material was indistinguishable from the natural subgrade for purposes of backcalculation, the pavement structure was idealized as a two layer system: HMA on subgrade. The averaged backcalculation results are summarized in Table 16. The deflection basin at Station 94.177 was eliminated from the calculations in each analysis, because the basin appeared to be anomalous compared with other basins in the project.
1 AASHTO Guide for Design of Pavement Structures. 1993, American Association of State Highway and Transportation Officials, Washington, DC 2 EVERSERIES© USER’S GUIDE Pavement Analysis Computer Software and Case Studies. August 2005, Washington State Department of Transportation.
SD2005-05 AUGUST 31, 2006 FEASIBILITY OF USING GROUND PENETRATING RADAR PAGE 44
Table 15 – SD 44 Layer Thicknesses as Determined by GPR
Station HMA Thickness (in.) Lime Stabilized Subgrade
Thickness (in.) 88.000 7.79 8.39 88.200 8.30 6.97 88.400 5.48 88.600 7.34 11.07 88.800 8.48 11.99 88.906 6.84 89.106 6.59 89.306 8.29 10.50 89.534 9.14 6.22 89.706 7.42 11.67 89.877 5.32 11.41 90.077 7.18 10.10 90.277 5.16 10.13 90.577 5.18 10.54 90.777 5.73 90.885 5.88 10.89 91.087 6.53 13.02 91.285 7.63 13.45 91.585 5.77 11.54 91.785 5.28 91.891 5.43 13.33 92.091 7.33 11.96 92.291 6.36 15.31 92.496 7.32 11.84 92.694 7.54 9.94 92.886 9.03 12.74 93.086 7.31 8.85 93.286 7.83 93.486 7.36 8.56 93.687 7.03 10.73 93.792 8.37 10.27 94.095 8.15 10.86 94.177 12.19 94.301 14.15 94.495 7.23 12.73 94.695 8.20 10.77
Minimum 5.16 6.22 Median 7.32 10.87 Mean 7.39 10.92
Maximum 14.15 15.31 Std. Deviation 1.83 1.96
COV 0.25 0.18
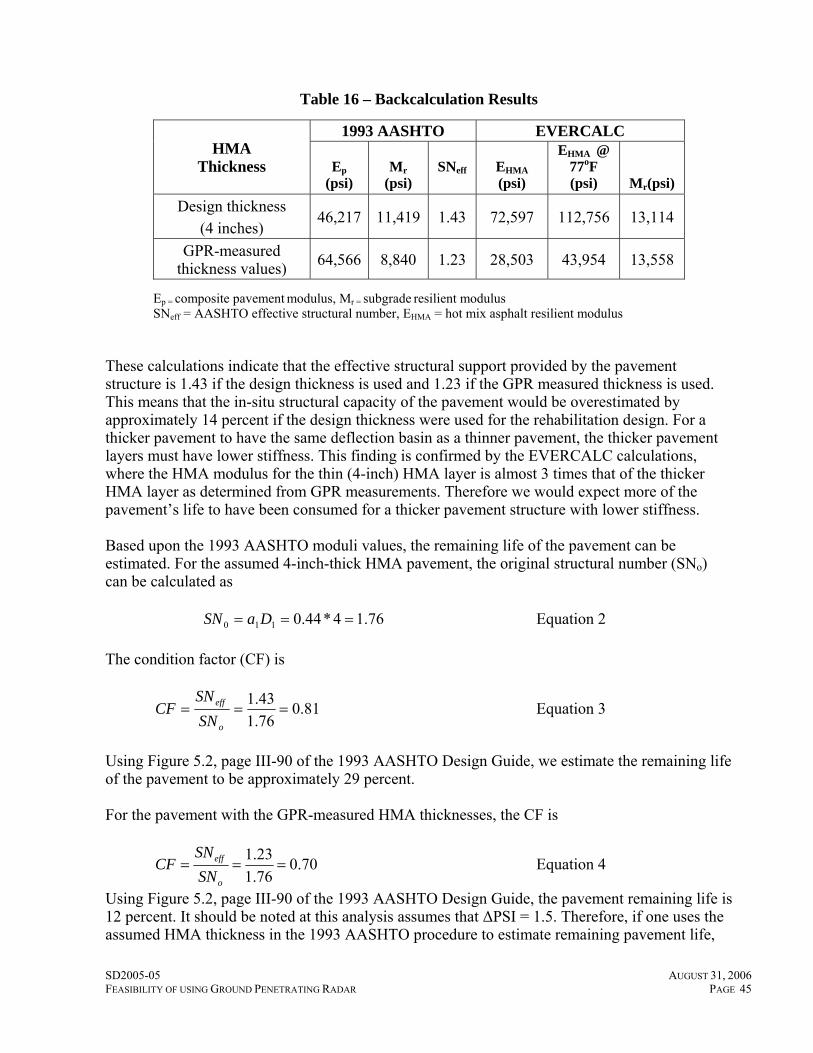
SD2005-05 AUGUST 31, 2006 FEASIBILITY OF USING GROUND PENETRATING RADAR PAGE 45
Table 16 – Backcalculation Results
Ep = composite pavement modulus, Mr = subgrade resilient modulus SNeff = AASHTO effective structural number, EHMA = hot mix asphalt resilient modulus
These calculations indicate that the effective structural support provided by the pavement structure is 1.43 if the design thickness is used and 1.23 if the GPR measured thickness is used. This means that the in-situ structural capacity of the pavement would be overestimated by approximately 14 percent if the design thickness were used for the rehabilitation design. For a thicker pavement to have the same deflection basin as a thinner pavement, the thicker pavement layers must have lower stiffness. This finding is confirmed by the EVERCALC calculations, where the HMA modulus for the thin (4-inch) HMA layer is almost 3 times that of the thicker HMA layer as determined from GPR measurements. Therefore we would expect more of the pavement’s life to have been consumed for a thicker pavement structure with lower stiffness. Based upon the 1993 AASHTO moduli values, the remaining life of the pavement can be estimated. For the assumed 4-inch-thick HMA pavement, the original structural number (SNo) can be calculated as 76.14*44.0110 === DaSN Equation 2 The condition factor (CF) is
81.076.143.1
===o
eff
SNSN
CF Equation 3
Using Figure 5.2, page III-90 of the 1993 AASHTO Design Guide, we estimate the remaining life of the pavement to be approximately 29 percent. For the pavement with the GPR-measured HMA thicknesses, the CF is
70.076.123.1
===o
eff
SNSN
CF Equation 4
Using Figure 5.2, page III-90 of the 1993 AASHTO Design Guide, the pavement remaining life is 12 percent. It should be noted at this analysis assumes that ΔPSI = 1.5. Therefore, if one uses the assumed HMA thickness in the 1993 AASHTO procedure to estimate remaining pavement life,
1993 AASHTO EVERCALC HMA
Thickness
Ep (psi)
Mr (psi)
SNeff
EHMA (psi)
EHMA @ 77oF (psi) Mr(psi)
Design thickness (4 inches)
46,217 11,419 1.43 72,597 112,756 13,114
GPR-measured thickness values) 64,566 8,840 1.23 28,503 43,954 13,558
SD2005-05 AUGUST 31, 2006 FEASIBILITY OF USING GROUND PENETRATING RADAR PAGE 46
the result will overestimate the remaining life by approximately 17 percent of the applied traffic loading. If the subsequent design of the rehabilitation of this pavement section were based on the assumed thickness and consequent expectation of support strength, it is possible that the expected life of the rehabilitated pavement will be overestimated. A 17 percent overestimate for the 18-year design period yields an actual performance life of 14.94 years. The benefit/cost ratio is calculated as follows:
1. Assume: a. Consultant collects and analyzes the GPR data b. Five miles of pavement at two lanes wide = 10 lane miles c. Cost of rehabilitation is $100,000 per lane mile d. Time required to perform GPR survey = 1 day
2. Calculate Benefit: a. Total cost of rehabilitation = 10 line miles × $100,000 = $1,000,000 b. Design life = 18 yrs; design EUAC = $92,300 c. Actual life = 14.94 yrs; actual EUAC = $108,220 d. Benefit = ($103,178 – $92,300) x 14.94 = $151,505
3. Calculate Cost (using consultant): a. Mobilization cost = $1,000 (assuming that this is one of several projects surveyed) b. Data collection cost = $1,200 (half-day) c. Data Analysis cost = 20 lane miles (both directions) x $110/lane mile = $2,200 d. Total GPR cost = $4,400
4. Benefit to Cost Ratio: 5. Benefit/Cost = $151,505/$4400 = 34.4
The analysis above makes two critical assumptions: (1) That the error in calculating the life of the rehabilitated pavement is the same as that of the existing pavement; and (2) that the rehabilitation cost is the same using either the assumed or the actual thickness. Neither of these assumptions is strictly correct, but they have been used in the absence of any other more specific alternatives. 8.3.2 Bridge Deck Surveys Bridge deck delamination is traditionally assessed using the dragged chain method. This function can also be performed using GPR technology. It is surmised that GPR technology can more accurately detect and map the delamination is a bridge deck. If shown to be true, the benefit of GPR would be an improved estimate of the quantities of bridge deck repair required. This would assist in minimizing the number of change orders required during construction and reduce the amount of SDOT staff time required for construction supervision. From Table 13, the cost to survey 20 bridge decks in a week by a consultant is approximately $29,250. The cost to survey a single bridge deck by a consultant is therefore $1462.
SD2005-05 AUGUST 31, 2006 FEASIBILITY OF USING GROUND PENETRATING RADAR PAGE 47
If the bridge deck has exposed concrete, then the alternative to GPR is using chain dragging and sounding. For a typical 5000 sq. foot deck, it is estimated that sounding the deck and mapping the results would required lane closures and a crew of 2 persons working for 1 ½ days (including time to setup and take down the closure. The cost of chain dragging and sounding is estimated at:
Table 17 – Cost for Chain Dragging a 5000 sf. Bridge Deck
Based on these figures, the benefit/cost ratio of using GPR on a bare concrete deck is 2900/1462 = 1.98. In addition to the economic benefit, there is a safety benefit associated with the elimination of the exposure of agency personnel to traffic hazards. If a bridge deck has as asphalt overlay, it can not be chain dragged, and the only alternative to the GPR survey is a visual evaluation of the surface of the overlay and the underside of the deck. Under these conditions one can assume that GPR can provide more accurate deck condition information than the visual survey. The benefit can then be related to the decisions made using more accurate information. Madanat and Maser (1990) have conducted a study of the impact of more accurate deck condition data on the life cycle cost of bridge deck maintenance and rehabilitation. The reasoning is that, with more accurate deck condition information, better and more cost effective repair and rehabilitation decisions will be made. The analysis is based on deterioration quantity estimates, and assumes that GPR is within 20% of the actual quantities, and that visual inspection is within 40% of the actual quantities. Over a 40-year analysis period, the analysis shows that the more accurate deterioration estimates decrease the total life cycle cost by 19%. With this figure, the following benefit/cost analysis can be carried out.
Estimated 40-year Life Cycle Cost of a 5000 square foot deck = $200,000 Life Cycle Cost of GPR Inspection every 5 years = $ 4,275 Life Cycle Cost savings = 19% x $200,000 = $ 38,000 Benefit/Cost Ratio = 8.9
8.3.3 Quality Assurance for New Pavement The final scenario addresses the use of GPR to determine whether a construction contractor has placed HMA at the prescribed thickness. This analysis relies on previous work by Deacon, et al3 3 Deacon, J. A., C. L. Monismith, and J. T. Harvey. Pay Factors for Asphalt-Concrete Construction: Effect of
Construction Quality on Agency Costs. Technical Memorandum, TM-UCB-CAL/APT-97-1, April 1997.
QUANTITY $/UNIT $ COST Mobilization (ea) 1 $500 $500 Survey crew (person-hr) 24 $50 $1,200 Fixed lane closure (person-hr) 24 $50 $1,200
Total $2,900
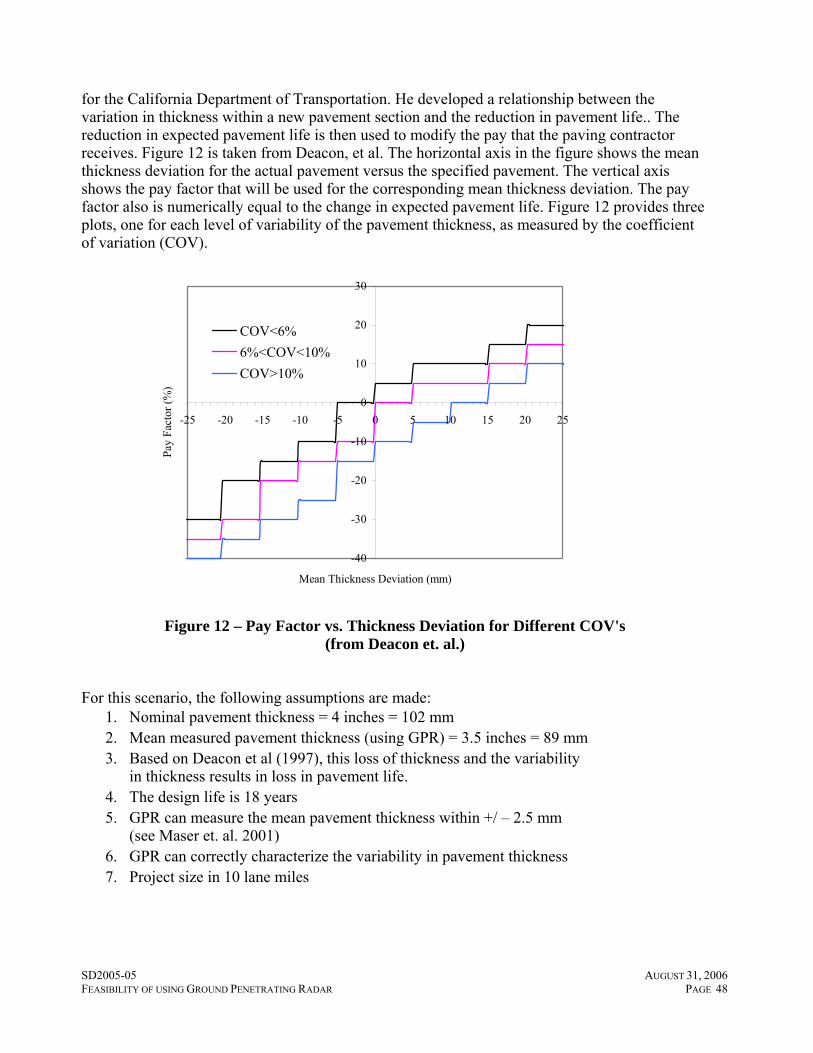
SD2005-05 AUGUST 31, 2006 FEASIBILITY OF USING GROUND PENETRATING RADAR PAGE 48
for the California Department of Transportation. He developed a relationship between the variation in thickness within a new pavement section and the reduction in pavement life.. The reduction in expected pavement life is then used to modify the pay that the paving contractor receives. Figure 12 is taken from Deacon, et al. The horizontal axis in the figure shows the mean thickness deviation for the actual pavement versus the specified pavement. The vertical axis shows the pay factor that will be used for the corresponding mean thickness deviation. The pay factor also is numerically equal to the change in expected pavement life. Figure 12 provides three plots, one for each level of variability of the pavement thickness, as measured by the coefficient of variation (COV).
Figure 12 – Pay Factor vs. Thickness Deviation for Different COV's
(from Deacon et. al.) For this scenario, the following assumptions are made:
1. Nominal pavement thickness = 4 inches = 102 mm 2. Mean measured pavement thickness (using GPR) = 3.5 inches = 89 mm 3. Based on Deacon et al (1997), this loss of thickness and the variability
in thickness results in loss in pavement life. 4. The design life is 18 years 5. GPR can measure the mean pavement thickness within +/ – 2.5 mm
(see Maser et. al. 2001) 6. GPR can correctly characterize the variability in pavement thickness 7. Project size in 10 lane miles
-40
-30
-20
-10
0
10
20
30
-25 -20 -15 -10 -5 0 5 10 15 20 25
Mean Thickness Deviation (mm)
Pay
Fact
or (%
)
COV<6%6%<COV<10%COV>10%
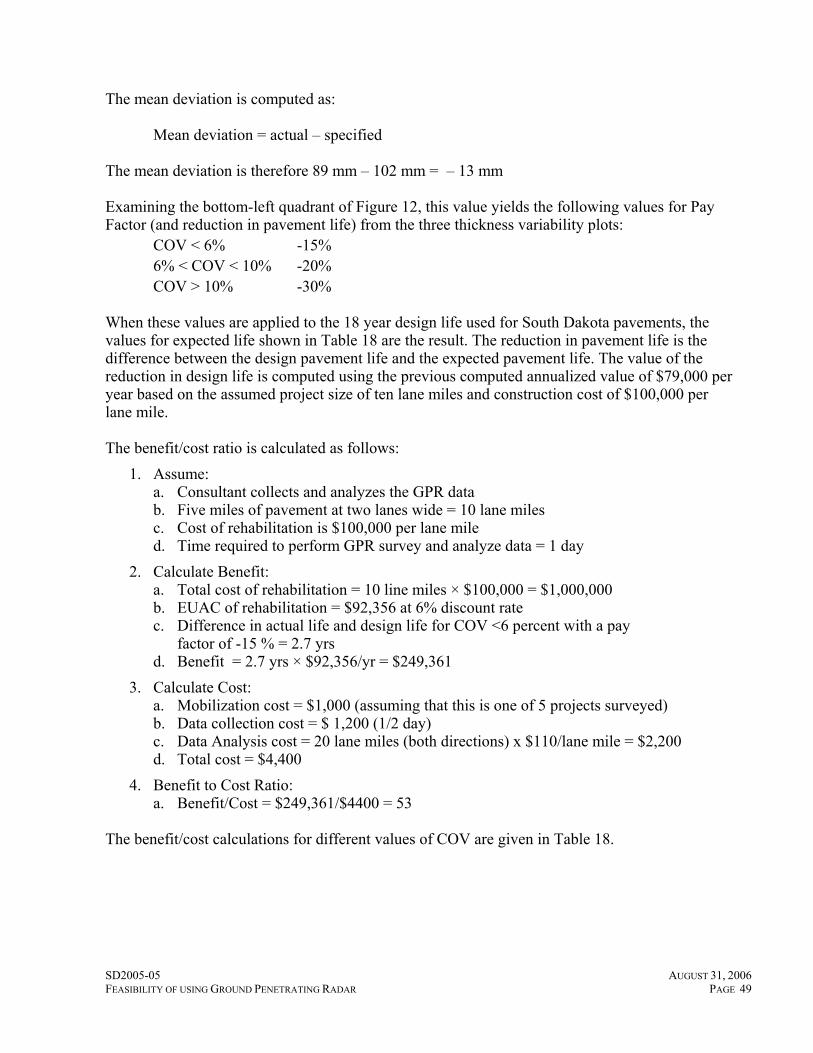
SD2005-05 AUGUST 31, 2006 FEASIBILITY OF USING GROUND PENETRATING RADAR PAGE 49
The mean deviation is computed as: Mean deviation = actual – specified The mean deviation is therefore 89 mm – 102 mm = – 13 mm Examining the bottom-left quadrant of Figure 12, this value yields the following values for Pay Factor (and reduction in pavement life) from the three thickness variability plots: COV < 6% -15% 6% < COV < 10% -20% COV > 10% -30% When these values are applied to the 18 year design life used for South Dakota pavements, the values for expected life shown in Table 18 are the result. The reduction in pavement life is the difference between the design pavement life and the expected pavement life. The value of the reduction in design life is computed using the previous computed annualized value of $79,000 per year based on the assumed project size of ten lane miles and construction cost of $100,000 per lane mile. The benefit/cost ratio is calculated as follows:
1. Assume: a. Consultant collects and analyzes the GPR data b. Five miles of pavement at two lanes wide = 10 lane miles c. Cost of rehabilitation is $100,000 per lane mile d. Time required to perform GPR survey and analyze data = 1 day
2. Calculate Benefit: a. Total cost of rehabilitation = 10 line miles × $100,000 = $1,000,000 b. EUAC of rehabilitation = $92,356 at 6% discount rate c. Difference in actual life and design life for COV <6 percent with a pay
factor of -15 % = 2.7 yrs d. Benefit = 2.7 yrs × $92,356/yr = $249,361
3. Calculate Cost: a. Mobilization cost = $1,000 (assuming that this is one of 5 projects surveyed) b. Data collection cost = $ 1,200 (1/2 day) c. Data Analysis cost = 20 lane miles (both directions) x $110/lane mile = $2,200 d. Total cost = $4,400
4. Benefit to Cost Ratio: a. Benefit/Cost = $249,361/$4400 = 53
The benefit/cost calculations for different values of COV are given in Table 18.
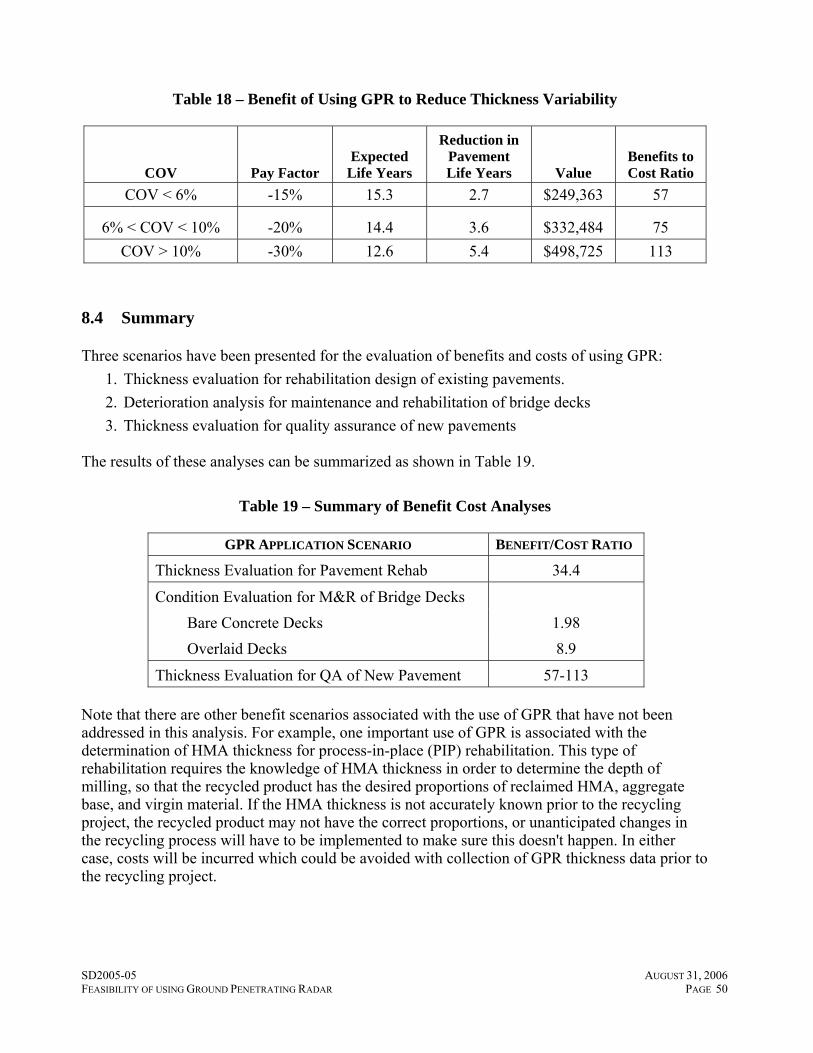
SD2005-05 AUGUST 31, 2006 FEASIBILITY OF USING GROUND PENETRATING RADAR PAGE 50
Table 18 – Benefit of Using GPR to Reduce Thickness Variability
COV Pay Factor Expected
Life Years
Reduction in Pavement Life Years Value
Benefits to Cost Ratio
COV < 6% -15% 15.3 2.7 $249,363 57
6% < COV < 10% -20% 14.4 3.6 $332,484 75 COV > 10% -30% 12.6 5.4 $498,725 113
8.4 Summary Three scenarios have been presented for the evaluation of benefits and costs of using GPR:
1. Thickness evaluation for rehabilitation design of existing pavements. 2. Deterioration analysis for maintenance and rehabilitation of bridge decks 3. Thickness evaluation for quality assurance of new pavements
The results of these analyses can be summarized as shown in Table 19.
Table 19 – Summary of Benefit Cost Analyses
GPR APPLICATION SCENARIO BENEFIT/COST RATIO
Thickness Evaluation for Pavement Rehab 34.4
Condition Evaluation for M&R of Bridge Decks Bare Concrete Decks 1.98 Overlaid Decks 8.9
Thickness Evaluation for QA of New Pavement 57-113 Note that there are other benefit scenarios associated with the use of GPR that have not been addressed in this analysis. For example, one important use of GPR is associated with the determination of HMA thickness for process-in-place (PIP) rehabilitation. This type of rehabilitation requires the knowledge of HMA thickness in order to determine the depth of milling, so that the recycled product has the desired proportions of reclaimed HMA, aggregate base, and virgin material. If the HMA thickness is not accurately known prior to the recycling project, the recycled product may not have the correct proportions, or unanticipated changes in the recycling process will have to be implemented to make sure this doesn't happen. In either case, costs will be incurred which could be avoided with collection of GPR thickness data prior to the recycling project.
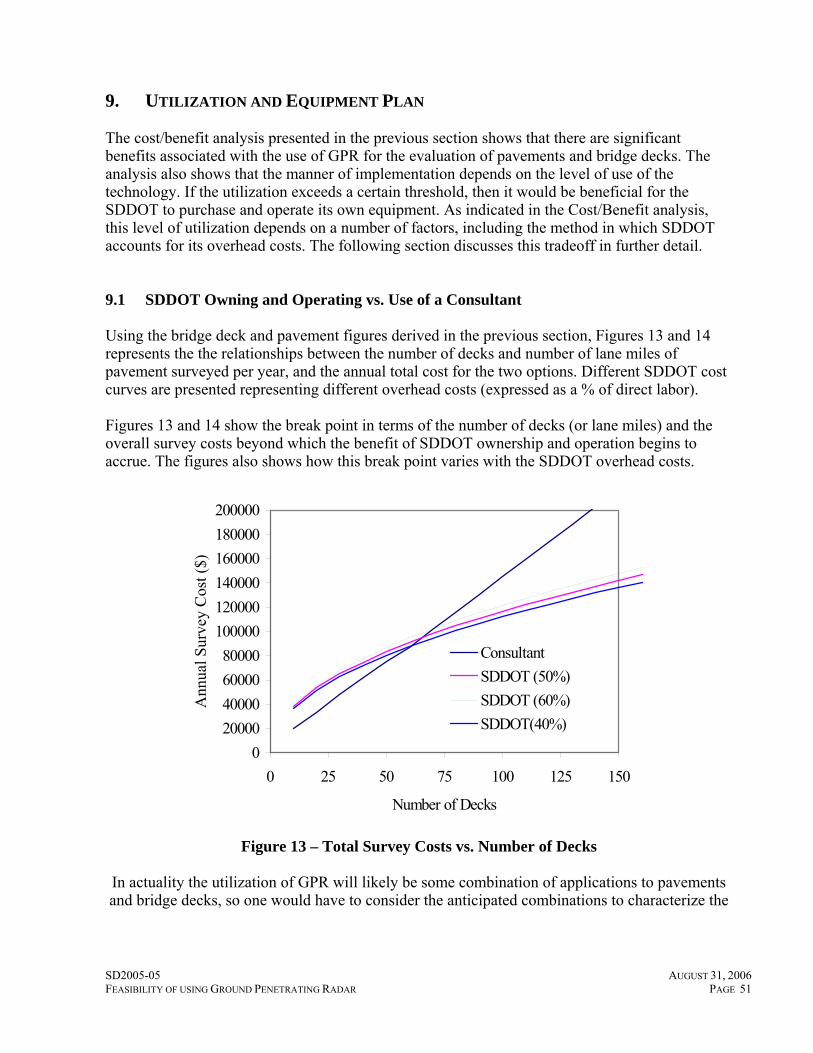
SD2005-05 AUGUST 31, 2006 FEASIBILITY OF USING GROUND PENETRATING RADAR PAGE 51
9. UTILIZATION AND EQUIPMENT PLAN The cost/benefit analysis presented in the previous section shows that there are significant benefits associated with the use of GPR for the evaluation of pavements and bridge decks. The analysis also shows that the manner of implementation depends on the level of use of the technology. If the utilization exceeds a certain threshold, then it would be beneficial for the SDDOT to purchase and operate its own equipment. As indicated in the Cost/Benefit analysis, this level of utilization depends on a number of factors, including the method in which SDDOT accounts for its overhead costs. The following section discusses this tradeoff in further detail. 9.1 SDDOT Owning and Operating vs. Use of a Consultant Using the bridge deck and pavement figures derived in the previous section, Figures 13 and 14 represents the the relationships between the number of decks and number of lane miles of pavement surveyed per year, and the annual total cost for the two options. Different SDDOT cost curves are presented representing different overhead costs (expressed as a % of direct labor). Figures 13 and 14 show the break point in terms of the number of decks (or lane miles) and the overall survey costs beyond which the benefit of SDDOT ownership and operation begins to accrue. The figures also shows how this break point varies with the SDDOT overhead costs.
020000400006000080000
100000120000140000160000180000200000
0 25 50 75 100 125 150
Number of Decks
Ann
ual S
urve
y C
ost (
$)
ConsultantSDDOT (50%)SDDOT (60%)SDDOT(40%)
Figure 13 – Total Survey Costs vs. Number of Decks In actuality the utilization of GPR will likely be some combination of applications to pavements and bridge decks, so one would have to consider the anticipated combinations to characterize the
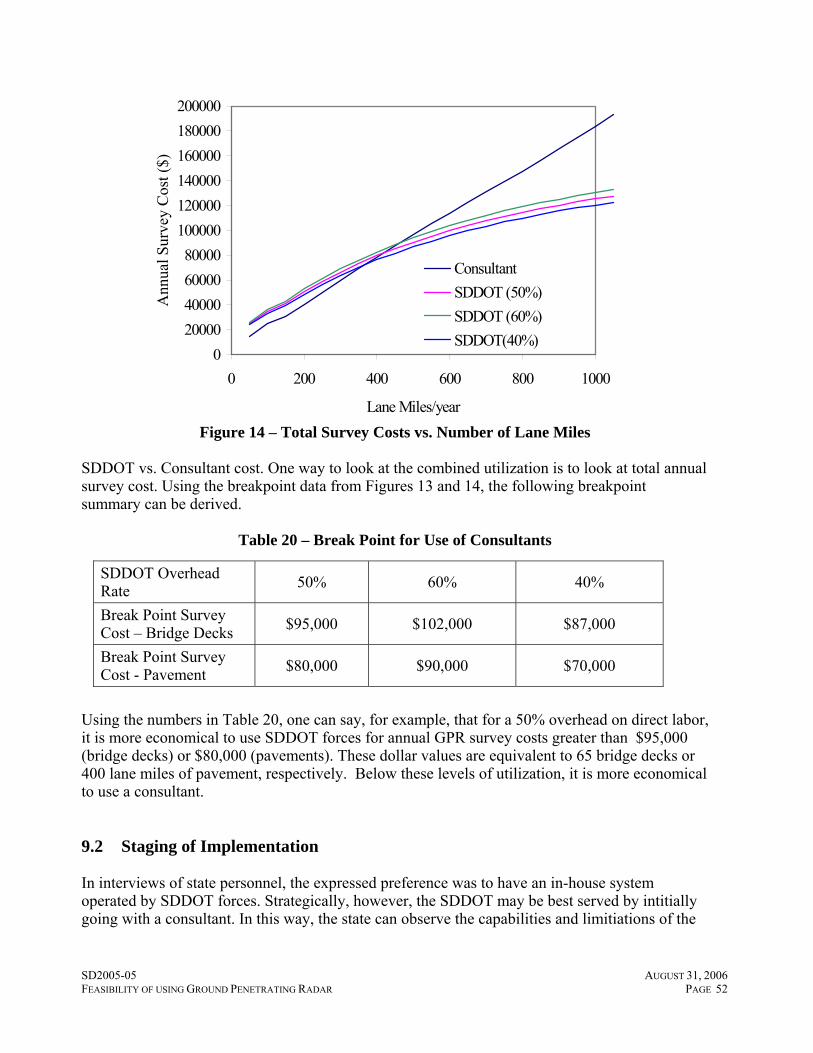
SD2005-05 AUGUST 31, 2006 FEASIBILITY OF USING GROUND PENETRATING RADAR PAGE 52
020000400006000080000
100000120000140000160000180000200000
0 200 400 600 800 1000
Lane Miles/year
Ann
ual S
urve
y C
ost (
$)
ConsultantSDDOT (50%)SDDOT (60%)SDDOT(40%)
Figure 14 – Total Survey Costs vs. Number of Lane Miles
SDDOT vs. Consultant cost. One way to look at the combined utilization is to look at total annual survey cost. Using the breakpoint data from Figures 13 and 14, the following breakpoint summary can be derived.
Table 20 – Break Point for Use of Consultants
SDDOT Overhead Rate 50% 60% 40%
Break Point Survey Cost – Bridge Decks $95,000 $102,000 $87,000
Break Point Survey Cost - Pavement $80,000 $90,000 $70,000
Using the numbers in Table 20, one can say, for example, that for a 50% overhead on direct labor, it is more economical to use SDDOT forces for annual GPR survey costs greater than $95,000 (bridge decks) or $80,000 (pavements). These dollar values are equivalent to 65 bridge decks or 400 lane miles of pavement, respectively. Below these levels of utilization, it is more economical to use a consultant. 9.2 Staging of Implementation In interviews of state personnel, the expressed preference was to have an in-house system operated by SDDOT forces. Strategically, however, the SDDOT may be best served by intitially going with a consultant. In this way, the state can observe the capabilities and limitiations of the
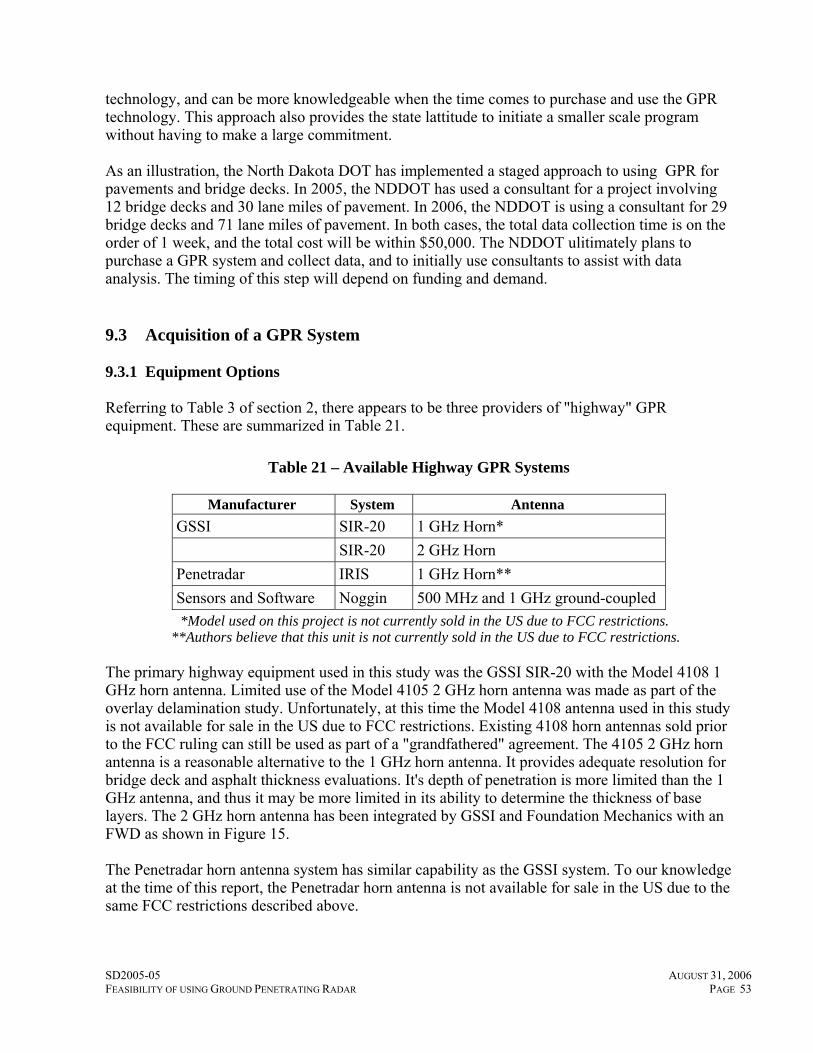
SD2005-05 AUGUST 31, 2006 FEASIBILITY OF USING GROUND PENETRATING RADAR PAGE 53
technology, and can be more knowledgeable when the time comes to purchase and use the GPR technology. This approach also provides the state lattitude to initiate a smaller scale program without having to make a large commitment. As an illustration, the North Dakota DOT has implemented a staged approach to using GPR for pavements and bridge decks. In 2005, the NDDOT has used a consultant for a project involving 12 bridge decks and 30 lane miles of pavement. In 2006, the NDDOT is using a consultant for 29 bridge decks and 71 lane miles of pavement. In both cases, the total data collection time is on the order of 1 week, and the total cost will be within $50,000. The NDDOT ulitimately plans to purchase a GPR system and collect data, and to initially use consultants to assist with data analysis. The timing of this step will depend on funding and demand. 9.3 Acquisition of a GPR System 9.3.1 Equipment Options Referring to Table 3 of section 2, there appears to be three providers of "highway" GPR equipment. These are summarized in Table 21.
Table 21 – Available Highway GPR Systems
Manufacturer System Antenna
GSSI SIR-20 1 GHz Horn* SIR-20 2 GHz Horn Penetradar IRIS 1 GHz Horn** Sensors and Software Noggin 500 MHz and 1 GHz ground-coupled
*Model used on this project is not currently sold in the US due to FCC restrictions. **Authors believe that this unit is not currently sold in the US due to FCC restrictions.
The primary highway equipment used in this study was the GSSI SIR-20 with the Model 4108 1 GHz horn antenna. Limited use of the Model 4105 2 GHz horn antenna was made as part of the overlay delamination study. Unfortunately, at this time the Model 4108 antenna used in this study is not available for sale in the US due to FCC restrictions. Existing 4108 horn antennas sold prior to the FCC ruling can still be used as part of a "grandfathered" agreement. The 4105 2 GHz horn antenna is a reasonable alternative to the 1 GHz horn antenna. It provides adequate resolution for bridge deck and asphalt thickness evaluations. It's depth of penetration is more limited than the 1 GHz antenna, and thus it may be more limited in its ability to determine the thickness of base layers. The 2 GHz horn antenna has been integrated by GSSI and Foundation Mechanics with an FWD as shown in Figure 15. The Penetradar horn antenna system has similar capability as the GSSI system. To our knowledge at the time of this report, the Penetradar horn antenna is not available for sale in the US due to the same FCC restrictions described above.
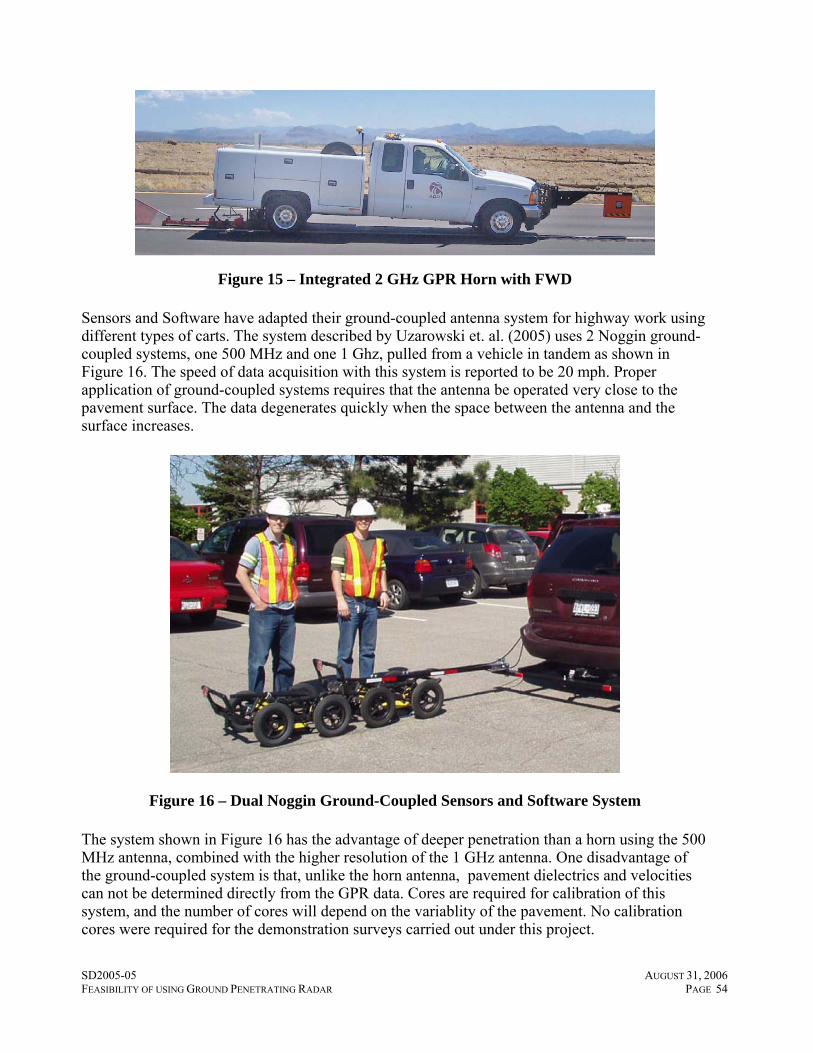
SD2005-05 AUGUST 31, 2006 FEASIBILITY OF USING GROUND PENETRATING RADAR PAGE 54
Figure 15 – Integrated 2 GHz GPR Horn with FWD Sensors and Software have adapted their ground-coupled antenna system for highway work using different types of carts. The system described by Uzarowski et. al. (2005) uses 2 Noggin ground-coupled systems, one 500 MHz and one 1 Ghz, pulled from a vehicle in tandem as shown in Figure 16. The speed of data acquisition with this system is reported to be 20 mph. Proper application of ground-coupled systems requires that the antenna be operated very close to the pavement surface. The data degenerates quickly when the space between the antenna and the surface increases.
Figure 16 – Dual Noggin Ground-Coupled Sensors and Software System The system shown in Figure 16 has the advantage of deeper penetration than a horn using the 500 MHz antenna, combined with the higher resolution of the 1 GHz antenna. One disadvantage of the ground-coupled system is that, unlike the horn antenna, pavement dielectrics and velocities can not be determined directly from the GPR data. Cores are required for calibration of this system, and the number of cores will depend on the variablity of the pavement. No calibration cores were required for the demonstration surveys carried out under this project.
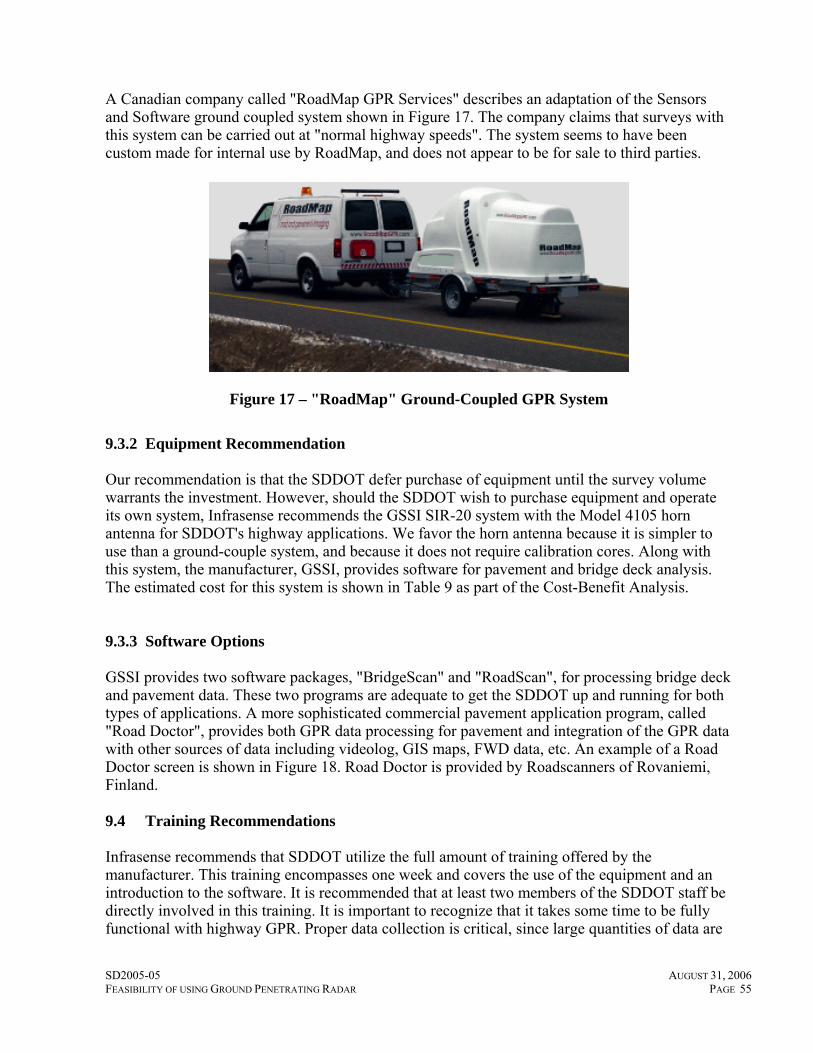
SD2005-05 AUGUST 31, 2006 FEASIBILITY OF USING GROUND PENETRATING RADAR PAGE 55
A Canadian company called "RoadMap GPR Services" describes an adaptation of the Sensors and Software ground coupled system shown in Figure 17. The company claims that surveys with this system can be carried out at "normal highway speeds". The system seems to have been custom made for internal use by RoadMap, and does not appear to be for sale to third parties.
Figure 17 – "RoadMap" Ground-Coupled GPR System 9.3.2 Equipment Recommendation Our recommendation is that the SDDOT defer purchase of equipment until the survey volume warrants the investment. However, should the SDDOT wish to purchase equipment and operate its own system, Infrasense recommends the GSSI SIR-20 system with the Model 4105 horn antenna for SDDOT's highway applications. We favor the horn antenna because it is simpler to use than a ground-couple system, and because it does not require calibration cores. Along with this system, the manufacturer, GSSI, provides software for pavement and bridge deck analysis. The estimated cost for this system is shown in Table 9 as part of the Cost-Benefit Analysis. 9.3.3 Software Options GSSI provides two software packages, "BridgeScan" and "RoadScan", for processing bridge deck and pavement data. These two programs are adequate to get the SDDOT up and running for both types of applications. A more sophisticated commercial pavement application program, called "Road Doctor", provides both GPR data processing for pavement and integration of the GPR data with other sources of data including videolog, GIS maps, FWD data, etc. An example of a Road Doctor screen is shown in Figure 18. Road Doctor is provided by Roadscanners of Rovaniemi, Finland. 9.4 Training Recommendations Infrasense recommends that SDDOT utilize the full amount of training offered by the manufacturer. This training encompasses one week and covers the use of the equipment and an introduction to the software. It is recommended that at least two members of the SDDOT staff be directly involved in this training. It is important to recognize that it takes some time to be fully functional with highway GPR. Proper data collection is critical, since large quantities of data are
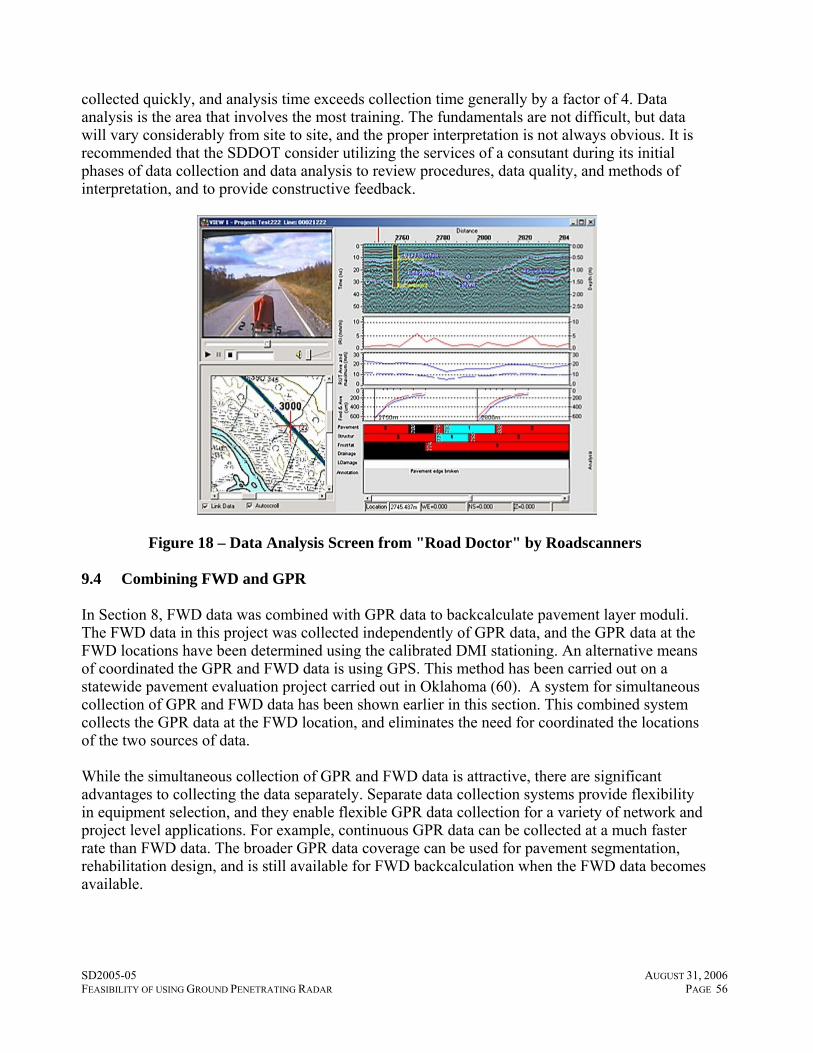
SD2005-05 AUGUST 31, 2006 FEASIBILITY OF USING GROUND PENETRATING RADAR PAGE 56
collected quickly, and analysis time exceeds collection time generally by a factor of 4. Data analysis is the area that involves the most training. The fundamentals are not difficult, but data will vary considerably from site to site, and the proper interpretation is not always obvious. It is recommended that the SDDOT consider utilizing the services of a consutant during its initial phases of data collection and data analysis to review procedures, data quality, and methods of interpretation, and to provide constructive feedback.
Figure 18 – Data Analysis Screen from "Road Doctor" by Roadscanners 9.4 Combining FWD and GPR In Section 8, FWD data was combined with GPR data to backcalculate pavement layer moduli. The FWD data in this project was collected independently of GPR data, and the GPR data at the FWD locations have been determined using the calibrated DMI stationing. An alternative means of coordinated the GPR and FWD data is using GPS. This method has been carried out on a statewide pavement evaluation project carried out in Oklahoma (60). A system for simultaneous collection of GPR and FWD data has been shown earlier in this section. This combined system collects the GPR data at the FWD location, and eliminates the need for coordinated the locations of the two sources of data. While the simultaneous collection of GPR and FWD data is attractive, there are significant advantages to collecting the data separately. Separate data collection systems provide flexibility in equipment selection, and they enable flexible GPR data collection for a variety of network and project level applications. For example, continuous GPR data can be collected at a much faster rate than FWD data. The broader GPR data coverage can be used for pavement segmentation, rehabilitation design, and is still available for FWD backcalculation when the FWD data becomes available.
SD2005-05 AUGUST 31, 2006 FEASIBILITY OF USING GROUND PENETRATING RADAR PAGE 57
10. FINDINGS AND CONCLUSIONS The objectives of this project were to (1) provide the SDDOT a comprehensive assessment of GPR technologies for transportation infrastructure; (2) develop a cost-benefit appraisal of the applicability and merit of acquiring GPR capabilities for routine applications; and (3) develop an implementation plan including costs and recommendations for equipment, application, training, and personnel requirements. The objectives were addressed by reviewing the literature, interviewing SDDOT personnel, and supplementing this review with a survey of GPR practices of other state highway agencies. A set of demonstration projects were designed based on the interview feedback. The projects were classified as bridge deck evaluations, pavement evaluations, and geotechnical evaluations. A cost benefit analysis has been carried out to assess the cost GPR applications, the tradeoff between doing the work internally vs. contracting out, and the ration of the cost to the potential benefit. Based on this analysis, a utilization and equipment plan has been prepared. Based on the steps described above, the following summarizes the findings and conclusions of this study:
1. The most common application interest for GPR, both within SDDOT and for other transportation agencies, is towards evaluation of pavement thickness and assessment of bridge deck deterioration. GPR has also been used for various geotechnical applications.
2. The GPR equipment most suited to both the pavement and bridge deck application is a vehicle-mounted horn antenna coupled with a vehicle-based data acquisition and storage system.
3. GPR produces accurate pavement layer thickness data. Discrepancies between GPR and core data on older pavement can sometimes be related to incomplete core recovery.
4. GPR can measure overlay thickness, rebar depth, and corrosion-induced concrete deterioration on bridge decks. GPR is most effective for slab-on-girder decks. The evaluation capability is diminished with one-way slab bridges due to the increased thickness and the lack of a uniform mat of transverse steel for reference.. The ability for GPR to detect ASR damage is not clear. Overall damage quantities were similar when GPR was compared to chain drag findings, but the locations did not coincide. GPR did not appear to be effective in detecting debonding of PCC overlays.
5. GPR can be used to evaluate variations in subgrade moisture. Calibration to direct moisture content measurement is necessary.
6. Geotechnical applications in natural soil environments are limited in South Dakota. The high clay content in South Dakota soil attenuates the GPR signal to the point that in many locations no useful data can be returned below 3 to 4 feet.
7. Implementation of GPR by state forces requires a significant investment in equipment and personnel. Although SDDOT personnel would prefer an in-house system and capability, a utilization analysis shows that it is economical to use state forces and equipment if the volume of contracted work exceeds $70,000-$102,000/year. The break point depends on the type of surveys (bridge deck or pavement) and the SDDOT overhead rate used in the analysis.
SD2005-05 AUGUST 31, 2006 FEASIBILITY OF USING GROUND PENETRATING RADAR PAGE 58
8. The benefit/cost ratio of using GPR for pavement and bridge deck evaluations can range from 2 to 117, depending on the scenario being considered. The higher benefit ratios are achieved when GPR provides information leading to better decisions and more timely responses.
SD2005-05 AUGUST 31, 2006 FEASIBILITY OF USING GROUND PENETRATING RADAR PAGE 59
11. IMPLEMENTATION RECOMMENDATIONS Based on the Utilization and Equipment Plan presented in Section 9, the following are the implementation recommendations. 1. Use of SDDOT forces vs. Consultants It is recommended that SDDOT use of a consultant initially to develop experience with the work product, the equipment, and the methodology. Once consultant survey costs exceed $70,000 – 100,000 per year, it is recommended that SDDOT acquire and operate their own equipment, and carry out their own data analysis. 2. Equipment and Software It is recommended that SDDOT utilize a horn antenna GPR system. One such system that is currently available in the US is the GSSI Model 4105 horn antenna used with the SIR-20 acquisition and control system. Data analysis software such as "BridgeScan" and RoadScan" should also be acquired with this equipment. 3. Personnel Requirements Should SDDOT purchase GPR equipment and software, it is recommended that at least one FTE be assigned to the operation of the equipment and the data analysis. The total number of FTE's assigned to the GPR system operation will ultimately depend on the utilization of the system. 4. Training It is recommended that SDDOT utilize the full amount of training offered by the manufacturer. This training generally encompasses the use of the equipment and an introduction to the software. It is recommended that at least two members of the SDDOT staff be directly involved in this training, so that there is there is backup if someone is not available. It is recommended that once SDDOT becomes familiar with the the GPR system, that a consultant be brought in for data analysis training and periodic reviews of methods and procedures. It is important to recognize that it takes some time to be fully functional with highway GPR, and that training is a critical part of this functionality. 5. Combining FWD and GPR Since SDDOT currently owns and operates an FWD, it is recommended that the GPR data used for FWD backcalculation be collected independently of the FWD vehicle. This approach provides more flexibility and does not require an integrated vehicle. Care must be exercised to ensure that GPR thicknesses used for FWD analysis are at the correct locations.

SD2005-05 AUGUST 31, 2006 FEASIBILITY OF USING GROUND PENETRATING RADAR PAGE 60
SD2005-05 AUGUST 31, 2006 FEASIBILITY OF USING GROUND PENETRATING RADAR PAGE 61
12. ANALYSIS OF RESEARCH BENEFITS The research has provided the SDDOT with an objective evaluation of the capabilities and limitations of Ground Penetrating Radar (GPR) for highway applications. It has incorporated the needs and preferences of SDDOT personnel with the experiences of other state agencies, and has demonstrated the application of the technology in the South Dakota environment. Through this study and demonstration, the SDDOT has been provided with an assessment of the cost of implementing this technology, along with the benefits. As shown in the benefit/cost analysis, one successful project application of GPR has the potential to produce a savings exceeding the cost of this study. In addition, the recommendations made regarding investment in equipment and personnel serve to help the agency get the maximum return.

SD2005-05 AUGUST 31, 2006 FEASIBILITY OF USING GROUND PENETRATING RADAR PAGE 62
SD2005-05 AUGUST 31, 2006 FEASIBILITY OF USING GROUND PENETRATING RADAR PAGE 63
13. REFERENCES 1. Al-Qadi, I. L., Lahouar, S., Jiang, K., McGhee, K., Mokarem, D., “Validation of Ground Penetration
Radar Accuracy for Estimating Pavement Layer Thicknesses”, Paper No. 05-2341, Proceedings, Transportation Research Board 84th Annual Meeting, Washington, DC, January 9-13, 2005.
2. ASTM D 4748 – 98, “Standard Test Method for Determining the Thickness of Bound Pavement Layers Using Short-Pulse Radar”, Annual Book of ASTM Standards, American Society for Testing and Materials, March, 1998.
3. ASTM D 6087 – 05, “Standard Test Method for Evaluating Asphalt-Covered Concrete Bridge Decks Using Ground Penetrating Radar”, Annual Book of ASTM Standards, American Society for Testing and Materials, 2005.
4. Barnes, C. L. and Trottier, J. F., “Effectiveness of Ground Penetrating Radar in Predicting Deck Repair Quantities”, ASCE Journal of Infrastructure Systems, Vol. 10, No. 2, June 2004.
5. Chung, T., and Carter, C. R., “Radar Signal Enhancement for Dart”, MAT-89-05, Ontario Ministry of Transportation and Communications, Research and Development Branch, Ontario, Canada, 1989.
6. Chung, T., and Carter, C. R., “Pavement Thickness Determination and Detection of Pavement Cavities Using Radar”, Ontario Ministry of Transportation and Communications, Research and Development Branch, Ontario, Canada, 1991.
7. dos Reis, H.L.M. and Barght, M.D., “Evaluation of Bridge Deck Delamination Investigation Methods”, Report No. (ITRC) FR 95/96-1, Illinois Transportation Research Center, July 1998.
8. Fernando, E. G., and Maser, K. R., “Development of a Procedure for the Automated Collection of Flexible Pavement Layer Thicknesses and Material Properties”, Final Report, Florida DOT State Project 99700-7550, 1997.
9. Fernando, E. G., Maser, K. R., and Dietrich, B., “Implementation of Ground Penetrating Radar for Network-Level Pavement Evaluation in Florida”, Proc., GPR '94, Fifth International Conference on Ground Penetrating Radar, 3, Kitchener, Ontario, Canada, 1994.
10. Hughes, C. S., Simpson, A. L., Cominsky, R., Pendleton, O. J., Weed, R. M., and Wilson, T., “Measurement and Specification of Construction Quality, Volume 2, Final Report”, FHWA Report DTFH61-94-C-00078, Brent Rauhut Engineering Inc., Austin, TX 78759, 1996.
11. Infrasense, “Applications of Ground Penetrating Radar Applications for Pavement and Bridge Management”, Report Submitted to the Wyoming Transportation Commission, January, 1994.
12. Infrasense, “Demonstration of Ground Penetrating Radar for Pavement and Bridge Deck Evaluation”, Report Submitted to the North Dakota Department of Transportation, July, 2003.
13. Infrasense, “Evaluation of Road Thickness Measurements at Traffic Speed using Ground Penetrating Radar”, Report submitted to the UK Transport Research Laboratory (TRL), February, 1994.
14. Infrasense, “Ground Penetrating Pavement Layer Thickness Survey – Report of Accuracy”, Report Submitted to the Kent County Council, UK, February, 1994.
15. Infrasense, “Ground Penetrating Radar Evaluation of Pavements and Bridge Decks”, Report Submitted to the North Dakota Department of Transportation, March, 2005.
16. Infrasense, “Ground Penetrating Radar Survey of Pavement Thickness on Mn/ROAD Sections”, Report Submitted to the Minnesota Department of Transportation under State Project 72300, November, 1994.
17. Infrasense, “Highway Speed Pavement Thickness Surveys Using Radar”, Report Submitted to the FHWA Office of Engineering/Pavement Division, Washington, DC, December, 1992.
SD2005-05 AUGUST 31, 2006 FEASIBILITY OF USING GROUND PENETRATING RADAR PAGE 64
18. Infrasense, “Survey and Analysis of Ground Penetrating Radar for 5 Bridges in 3 Tennessee Counties”, Report TN-RES1025, Submitted to the Tennessee Department of Transportation, November, 1994.
19. Infrasense, “The use of Ground Penetrating Radar on In-Service Pavements and Bridge Decks”, Final Report, Arkansas Highway and Transportation Department Research Project No. TRC-0102, September, 2001.
20. Infrasense, “Thickness Data Gathering using Ground Penetrating Radar Technology Equipment”, Report Submitted to the Idaho Transportation Department, February, 1997.
21. Maser, K. R., “New Technology for Bridge Deck Assessment, Phases I and II”, Final Reports. Report No. FHWA-NETC-89-01 and 90-01. Work sponsored by the New England Transportation Consortium, Center for Construction Research and Education, Massachusetts Institute of Technology. Cambridge, MA, 1990.
22. Maser, K. R., “Non-Destructive Measurement of Pavement Layer Thickness”, Report FHWA/CA/OR-2003/03 prepared for the California Department of Transportation, April, 2003.
23. Maser, K. R., “Pavement Characterization Using Ground Penetrating Radar: State of the Art and Current Practice”, Nondestructive Testing of Pavements and Backcalculation of Moduli: Third Volume, ASTM STP 1375, American Society for Testing and Materials, West Conshohocken, PA, 1999.
24. Maser, K. R., “Ground Penetrating Radar Studies to Characterize Pavement Layer Thickness Variations at GPS Sites”, Strategic Highway Research Program, Report SHRP-P-397, 1994.
25. Maser, K. R., “Evaluation of Bridge Decks and Pavements at Highway Speed Using Ground Penetrating Radar,” Proc., SPIE Conference on Nondestructive Evaluation of Aging Infrastructure, SPIE Publication 2456, Oakland, CA, 1995.
26. Maser, K. R., and Scullion, T., “Automated Pavement Subsurface Profiling Using Radar-Case Studies of Four Experimental Field Sites”, Transportation Research Record 1344, Transportation Research Board, National Research Council, 1992.
27. Maser, K. R., and Scullion, T., “Influence of Asphalt Layering and Surface Treatments on Asphalt and Base Layer Thickness Computations using Radar”, Texas DOTPD Report TX-92-1923-1, Austin, TX, 1992.
28. Maser, K., and Bernhardt, M. "Statewide Bridge Deck Survey using Ground Penetrating Radar:" Proceedings, Structural Materials Technology, IV Atlantic City, NJ, February-March, 2000.
29. Maser, K.R., “Bridge Deck Condition Surveys Using Radar: Case Studies Of 28 New England Decks”, Transportation Research Record No. 1304, TRB National Research Council, Washington, D.C., 13-17 Jan., pp. 94-102, 1991.
30. Maser, K.R., “Condition Assessment of Transportation Infrastructure Using Ground Penetrating Radar,” ASCE Journal of Infrastructure Systems, V.2(2), June, pp. 94-101, 1996.
31. Maser, K.R., Holland, T. J., Roberts, R., and Popovics, J., “Technology for Quality Control of New Pavement Thickness”, Proceedings, International Conference on Non-Destructive Testing in Civil Engineering, NDT/CE, Berlin, September, 2003.
32. NCHRP “Ground Penetrating Radar for Evaluation of Subsurface Conditions for Transportation Facilities”, NCHRP Synthesis 255, Transportation Research Board, National Research Council, 1998.
33. NHDOT, “Specification for Concrete Cover, Special Provision, Amendment To Section 520—Portland Cement Concrete, Section 3.1.7 Quality Assurance”, New Hampshire Department of Transportation, 1999.
34. Perkins, A. D., Amrol, J. J., Romero, F. A., and Roberts, R. L., “DOT Specification Development Based on Evaluation of Ground Penetrating Radar System Performance in Measuring Concrete Cover
SD2005-05 AUGUST 31, 2006 FEASIBILITY OF USING GROUND PENETRATING RADAR PAGE 65
on New Bridge Deck Construction”, Proceedings, Structural Materials Technology, IV Atlantic City, NJ, February-March, 2000.
35. Rmeili, E. and Scullion, T., “Detecting Stripping in Asphalt Concrete Layers using Ground Penetrating Radar”, Preprint 97-0508, 1997 Annual Meeting of the Transportation Research Board, Washington, DC, 1997.
36. Roberts, R., and Romero, F., “High Resolution GPR Bridge Deck Evaluation Surveys”, Proceedings of the International Conference on Corrosion and Rehabilitation of Reinforced Concrete Structures (ICCRRCS), December 7-11, 1998, Orlando, Florida, December, 1998.
37. Roddis, W. M. K., Maser, K. R., and Gisi, A. J., “Radar Pavement Thickness Evaluations for Varying Base Conditions”, Transportation Research Record No. 1355, Transportation Research Board, National Research Council, Washington, DC, 1992.
38. Saarenketo, T. and Roimela, P., “Ground Penetrating Radar Technique in Asphalt Pavement Density Quality Control”, Proceedings of the 7th International Conference on Ground Penetrating Radar, Lawrence, KS, pp. 461-466, May 27-30, 1998.
39. Saarenketo, T., and Scullion, T., “Ground Penetrating Radar Applications on Roads and Highways”, Texas Transportation Institute Research Report 1923-2F, 1994.
40. Schongar, G., “GPR Demonstration Project on Two Steel Reinforced Concrete Bridge Decks”, Client Report 87, Transportation Research and Development Bureau, New York State Department of Transportation, September, 2004.
41. Scullion, T., Servos, S., Ragsdale, J., and Saarenkento, T., “Applications of Ground-Coupled GPR to Pavement Evaluation”, Texas DOT Report 2947-S TX-98/2947-S, November, 1997.
42. Sebesta, S. and Scullion, T., “Using Infrared Imaging and Ground Penetrating Radar to Detect Segregation in Hot Mix Overlays”, TTI Report 4126-1, September, 2002.
43. Sebesta, S. and T. Scullion “Application of Infrared Imaging and Ground-Penetrating Radar for Detecting Segregation in Hot-Mix Asphalt Overlays”, Paper No. 03-3406 Transportation Research Board, 82nd Annual Meeting, Washington, DC, January 12-16, 2003.
44. Seucy, F.E., Dass, W. C., and Maser, K. R., “Nondestructive Layer Thickness Determination Techniques for and Advanced Pavement System Analyzer Report No. ESL-TR-92-XX”, prepared for the Air Force Civil Engineering Support Agency by Applied Research Associates, December, 1992.
45. Smith, S., and Scullion, T., “Development of Ground-Penetrating Radar Equipment for Detecting Pavement Condition for Preventive Maintenance”, Final Report, Strategic Highway Research Program, Project H-104A, 1993.
46. UK Department of Transport “Use and Limitations of Ground Penetrating Radar for Pavement Assessment”, Design Manual for Roads and Bridges, Volume 7, Section 3, December, 1994.
47. Ulriksen, P., “Application of Impulse Radar to Civil Engineering”, Doctoral Thesis, Lund Institute of Technology, Sweden, 1982.
48. Wenzlick, J., Scullion, T., and Maser, K.R., “High Accuracy Pavement Thickness Measurement using Ground Penetrating Radar”, Report No. RDT 99-003, Missouri Dept. of Transportation, February, 1999.
49. Willet, D., and Rister, B., “Ground Penetrating Radar Pavement Layer Thickness Evaluation”, Research Report KTC-02-29/FR101-00-1F, prepared by the Kentucky Transportation Center, December, 2002.
50. Hammons, M., Von Quintus, H., Maser, K. and Nazarian, S., "Detection Of Stripping In Hot Mix Asphalt" Final Report, submitted to the Georgia Department of Transportation, Office of Materials and Research, by Applied Research Associates, March, 2005.
SD2005-05 AUGUST 31, 2006 FEASIBILITY OF USING GROUND PENETRATING RADAR PAGE 66
51. Parker, F., Vecellio, B. and Greene, J., "Evaluation of the Accuracy of Pavement Surface Layer Thickness Measured with Ground Penetrating Radar", Final Report, 930-418 prepared by the Highway Research Center, Auburn University for the Alabama Department of Transportation, October, 1999.
52. Maser, K.R., and Rawson, A., "Network Bridge Deck Surveys Using High Speed Radar: Case Studies Of 44 Decks," Transportation Research Record No. 1347, TRB National Research Council, 1992.
53. SHRP C-101, “Condition Evaluation of Concrete Bridges Relative to Reinforcement Corrosion – SHRP C101 Report, Volume 3: Method of Evaluating the Condition of Asphalt-Covered Decks”, Strategic Highway Research Program Report SHRP-S-325, Washington, D.C., 1993.
54. Meggars, D. and Worley, N., “Comparison of Ground Penetrating Radar Bridge Deck Evaluation and Repair; Polk-Quincy Viaduct I-70, Topeka, Kansas”, Final Report, Report No. FHWA: KS-00-4, Department of Transportation, Kansas, September 2000.
55. Kurtz, J., John W. Fisher III, and Gordon Skau, Jashmid Armaghani and Jonathan G. Moxley "Advances in ground-penetrating radar for road subsurface measurements" Proceedings of SPIE – Volume 3066, Radar Sensor Technology II, Robert Trebits, James L. Kurtz, Editors, pp. 11-21, June 1997.
56. Deacon, J. A., C. L. Monismith, and J. T. Harvey. Pay Factors for Asphalt-Concrete Construction: Effect of Construction Quality on Agency Costs. Technical Memorandum, TM-UCB-CAL/APT-97-1, April 1997.
57. AASHTO Guide for Design of Pavement Structures. American Association of State Highway and Transportation Officials, Washington, DC, 1993.
58. EVERSERIES© USER’S GUIDE Pavement Analysis Computer Software and Case Studies, Washington State Department of Transportation, August 2005.
59. Uzarowski, L, Maher, M., and Balasundaram, A. "Practical Application of GPR to Supplement Data from FWD for Quick Pavement Performance Prediction", Annual Conference of the Canadian Society of Civil Engineers, Toronto, ON, 2005.
60. Williams, R., Martin, T., Maser, K., and McGovern, G. "Evaluation of Network-Level Ground Penetrating Radar", Paper 06-2243, Transportation Research Board, 85th Annual Meeting, Washington, DC, January 22-26, 2006.
SD2005-05 AUGUST 31, 2006 FEASIBILITY OF USING GROUND PENETRATING RADAR PAGE A-1
APPENDIX A
Interviews with SDDOT Personnel
The interviews were carried out on June 9 and 10, 2005 at the SDDOT offices in Pierre. They were carried out in a series of 1 hour sessions with the following groups: Group 1 – Lisa Rombough (Pavement Condition) and Gill Hedman (Pavement Design Engineer) Group 2 – Lisa Rombough (Pavement Condition), Steve Gramm (Supervisor, Data Analysis
Engineer), Blair Lunde (Pavement Management Engineer), and Phillip Clements (Assistant Pavement Management Engineer)
Group 3 – Paul Nelson (Pierre Region Bridge Maintenance), Tom Gilsrud (Bridge Maintenance
Engineer), John Cole (Chief Bridge Engineer), and Elmer Alksnitis. Group 4 – Bob Longbons (Soils Engineer) Group 5 – Thomas Grannes (Materials Engineer), Rick Rowen (Bituminous Engineer), and Josh
Bresher Group 6 – Jason Engbrecht (Aeronautics) and Tom Gilsrud (Bridge Maintenance Engineer) Group 7 – Gene Gunsalus (Rapid City – Bridges) and Tom Gilsrud (Bridge Maintenance
Engineer) The following presents the interview questions and summarizes the responses from the different
groups.
General Background and Perspective 1.1 What is your familiarity with GPR? Group 1 – Both attended workshop last year with Mark Loken of the Minnesota DOT (MnDOT).
Ms. Rombough also attended a demo on Conquest. Group 2 – They have seen some results on a research project addressing continuously reinforced
concrete pavement (CRCP) but their familiarity is limited. They have not seen any actual demonstration as yet.
Group 3 – The group recalled two research projects in the past dealing with GPR. These were
done approximately 1997 and 2001.
SD2005-05 AUGUST 31, 2006 FEASIBILITY OF USING GROUND PENETRATING RADAR PAGE A-2
Group 4 – The respondent understands the concept. He has done both seismic and refraction. Group 5 – They attended the seminar held in Rapid City by Mark Loken of MnDOT. They have
also read about the technology. Group 6 – None Group 7 – Know the term. 1.2 What type of experience have you had with GPR in the past? 1.2.1 Direct Experience with a project or projects Group 1 – They have observed demonstrations. Group 2 – They have no direct experience. Group 3 – The group only has knowledge of the previous SDDOT research. Group 4 – No direct experience. His office provided some support on a project performed by the
South Dakota School of Mines. Group 5 – None Group 6 – None Group 7 – None 1.2.2 Indirect experience (second hand, hearsay, etc.) Group 1 – They have had informal conversations. Group 2 – They have heard about potential applications to CRCP. Group 3 – They have seen literature, articles, and reports. GPR has also been discussed at
AASHTO Bridge Subcommittee meetings. Group 4 – The respondent has seen conference presentations and attended the seminar conducted
by Mark Loken of the Minnesota DOT. Group 5 – They stated that Ken Marks in road inventory has been an advocate of GPR. Group 6 – Research panel meeting presentations and discussions. Group 7 – Research meeting and an FHWA demonstration on US 84 by Penetradar.
SD2005-05 AUGUST 31, 2006 FEASIBILITY OF USING GROUND PENETRATING RADAR PAGE A-3
1.3 What is your biggest reservation about GPR? Group 1 – Lisa – The unknown – can we trust the hype? Group 2 – The group supports the concept but need to see if the potential becomes reality. Both
Steve Gramm and Ken Marks have submitted research problem statements concerning GPR for years, mainly addressing pavement thickness.
Group 3 – The major concern was whether GPR will give accurate results as to the true condition
of the bridge being evaluated. Data interpretation is part of this issue. Group 4 – The biggest concern is that material in strata (shale, high clay soils, gypsum) may not
be conducive to the use of GPR. Group 5 – They want the system to be easy to use, accurate, and consistent. They do not want a
“black box” device. Group 6 – They need to measure runway pavement thickness to within one quarter to one half
inch. Accuracy is an issue. Group 7 – Ease of use and interpretation are concerns.
Structure of the Project 2.1 What would you like to see as the outcome of this project? Group 1 – Lisa – need the layer thicknesses as input for use with backcalculation. Gill also is interested in knowledge of pavement depths. He would like to replace destructive
testing and see more widespread use. He views cores as satisfactory at the project level but probably not for network information.
Group 2 – The group would like to get pavement thickness and pavement type. Pavement
thickness is categorized as thin (5 inches) and thick (ten inches) of asphaltic concrete (ac). Information on this is available at sddot.com/p. They would also like assistance with determining quantities for plans and verifying roadbed layer types and depths.
Group 3 – The group would like a unit that can move over a bridge deck at a reasonable speed
and is automated and will produce condition of the bridge in terms of rebar and delamination. Detection of deterioration is critical.
Group 4 – The respondent would like to see the technology used in both bridge and pavement
applications. It will also reduce the highway exposure of personnel taking cores. Detection of moisture in the subgrade is an added advantage as would be sinkhole detection in limestone.

SD2005-05 AUGUST 31, 2006 FEASIBILITY OF USING GROUND PENETRATING RADAR PAGE A-4
Group 5 – They want an accurate way to measure pavement thickness, the location of reinforcing steel, and delamination. They also want information on failure mechanisms, including stripping and air voids.
Group 6 – They would like all of the tasks to be satisfactorily completed and accuracy proven. Group 7 – Detection of delamination in bridge decks. 2.2 What do you feel should be the priorities of the work? Group 1 – The group would like answers to what GPR can and can’t do. They would like to use
it if it can be used for depth or subgrade support information. Group 2 – They felt the work should “give them what they need’ and make the technology work. Group 3 – The group places greatest emphasis on detection of deterioration in the form of
delamination. Group 4 – The respondent indicated that the most important aspect is determining first whether
there exists a feasible application of GPR and then who should perform the work. Group 5 – The priorities should be pavement thickness and reinforcement location. Group 6 – See above. Group 7 – Get the technology up and running so that it can be used in deck condition surveys
with PONTIS. 2.3 What type(s) of structures should be given the highest priorities? Group 1 – Both pavements and bridges should be given priority. Group 2 – This group felt that pavements should have the highest priority. The greatest
pavement need is for layer thicknesses for asphalt. Group 3 – Bridges. Group 4 – Pavement Group 5 – Pavements and bridges. Group 6 – Pavement but everyone would benefit. Group 7 – Bridges.
SD2005-05 AUGUST 31, 2006 FEASIBILITY OF USING GROUND PENETRATING RADAR PAGE A-5
2.4 What types of investigations should be given the highest priority? Group 1 – Same response as 2.3. Group 2 – The highest priority should be pavement thicknesses. Group 3 – Bridge deterioration. Group 4 – Pavement thickness and subgrade condition. Group 5 – See above. Group 6 – Implementation of GPR with well defined resource requirements. Group 7 – Bridge deck surveys. 2.5 What kind of evidence would convince you that GPR "works"? Group 1 – They would like to have “hands on” results in the form of a verifiable demonstration,
including examining the data. Group 2 – The GPR values should be checked against core results. Group 3 – Correlation with actual values determined by destructive or other means. Accuracy is
important – the higher the better. Group 4 – Comparison to known ground truth values. Group 5 – See it first hand and compare the results to known values. Group 6 – Comparison with known values. Awareness that airports have tough specifications. Group 7 – Comparison to known values. 2.6 What type of information would you like the GPR survey to produce? 2.6.1 Most desirable outcome Group 1 – For pavements, they would like in-place thickness and subgrade information. For
bridges, the location of reinforcing steel is needed. Group 2 – Pavement thickness for representative sections Group 3 – Rebar depth and deterioration. Also, detection and measurement of voids under approach slabs and footings.
SD2005-05 AUGUST 31, 2006 FEASIBILITY OF USING GROUND PENETRATING RADAR PAGE A-6
Group 4 – Assess subgrade conditions and quantify amount of salvage material. Group 5 – The most desirable result would be to locate reinforcing steel to within one sixteenth
of an inch. The same need exists for pavement thickness – to within 0.01 inch. Group 6 – Pavement thickness and cross section. Group 7 – Layout of bridge deck with plots of steel depth and delamination or bad concrete. 2.6.2 Minimum acceptable outcome Group 1 – Minimum acceptable result would be verification that GPR is usable for a project. Group 2 – Thicknesses at the project level. Group 3 – The technology must be able to detect deterioration at some level. Group 4 – Determine the quantity of salvage material. Group 5 – The minimum acceptable outcome would be to measure reinforcing steel location to
with one eighth of an inch and pavement thickness to within one tenth of an inch. They would also like to detect air voids as small as a walnut.
Group 6 – Determine if GPR is feasible. Group 7 – Report showing bad concrete. 2.7 What are your current alternatives for gathering this information? Group 1 – For pavements, the Department uses destructive testing (coring or drilling) for
pavements and the Dynamic Cone Penetrometer (DCP) for subgrade strength. Group 2 – The data are currently obtained from cores and original plans. The cores are not
requested – they use whatever core data are available. Group 3 – Methods include chain drag, observation (inspection), and cores. Group 4 – Salvage material quantity is determined by taking one six inch diameter core every
one to four miles and measuring the thickness. Subgrade condition is determined by taking a push core sample (slit spoon). DCP is also used.
Group 5 – Pavement thickness is obtained by coring. Rebar location is measured using a cover
meter. Delamination is detected using a dragged chain. Group 6 – Information are obtained from sets of plans. Coring is rarely done.
SD2005-05 AUGUST 31, 2006 FEASIBILITY OF USING GROUND PENETRATING RADAR PAGE A-7
Group 7 – Chain drag and a cover meter (pachometer). 2.8 How would you use the information that you would gain from the GPR survey? Group 1 – Answered above. Group 2 – The survey results would be used to provide more accurate information for pavement
management. Group 3 – Measures of deterioration would be used to develop scopes of work. They would also
be used to monitor change of condition with time. It would be desirable to plot bridge deterioration automatically and calculate quantities.
Group 4 – The information would be used to estimate salvage quantities of in place pavements. It
would also be used to evaluate the types of mitigation that need to be done to the subgrade prior to resurfacing.
Group 5 – The information might be used to: change design specifications; cover more
infrastructure in a more thorough manner; be more specific on rehabilitation; find thin sections and wet base; and assist in project acceptance.
Group 6 – Implement a pavement condition index (PCI) for each airport. Group 7 – To rate the bridge decks.
Attitudes About Conducting GPR Work 3.1 How do you feel about SDDOT acquiring and operating GPR equipment? Group 1 – It would be a good thing if it works. Group 2 – The availability of this technology will be good if it works. It will be necessary to
ensure that there are qualified individuals available to operate it. It would have been better to do the current project before acquiring GPR equipment.
Group 3 – The group feels it is worth doing if it works. The activities should scheduled
cooperatively for pavements and bridges. Group 4 – The respondent believes that it is best to keep control over quality and cost in house as
much as possible. Group 5 – It would be a step in the right direction. They are both skeptical and hopeful.
SD2005-05 AUGUST 31, 2006 FEASIBILITY OF USING GROUND PENETRATING RADAR PAGE A-8
Group 6 – “If it works, let’s do it.” Group 7 – Good and optimistic. 3.2 How do you feel about SDDOT conducting GPR data analysis? Group 1 – They would support it if it works. Group 2 – If it works, it will be good. However, it is important to verify that it works. SDDOT is
fully capable to perform such an evaluation. Group 3 – It should be done in house in a cooperative fashion. Group 4 – If the GPR surveys are frequent enough and uncomplicated enough, they should be
done in house. If they are rare and/or difficult, they should be contracted out. Group 5 – They prefer that SDDOT staff perform this work. Group 6 – Must have dedicated staff with adequate training. The equipment needs to have
overview software. Group 7 – This would be preferable. 3.3 Has SDDOT hired consultants to do this type of work? Group 1 – No Group 2 – The group is not aware of any consultant work. Group 3 – Only for research. Group 4 – The respondent referenced a Hell’s Canyon job. Group 5 – Gulf Radar did a project on SD 12 that evaluated severe faulting and voids. It took a
month to interpret the data and the results were unusable. There have also been two research projects.
Group 6 – Don’t know. Group 7 – Research only – Gene was involved. 3.4 What are the tradeoffs between the work being done by the SDDOT versus by
consultants?
SD2005-05 AUGUST 31, 2006 FEASIBILITY OF USING GROUND PENETRATING RADAR PAGE A-9
Group 1 – They don’t know the answer. Group 2 – In house would be cheaper but it might be a problem providing the required labor. Group 3 – The factors include training and retaining of staff, costs, and dealing with the
Department’s restrictions on hiring people. This last consideration implies that existing staff must be used.
Group 4 – See above. Group 5 – Performance of the work by SDDOT staff is preferred due to greater availability,
timeliness, lower cost, and the development of in house experience and expertise. Group 6 – The FTE issue can be a problem. Group 7 – Prefer in house due to better access to staff. 3.5 If SDDOT were to implement a GPR pavement evaluation program, how
many lane miles of GPR pavement survey do you anticipate would be conducted each year?
Group 1 – Approximately 8,000 lane miles for network level. Group 2 – Approximately 8,000 lane miles. Group 3 – Don’t know. Group 4 – Every asphalt job. Group 5 – It depended on the outcome of this project. Applications could include use in
acceptance on construction jobs, providing better design information, and quick quality control at the startup of construction projects. Approximately 100 lane miles per year of construction projects could be surveyed.
Group 6 – Only those airports needing rehabilitation should be surveyed. There are fifteen of
these facilities. Group 7 – Don’t know. 3.6 If SDDOT were to implement a GPR bridge deck evaluation program, how
many decks surveys do you anticipate would be conducted each year? Group 1 – They don’t know. Group 2 – They don’t know.
SD2005-05 AUGUST 31, 2006 FEASIBILITY OF USING GROUND PENETRATING RADAR PAGE A-10
Group 3 – 650 Group 4 – Doesn’t know. Group 5 – Don’t know. Group 6 – Don’t know. Group 7 – Rapid City region would have 60 to 130 per year depending on the survey cycle. 3.7 What level of personnel commitment do you think the SDDOT would be able to
make to support a GPR program? (e.g. 1 full time equivalent, 0.5 full time equivalent, etc.)
Group 1 – They don’t know. Group 2 – They don’t know. Group 3 – One unit for bridges and one unit for pavements. Group 4 – Two fte’s. Group 5 – Depends on usage, but approximately two fte’s. Group 6 – Three fte’s. Group 7 – This is a Central Office issue but the region would have to provide traffic control and
logistics per SDDOT traffic control standards.
Current SDDOT Procedures and Operations Define and summarize current SDDOT procedures and operations that could be enhanced using GPR technology. Group 1 – GPR could: provide the input required for backcalculation; replace destructive testing;
and provide more accurate data for history files. Group 2 – Backcalculation is performed using the ELMOD 5 software package from Dynatest.
The GPR results should be compatible with this software. Falling weight deflectometer (FWD) and pavement profile data are maintained as separate files on the mainframe. The GPR should be treated in a similar fashion. At a network level, the database should be modified to include GPR results. This will require software to prepare the GPR data and populate the mainframe database.
SD2005-05 AUGUST 31, 2006 FEASIBILITY OF USING GROUND PENETRATING RADAR PAGE A-11
Group 3 – Bridge inspection and evaluation. Group 4 – Estimating quantities of material and reconnaissance of bridge decks. Group 5 – See above, plus forensic evaluation. Group 6 – PCI for airports, finding conduit, and detecting the water table. Group 7 – Bridge inspection and voids under approach slabs.
Potential Application Areas 4.1 Pavement surveys for layer thickness and base layer material properties Group 1 – The group agreed GPR could be used to determine layer thicknesses, base layer material properties, and subgrade material properties. Group 2 – This group supports this application. Group 4 – Yes Group 7 – Detection of approach slab voids and bridge inspection. 4.2 Bridge deck condition surveys for delamination and steel depth Group 3 – Bridge related areas would include: construction, rebar placement, alignment, and
location, subsurface investigation, detection of voids under approach slabs and footings, detection of honeycombing, and for box culverts.
Group 7 – In addition, detection of approach slab voids and tracking deterioration with time with
alkalid silica reactivity (ASR) above and beyond the chloride issue. 4.3 Construction quality control, steel depth and alignment and utility location 4.4 Geotechnical applications Group 4 – The respondent is skeptical about this application. Water table depth would be a good
capability.
SD2005-05 AUGUST 31, 2006 FEASIBILITY OF USING GROUND PENETRATING RADAR PAGE A-12
4.5 Other Group 4 – Air voids and densities. Group 6 – Air voids under pavement.
Candidate Demonstration Projects List candidate demonstration projects in South Dakota. Group 1 – Three possible locations were discussed. Group 2 – Projects mentioned were SD 248, SD 44 by Scenic, US 18 East of Winner, SD 262
from Alexandria to Bridgewater, and I-90 CRCP. Group 3 – Potential projects include: deck asphalt mat, bare deck, and rigid overlay with a
debond problem. One specific location was US 83 at Mission Antelope Creek. Group 4 – Potential projects include: identifying the depth of quartzite in the Sioux Falls area;
determining ground water level in the Aberdeen area; using both ground coupled and air coupled antennae over a fault zone on SD 34 and SD 14; evaluating an inverted crown problem (i.e., outside of roadway swelled) at Lee’s Corner on SD 34 (check moisture levels on inside and outside). Sioux Avenue in Pierre is another candidate.
Group 5 – SD 12 east of Aberdeen for dowel bar depth and alignment. Group 6 – Pierre Airport. Group 7 – Rubberized asphalt chip seal (RACS), epoxy chip seal, and concrete overlay.
SD2005-05 AUGUST 31, 2006 FEASIBILITY OF USING GROUND PENETRATING RADAR PAGE B-1
APPENDIX B
Results of Survey of Other State Agencies
1. What groups within your State have experience with Ground Penetrating Radar (GPR)? Alabama – ALDOT California – Office of Geotechnical Services, Geophysics and Geology Branch California (Archaeology) – Currently Caltrans uses multiple geophysical technologies during
Identification (Phase I), Eligibility (Phase II) and Data Recovery (Phase III). All of which are parts of the Section 106 process. Technologies include: Ground Penetrating Radar, Resistivity, Magnetometry, Conductivity, and others.
Colorado – Materials, Design, and Maintenance, but very limited. Florida – The Nondestructive Testing Unit at the State Materials Office has the mostly in-
house experience using ground penetrating radar technology. SMO provides services to the Districts when applicable. However, some districts are consulting out more for GPR technology services.
Georgia – It is used by the Geotechnical Bureau for special investigations. GPR has also been used by Pavement Management for research and evaluation purposes on two projects.
Illinois – District Offices Kansas – Primarily the Bureau of Materials and Research, Pavement, Soils, and Geology. Missouri – At Missouri DOT our Organizational Results Division (formerly RDT),
Construction and Materials Division – Soil & Geology Section and Pavement Sections have used GPR. Our Archeology Section in Design has either purchased or was discussing purchasing GPR equipment for archeological investigations.
Nevada – NDOT’s Structural Design and Materials divisions each have some experience with GPR.
North Carolina – Pavement Management Unit and Geotechnical Engineering Unit. Pavement Management no longer uses or owns a GPR unit.
Oklahoma – Pavement Management and Research Texas – Construction Division (Materials and Pavements Section), Districts, Texas
Transportation Institute (TTI) in College Station. 2. How long has GPR been used by your agency?
Alabama – 2 Years California – 9 years California (Archaeology) – It may have been in use before I came on, but certainly for the last
seven years. Colorado – We have been in the mode of demonstrations or trying it occasionally for specific
applications for years. The usefulness of the results has never been sufficient to move us beyond this mode.
SD2005-05 AUGUST 31, 2006 FEASIBILITY OF USING GROUND PENETRATING RADAR PAGE B-2
Florida – Ground coupled – 18 years Air launched – 9 years Georgia – It has been used for Geotechnical applications over a 10-year period and for the
research and evaluation purposes mentioned above over a two-year period. Illinois – Over 10 years Kansas – Decades. Missouri – Research first used GPR and Infrared Thermography to estimate concrete bridge
deck deterioration starting in 1992. Our Soils & Geology section have had several projects using GPR for different subsurface investigations since 1994 staring with investigation of a sinkhole discovered under I-44 in southwest Missouri.
Nevada – Other than demonstration/trial applications, NDOT has not utilized GPR. North Carolina – Almost 15 years Oklahoma – On two different occasions: Once many years ago as part of a research project
and then again last year for a network-level pavement management study of pavement layers in conjunction with FWD testing. Texas – In various forms since at least 1987, if not earlier.
3. Do you perform GPR work using States forces or through a contractor(s).
Alabama – State Force California – In-house and contractor. California (Archaeology) – We have used in-house staff, almost exclusively for cultural
studies, but have used GPR for road work (locating subsurface cracks in pavement, etc.). Colorado – Contractor. Florida – Most forensic surveys are conducted in-house, but some district agencies consult
GPR services mostly for forensic investigations and/or thickness surveys. Georgia – The work has thus far been done by consultants. Illinois – Consultant. Kansas – Contractors. Missouri – We have contracted through private vendors or the University of Missouri-Rolla
(UMR) Geophysics Department. Nevada – NDOT used a contractor for the demonstration/trial applications, and would
probably do so for any production applications were we to decide to make use of this technology.
North Carolina – Using state forces. Oklahoma – Contractor Texas – We mainly use state forces to do the GPR work. Our Aviation division has tried to
use contract forces to test airport runways but usually has gone back to state forces at lower cost.
SD2005-05 AUGUST 31, 2006 FEASIBILITY OF USING GROUND PENETRATING RADAR PAGE B-3
4. For what applications has GPR been used by your agency? The list below represents possible GPR applications.
Pavement surveys for layer thickness and base layer material properties Pavement forensic studies Detection of voids under PCC pavement Bridge deck condition surveys for delamination and steel depth Construction quality control, steel depth and alignment and utility location Geotechnical applications Other
The responses from the states below refer to the lettered items of this list. Alabama –
Detection of voids under PCC pavement Bridge deck condition surveys for delamination and steel depth Construction quality control, steel depth and alignment and utility location
California – All but d. Colorado – Based on the response I got (see attached e-mails) CDOT used GPR three
times in recent years In one of those applications GPR did not provide anything useful, one application had mixed value, and one application provided valuable information. I also attempted to answer your questionnaire, but because CDOT does not have any systematic usage of GPR, I don't think the answers are very meaningful.
Florida – All [of the following] and also forensic survey for law enforcement. Georgia – a, b, c, f Illinois – d [below] Kansas – Yes to all Missouri – We have used GPR for all of the [applications below] with different amounts
of success. Nevada – Not routinely used North Carolina – Mostly for layer thickness (Pavement management). Geotechnical has
used a surface contact unit to locate underground tanks and subsurface anomalies. Some work on forensic studies, but since we usually need cores to calibrate, we end up using cores as primary source of layer thickness information. We were not successful in using to detect voids unless the voids were filled with water. No where near reliable enough for construction quality control. Can be used for utility location. We use an MIT scan to locate dowel bars.
Oklahoma – a and b below. Texas – a, b, c, e, f, and g below. The Other category includes location of underground
storage tanks (leaking or otherwise), location of unexpected sub-surface water sources and natural gas lines that were contributing to pavement failure, and identification of grave site.
SD2005-05 AUGUST 31, 2006 FEASIBILITY OF USING GROUND PENETRATING RADAR PAGE B-4
5. Have these uses been successful? Please explain. Alabama – Yes, optimum method for determining problems that otherwise are time
consuming and costly California – Yes for the majority of surveys. We can provide specific examples on request. California (Archaeology) – For the delineation of cultural deposits, they have been very
useful, when combined. GPR is still too costly to use as a first line tool to locate features on a site that may be 1000 sq. meters. But is very useful as a tool that confirms data found by magnetometer or resistivity. In other words, smaller scale intrasite analyses.
Colorado – Only limited success. Florida – Most GPR applications do provide useful information to the customer. Primarily we
get called in for sinkhole investigations, bridge approach voids, determination of underlying structure analysis, or thickness surveys. There are some places where GPR has problems because of electromagnetic interference.
Georgia – See #6 below. Illinois – After comparisons with actual results, the location do not match exactly. But, the
quantity of Delaminated areas has matched up with actually patching quantities with a reasonable level.
Kansas – To a limited extent depending application. Works well to find steel in concrete. Not very effective in finding voids under or in concrete. Can’t detect stripping in asphalt.
Missouri – The best uses have been geotechnical applications. We have had mixed success on bridge decks and pavement condition surveys. We have used GPR with good success for QC of testing placement of dowels in jointed PCC pavement.
Nevada – N/A Oklahoma – Yes. For the most part, the GPR was able to distinguish pavement layers
although there were some limitations on very thick pavements or certain composite structures. In the research application, the GPR was used to detect a void beneath the pavement.
North Carolina – See above. Texas – Yes, in most cases we have been able to do what we wanted to do. I guess it really
depends on the definition of “successful.” 6. Has GPR been effective in the application(s) for which it has been used by your
agency? Alabama – Yes California – See 5 above. Colorado – GPR is effective in locating and mapping large underground voids, but CDOT has
had only a few situations where it is needed. Florida – District agencies have found the use of GPR technology to be a great benefit to the
Department where Nondestructive testing was needed.
SD2005-05 AUGUST 31, 2006 FEASIBILITY OF USING GROUND PENETRATING RADAR PAGE B-5
Georgia – GPR has been effective in both the geotechnical and research applications. The research results were particularly helpful in determining appropriate maintenance of pavements showing signs of distress.
Illinois – Yes Kansas – Very limited, see above. Missouri – As stated above on some applications we have had good success, especially
geotechnical investigation looking for sinkholes and other karst formations, finding old lead mine tailings piles and sometimes buried objects on the right of way.
Nevada – N/A North Carolina – More successful for Geotechnical unit than for PMU. We have found that
the equipment and the data analysis require extreme care and very dedicated personnel. We were never able to turn over the data interpretation to a technician and felt it required too much engineering time.
Oklahoma – Yes Texas – Occasionally we have problems getting good measurements, but about 90 percent of
the time it works okay. 7. What are the advantages and disadvantages of the GPR equipment that your
agency has used versus other methods for obtaining the same data? What other methods have you used? Alabama – Fast, scan large areas in short time, accurate, user friendly. Disadvantage: set up
time California – Advantages=speed of acquisition, low cost for data acquisition, high sample
density. Disadvantages=need for experienced operators/interpreters for optimal results, complexity of equipment, limited depth of investigation.
California (Archaeology) – GPR is very effective in giving greater detail to cultural features/deposits found using magnetometer and resistivity. It is limited by clayey soils and high moisture content. The nature of the EM signal used creates large 3 dimensional data sets, which is both a plus and a minus. A plus when used to proof signatures by other geophysical instrumentation, a minus in post processing and the speed at which it collects data. We routinely use a Geometrics G858/G cesium vapor gradiometer on all cultural surveys, combined with a Geometrics Ohm Mapper (resistivity). Both of these collect data continuously, are mobile, and do not require excessive amounts of data processing. Data generated from these lead to more focused uses of GPR.
Colorado – Faster, less costly, and non-destructive compared to coring or bore holes. Florida – We use GPR to isolate areas of interest then we ground truth. This cuts down on
destructive testing. Follow up equipment as a supplement or ground truth would be the Automated Dynamic Cone Penetrometer (ADCP) and the FWD.
Georgia – For geotechnical applications, GPR has the advantages of being non-destructive and less expensive than seismic resistivity, electrical resistivity, and other testing techniques. In pavement evaluations, GPR has the potential of reducing the physical coring that is needed and in detecting moisture prone areas.
SD2005-05 AUGUST 31, 2006 FEASIBILITY OF USING GROUND PENETRATING RADAR PAGE B-6
Illinois – GPR provides fast non-destructive results for Delamination (patching quantities) on bridge deck with a bituminous waterproofing membrane. Other methods used: Hand sounding and thermogaphy.
Missouri – The present radar antennas do not have good enough accuracy at the shallow depths needed for bridge deck and pavement applications and to be able to collect data at highway speeds so traffic doesn’t have to be controlled. Our Archeology Section purchased a 400MHz antenna in June 2005. They foresee great savings in locating urban archeology on department land. Old house foundations, wells, cisterns, etc. underneath asphalt or concrete pavements where they used to have excavate blind. Also when acquiring land near old graveyards to locate remains that may not be marked or are outside cemetery boundaries. Also plans for locating hazardous wastes and utilities.
Nevada – N/A North Carolina – We use cores, DCPs and very occasionally, trenches. Oklahoma – Faster and cheaper than extensive coring. Other methods – Coring. Texas – Advantages are ability to test at highway speed with little, if any, traffic control; also
non-destructive testing of sub-surface conditions, layer thicknesses (sometimes), and moisture content. No real disadvantages except possibly for cost and for lack of a reliable automated method of interpreting the data. Other methods are coring, trenching, and Dynamic Cone Penetrometer.
8. What are the cost related characteristics of the GPR equipment that your agency
uses? Alabama –
Initial cost Staffing required Complexity of the equipment & data acquisition system – software requirements & support
California – Question is unclear, can you elaborate? Colorado – We do not own equipment, always contract work out. Georgia – All of the factors listed below. Note: Cost has not been an issue for the
geotechnical applications. For the research applications, all of the above criteria were considered as a whole, rather than discretely.
Kansas – N/A, performed by contractor Missouri – MoDOT doesn’t have their own equipment. We contract out at whatever the going
rate is per day. The University of MO-Rolla use to charge us $500 per day for testing and interpretation but I am sure they have upped their price. Our archeology section was recently quoted as much as $7,500 /day.
Nevada – N/A Oklahoma – We’ve never bought the equipment and have no plans to at this time.
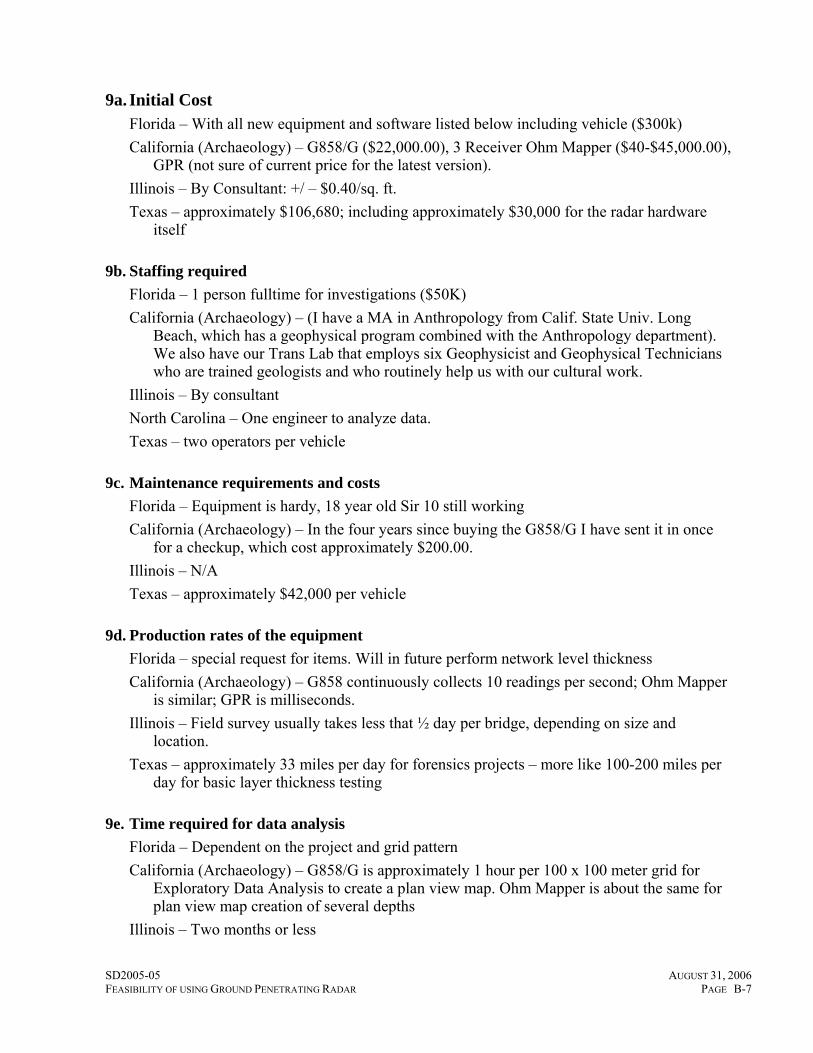
SD2005-05 AUGUST 31, 2006 FEASIBILITY OF USING GROUND PENETRATING RADAR PAGE B-7
9a. Initial Cost Florida – With all new equipment and software listed below including vehicle ($300k) California (Archaeology) – G858/G ($22,000.00), 3 Receiver Ohm Mapper ($40-$45,000.00),
GPR (not sure of current price for the latest version). Illinois – By Consultant: +/ – $0.40/sq. ft. Texas – approximately $106,680; including approximately $30,000 for the radar hardware
itself
9b. Staffing required Florida – 1 person fulltime for investigations ($50K) California (Archaeology) – (I have a MA in Anthropology from Calif. State Univ. Long
Beach, which has a geophysical program combined with the Anthropology department). We also have our Trans Lab that employs six Geophysicist and Geophysical Technicians who are trained geologists and who routinely help us with our cultural work.
Illinois – By consultant North Carolina – One engineer to analyze data. Texas – two operators per vehicle
9c. Maintenance requirements and costs Florida – Equipment is hardy, 18 year old Sir 10 still working California (Archaeology) – In the four years since buying the G858/G I have sent it in once
for a checkup, which cost approximately $200.00. Illinois – N/A Texas – approximately $42,000 per vehicle
9d. Production rates of the equipment Florida – special request for items. Will in future perform network level thickness California (Archaeology) – G858 continuously collects 10 readings per second; Ohm Mapper
is similar; GPR is milliseconds. Illinois – Field survey usually takes less that ½ day per bridge, depending on size and
location. Texas – approximately 33 miles per day for forensics projects – more like 100-200 miles per
day for basic layer thickness testing
9e. Time required for data analysis Florida – Dependent on the project and grid pattern California (Archaeology) – G858/G is approximately 1 hour per 100 x 100 meter grid for
Exploratory Data Analysis to create a plan view map. Ohm Mapper is about the same for plan view map creation of several depths
Illinois – Two months or less
SD2005-05 AUGUST 31, 2006 FEASIBILITY OF USING GROUND PENETRATING RADAR PAGE B-8
Texas – approximately 10 minutes per mile, but this is a real guess because it really depends on the complexity of the underlying structure (number of layers, presence of clear interfaces, other sub-surface anomalies).
9f. Complexity of the equipment and data acquisition system – software requirements and
support Florida – Use vendor software for analysis, providers are slow to modify to customer needs.
Alternate vendors provide software commercially. California (Archaeology) – Equipment is not overly onerous to learn, but you would not want
just anyone doing this work without oversight. I would not think of doing a geotech study without having one of our Trans lab geophysicists involved. Not because I could not conduct the survey using any equipment, but because of legal issues regarding resources and the peculiarities of each disciplines use of the technology. As an archaeologist I am not looking for large buried tanks, faults, or avalanche locations. Nor would I want one of the Trans lab folks taking a cultural job, for the same reason, only in reverse. In other words you cannot train tech monkeys and let them lose on any resource. Software, the same issue. Anyone can learn, but without in-depth knowledge on the particular EM data being used and acquired and understanding of what can or cannot be done during EDA you would have wasted your money.
Illinois – By consultant Texas – We have not found GPR to be any more complex than any of our other equipment
(ride, rut, skid, texture, FWD, seismic), but that’s partially because some of them are fairly complex. Software requirement and support questions should be directed to TTI because they wrote the data analysis software that we are using.
9g. Calibration requirements Florida – For the air launched system, TTI performance spec provides a lot of information to
monitor to ensure good data. California (Archaeology) – Same as above. Illinois – N/A
North Carolina – Calibration is relatively easy and is conducted daily as part of the set up. Texas – We do annual calibration of every vehicle at the TTI test site.
9h. What procedures/protocols do you follow in using GPR equipment? Alabama – Save data for further analysis and extract core for verification. California – Question too open-ended for brief response California (Archaeology) – We typically use the same grid used during G858/G and Ohm
Mapper survey. Whereas we may have collected G858/G at .25cm transect interval and 50 cm marks or the Ohm Mapper at a 2 mile per hour rate and transects spaced 1-3 meters apart; GPR would be done at 50 cm transect interval and one meter per second pace.
Colorado – N/A Florida – Generally metal plate files and signal drift are monitored for the air launched
antennas. DMI are referenced calibrated.
SD2005-05 AUGUST 31, 2006 FEASIBILITY OF USING GROUND PENETRATING RADAR PAGE B-9
Georgia – Handled by consultants. Illinois – N/A Kansas – N/A, performed by contractor Missouri – It depends what the project is how we set up a contract. Nevada – N/A North Carolina – N/A Oklahoma – N/A Texas – Nothing specific, other than to test wherever we are asked to test.
10. What procedures/protocols do you follow in interpreting GPR data?
Alabama – Use of Excel spreadsheets, Radan 6.5, and Graphic representation of data. California – See 9 above California (Archaeology) – Software packages are pretty standard in what can and cannot be
done as far as filtering data. Colorado – N.A. Florida – For ground coupled forensic studies, include having a detailed log book with a good
description of what scans per direction are taken. Also digital images also provide useful tools for analyzing discrepancies in the data. Generally 5 ft tick marks are included in the data and areas of interest are marked in the field. Sometimes, follow up investigations are conducted to ensure area of concern has been identified and corrected.
Georgia – Handled by consultants. Illinois – By Consultant. Kansas – N/A, performed by contractor Missouri – We expect the contractors to use AASHTO or ASTM specifications if available. Nevada – N/A North Carolina – N/A Oklahoma – N/A Texas – We run the radar traces through the TTI ColorMap program; no specific procedures
after that. 11.‘What test(s) has your agency performed concerning the repeatability and/or accuracy of
GPR equipment? What were the results? Alabama – Extensive core to verify accuracy of machine and use on structures with know
characteristics. California – Ground-truthing by excavation or coring. GPR was typically well-correlated to
ground truth. California (Archaeology) – At least one grid, each survey, is done on a different day and from
a different corner of the grid. This data is then overlaid to look for dissimilarity. Colorado – none
SD2005-05 AUGUST 31, 2006 FEASIBILITY OF USING GROUND PENETRATING RADAR PAGE B-10
Florida – Thickness studies for repeatability have been conducted. GPR thickness is repeatable assuming the vehicle tests in similar wheel path and there is no signal drift. Accuracy with the pulse radar 1.0 GHz antenna provided relative accuracy when compared to core data. However, some pavements made it difficult to discern the interface layer between base and asphalt such as an ARMI layer.
Georgia – N/A Illinois – Test structures are included in the bridges chosen. Results have been mixed, usually
repeatable to within tolerances used for establishing patch quantities. Kansas – Performed coring operations. Results showed that GPR was not very reliable for
detecting voids, under or within pavements. Needed to use thermography in conjunction with GPR to detect delamination in bridges.
Missouri – Have participated in FHWA projects with varying degrees of accuracy on bridge deck investigations. Can get good accurate surveys but not when acquiring at high speeds.
Nevada – N/A North Carolina – N/A Oklahoma – N/A Texas – We run each vehicle through the TTI test track each year to check estimated surface
and base thicknesses (which are known in advance). Accuracy is also checked by placing antenna over a “stack” of metal plates and Styrofoam (simulates layer thickness and well-defined interfaces). Precision for thickness is approximately ± 0.1 inches for measurements within the top 16 inches or so.
12. Have you used GPR for construction project quality control? How?
Alabama – Yes, Verification of steel reinforcement location California – Yes, for confirmation of rebar placement in concrete. California (Archaeology) – NO Colorado – no Florida – Not really, we have done feasibility studies with consultants, to see if they can
produce the product they claim their equipment and programs can do on a particular project. Georgia – No Illinois – No. Kansas – Yes, detecting presence and position of steel. Missouri – Only for measuring depth of dowel bar placement in jointed PCCP pavement. Nevada – N/A Oklahoma – No Texas – Our Odessa district began a study in February 2005 to use GPR for quality control of top layer thickness for hot-mix overlay projects, but the study is still underway.
13. What types/brands of GPR equipment have been used by your agency?
SD2005-05 AUGUST 31, 2006 FEASIBILITY OF USING GROUND PENETRATING RADAR PAGE B-11
Below are listed various types/manufacturers of GPR equipment used by the states. Alabama – GSSI California – Sensors and Software. California (Archaeology) – Rent GSSI and own Sensors and Software Colorado – whatever the contractor has. Florida – GSSI, Pulse Radar Georgia – GSSI Model 4108 air-coupled Sensors and Software Noggin 250 – more applicable to shallow conditions Illinois – Penetradar Kansas – Infrasense. Missouri – Have used GSSI, Penetradar, Pulse Radar, and HERMES II Nevada – N/A North Carolina – N/A Oklahoma – N/A Texas – Penetradar, Pulse Radar, and Wavebounce
14. What properties has your agency measured using GPR?
Alabama – Dimensions of concrete, location of rebar, depth of rebar, and location of voids or delamination on bridge decks
California – Material velocity and depth of burial California (Archaeology) – Stated above Colorado – Voids Florida – Primarily use ground coupled antennas for forensic sink hole locating and air
launched for asphalt thickness surveys Georgia – N/A Kansas – Location of steel, voids in concrete and asphalt, stripping in asphalt, delamination in
bridge decks, and moisture in subgrade soils. Missouri – Layer thicknesses, voids in and under pavements and base rock. Underground
voids and differences in subgrade materials. Detecting steel rebar and dowel bar cover. Nevada – Trials were for sub-pavement voids for Materials Division, and delaminations and
rebar depths for Structural Design Division. North Carolina – N/A Oklahoma – Pavement layer thicknesses and voids beneath the pavement Texas – See above
SD2005-05 AUGUST 31, 2006 FEASIBILITY OF USING GROUND PENETRATING RADAR PAGE B-12
15. At what frequencies do your GPR antennae operate? Alabama – 900 Megahertz and 1.5 Gigahertz California – Antennae on-hand span 50 MHz to 1.2 GHz California (Archaeology) – 900 MHz Colorado – depends on application. Florida – 1.0 Gigahertz (Pulse Radar)
1.0 Gigahertz (GSSI) 1.5 Gigahertz (GSSI) 2.0 Gigahertz (GSSI) new system purchased, not delivered yet 900 Megahertz (GSSI) 500 Megahertz (GSSI) 400 Megahertz (GSSI) 100 Megahertz (GSSI) 80 Megahertz (GSSI)
Georgia – GSSI 1.0 Gigahertz 250 MHz for Sensors and Software Noggin 250 Kansas – Not sure. Missouri – Our contractors have operated air launched and ground coupled antennas at
least a. & c. [below]. Nevada – Don’t recall North Carolina – N/A Oklahoma – N/A Texas – One Gigahertz
16. What software does your agency use for interpreting GPR data?
Alabama – Excel, Radan 6.5 California – All Sensors and Software products (EKKO View Deluxe, EKKO Mapper,
Transform) California (Archaeology) – Sensors and Software Proprietary Package Colorado – none Florida –
1. Terra from Pulse Radar, for thickness surveys; currently not in use from downed antenna 2. Radan from GSSI from the ground coupled system 3. Road Structure assessment from GSSI from the air launched system (new system, not received yet)
Georgia – N/A Kansas – None, contractor provided. Missouri – Our contractors have used different software, sometimes their own. UMR and
some of our private contractors have used GSSI software for most of their projects. Nevada – N/A
SD2005-05 AUGUST 31, 2006 FEASIBILITY OF USING GROUND PENETRATING RADAR PAGE B-13
North Carolina – N/A Oklahoma – N/A Texas – ColorMap software (developed by TTI).
Response from Connecticut: Hello, We have a limited experience with GPR Technology. We have used it a couple of
times with varying data. We used an outside contractor for both operations. I used it to investigate layer thicknesses and to determine how much granular material was between a large concrete conduit and the concrete pavement slab above it. I wish we had more to offer but we haven't used it enough to complete your survey effectively.
Lou Allegro.Pavement Management Unit Response from Delaware: I don’t have the expertise in GPR to answer most of your questions. We did use it for trying
to determine unknown foundations and for concrete deck condition under hot mix. In both cases the results were less than favorable. Sorry I couldn’t have helped more.
Dennis M. O'Shea, Asst. Director – Transportation Solutions Delaware Department of Transportation
SD2005-05 AUGUST 31, 2006 FEASIBILITY OF USING GROUND PENETRATING RADAR PAGE B-14
LIST OF RESPONDENTS Scott George, P. E. Pavement Management Engineer Alabama Department of Transportation Dr. T. Joe Holland Caltrans Research California Department of Transportation Richard G. Griffin, Jr. Research Coordination Engineer Colorado Department of Transportation Lou Allegro Pavement Management Unit Connecticut Department of Transportation Dennis M. O'Shea Asst. Director – Transportation Solutions Delaware Department of Transportation Charles Holzschuher, P.E. Friction and Nondestructive Testing State Materials Office Florida Department of Transportation David Jared, P.E. Georgia DOT Research Georgia Department of Transportation Gary Welton, Studies & Plans Engineer IDOT – Region 4/ District 7 Illinois Department of Transportation
Andrew Gisi Kansas Department of Transportation John "JD" Wenzlick Research & Development Engineer Missouri Department of Transportation Marc Grunert Assistant Chief Bridge Engineer Bridge Inventory/Inspection Section Nevada Department of Transportation Dr. Judith B. Corley-Lay State Pavement Management Engineer North Carolina Department of Transportation Ginger McGovern, P.E. Pavement Management Engineer Planning and Research Division Oklahoma Department of Transportation Bryan E. Stampley, P.E. Construction Division, Materials & Pavements Section Texas Department of Transportation
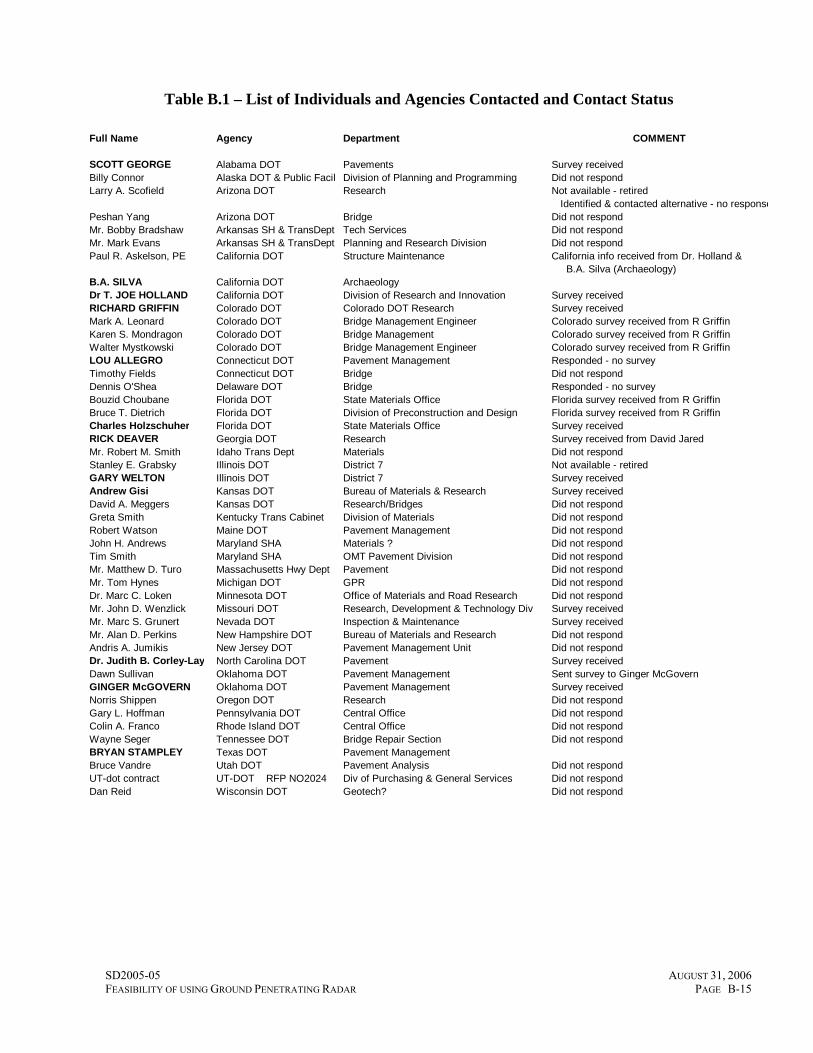
SD2005-05 AUGUST 31, 2006 FEASIBILITY OF USING GROUND PENETRATING RADAR PAGE B-15
Table B.1 – List of Individuals and Agencies Contacted and Contact Status
Full Name Agency Department COMMENT
SCOTT GEORGE Alabama DOT Pavements Survey receivedBilly Connor Alaska DOT & Public Facil Division of Planning and Programming Did not respondLarry A. Scofield Arizona DOT Research Not available - retired
Identified & contacted alternative - no responsePeshan Yang Arizona DOT Bridge Did not respondMr. Bobby Bradshaw Arkansas SH & TransDept Tech Services Did not respondMr. Mark Evans Arkansas SH & TransDept Planning and Research Division Did not respondPaul R. Askelson, PE California DOT Structure Maintenance California info received from Dr. Holland &
B.A. Silva (Archaeology)B.A. SILVA California DOT ArchaeologyDr T. JOE HOLLAND California DOT Division of Research and Innovation Survey receivedRICHARD GRIFFIN Colorado DOT Colorado DOT Research Survey receivedMark A. Leonard Colorado DOT Bridge Management Engineer Colorado survey received from R GriffinKaren S. Mondragon Colorado DOT Bridge Management Colorado survey received from R GriffinWalter Mystkowski Colorado DOT Bridge Management Engineer Colorado survey received from R GriffinLOU ALLEGRO Connecticut DOT Pavement Management Responded - no surveyTimothy Fields Connecticut DOT Bridge Did not respondDennis O'Shea Delaware DOT Bridge Responded - no surveyBouzid Choubane Florida DOT State Materials Office Florida survey received from R GriffinBruce T. Dietrich Florida DOT Division of Preconstruction and Design Florida survey received from R GriffinCharles Holzschuher Florida DOT State Materials Office Survey receivedRICK DEAVER Georgia DOT Research Survey received from David JaredMr. Robert M. Smith Idaho Trans Dept Materials Did not respondStanley E. Grabsky Illinois DOT District 7 Not available - retiredGARY WELTON Illinois DOT District 7 Survey receivedAndrew Gisi Kansas DOT Bureau of Materials & Research Survey receivedDavid A. Meggers Kansas DOT Research/Bridges Did not respondGreta Smith Kentucky Trans Cabinet Division of Materials Did not respondRobert Watson Maine DOT Pavement Management Did not respondJohn H. Andrews Maryland SHA Materials ? Did not respondTim Smith Maryland SHA OMT Pavement Division Did not respondMr. Matthew D. Turo Massachusetts Hwy Dept Pavement Did not respondMr. Tom Hynes Michigan DOT GPR Did not respondDr. Marc C. Loken Minnesota DOT Office of Materials and Road Research Did not respondMr. John D. Wenzlick Missouri DOT Research, Development & Technology Div Survey receivedMr. Marc S. Grunert Nevada DOT Inspection & Maintenance Survey receivedMr. Alan D. Perkins New Hampshire DOT Bureau of Materials and Research Did not respondAndris A. Jumikis New Jersey DOT Pavement Management Unit Did not respondDr. Judith B. Corley-Lay North Carolina DOT Pavement Survey receivedDawn Sullivan Oklahoma DOT Pavement Management Sent survey to Ginger McGovernGINGER McGOVERN Oklahoma DOT Pavement Management Survey receivedNorris Shippen Oregon DOT Research Did not respondGary L. Hoffman Pennsylvania DOT Central Office Did not respondColin A. Franco Rhode Island DOT Central Office Did not respondWayne Seger Tennessee DOT Bridge Repair Section Did not respondBRYAN STAMPLEY Texas DOT Pavement ManagementBruce Vandre Utah DOT Pavement Analysis Did not respondUT-dot contract UT-DOT RFP NO2024 Div of Purchasing & General Services Did not respondDan Reid Wisconsin DOT Geotech? Did not respond

SD2005-05 AUGUST 31, 2006 FEASIBILITY OF USING GROUND PENETRATING RADAR PAGE B-16
SD2005-05 AUGUST 31, 2006 FEASIBILITY OF USING GROUND PENETRATING RADAR PAGE C-1
APPENDIX C
Principles of GPR for Bridge Deck and Pavement Evaluation
Ground penetrating radar operates by transmitting short pulses of electromagnetic energy into the pavement using an antenna attached to a survey vehicle. These pulses are reflected back to the antenna with an arrival time and amplitude that is related to the location and nature of dielectric discontinuities in the material (air/asphalt or asphalt/concrete, reinforcing steel, etc). The reflected energy is captured and may be displayed on an oscilloscope to form a series of pulses that are referred to as the radar waveform. The waveform contains a record of the properties and thicknesses of the layers within the deck (shown schematically in Figure C.1) or pavement (Figure C.2). Bridge Deck Evaluation Bridge deck deterioration can be inferred from changes in the dielectric properties and attenuation of the concrete (see Maser and Roddis, 1990; SHRP C-101). GPR was originally developed for overlaid decks, since access to the concrete surface via other traditional methods is limited. For overlaid concrete decks, the variation of the dielectric constant of the concrete is used to determine deterioration. Concrete with high moisture and chloride content, as associated with corrosion and freeze-thaw damage, will produce highly variable reflections at the overlay/concrete boundary. This reflection is related to the higher dielectric permittivity produced by the moisture and chloride. The attenuation (loss of signal strength) of the radar signal, as measured from the top rebar reflection and/or the bottom of the deck, is used as an additional measure of concrete deteriora-tion. Contaminated and damaged concrete will cause the GPR signal to dissipate and lose strength as it travels through the deck and reflects back from the rebar and the bottom. The calculation of attenuation, and the identification of potentially damaged concrete has been automated in the GPR data analysis software. Pavement Evaluation The ground penetrating radar pavement layer thickness analysis is carried out by computing the arrival times and amplitudes of the reflections from the different layers. The waveform contains a record of the properties and thickness of the layers within the pavement, as shown schematically in Figure C.2.
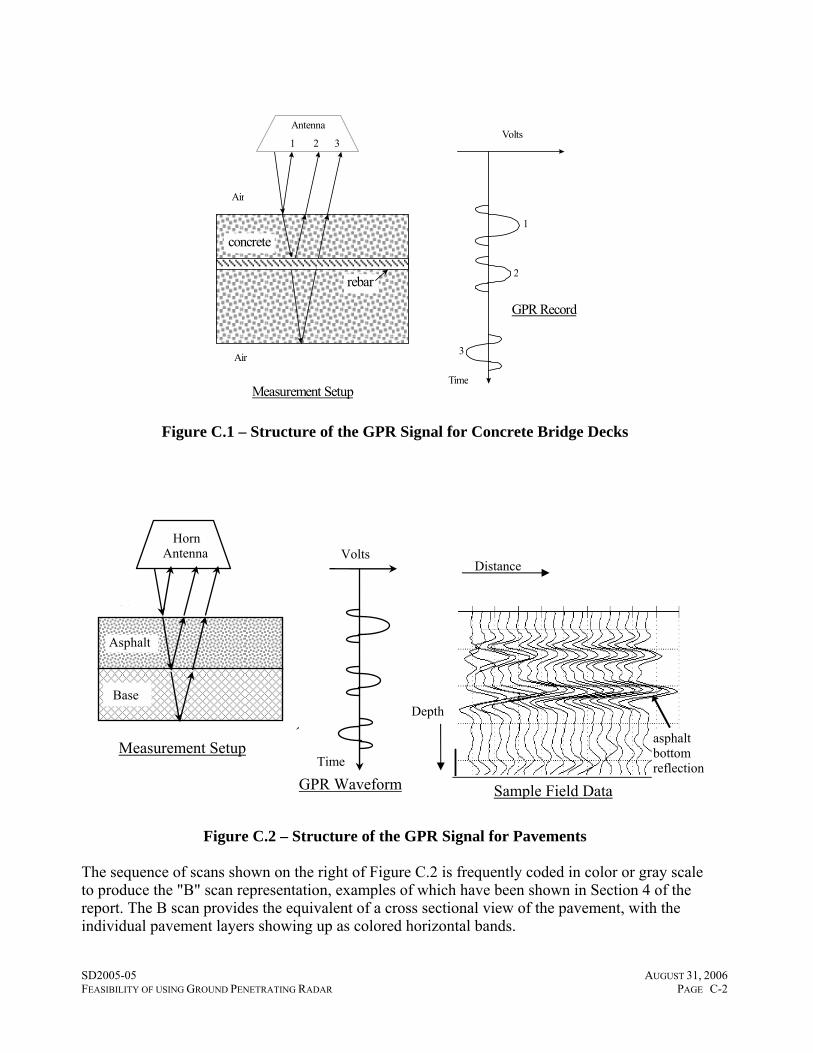
SD2005-05 AUGUST 31, 2006 FEASIBILITY OF USING GROUND PENETRATING RADAR PAGE C-2
Antenna 1 2 3
1
2
3
Air
concrete
Air
Volts
TimeMeasurement Setup
GPR Record rebar
Figure C.1 – Structure of the GPR Signal for Concrete Bridge Decks
Figure C.2 – Structure of the GPR Signal for Pavements The sequence of scans shown on the right of Figure C.2 is frequently coded in color or gray scale to produce the "B" scan representation, examples of which have been shown in Section 4 of the report. The B scan provides the equivalent of a cross sectional view of the pavement, with the individual pavement layers showing up as colored horizontal bands.
asphalt bottom reflection
GPR Waveform
Horn Antenna
1
3
Ai
Asphalt
Base
Volts
TimeMeasurement Setup
Sample Field Data
Distance
Depth
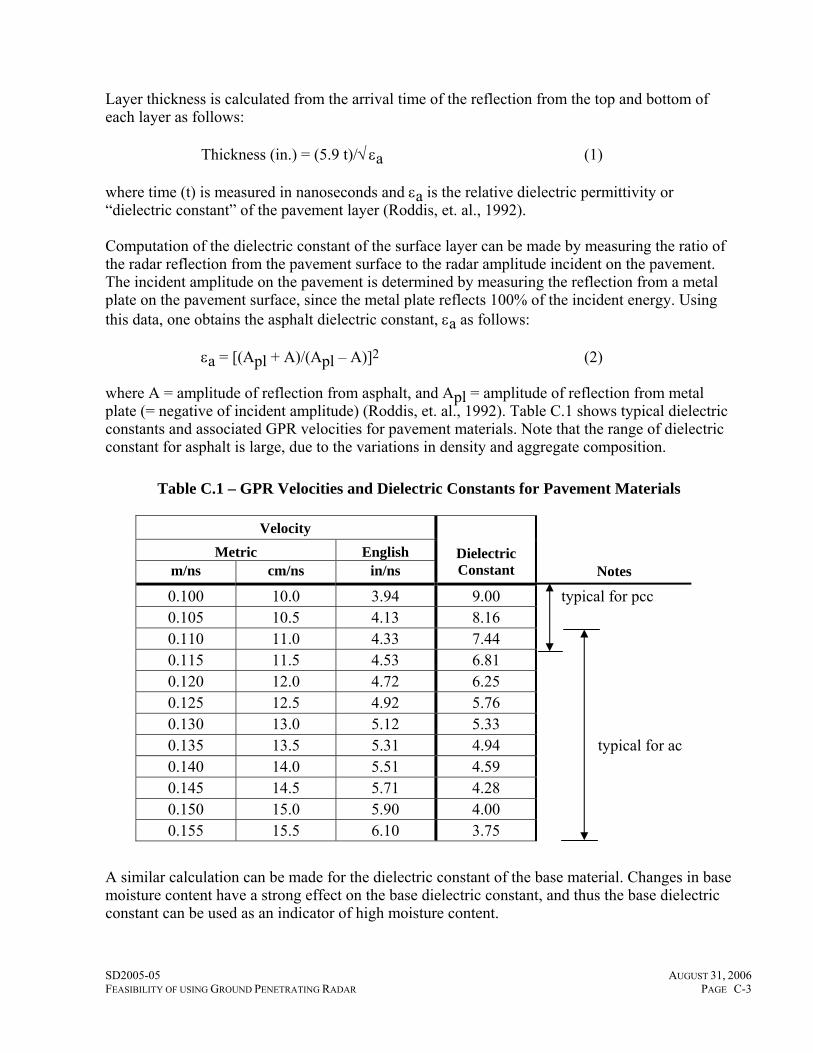
SD2005-05 AUGUST 31, 2006 FEASIBILITY OF USING GROUND PENETRATING RADAR PAGE C-3
Layer thickness is calculated from the arrival time of the reflection from the top and bottom of each layer as follows: Thickness (in.) = (5.9 t)/√ εa (1) where time (t) is measured in nanoseconds and εa is the relative dielectric permittivity or “dielectric constant” of the pavement layer (Roddis, et. al., 1992). Computation of the dielectric constant of the surface layer can be made by measuring the ratio of the radar reflection from the pavement surface to the radar amplitude incident on the pavement. The incident amplitude on the pavement is determined by measuring the reflection from a metal plate on the pavement surface, since the metal plate reflects 100% of the incident energy. Using this data, one obtains the asphalt dielectric constant, εa as follows: εa = [(Apl + A)/(Apl – A)]2 (2) where A = amplitude of reflection from asphalt, and Apl = amplitude of reflection from metal plate (= negative of incident amplitude) (Roddis, et. al., 1992). Table C.1 shows typical dielectric constants and associated GPR velocities for pavement materials. Note that the range of dielectric constant for asphalt is large, due to the variations in density and aggregate composition.
Table C.1 – GPR Velocities and Dielectric Constants for Pavement Materials
Velocity Metric English
m/ns cm/ns in/ns Dielectric Constant Notes
0.100 10.0 3.94 9.00 typical for pcc 0.105 10.5 4.13 8.16 0.110 11.0 4.33 7.44 0.115 11.5 4.53 6.81 0.120 12.0 4.72 6.25 0.125 12.5 4.92 5.76 0.130 13.0 5.12 5.33 0.135 13.5 5.31 4.94 typical for ac 0.140 14.0 5.51 4.59 0.145 14.5 5.71 4.28 0.150 15.0 5.90 4.00 0.155 15.5 6.10 3.75
A similar calculation can be made for the dielectric constant of the base material. Changes in base moisture content have a strong effect on the base dielectric constant, and thus the base dielectric constant can be used as an indicator of high moisture content.
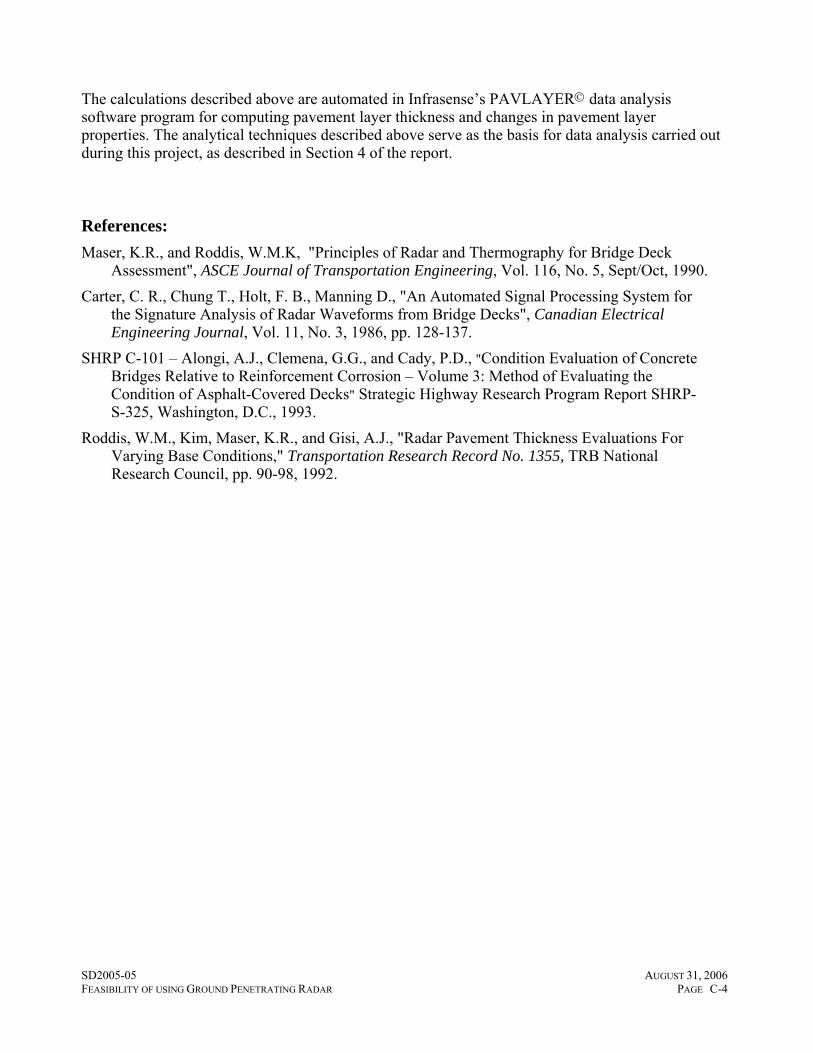
SD2005-05 AUGUST 31, 2006 FEASIBILITY OF USING GROUND PENETRATING RADAR PAGE C-4
The calculations described above are automated in Infrasense’s PAVLAYER© data analysis software program for computing pavement layer thickness and changes in pavement layer properties. The analytical techniques described above serve as the basis for data analysis carried out during this project, as described in Section 4 of the report.
References: Maser, K.R., and Roddis, W.M.K, "Principles of Radar and Thermography for Bridge Deck
Assessment", ASCE Journal of Transportation Engineering, Vol. 116, No. 5, Sept/Oct, 1990. Carter, C. R., Chung T., Holt, F. B., Manning D., "An Automated Signal Processing System for
the Signature Analysis of Radar Waveforms from Bridge Decks", Canadian Electrical Engineering Journal, Vol. 11, No. 3, 1986, pp. 128-137.
SHRP C-101 – Alongi, A.J., Clemena, G.G., and Cady, P.D., "Condition Evaluation of Concrete Bridges Relative to Reinforcement Corrosion – Volume 3: Method of Evaluating the Condition of Asphalt-Covered Decks" Strategic Highway Research Program Report SHRP-S-325, Washington, D.C., 1993.
Roddis, W.M., Kim, Maser, K.R., and Gisi, A.J., "Radar Pavement Thickness Evaluations For Varying Base Conditions," Transportation Research Record No. 1355, TRB National Research Council, pp. 90-98, 1992.
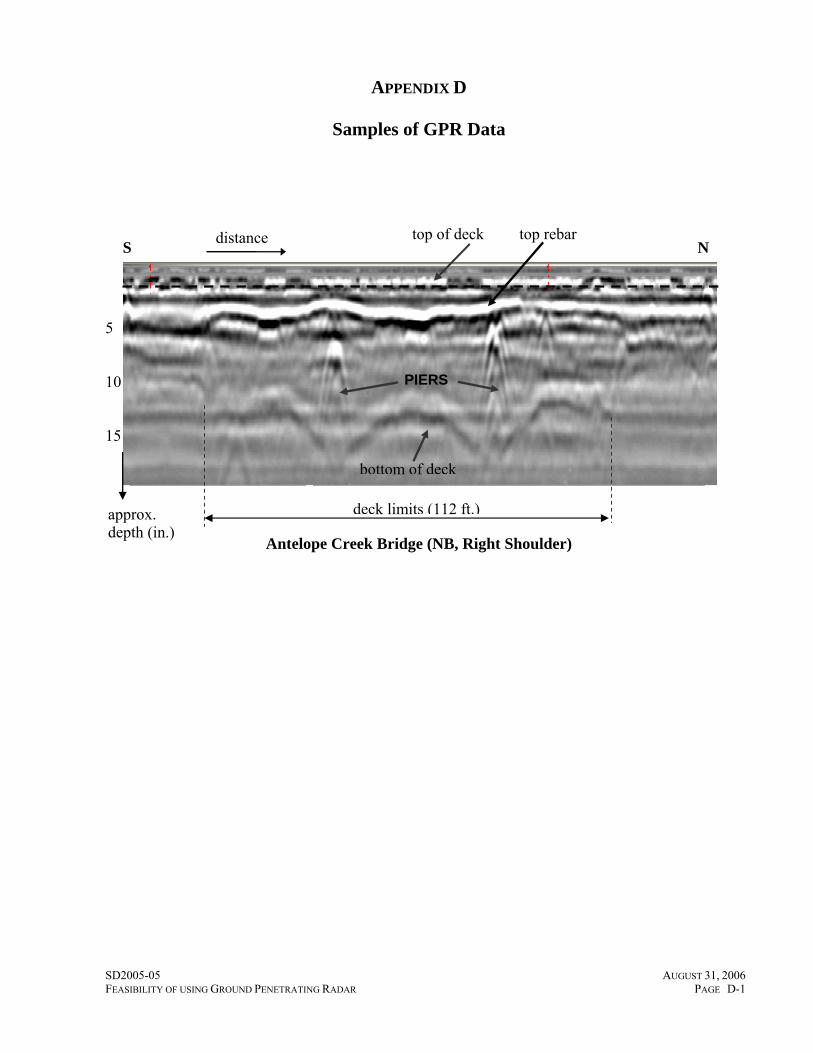
SD2005-05 AUGUST 31, 2006 FEASIBILITY OF USING GROUND PENETRATING RADAR PAGE D-1
APPENDIX D
Samples of GPR Data 5 10 15
Antelope Creek Bridge (NB, Right Shoulder)
top of deck distance top rebar
bottom of deck
PIERS
approx. depth (in.)
deck limits (112 ft.)
S N
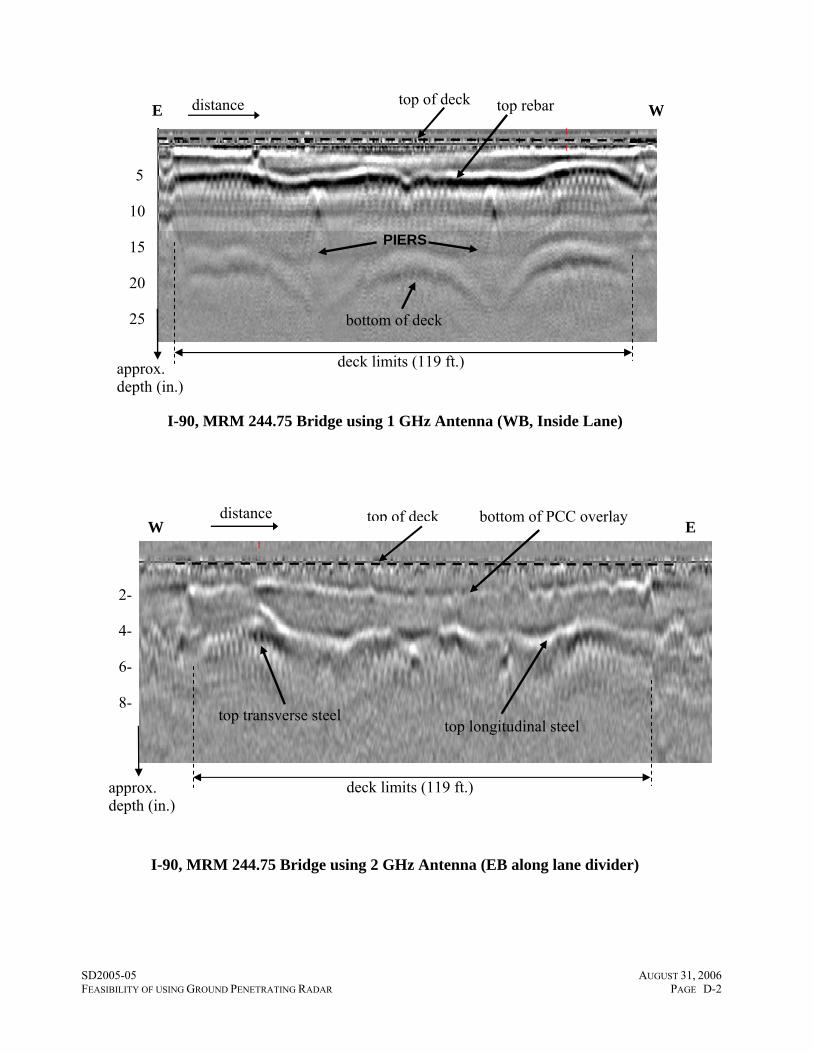
SD2005-05 AUGUST 31, 2006 FEASIBILITY OF USING GROUND PENETRATING RADAR PAGE D-2
5
10
15
20
25
I-90, MRM 244.75 Bridge using 1 GHz Antenna (WB, Inside Lane)
I-90, MRM 244.75 Bridge using 2 GHz Antenna (EB along lane divider)
top of deck top rebar
deck limits (119 ft.)
distance
bottom of deck
PIERS
approx. depth (in.)
E W
top of deckdistance bottom of PCC overlay
top transverse steel top longitudinal steel
approx. depth (in.)
deck limits (119 ft.)
W E
2- 4- 6- 8-
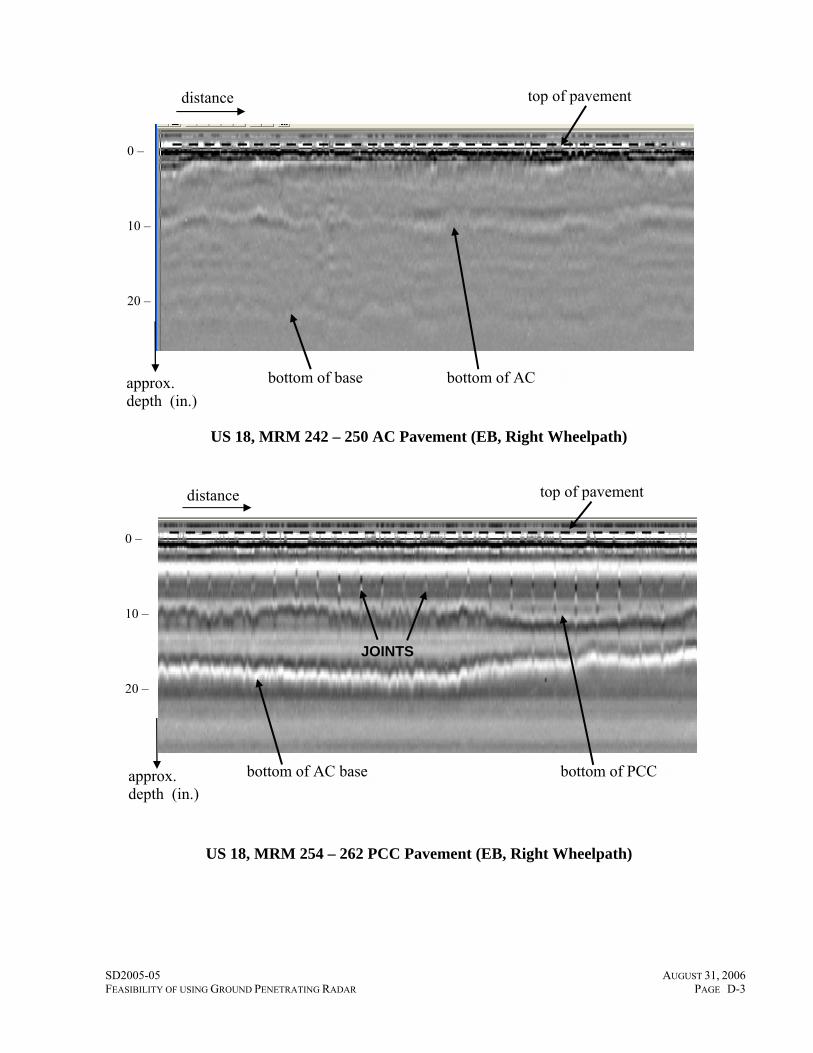
SD2005-05 AUGUST 31, 2006 FEASIBILITY OF USING GROUND PENETRATING RADAR PAGE D-3
US 18, MRM 242 – 250 AC Pavement (EB, Right Wheelpath)
US 18, MRM 254 – 262 PCC Pavement (EB, Right Wheelpath)
approx. depth (in.)
distance top of pavement
bottom of AC bottom of base
0 – 10 – 20 –
approx. depth (in.)
distance top of pavement
bottom of PCC bottom of AC base
0 – 10 – 20 –
JOINTS

SD2005-05 AUGUST 31, 2006 FEASIBILITY OF USING GROUND PENETRATING RADAR PAGE D-4

SD2005-05 AUGUST 31, 2006 FEASIBILITY OF USING GROUND PENETRATING RADAR PAGE E-1
APPENDIX E
Bridge Deck Condition Maps

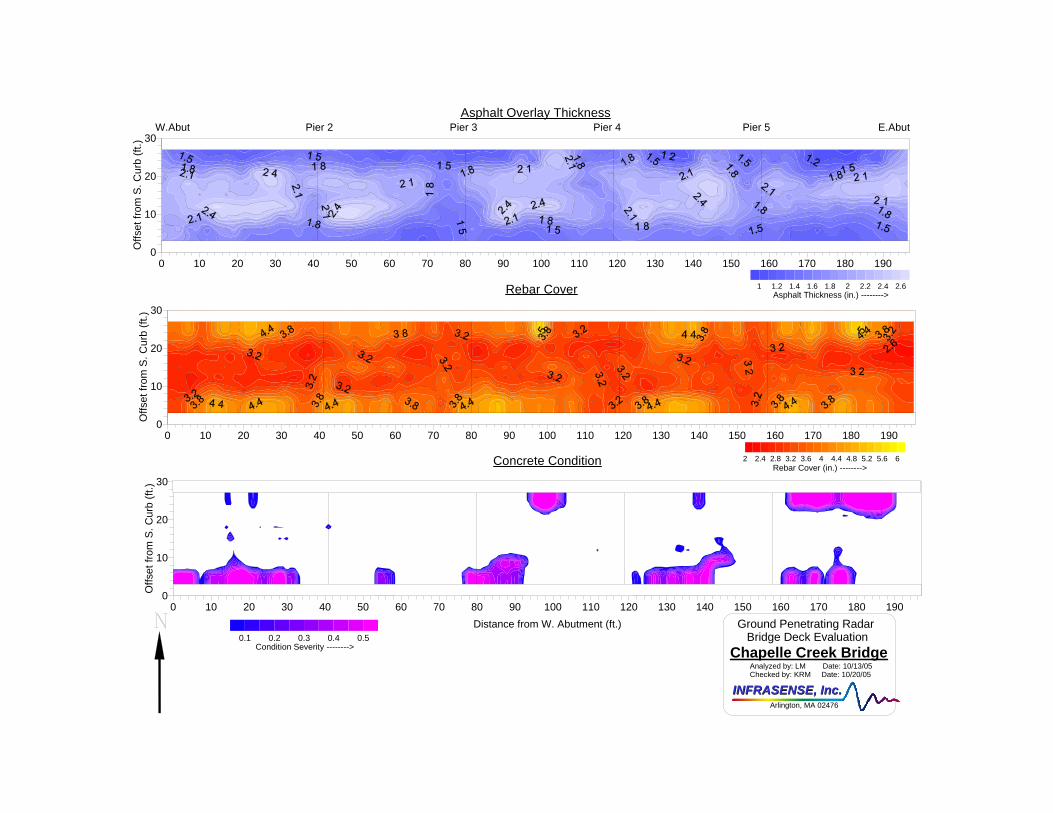
INFRASENSE, Inc.INFRASENSE, Inc.
Ground Penetrating Radar Bridge Deck Evaluation
Chapelle Creek BridgeAnalyzed by: LM Date: 10/13/05Checked by: KRM Date: 10/20/05
Arlington, MA 02476
Rebar Cover (in.) -------->
0 10 20 30 40 50 60 70 80 90 100 110 120 130 140 150 160 170 180 190
Rebar Cover
0
10
20
30
Offs
et fr
om S
. Cur
b (ft
.)W.Abut Pier 2 Pier 3 Pier 4
0 10 20 30 40 50 60 70 80 90 100 110 120 130 140 150 160 170 180 190
Asphalt Overlay Thickness
0
10
20
30O
ffset
from
S. C
urb
(ft.)
2 2.4 2.8 3.2 3.6 4 4.4 4.8 5.2 5.6 6
1 1.2 1.4 1.6 1.8 2 2.2 2.4 2.6Asphalt Thickness (in.) -------->
Pier 5 E.Abut
Condition Severity -------->
0 10 20 30 40 50 60 70 80 90 100 110 120 130 140 150 160 170 180 190Distance from W. Abutment (ft.)
Concrete Condition
0
10
20
30
Offs
et fr
om S
. Cur
b (ft
.)
0.1 0.2 0.3 0.4 0.5
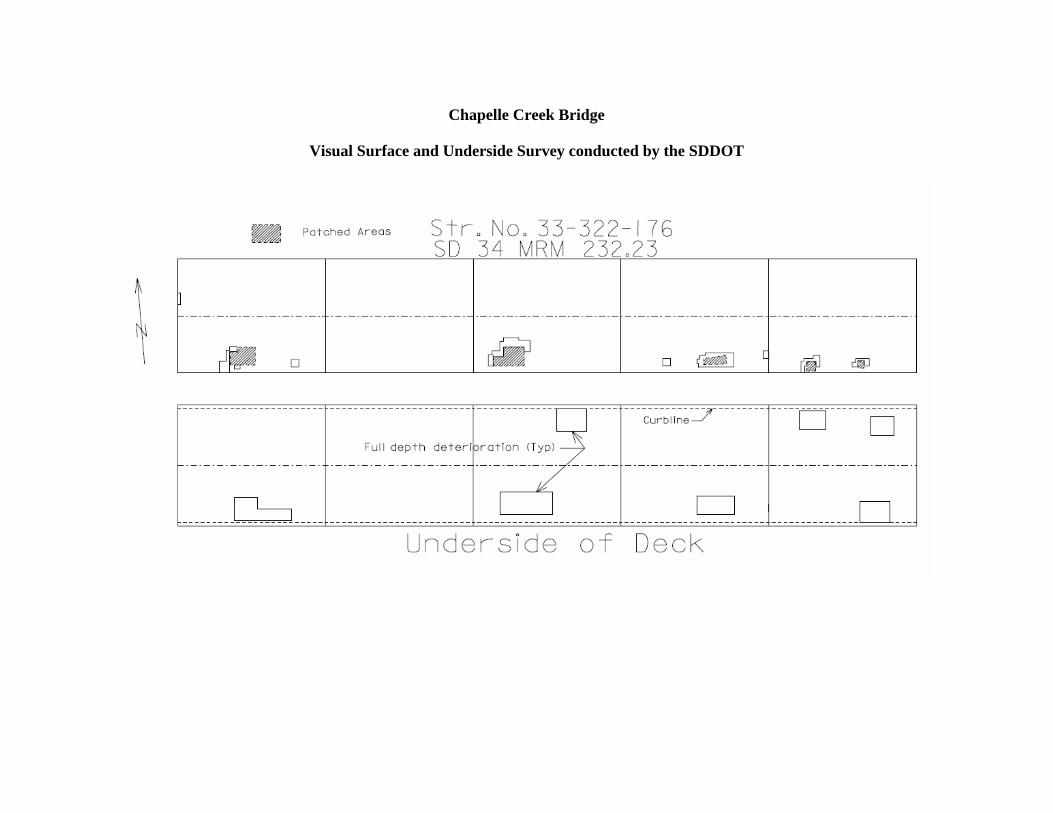
Chapelle Creek Bridge
Visual Surface and Underside Survey conducted by the SDDOT
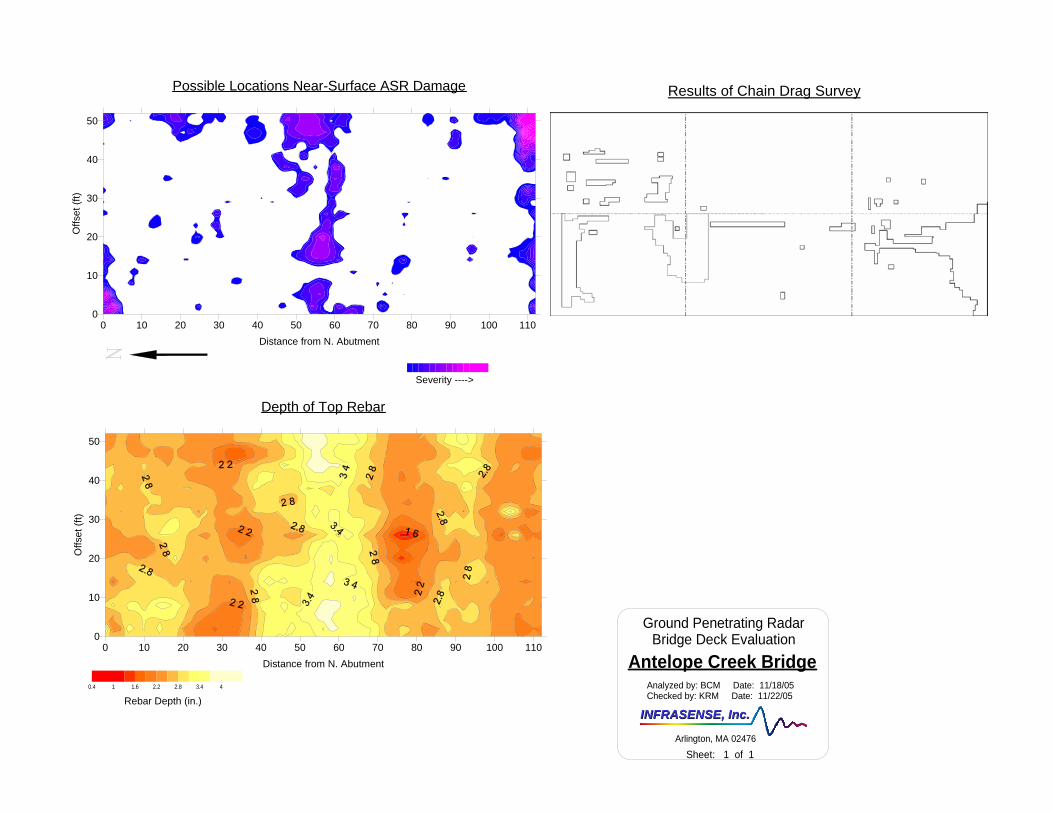
INFRASENSE, Inc.INFRASENSE, Inc.
0 10 20 30 40 50 60 70 80 90 100 110Distance from N. Abutment
Possible Locations Near-Surface ASR Damage
0
10
20
30
40
50
Offs
et (f
t)
Severity ---->
Results of Chain Drag Survey
0 10 20 30 40 50 60 70 80 90 100 110Distance from N. Abutment
Depth of Top Rebar
0
10
20
30
40
50
Offs
et (f
t)
0.4 1 1.6 2.2 2.8 3.4 4
Rebar Depth (in.)
Ground Penetrating RadarBridge Deck Evaluation
Antelope Creek Bridge
Arlington, MA 02476
Sheet: 1 of 1
Analyzed by: BCM Date: 11/18/05Checked by: KRM Date: 11/22/05

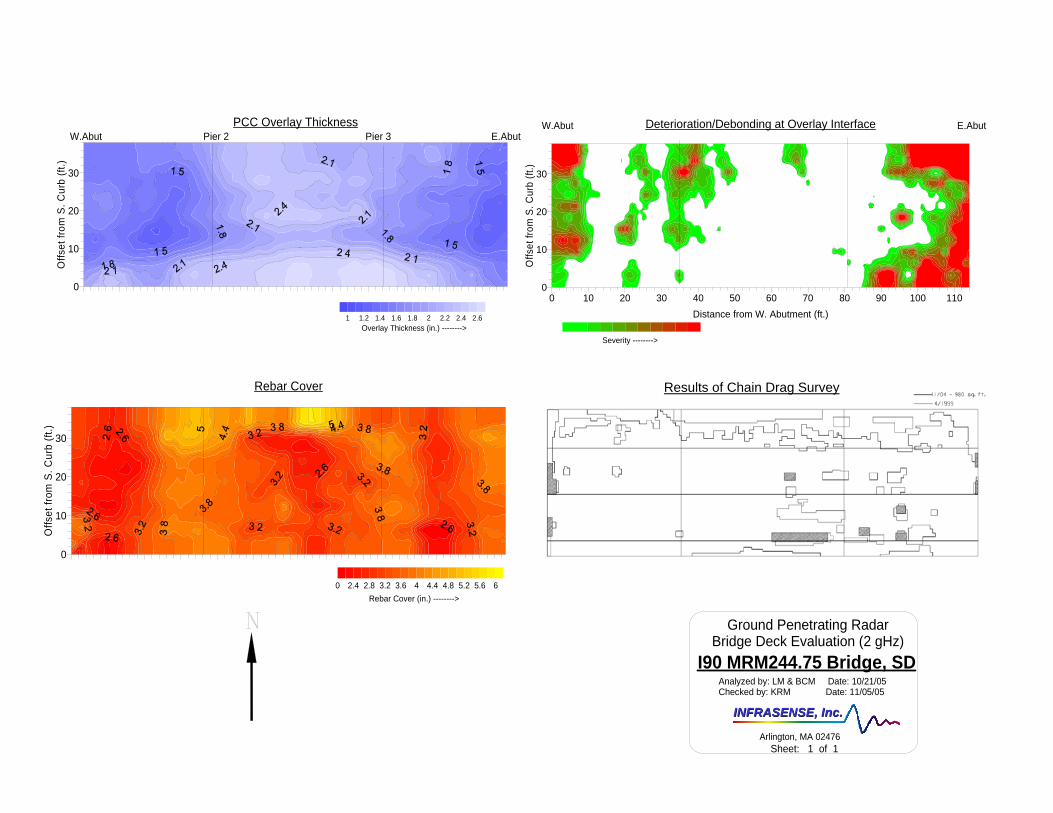
INFRASENSE, Inc.INFRASENSE, Inc.
Rebar Cover (in.) -------->
Rebar Cover
0
10
20
30
Offs
et fr
om S
. Cur
b (ft
.)
0 2.4 2.8 3.2 3.6 4 4.4 4.8 5.2 5.6 6
Pier 2 Pier 3PCC Overlay Thickness
0
10
20
30
Offs
et fr
om S
. Cur
b (ft
.)
1 1.2 1.4 1.6 1.8 2 2.2 2.4 2.6Overlay Thickness (in.) -------->
W.Abut E.Abut
Severity -------->
0 10 20 30 40 50 60 70 80 90 100 110Distance from W. Abutment (ft.)
Deterioration/Debonding at Overlay Interface
0
10
20
30
Offs
et fr
om S
. Cur
b (ft
.)
W.Abut E.Abut
Results of Chain Drag Survey
Ground Penetrating RadarBridge Deck Evaluation (2 gHz)
I90 MRM244.75 Bridge, SDAnalyzed by: LM & BCM Date: 10/21/05Checked by: KRM Date: 11/05/05
Arlington, MA 02476Sheet: 1 of 1


SD2005-05 AUGUST 31, 2006 FEASIBILITY OF USING GROUND PENETRATING RADAR PAGE F-1
APPENDIX F
Pavement Layer Thickness Plots

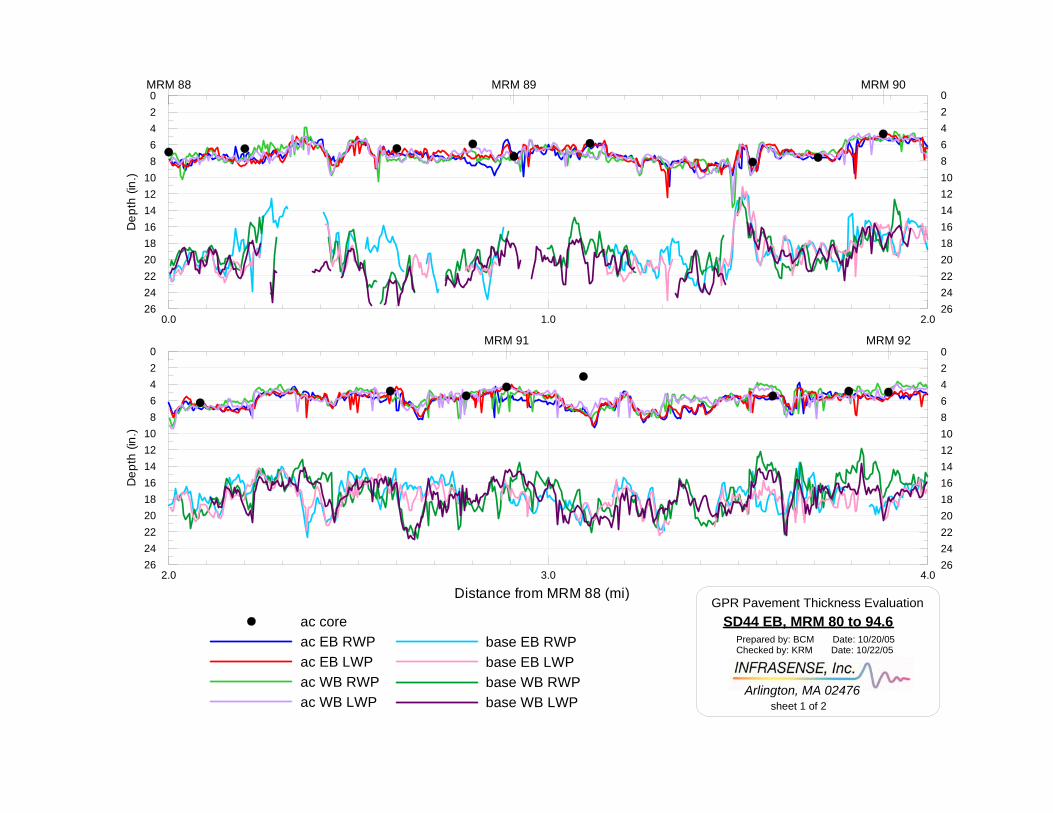
0.0 1.0 2.026242220181614121086420
Dep
th (i
n.)
base EB RWPbase EB LWPbase WB RWPbase WB LWP
MRM 88 MRM 89 MRM 90
Arlington, MA 02476
Prepared by: BCM Date: 10/20/05Checked by: KRM Date: 10/22/05
SD44 EB, MRM 80 to 94.6GPR Pavement Thickness Evaluation
02468101214161820222426
02468101214161820222426
2.0 3.0 4.0
Distance from MRM 88 (mi)
26242220181614121086420
Dep
th (i
n.)
MRM 91 MRM 92
ac coreac EB RWPac EB LWPac WB RWPac WB LWP sheet 1 of 2
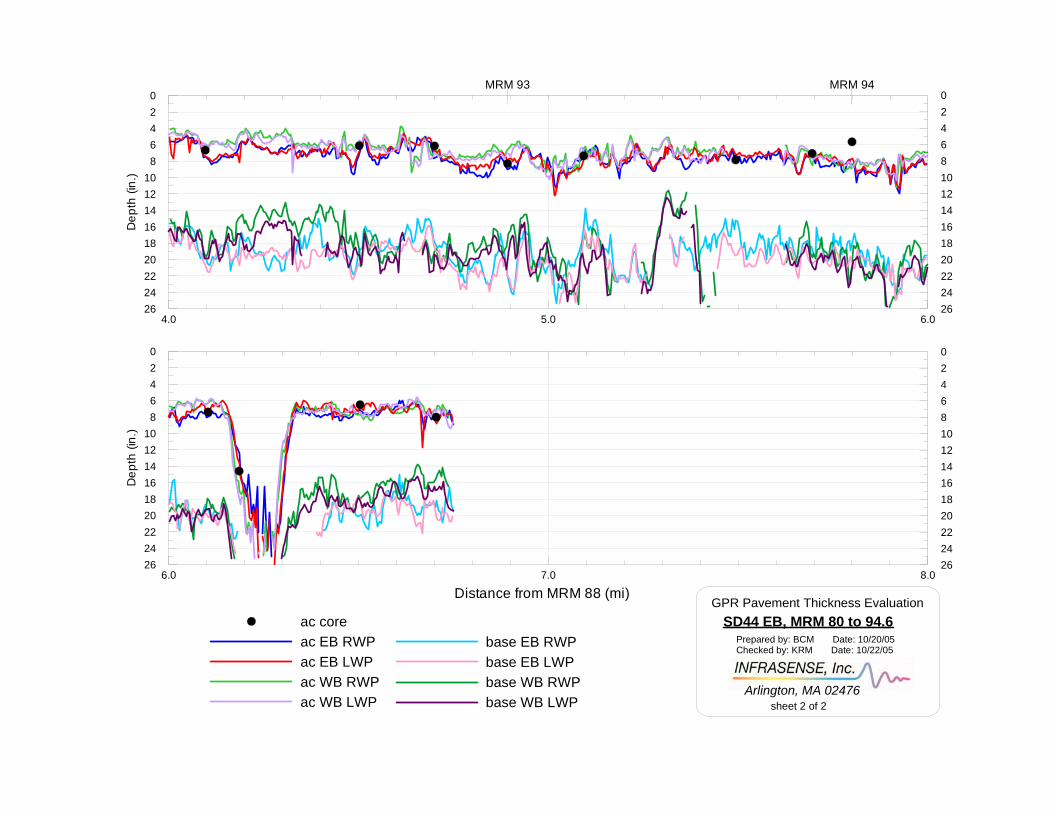
4.0 5.0 6.026242220181614121086420
Dep
th (i
n.)
base EB RWPbase EB LWPbase WB RWPbase WB LWP
MRM 93 MRM 94
Arlington, MA 02476
Prepared by: BCM Date: 10/20/05Checked by: KRM Date: 10/22/05
SD44 EB, MRM 80 to 94.6GPR Pavement Thickness Evaluation
02468101214161820222426
02468101214161820222426
6.0 7.0 8.0
Distance from MRM 88 (mi)
26242220181614121086420
Dep
th (i
n.)
ac coreac EB RWPac EB LWPac WB RWPac WB LWP sheet 2 of 2
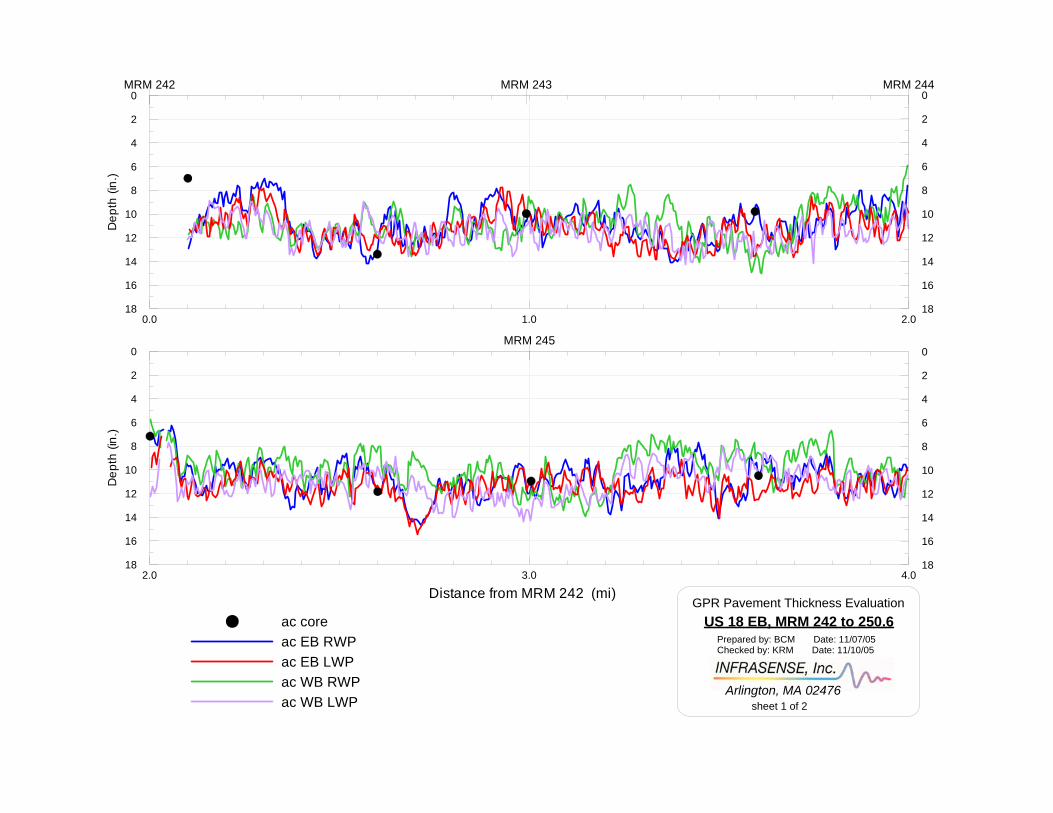
0.0 1.0 2.018
16
14
12
10
8
6
4
2
0D
epth
(in.
)
MRM 242 MRM 243 MRM 244
Arlington, MA 02476
Prepared by: BCM Date: 11/07/05Checked by: KRM Date: 11/10/05
US 18 EB, MRM 242 to 250.6GPR Pavement Thickness Evaluation
0
2
4
6
8
10
12
14
16
18
0
2
4
6
8
10
12
14
16
182.0 3.0 4.0
Distance from MRM 242 (mi)
18
16
14
12
10
8
6
4
2
0
Dep
th (i
n.)
MRM 245
ac coreac EB RWPac EB LWPac WB RWPac WB LWP sheet 1 of 2
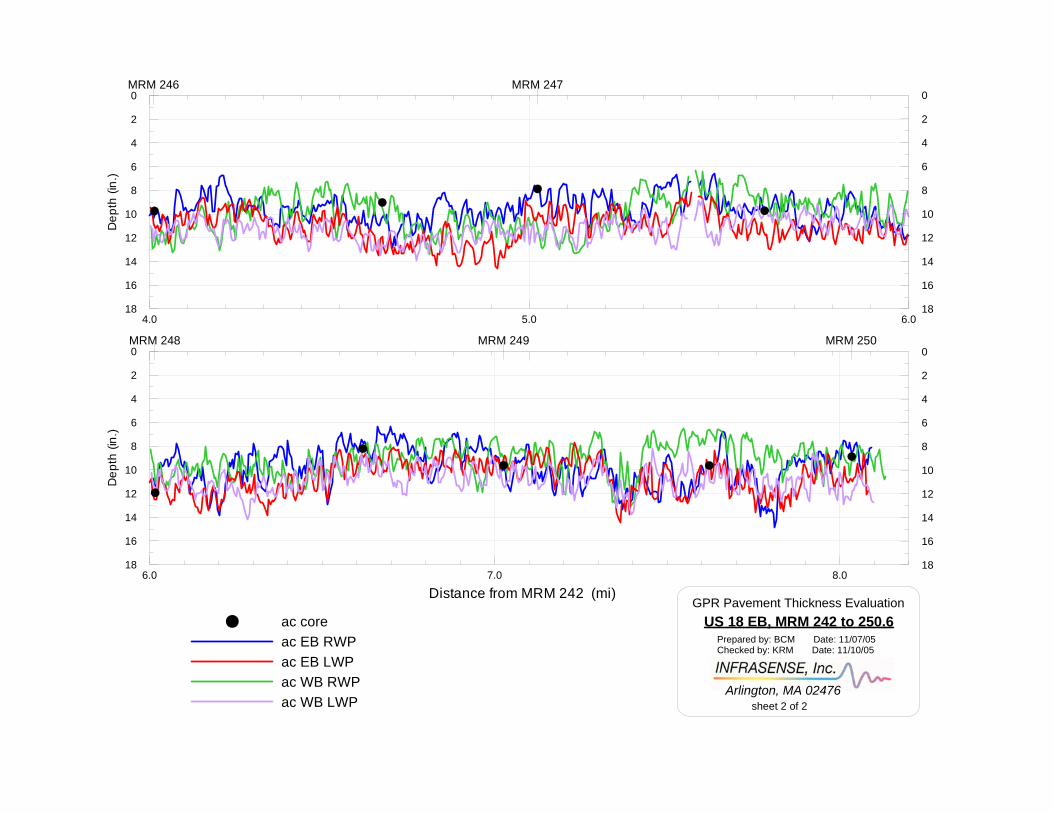
4.0 5.0 6.018
16
14
12
10
8
6
4
2
0D
epth
(in.
)
MRM 246 MRM 247
Arlington, MA 02476
Prepared by: BCM Date: 11/07/05Checked by: KRM Date: 11/10/05
US 18 EB, MRM 242 to 250.6GPR Pavement Thickness Evaluation
0
2
4
6
8
10
12
14
16
18
0
2
4
6
8
10
12
14
16
186.0 7.0 8.0
Distance from MRM 242 (mi)
18
16
14
12
10
8
6
4
2
0
Dep
th (i
n.)
MRM 248 MRM 249 MRM 250
ac coreac EB RWPac EB LWPac WB RWPac WB LWP sheet 2 of 2
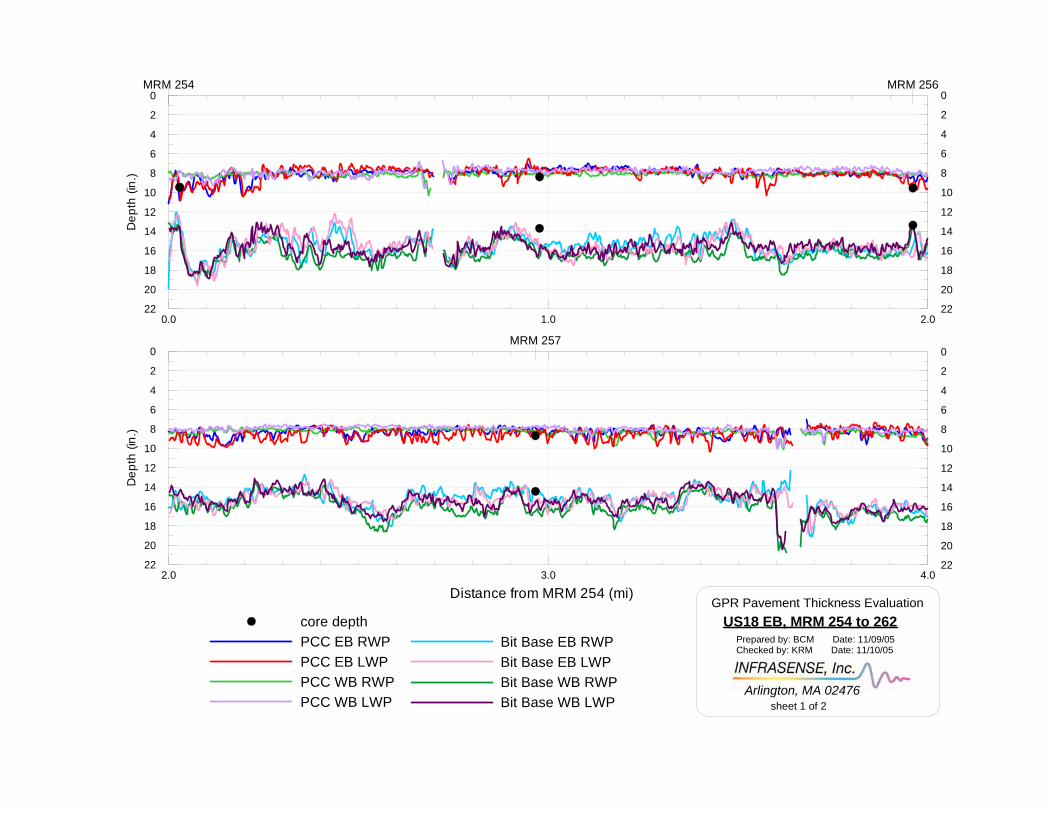
0.0 1.0 2.022
20
18
16
14
12
10
8
6
4
2
0
Dep
th (i
n.)
Bit Base EB RWPBit Base EB LWPBit Base WB RWPBit Base WB LWP
MRM 254 MRM 256
sheet 1 of 2Arlington, MA 02476
Prepared by: BCM Date: 11/09/05Checked by: KRM Date: 11/10/05
US18 EB, MRM 254 to 262GPR Pavement Thickness Evaluation
0
2
4
6
8
10
12
14
16
18
20
22
0
2
4
6
8
10
12
14
16
18
20
222.0 3.0 4.0
Distance from MRM 254 (mi)
22
20
18
16
14
12
10
8
6
4
2
0
Dep
th (i
n.)
MRM 257
core depthPCC EB RWPPCC EB LWPPCC WB RWPPCC WB LWP
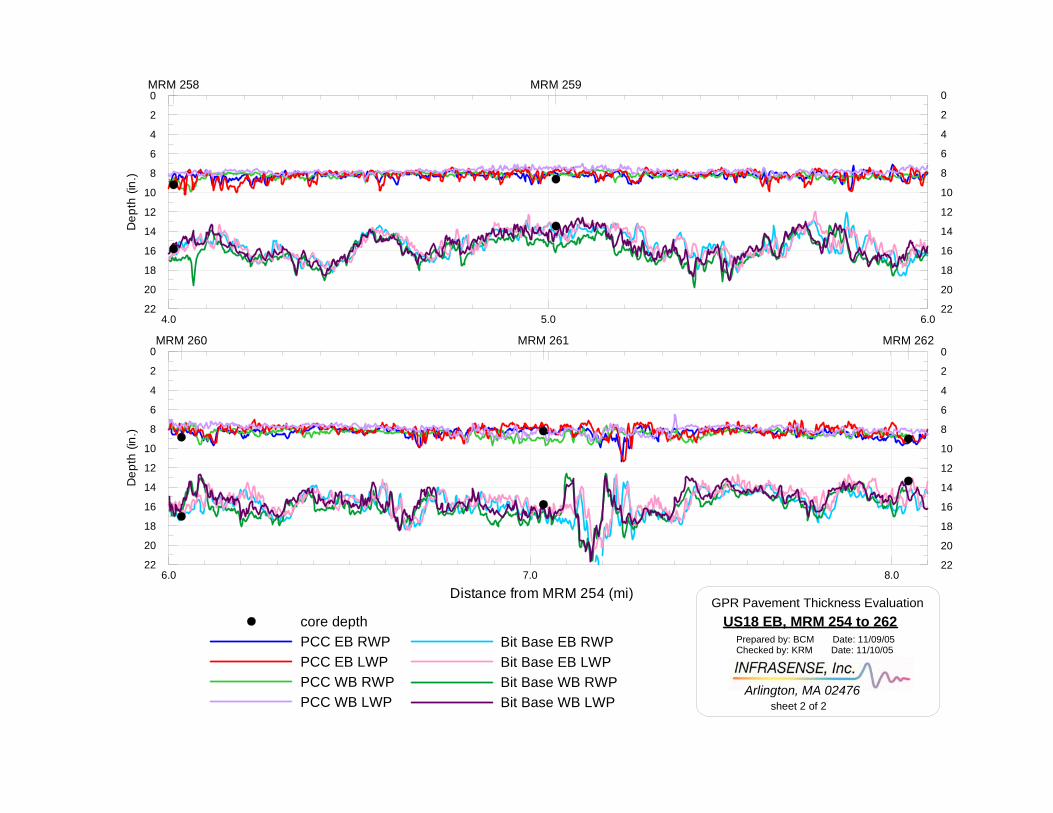
4.0 5.0 6.022
20
18
16
14
12
10
8
6
4
2
0
Dep
th (i
n.)
Bit Base EB RWPBit Base EB LWPBit Base WB RWPBit Base WB LWP
MRM 258 MRM 259
sheet 2 of 2Arlington, MA 02476
Prepared by: BCM Date: 11/09/05Checked by: KRM Date: 11/10/05
US18 EB, MRM 254 to 262GPR Pavement Thickness Evaluation
0
2
4
6
8
10
12
14
16
18
20
22
0
2
4
6
8
10
12
14
16
18
20
226.0 7.0 8.0
Distance from MRM 254 (mi)
22
20
18
16
14
12
10
8
6
4
2
0
Dep
th (i
n.)
MRM 260 MRM 261 MRM 262
core depthPCC EB RWPPCC EB LWPPCC WB RWPPCC WB LWP

SD2005-05 AUGUST 31, 2006 FEASIBILITY OF USING GROUND PENETRATING RADAR PAGE G-1
APPENDIX G
Maps of Geotechnical Studies

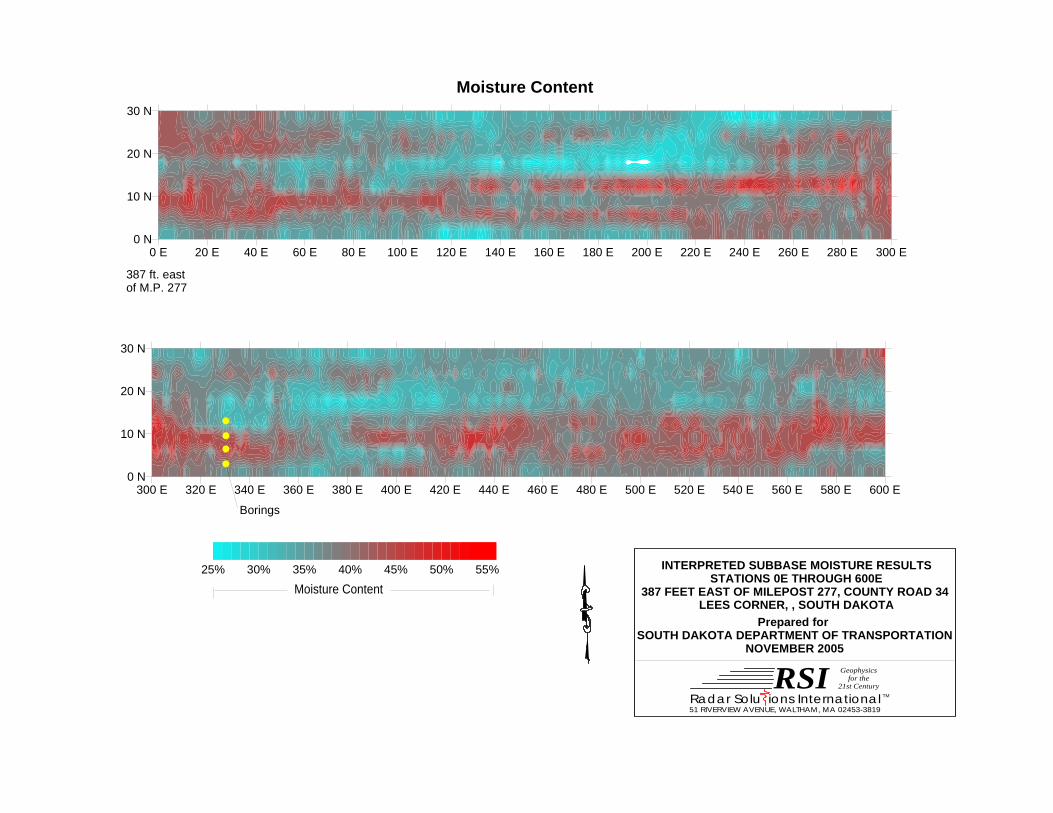
INTERPRETED SUBBASE MOISTURE RESULTSSTATIONS 0E THROUGH 600E
387 FEET EAST OF MILEPOST 277, COUNTY ROAD 34 LEES CORNER, , SOUTH DAKOTA
Radar Solu ions InternationalRSI Geophysics
for the21st Century
51 RIVERVIEW AVENUE, WALTHAM, MA 02453-3819
TM
Prepared for SOUTH DAKOTA DEPARTMENT OF TRANSPORTATION
NOVEMBER 2005
387 ft. east of M.P. 277
300 E 320 E 340 E 360 E 380 E 400 E 420 E 440 E 460 E 480 E 500 E 520 E 540 E 560 E 580 E 600 E0 N
10 N
20 N
30 N
25% 30% 35% 40% 45% 50% 55%
0 E 20 E 40 E 60 E 80 E 100 E 120 E 140 E 160 E 180 E 200 E 220 E 240 E 260 E 280 E 300 E
Moisture Content
0 N
10 N
20 N
30 N
Moisture Content
Borings
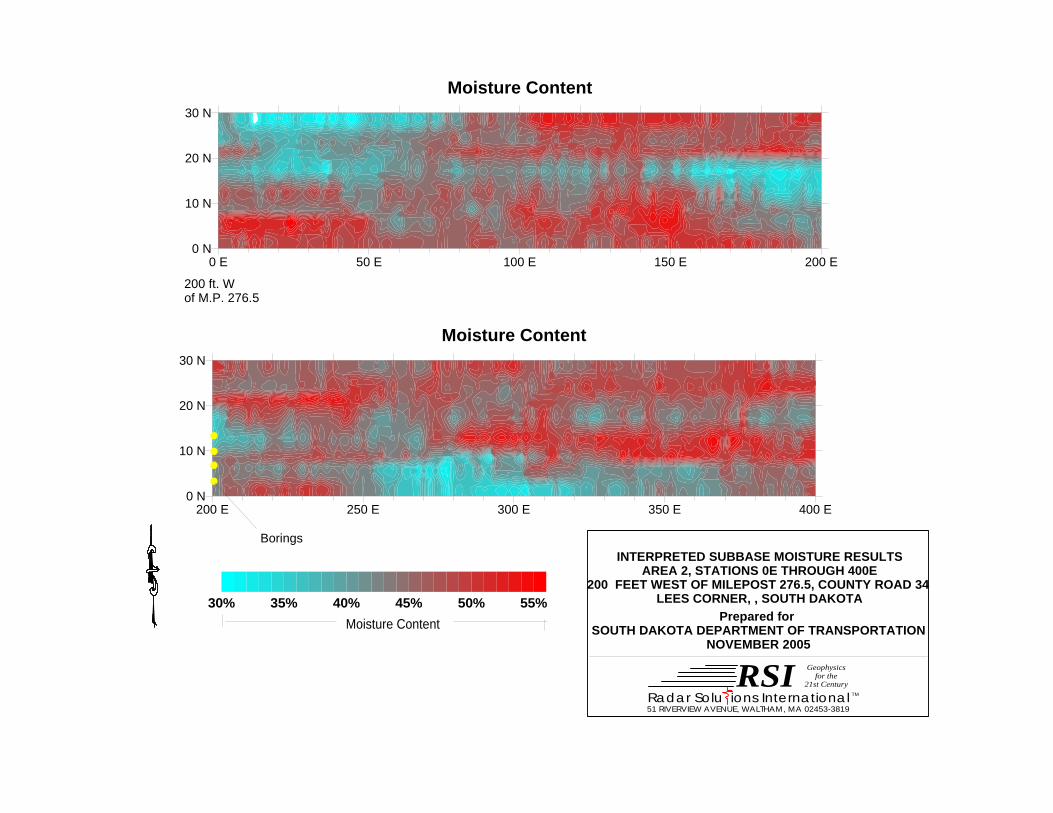
200 E 250 E 300 E 350 E 400 E
Moisture Content
0 N
10 N
20 N
30 N
30% 35% 40% 45% 50% 55%
INTERPRETED SUBBASE MOISTURE RESULTSAREA 2, STATIONS 0E THROUGH 400E
200 FEET WEST OF MILEPOST 276.5, COUNTY ROAD 34 LEES CORNER, , SOUTH DAKOTA
Radar Solu ions InternationalRSI Geophysics
for the21st Century
51 RIVERVIEW AVENUE, WALTHAM, MA 02453-3819
TM
Prepared for SOUTH DAKOTA DEPARTMENT OF TRANSPORTATION
NOVEMBER 2005Moisture Content
200 ft. W of M.P. 276.5
Borings
0 E 50 E 100 E 150 E 200 E
Moisture Content
0 N
10 N
20 N
30 N
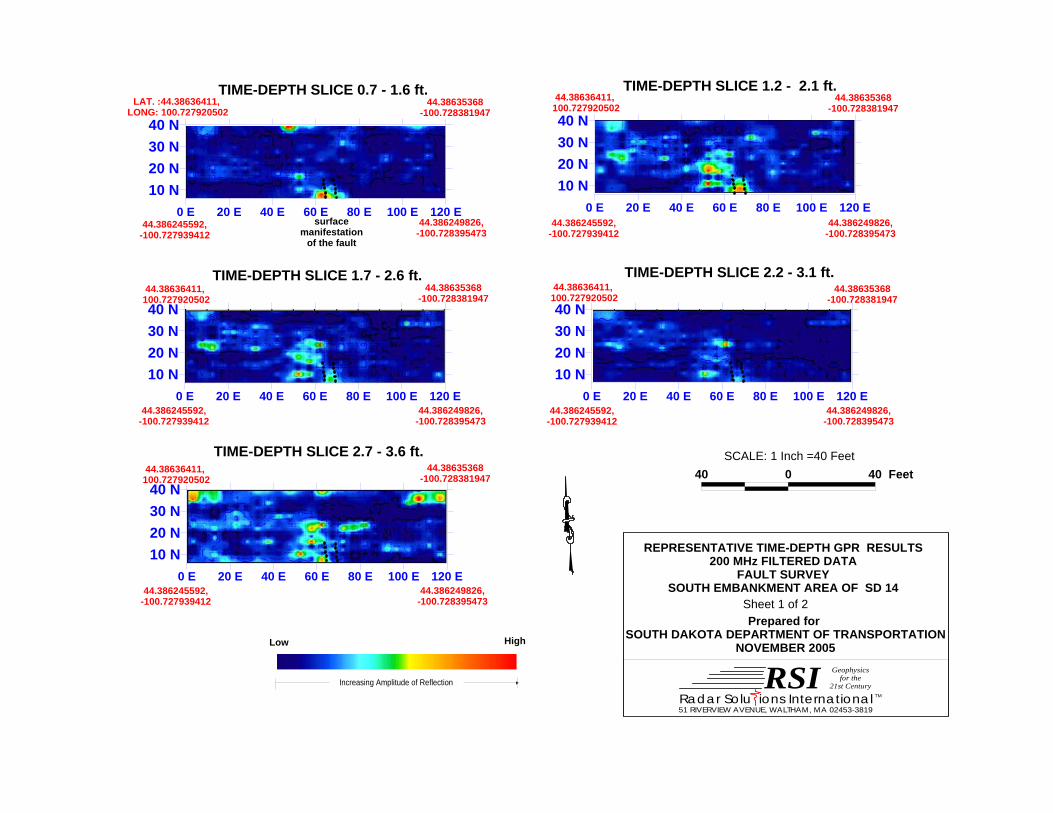
REPRESENTATIVE TIME-DEPTH GPR RESULTS200 MHz FILTERED DATA
FAULT SURVEYSOUTH EMBANKMENT AREA OF SD 14
Radar Solu ions InternationalRSI Geophysics
for the21st Century
51 RIVERVIEW AVENUE, WALTHAM, MA 02453-3819
TM
Prepared for SOUTH DAKOTA DEPARTMENT OF TRANSPORTATION
NOVEMBER 2005
44.386245592,-100.727939412
LAT. :44.38636411, LONG: 100.727920502
44.38635368-100.728381947
44.386249826,-100.728395473
0 E 20 E 40 E 60 E 80 E 100 E 120 E
10 N20 N30 N40 N
44.386245592,-100.727939412
44.38636411, 100.727920502
44.38635368-100.728381947
44.386249826,-100.728395473
0 E 20 E 40 E 60 E 80 E 100 E 120 E
10 N20 N30 N40 N
SCALE: 1 Inch =40 Feet40040 Feet
44.386245592,-100.727939412
44.38636411, 100.727920502
44.38635368-100.728381947
44.386249826,-100.728395473
0 E 20 E 40 E 60 E 80 E 100 E 120 E
10 N20 N30 N40 N
44.386245592,-100.727939412
44.38636411, 100.727920502
44.38635368-100.728381947
44.386249826,-100.728395473
0 E 20 E 40 E 60 E 80 E 100 E 120 E
10 N20 N30 N40 N
Increasing Amplitude of Reflection
Low High
TIME-DEPTH SLICE 0.7 - 1.6 ft. TIME-DEPTH SLICE 1.2 - 2.1 ft.
TIME-DEPTH SLICE 1.7 - 2.6 ft. TIME-DEPTH SLICE 2.2 - 3.1 ft.
surfacemanifestation
of the fault
44.386245592,-100.727939412
44.38636411, 100.727920502
44.38635368-100.728381947
44.386249826,-100.728395473
0 E 20 E 40 E 60 E 80 E 100 E 120 E
10 N20 N30 N40 N
TIME-DEPTH SLICE 2.7 - 3.6 ft.
Sheet 1 of 2
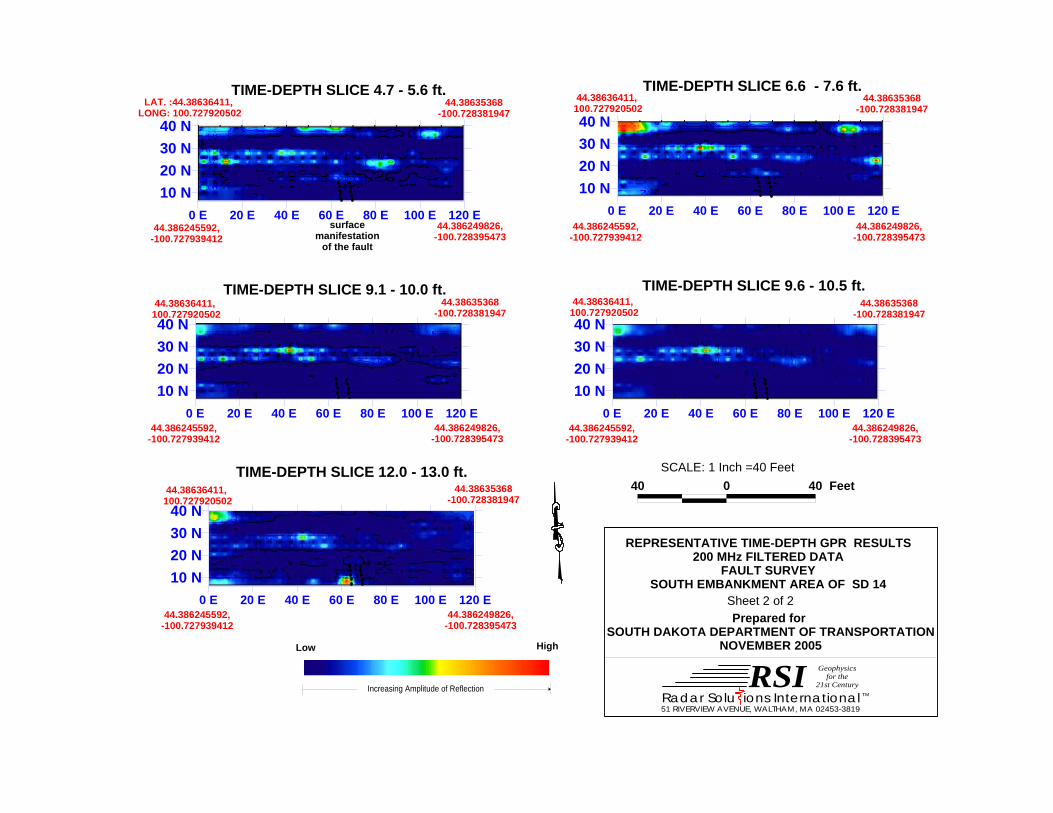
44.386245592,-100.727939412
LAT. :44.38636411, LONG: 100.727920502
44.38635368-100.728381947
44.386249826,-100.728395473
0 E 20 E 40 E 60 E 80 E 100 E 120 E
10 N20 N30 N40 N
44.386245592,-100.727939412
44.38636411, 100.727920502
44.38635368-100.728381947
44.386249826,-100.728395473
0 E 20 E 40 E 60 E 80 E 100 E 120 E
10 N20 N30 N40 N
SCALE: 1 Inch =40 Feet40040 Feet
44.386245592,-100.727939412
44.38636411, 100.727920502
44.38635368-100.728381947
44.386249826,-100.728395473
0 E 20 E 40 E 60 E 80 E 100 E 120 E
10 N20 N30 N40 N
44.386245592,-100.727939412
44.38636411, 100.727920502
44.38635368-100.728381947
44.386249826,-100.728395473
0 E 20 E 40 E 60 E 80 E 100 E 120 E
10 N20 N30 N40 N
Increasing Amplitude of Reflection
Low High
TIME-DEPTH SLICE 4.7 - 5.6 ft. TIME-DEPTH SLICE 6.6 - 7.6 ft.
TIME-DEPTH SLICE 9.1 - 10.0 ft. TIME-DEPTH SLICE 9.6 - 10.5 ft.
surfacemanifestation
of the fault
44.386245592,-100.727939412
44.38636411, 100.727920502
44.38635368-100.728381947
44.386249826,-100.728395473
0 E 20 E 40 E 60 E 80 E 100 E 120 E
10 N20 N30 N40 N
TIME-DEPTH SLICE 12.0 - 13.0 ft.
REPRESENTATIVE TIME-DEPTH GPR RESULTS200 MHz FILTERED DATA
FAULT SURVEYSOUTH EMBANKMENT AREA OF SD 14
Radar Solu ions InternationalRSI Geophysics
for the21st Century
51 RIVERVIEW AVENUE, WALTHAM, MA 02453-3819
TM
Prepared for SOUTH DAKOTA DEPARTMENT OF TRANSPORTATION
NOVEMBER 2005
Sheet 2 of 2