feasibility of using error-related potentials as an...
TRANSCRIPT
Feasibility of using Error-relatedpotentials as an appropriatemethod for adaptation in a
brain-computer interface
Project group: 17gr10405Johannes Thorling Hadsund & Kasper Kunz Leerskov
Aalborg University10. semester Biomedical Engineering and Informatics
School of Medicine and Health

School of medicine and health
Biomedical Engineering and Informatics
Niels Jernes Vej 12, A5
9220 Aalborg Øst
Telefon 9940 8752
http://www.smh.aau.dk/
Title:Feasibility of using Error-relatedpotentials as an appropriate methodfor adaptation in a brain-computerinterface
Theme:Master Thesis
Project period:6th of February 2017 -7th June 2017
Project group:17gr10405
Participants:
Johannes Thorling Hadsund
Kasper Kunz Leerskov
Supervisor:Mads Jochumsen
Pages: 59
Concluded: 07/06/17
The content of this report is freely available, but
publication (with source reference) may only
take place in agreement with the authors.
Synopsis:
Introduction: Error related potentials are evokedin response to erroneous prediction and actuationby a BCI. Detection of error related potentialsprovides prediction-independent means for guid-ing adaptation, and potentially enables more accu-rate adaptation and means for re-separation of par-tially confused classes. In this work it was inves-tigated if error related potentials can be detectedindependently of the misclassified user intention.Method: Error and non-error related potentialswere provoked in 12 subjects during three differ-ent paradigms: Overt motor, covert motor and agame. EEG was recorded from 16 electrodes anddivided into epochs containing one second of datapost onset of the visual feedback. For each groupa classifier was trained with spectral and tempo-ral features to detect error and non-error relatedpotentials. Furthermore each group was classifiedby a classifier trained using data for the two othergroups. Results: For the three groups the area un-der the ROC was 0.92 % for the covert motor, 0.86% for the overt motor, and 0.68 % for the game.When classifying the groups using the two othergroups for training, accuracy changed from to 72%to 74%, from 81% to 77% and from 56 to 60% forthe overt, the covert and the game paradigm, re-spectively, compared to the classification of the sin-gle groups. Discussion: This study demonstratedthat error related potentials evoked during threedifferent paradigms of mental tasks could be com-parably accurately classified after training the clas-sifier with either data from the same paradigm asthe test data or data from two other paradigms.This strongly suggests that some properties of er-ror related potentials are independent to the mis-classified user intention.


Preface
Reading guideReferences were made according to the Harvard-method: [Author’s surname, year of publication].I.e. [Jensen2011]. References after a full stop accounts for the previous text section, and referencesplaced before the full stop, accounts only for the previous sentence. Frequent words and phrases areabbreviated after first use. Abbreviations is indicated in parenthesis upon first use of the phrase.
The report is structured in accordance with IMRAD; introduction, methods, results and discus-sion. However, traditionally the introduction of AAU projects is split into a short introduction ofthe context of the project, and a longer analysis of a specific problem within this context. Theproblem analysis serves to specify the problem, and to identify potential solutions. The problemanalysis is concluded with a problem statement or a hypotheses.
v
Table of contents
1 Introduction 31.1 Initiating problem statement . . . . . . . . . . . . . . . . . . . . . . . . . . . . 51.2 Literature search . . . . . . . . . . . . . . . . . . . . . . . . . . . . . . . . . . 6
2 Problem analysis 72.1 Non-stationarity . . . . . . . . . . . . . . . . . . . . . . . . . . . . . . . . . . . 72.2 Adaptation strategies . . . . . . . . . . . . . . . . . . . . . . . . . . . . . . . . 7
2.2.1 Robust features and classifiers . . . . . . . . . . . . . . . . . . . . . . . . 72.2.2 Adaptive filtering . . . . . . . . . . . . . . . . . . . . . . . . . . . . . . 82.2.3 Adaptive features and classifiers . . . . . . . . . . . . . . . . . . . . . . . 92.2.4 Summary . . . . . . . . . . . . . . . . . . . . . . . . . . . . . . . . . . 12
2.3 Error related potentials . . . . . . . . . . . . . . . . . . . . . . . . . . . . . . . 132.3.1 Types of Error related potentials . . . . . . . . . . . . . . . . . . . . . . 132.3.2 Studies utilizing ErrP in BCIs . . . . . . . . . . . . . . . . . . . . . . . . 152.3.3 Cortical localization of ErrPs . . . . . . . . . . . . . . . . . . . . . . . . 15
2.4 Problem statement . . . . . . . . . . . . . . . . . . . . . . . . . . . . . . . . . 17
3 Methods 193.1 Subjects and Experimental setup . . . . . . . . . . . . . . . . . . . . . . . . . . 193.2 Experiment . . . . . . . . . . . . . . . . . . . . . . . . . . . . . . . . . . . . . 193.3 Dataanalysis . . . . . . . . . . . . . . . . . . . . . . . . . . . . . . . . . . . . 22
3.3.1 Temporal filtering . . . . . . . . . . . . . . . . . . . . . . . . . . . . . . 223.3.2 Spatial noise reduction . . . . . . . . . . . . . . . . . . . . . . . . . . . . 223.3.3 Feature extraction . . . . . . . . . . . . . . . . . . . . . . . . . . . . . . 223.3.4 Classification . . . . . . . . . . . . . . . . . . . . . . . . . . . . . . . . . 243.3.5 Optimization of templates, cost and number of features . . . . . . . . . . . 25
4 Results 274.1 ErrP classification accuracy . . . . . . . . . . . . . . . . . . . . . . . . . . . . . 27
4.1.1 Classifier performances . . . . . . . . . . . . . . . . . . . . . . . . . . . 274.1.2 Features reduction methods . . . . . . . . . . . . . . . . . . . . . . . . . 294.1.3 Influence of cost - ROC curves . . . . . . . . . . . . . . . . . . . . . . . . 304.1.4 Important features in the optimal configurations . . . . . . . . . . . . . . 324.1.5 Feature importance across subjects . . . . . . . . . . . . . . . . . . . . . 35
4.2 ErrP and non-ErrP separability across paradigms . . . . . . . . . . . . . . . . . . 39
5 Discussion 415.1 Conclusion . . . . . . . . . . . . . . . . . . . . . . . . . . . . . . . . . . . . . 44
References 45

Dansk resume
Introduktion
Patienter med stærkt nedsat kontrol over bevægeapparatet er afhængige af hjælpemidler for at kunnefærdes og begå sig socialt. Electroencefalografi (EEG) er en realtivt billig og udbredt målemetodeder gør det muligt at designe grænseflader mellem en patients hjerne og en computer (brain computerinterface, BCI). Ved hjælp af et BCI kan brugeren styre eksemplevis en kørestol eller en computer,og dermed genvinde tabt førlighed. Ved brug af mentale strategier, såsom at tænke på bevægelsereller ord, kan brugeren manipulere med EEG’et og dermed sende instruktioner til en computer.Efter opsamling af EEG’et behandles signalet digitalt for at frasortere støj og for at identificeresignalegenskaber(features) der sætter systemet i stand til at klassificere brugerens EEG som engiven knotrolklasse blandt et sæt af kontrolklasser. EEG’et påvirkes imidlertid ikke kun af dementale strategier brugeren bevist gennemfører, men også af hjernens øvrige aktivitet og brugerensomverden. For at imødegå skift i EEG’ets karakteristika bør et BCI kunne tilpasse sig EEG’etløbende. Hvis systemet tilpasses ved naivt at træne systemt med udgangspunkt i klassifikationenaf EEG’et, er der risiko for at klassifikationsfejl akkumuleres og på sigt hæmmer muligheden forat klassificere nyeligt målt EEG korrekt. Det er blevet påvist at en BCI-brugers reaktion på enfejlklassifikation af en mental strategi, kan spores i EEG’et. Reaktionen betegnes typisk som etfejlpotential (Error related potential, ErrP). Detektion af fejlpotentialer vil gøre det muligt kunat tilpasse systemet til ændringer i EEG’et når brugeren ikke betragter systemets klassifikation afEEG’et som fejlagtig. Dermed bliver systemtilpasningen mere robust overfor fejlklassifikationer.Imidlertid forudsætter fejlpotentialedrevet tilpasning af systemet, at fejlpotentialer kan genkendesuafhængigt af hvilken klassifikationsfejl systemet begår.
Formålet med dette projet var derfor at undersøge om fejlpotentialer kan skelnes fra ikke-fejluafhængigt af hvilken kontrolklasse der fejlklassificers.
Metode
Der blev opsamlet EEG fra 12 raske forsøgespersoner, der hver deltog i tre forskellige forsøgsparadig-mer, der alle havde til formål at provokere fejlpotentialer hos brugerne efter fingeret fejlklassifikationaf tre forskellige mentale strategier. De tre mentale strategier var coverte eller overte håndbevægelserog styring af en slange i spillet "snake". I alle tre paradigmer førte forsøgspersonernes mentalestrategier til enten forventelig eller uforventelig respons på en computerskærm. EEG’et blev opdelti epoker af et sekunds varighed. Hver epoke startede samtidigt med at der på computerskræmenblev vist respons på en af forsøgspersonernes mentale strategier. Fra hver epoke blev der udtrukketet sæt af tidslige og spektrale signalegenskaber til brug for træning af en LDA og en Random for-est. For hvert af de tre paradigmer blev EEG’et klassificeret efter træning med data fra sammeparadigme, og efterfølgende træning med data fra de to øvrige paradigmer.
Resultater
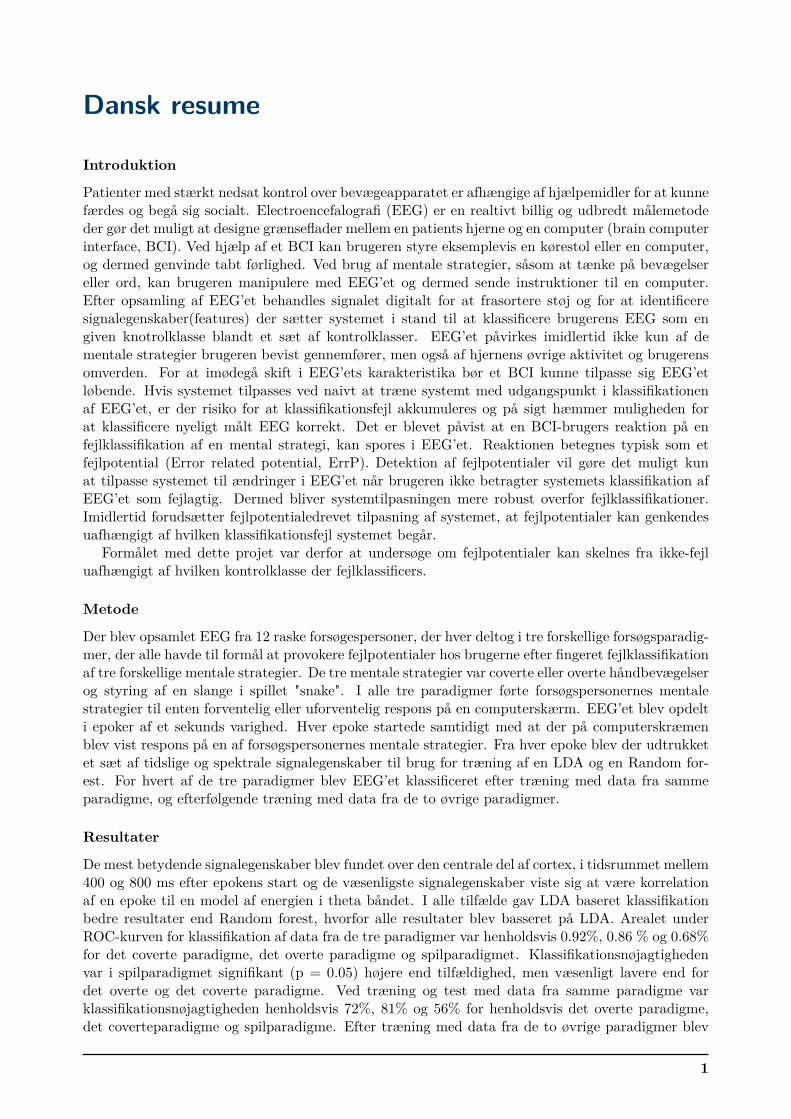
De mest betydende signalegenskaber blev fundet over den centrale del af cortex, i tidsrummet mellem400 og 800 ms efter epokens start og de væsenligste signalegenskaber viste sig at være korrelationaf en epoke til en model af energien i theta båndet. I alle tilfælde gav LDA baseret klassifikationbedre resultater end Random forest, hvorfor alle resultater blev basseret på LDA. Arealet underROC-kurven for klassifikation af data fra de tre paradigmer var henholdsvis 0.92%, 0.86 % og 0.68%for det coverte paradigme, det overte paradigme og spilparadigmet. Klassifikationsnøjagtighedenvar i spilparadigmet signifikant (p = 0.05) højere end tilfældighed, men væsenligt lavere end fordet overte og det coverte paradigme. Ved træning og test med data fra samme paradigme varklassifikationsnøjagtigheden henholdsvis 72%, 81% og 56% for henholdsvis det overte paradigme,det coverteparadigme og spilparadigme. Efter træning med data fra de to øvrige paradigmer blev
1

TABLE OF CONTENTS
der opnået en nøjagtighed på 74% og 77% og 60% for henholdsvis det overteparadigme, det coverteparadigme og spilpradigmet. .
Diskussion
Klassifikationsnøjagtigheden for det coverte og det overte paradigme blev ikke væsenligt påvirketaf om der blev anvendt træningesdata fra samme paradigme som testdataen eller træning og testdata kom fra forskellige paradigmer. Klassifikation af fejlpotentiler afhænger derfor ikke af at detvides hvilken kontrolklasse der er blevet fejlklassificerret forud for fejlpotentialet.
2
Chapter 1Introduction
People living with severe motor impairments, due to disease or trauma have very limited access to theoutside world [Bi et al., 2013]. Brain-Computer-Interfaces (BCI) provides means for these patientsto interact with assistive technology, giving them the possibility of communicating and controllingeffectors such as wheelchairs, keyboards or computer cursors andthus regaining lost control andindependence [Minguillon et al., 2017, Bi et al., 2013]. The BCI based human-machine interactionis achieved through monitoring and automated interpretation of the users brain activity, eitherthrough blood-oxygen based monitoring techniques such as fMRI or NIRS, or electrical monitoringtechniques such as ECoG or EEG [Bi et al., 2013]. Due to low cost and convenience of use, EEGhas been the most studied monitoring technique for use in BCI [Bi et al., 2013], and was thereforethe focus in this study.
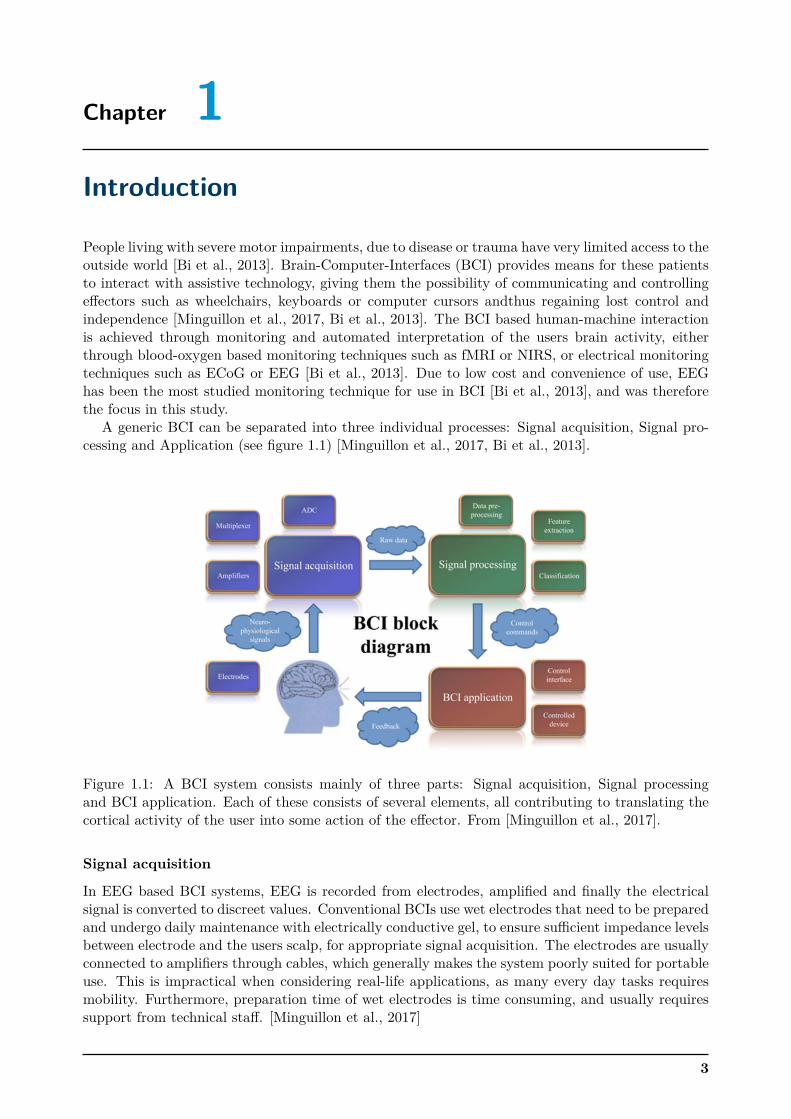
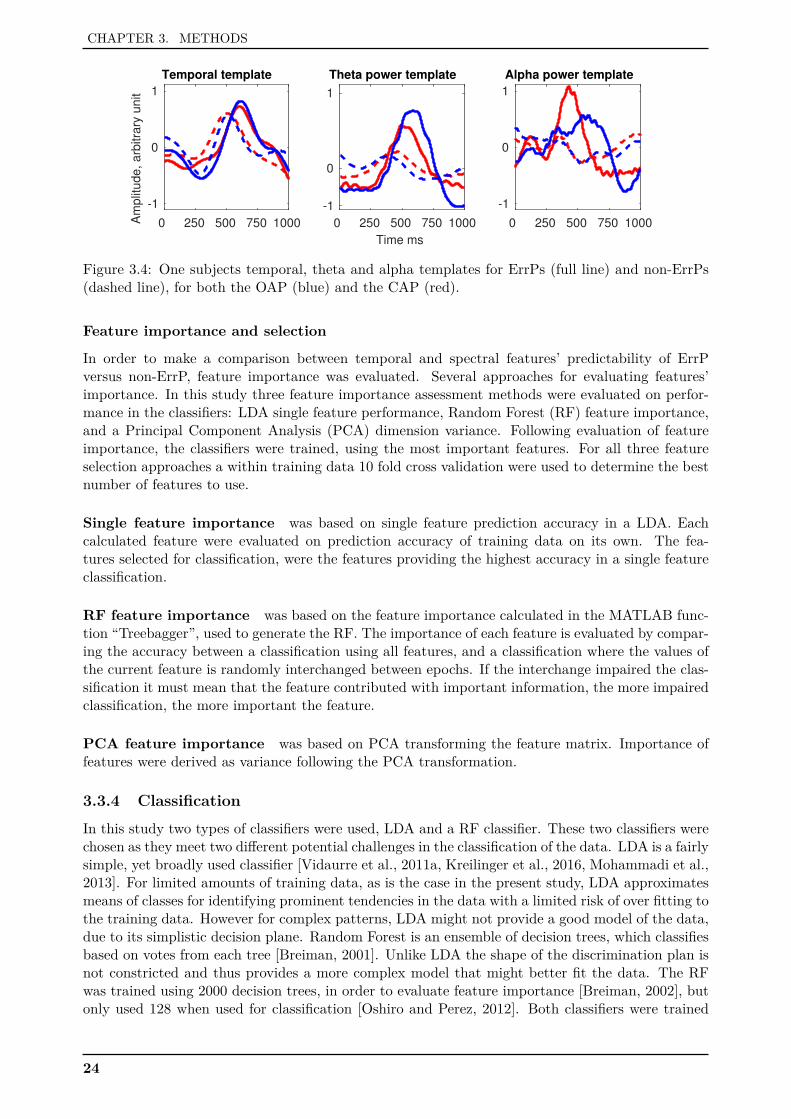
A generic BCI can be separated into three individual processes: Signal acquisition, Signal pro-cessing and Application (see figure 1.1) [Minguillon et al., 2017, Bi et al., 2013].
Figure 1.1: A BCI system consists mainly of three parts: Signal acquisition, Signal processingand BCI application. Each of these consists of several elements, all contributing to translating thecortical activity of the user into some action of the effector. From [Minguillon et al., 2017].
Signal acquisition
In EEG based BCI systems, EEG is recorded from electrodes, amplified and finally the electricalsignal is converted to discreet values. Conventional BCIs use wet electrodes that need to be preparedand undergo daily maintenance with electrically conductive gel, to ensure sufficient impedance levelsbetween electrode and the users scalp, for appropriate signal acquisition. The electrodes are usuallyconnected to amplifiers through cables, which generally makes the system poorly suited for portableuse. This is impractical when considering real-life applications, as many every day tasks requiresmobility. Furthermore, preparation time of wet electrodes is time consuming, and usually requiressupport from technical staff. [Minguillon et al., 2017]
3
CHAPTER 1. INTRODUCTION
Signal processingSignal processing in a BCI system concerns preprocessing of the EEG to remove noise and artifactsin the signal, feature extraction to characterize the recorded EEG and classification of the features todetermine the intentions of the user, corresponding to actions in an assistive device [Minguillon et al.,2017]. A lot of different preprocessing methods, feature extractors and classifiers exist, with differentpros and cons for specific applications. However, generally all elements of the signal processingshould be able to run online, which sets demand for high computational efficiency [Minguillon et al.,2017]. During preprocessing, usually different types of filters are used to remove artifacts. However,conventional filters risks removing valuable information from the EEG. Independent ComponentAnalysis (ICA), is another way of removing noise, by extracting independent components fromthe signal, such as artifacts. However ICA is difficult to use, complex and computationally heavy,which is why a lot of BCIs still use filters. [Bi et al., 2013] Extensive training of BCI users, featureextractors and classification algorithms, is necessary in order to reliably detect the users intentions.A way to minimize initial training is, to apply a pretrained subject-independent BCI [Vidaurre et al.,2011b]. However non-stationary changes in the EEG may cause the users mental actions to be poorlyrecognizable to the classification algorithms, ultimately compromising the classification accuracy.For that reason, BCI systems need to be regularly re-calibrated, which prevents independent long-term use of BCIs. [Bi et al., 2013]
BCI applicationFinally, the BCI application is the actual translation of mental commands into actions by a given ef-fector, such as moving forward in a wheelchair. [Minguillon et al., 2017] Different paradigms for con-trolling a BCI exists, such as P300, steady-state visually evoked potentials (SSVEP), event-relateddesynchronization/synchronization (ERD/-S) control [Bi et al., 2013] and slow cortical potentials(SCP) [Thomas et al., 2011].
P300 spellers detects the prominences of either auditory or visually evoked potential 300 ms afterstimulations. The potentials are most prominent if the subjects attends the source of the stimulation.Thereby the user can control the system by directing her or his attention towards different sourcesof stimuli. [Mak et al., 2011, Lule et al., 2013] In another attention based paradigm the user isexposed to multiple sources delivering a constant visual stimulation at different frequencies. Whenattending one of the sources a steady state visual potential is evoked (SSVEP). The frequency ofthe signal can be determined from the EEG and as for the P300 paradigms the direction of theusers attention can be determined. [Lee, 2012, Combaz et al., 2013].
However both of these paradigms need external stimuli, which is unsuitable for transportationor control type BCIs, as the users need to attend the stimulation from the BCI rather than thetask at hand, and is synchronous. ERD/-S and SCP driven BCIs utilize components of EEG, whichare modulated when the user performs different mental tasks and is therefore more suitable for anatural control paradigm. [Bi et al., 2013] Such self-paced BCIs will be the primary focus of thisstudy.
Real-life BCI challengesA problem exists generally for control BCIs, as the achievable information transfer rate (ITR) isinsufficient to provide enough BCI commands to control advanced rehabilitation technologies. ITRcan be optimized by lowering classification time, enhancing classification accuracy or enabling moreclasses in the BCI. [Tonet et al., 2008] Additionally, a very scarce effort has been made to test BCIsin a real-life setting, thus very little is known about BCI performance in real-life context [Minguillonet al., 2017].
BCI technology need a range of improvements before real-life applications are realizable [Bi et al.,2013]. This report will focus on enabling the signal processing part of the BCIs to be more robustduring unassisted long-term use.
Mainly, the problem within this context, is changes in the EEG signal, which can be related totwo things: Changes in artifacts present in the EEG and non-stationarity of EEG.
4
CHAPTER 1. INTRODUCTION
Artifacts in the EEG, are distortions of the signal caused by events or factors non-related tothe users intentions, such as orofacial muscle activity (blinks, teeth clenching etc.), cardiac muscleactivity and powerline noise. These artifacts needs appropriate handling as they are often of muchhigher amplitude than the relevant EEG signal. Furthermore, EEG is often studied in a controlledsetting such as a lab, but a variety of noise sources exists in the “outside world” that have yet tobe appropriately handled. This emphasizes the relevance of proper artifact rejection or correction.[Minguillon et al., 2017]
Non-stationarity can be defined, as a process that are neither strong nor wide-sense stationary,meaning that its statistical moments are dependent of time [Barkat, 2005]. During classification,events in the EEG are recognized as user intentions based on a model created from training datapreviously recorded. However non-stationarity implies that the model of intentions eventually willbe insufficient for classifying newly recorded events, possibly even hours after recording the trainingset. [Li and Zhang, 2010] Eventually retraining of the BCI may be necessary to cope with thechanges [Kilicarslan et al., 2016].
In a questionnaire study performed by Huggins et al. [2015] on people with spinal cord injuries,it was found that 77% of participants would accept a BCI performance of at least 80%, while 91%would accept a performance of at least 90% [Huggins et al., 2015]. This leaves very little roomfor performance decay, if it should not result in users rejecting the BCI. Therefore the focus ofthis report is to investigate the maintenance of classification accuracy, otherwise decaying due tonon-stationarity of the EEG.
1.1 Initiating problem statementExisting studies have shown that adaptation of BCIs may be utilized as a way to adress the issueof retraining of BCIs, due to non-stationarity of the EEG signal [Bi et al., 2013, Vidaurre et al.,2011a]. Hence it is of interest to investigate:
What adaptation methods exists, and how could adaptation be implemented to help realize areal-life BCI applications?
5

CHAPTER 1. INTRODUCTION
1.2 Literature searchIn order to investigate the research regarding adaptation of selfpaced BCI systems, a literaturesearch was conducted on the 9th of february, and a follow-up on error-related potentials the 6th ofmarch. The literature search was done in PubMed and Embase using the search strings specified intable 1.1.
Table 1.1: Search strings used in the literature review, and the resulting hits.
Database Search string HitsEmbase 9/02/2017 (online OR live OR ’real time’) AND (BCI OR ’brain computer in-
terface’ OR HMI OR HCI OR ’human machine interface’ OR humancomputer interface OR ’brain machine interface’) AND (EEG OR ’elec-troencephalography’ OR ’electroencephalogram’) AND (Adaptive ORupdate OR heuristic OR nonholonomic OR time-variant OR ’time vari-ant’ OR ’self calibrating’)
99
Embase 6/3/2017 ("error potential" OR Errp) and (EEG OR MEG OR fMRI OR ECOGOR MRI OR BCI)
25
Pubmed 9/02/2017 (online OR live OR ’real time’) AND (BCI OR ’brain computer in-terface’ OR HMI OR HCI OR ’human machine interface’ OR humancomputer interface OR ’brain machine interface’) AND (EEG OR ’elec-troencephalography’ OR ’electroencephalogram’) AND (Adaptive ORupdate OR heuristic OR nonholonomic OR time-variant OR ’time vari-ant’ OR ’self calibrating’)
88
Pubmed 6/3/2017 ("error potential" OR Errp) and (EEG OR MEG OR fMRI OR ECOGOR MRI OR BCI)
24
After removal of duplicates, 236 articles were identified. The identified literature was screenedfor relevance to the study in three rounds: Firstly based on title, secondly on abstract and finallyon full text review (see figure 1.2 for overview of excluded articles). Exclusion of an article wasbased on the following exclusion criterias:
• Studies not based on EEG or ECoG
• Did not concern adaptation of BCI systems or error-related potentials
• Animal studies
Figure 1.2: Progression of exclusion of identified literature.
Following the review of literature, 58 articles remained relevant to the study, and was furtheranalyzed.
6
Chapter 2Problem analysis
In the following, an analysis of the existing problems regarding non-stationarity of EEG, and existingefforts to adapt BCIs accordingly, will be presented. Secondly, knowledge of ErrPs and the feasibilityof ErrP guided BCI adaptation will be assesed.
2.1 Non-stationarityNon-stationarity is a potential problem in all BCIs assuming stationarity between classes [Krauledatand Naturwissenschaften, 2008], which is often the case in conventional BCIs [Hsu et al., 2016].Changes in electrode impedances, electrode positions, amplifier noise and environmental noise, addto the non-stationarity of EEG. [Sun and Zhang, 2006, Mohammadi et al., 2013]
Shenoy et al. [2006] investigated the importance of a series of reasons for non-stationarity inEEG. They found that the single most important reason for non-stationarity is the differencesbetween calibration sessions and online sessions. Here a difference in background activity wasobserved, such as the difference in demands for visual processing, in a calibration session and onlinesession with feedback. Additional noise sources such as participant fatigue and alertness, which mayfluctuate over time, also contributed to the nonstationarity. The differences in the feature spacethat they observed, could largely be corrected by displacing the decision plane of an initially trainedclassifier. An additional rotation of the decision plane further increased the classification accuracy,although relatively less compared to the translation. Despite the simplicity of the correction neededto maintain good classification performance between calibration and online sessions, the work ofShenoy et al. [2006] emphasizes the need for adaptation of online BCI systems.
2.2 Adaptation strategiesA way to deal with the non-stationarities in EEG is the application of adaptivity in the BCI system[Galan et al., 2008, Li and Zhang, 2010]. Adaptation can be done either in the preprocessing, featureextraction or in the classification of data [Hsu et al., 2016, Mohammadi et al., 2013, Li and Zhang,2010]. Continuous adaptation enables the BCI system to track the EEG state of the subject andmake appropriate corrections to maintain good classification accuracy [Li and Zhang, 2010].
Three main approaches for implementing adaptivity in BCIs have been identified: 1. Robustifi-cation of the features and/or classifiers, 2. adaptive filtering and 3. adaptivity of features and/orclassifiers.
2.2.1 Robust features and classifiersAssuming that the EEG, though non-stationary, varies within limits, it might be possible to eitherfind features less sensitive to drift in the EEG or construct classifiers general enough to modelthe time-dependent variance in the feature space caused by non-stationarity. Here A few studiesinvestigating robust signal processing are mentioned. A few studies using robust signal processingare mentioned here (for more studies identified using adaptive filtering see table 2.1).
Shin et al. [2015] proposed a sparsely representation classification (SRC) as a robust classifier,and compared it to support vector machines. The SRC consists of a library of feature vectors eachrepresenting one epoch of training data from a specific class. The classification of a new test epochis then made, by representing the test epoch as a linear combination of all training epochs, but
7
CHAPTER 2. PROBLEM ANALYSIS
minimizing the total scalars needed to represent the test using the training epoch library. Findingthe train epoch which contributes most to the minimal representation of the test epoch, identifiesthe class of the test, as the same class of the training epoch. Their comparison showed that SRChad a higher mean accuracy across 20 subjects (p<0.01), and that the SRC were consistently andprogressively better with higher signal-to-noise ratio as test data were gradually contaminated withgaussian noise. [Shin et al., 2015]
Galan et al. [2008] proposed to identify features that consistently performed best across differentconditions. To the extent that the variance across scenarios covers the variance that can be causedby non-stationarity the selected features will be as robust as possible. Unfortunately it is notreported how this feature selection strategy compared to traditional feature selection.
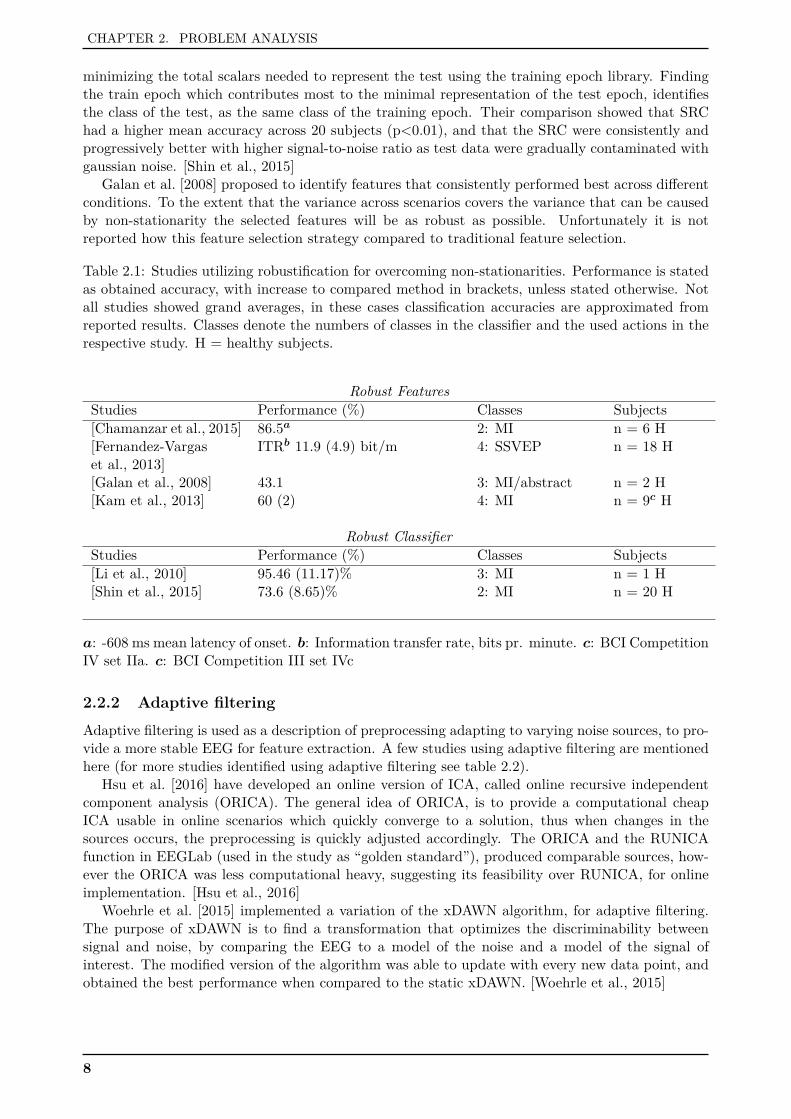
Table 2.1: Studies utilizing robustification for overcoming non-stationarities. Performance is statedas obtained accuracy, with increase to compared method in brackets, unless stated otherwise. Notall studies showed grand averages, in these cases classification accuracies are approximated fromreported results. Classes denote the numbers of classes in the classifier and the used actions in therespective study. H = healthy subjects.
Robust FeaturesStudies Performance (%) Classes Subjects[Chamanzar et al., 2015] 86.5a 2: MI n = 6 H[Fernandez-Vargaset al., 2013]
ITRb 11.9 (4.9) bit/m 4: SSVEP n = 18 H
[Galan et al., 2008] 43.1 3: MI/abstract n = 2 H[Kam et al., 2013] 60 (2) 4: MI n = 9c H
Robust ClassifierStudies Performance (%) Classes Subjects[Li et al., 2010] 95.46 (11.17)% 3: MI n = 1 H[Shin et al., 2015] 73.6 (8.65)% 2: MI n = 20 H
a: -608 ms mean latency of onset. b: Information transfer rate, bits pr. minute. c: BCI CompetitionIV set IIa. c: BCI Competition III set IVc
2.2.2 Adaptive filteringAdaptive filtering is used as a description of preprocessing adapting to varying noise sources, to pro-vide a more stable EEG for feature extraction. A few studies using adaptive filtering are mentionedhere (for more studies identified using adaptive filtering see table 2.2).
Hsu et al. [2016] have developed an online version of ICA, called online recursive independentcomponent analysis (ORICA). The general idea of ORICA, is to provide a computational cheapICA usable in online scenarios which quickly converge to a solution, thus when changes in thesources occurs, the preprocessing is quickly adjusted accordingly. The ORICA and the RUNICAfunction in EEGLab (used in the study as “golden standard”), produced comparable sources, how-ever the ORICA was less computational heavy, suggesting its feasibility over RUNICA, for onlineimplementation. [Hsu et al., 2016]
Woehrle et al. [2015] implemented a variation of the xDAWN algorithm, for adaptive filtering.The purpose of xDAWN is to find a transformation that optimizes the discriminability betweensignal and noise, by comparing the EEG to a model of the noise and a model of the signal ofinterest. The modified version of the algorithm was able to update with every new data point, andobtained the best performance when compared to the static xDAWN. [Woehrle et al., 2015]
8
CHAPTER 2. PROBLEM ANALYSIS
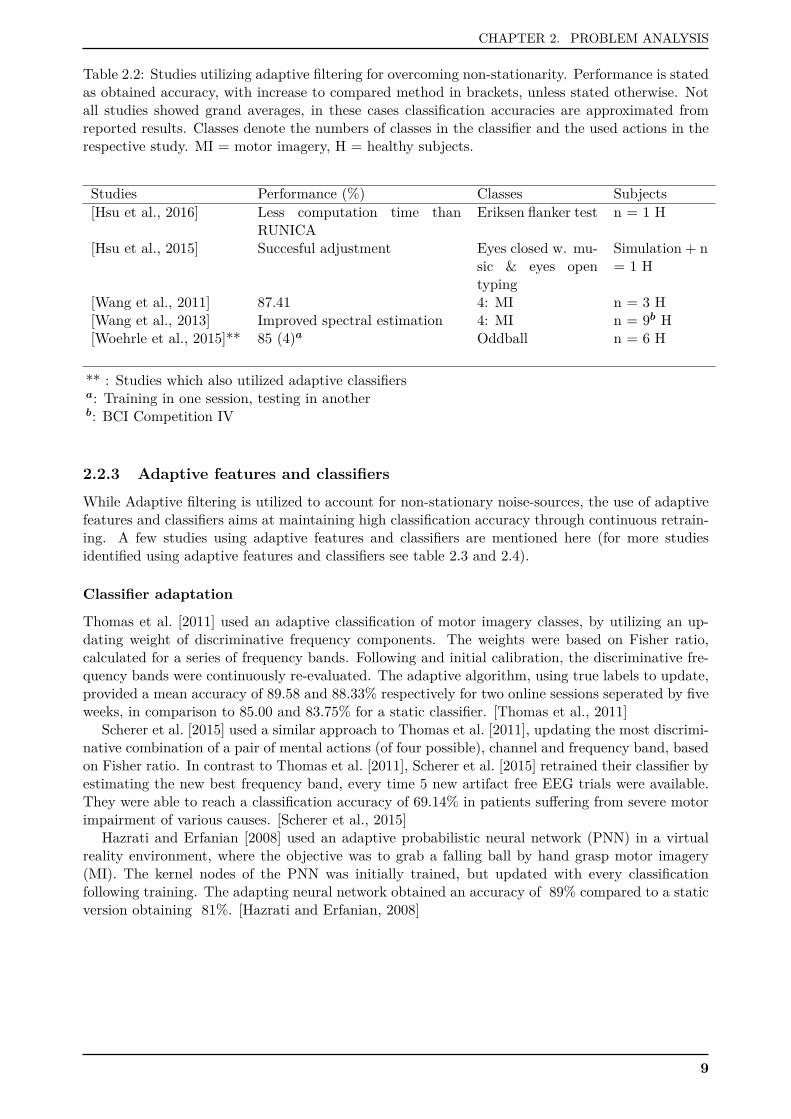
Table 2.2: Studies utilizing adaptive filtering for overcoming non-stationarity. Performance is statedas obtained accuracy, with increase to compared method in brackets, unless stated otherwise. Notall studies showed grand averages, in these cases classification accuracies are approximated fromreported results. Classes denote the numbers of classes in the classifier and the used actions in therespective study. MI = motor imagery, H = healthy subjects.
Studies Performance (%) Classes Subjects[Hsu et al., 2016] Less computation time than
RUNICAEriksen flanker test n = 1 H
[Hsu et al., 2015] Succesful adjustment Eyes closed w. mu-sic & eyes opentyping
Simulation + n= 1 H
[Wang et al., 2011] 87.41 4: MI n = 3 H[Wang et al., 2013] Improved spectral estimation 4: MI n = 9b H[Woehrle et al., 2015]** 85 (4)a Oddball n = 6 H
** : Studies which also utilized adaptive classifiersa: Training in one session, testing in anotherb: BCI Competition IV
2.2.3 Adaptive features and classifiersWhile Adaptive filtering is utilized to account for non-stationary noise-sources, the use of adaptivefeatures and classifiers aims at maintaining high classification accuracy through continuous retrain-ing. A few studies using adaptive features and classifiers are mentioned here (for more studiesidentified using adaptive features and classifiers see table 2.3 and 2.4).
Classifier adaptation
Thomas et al. [2011] used an adaptive classification of motor imagery classes, by utilizing an up-dating weight of discriminative frequency components. The weights were based on Fisher ratio,calculated for a series of frequency bands. Following and initial calibration, the discriminative fre-quency bands were continuously re-evaluated. The adaptive algorithm, using true labels to update,provided a mean accuracy of 89.58 and 88.33% respectively for two online sessions seperated by fiveweeks, in comparison to 85.00 and 83.75% for a static classifier. [Thomas et al., 2011]
Scherer et al. [2015] used a similar approach to Thomas et al. [2011], updating the most discrimi-native combination of a pair of mental actions (of four possible), channel and frequency band, basedon Fisher ratio. In contrast to Thomas et al. [2011], Scherer et al. [2015] retrained their classifier byestimating the new best frequency band, every time 5 new artifact free EEG trials were available.They were able to reach a classification accuracy of 69.14% in patients suffering from severe motorimpairment of various causes. [Scherer et al., 2015]
Hazrati and Erfanian [2008] used an adaptive probabilistic neural network (PNN) in a virtualreality environment, where the objective was to grab a falling ball by hand grasp motor imagery(MI). The kernel nodes of the PNN was initially trained, but updated with every classificationfollowing training. The adapting neural network obtained an accuracy of 89% compared to a staticversion obtaining 81%. [Hazrati and Erfanian, 2008]
9
CHAPTER 2. PROBLEM ANALYSIS
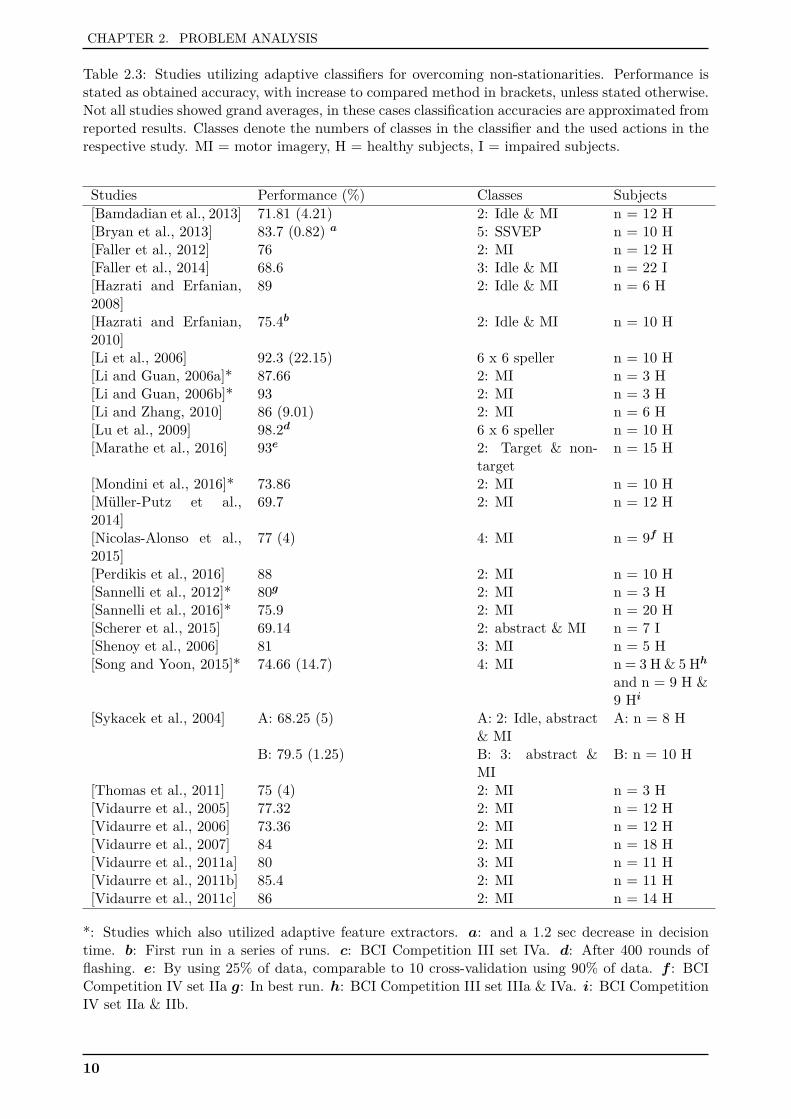
Table 2.3: Studies utilizing adaptive classifiers for overcoming non-stationarities. Performance isstated as obtained accuracy, with increase to compared method in brackets, unless stated otherwise.Not all studies showed grand averages, in these cases classification accuracies are approximated fromreported results. Classes denote the numbers of classes in the classifier and the used actions in therespective study. MI = motor imagery, H = healthy subjects, I = impaired subjects.
Studies Performance (%) Classes Subjects[Bamdadian et al., 2013] 71.81 (4.21) 2: Idle & MI n = 12 H[Bryan et al., 2013] 83.7 (0.82) a 5: SSVEP n = 10 H[Faller et al., 2012] 76 2: MI n = 12 H[Faller et al., 2014] 68.6 3: Idle & MI n = 22 I[Hazrati and Erfanian,2008]
89 2: Idle & MI n = 6 H
[Hazrati and Erfanian,2010]
75.4b 2: Idle & MI n = 10 H
[Li et al., 2006] 92.3 (22.15) 6 x 6 speller n = 10 H[Li and Guan, 2006a]* 87.66 2: MI n = 3 H[Li and Guan, 2006b]* 93 2: MI n = 3 H[Li and Zhang, 2010] 86 (9.01) 2: MI n = 6 H[Lu et al., 2009] 98.2d 6 x 6 speller n = 10 H[Marathe et al., 2016] 93e 2: Target & non-
targetn = 15 H
[Mondini et al., 2016]* 73.86 2: MI n = 10 H[Müller-Putz et al.,2014]
69.7 2: MI n = 12 H
[Nicolas-Alonso et al.,2015]
77 (4) 4: MI n = 9f H
[Perdikis et al., 2016] 88 2: MI n = 10 H[Sannelli et al., 2012]* 80g 2: MI n = 3 H[Sannelli et al., 2016]* 75.9 2: MI n = 20 H[Scherer et al., 2015] 69.14 2: abstract & MI n = 7 I[Shenoy et al., 2006] 81 3: MI n = 5 H[Song and Yoon, 2015]* 74.66 (14.7) 4: MI n = 3 H & 5 Hh
and n = 9 H &9 Hi
[Sykacek et al., 2004] A: 68.25 (5) A: 2: Idle, abstract& MI
A: n = 8 H
B: 79.5 (1.25) B: 3: abstract &MI
B: n = 10 H
[Thomas et al., 2011] 75 (4) 2: MI n = 3 H[Vidaurre et al., 2005] 77.32 2: MI n = 12 H[Vidaurre et al., 2006] 73.36 2: MI n = 12 H[Vidaurre et al., 2007] 84 2: MI n = 18 H[Vidaurre et al., 2011a] 80 3: MI n = 11 H[Vidaurre et al., 2011b] 85.4 2: MI n = 11 H[Vidaurre et al., 2011c] 86 2: MI n = 14 H
*: Studies which also utilized adaptive feature extractors. a: and a 1.2 sec decrease in decisiontime. b: First run in a series of runs. c: BCI Competition III set IVa. d: After 400 rounds offlashing. e: By using 25% of data, comparable to 10 cross-validation using 90% of data. f : BCICompetition IV set IIa g: In best run. h: BCI Competition III set IIIa & IVa. i: BCI CompetitionIV set IIa & IIb.
10
CHAPTER 2. PROBLEM ANALYSIS
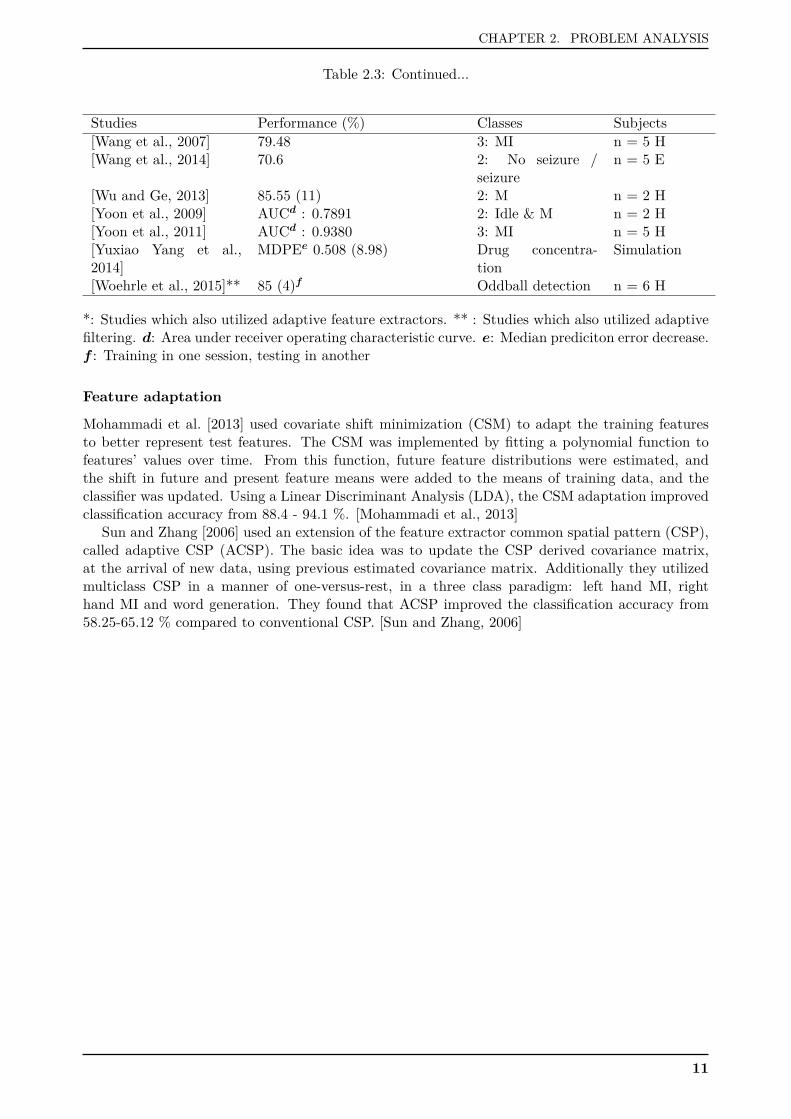
Table 2.3: Continued...
Studies Performance (%) Classes Subjects[Wang et al., 2007] 79.48 3: MI n = 5 H[Wang et al., 2014] 70.6 2: No seizure /
seizuren = 5 E
[Wu and Ge, 2013] 85.55 (11) 2: M n = 2 H[Yoon et al., 2009] AUCd : 0.7891 2: Idle & M n = 2 H[Yoon et al., 2011] AUCd : 0.9380 3: MI n = 5 H[Yuxiao Yang et al.,2014]
MDPEe 0.508 (8.98) Drug concentra-tion
Simulation
[Woehrle et al., 2015]** 85 (4)f Oddball detection n = 6 H
*: Studies which also utilized adaptive feature extractors. ** : Studies which also utilized adaptivefiltering. d: Area under receiver operating characteristic curve. e: Median prediciton error decrease.f : Training in one session, testing in another
Feature adaptation
Mohammadi et al. [2013] used covariate shift minimization (CSM) to adapt the training featuresto better represent test features. The CSM was implemented by fitting a polynomial function tofeatures’ values over time. From this function, future feature distributions were estimated, andthe shift in future and present feature means were added to the means of training data, and theclassifier was updated. Using a Linear Discriminant Analysis (LDA), the CSM adaptation improvedclassification accuracy from 88.4 - 94.1 %. [Mohammadi et al., 2013]
Sun and Zhang [2006] used an extension of the feature extractor common spatial pattern (CSP),called adaptive CSP (ACSP). The basic idea was to update the CSP derived covariance matrix,at the arrival of new data, using previous estimated covariance matrix. Additionally they utilizedmulticlass CSP in a manner of one-versus-rest, in a three class paradigm: left hand MI, righthand MI and word generation. They found that ACSP improved the classification accuracy from58.25-65.12 % compared to conventional CSP. [Sun and Zhang, 2006]
11
CHAPTER 2. PROBLEM ANALYSIS
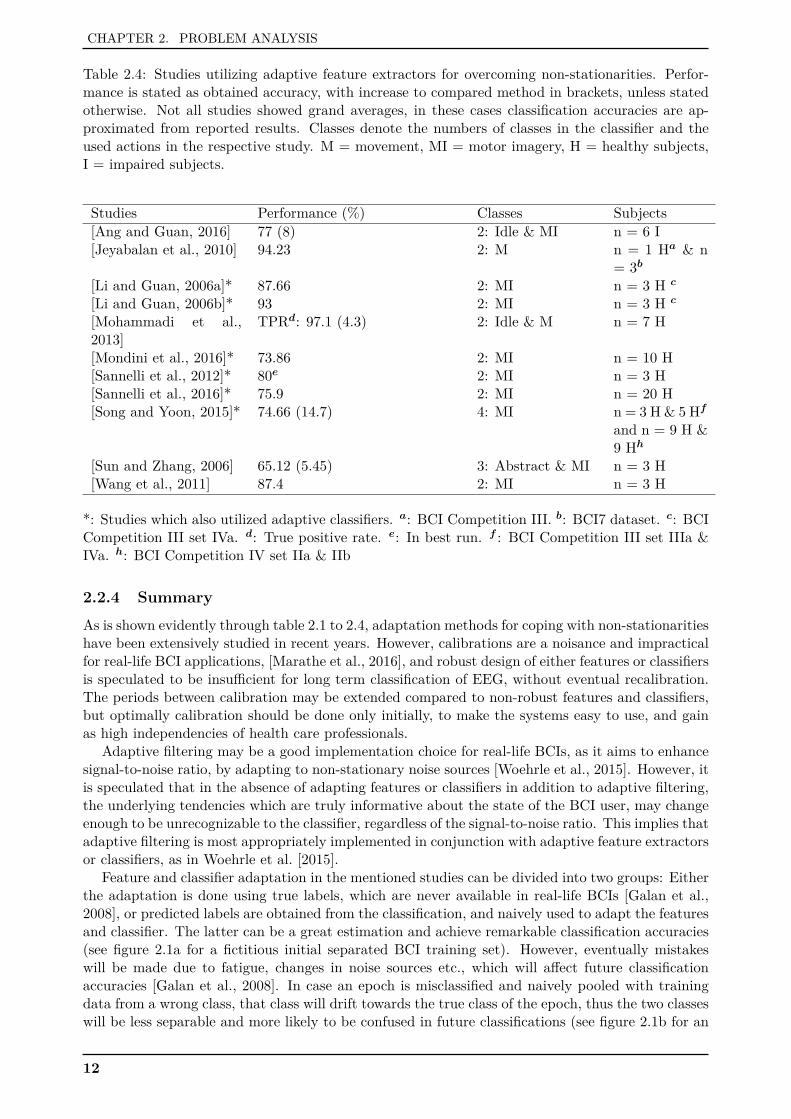
Table 2.4: Studies utilizing adaptive feature extractors for overcoming non-stationarities. Perfor-mance is stated as obtained accuracy, with increase to compared method in brackets, unless statedotherwise. Not all studies showed grand averages, in these cases classification accuracies are ap-proximated from reported results. Classes denote the numbers of classes in the classifier and theused actions in the respective study. M = movement, MI = motor imagery, H = healthy subjects,I = impaired subjects.
Studies Performance (%) Classes Subjects[Ang and Guan, 2016] 77 (8) 2: Idle & MI n = 6 I[Jeyabalan et al., 2010] 94.23 2: M n = 1 Ha & n
= 3b[Li and Guan, 2006a]* 87.66 2: MI n = 3 H c
[Li and Guan, 2006b]* 93 2: MI n = 3 H c
[Mohammadi et al.,2013]
TPRd: 97.1 (4.3) 2: Idle & M n = 7 H
[Mondini et al., 2016]* 73.86 2: MI n = 10 H[Sannelli et al., 2012]* 80e 2: MI n = 3 H[Sannelli et al., 2016]* 75.9 2: MI n = 20 H[Song and Yoon, 2015]* 74.66 (14.7) 4: MI n = 3 H & 5 Hf
and n = 9 H &9 Hh
[Sun and Zhang, 2006] 65.12 (5.45) 3: Abstract & MI n = 3 H[Wang et al., 2011] 87.4 2: MI n = 3 H
*: Studies which also utilized adaptive classifiers. a: BCI Competition III. b: BCI7 dataset. c: BCICompetition III set IVa. d: True positive rate. e: In best run. f : BCI Competition III set IIIa &IVa. h: BCI Competition IV set IIa & IIb
2.2.4 SummaryAs is shown evidently through table 2.1 to 2.4, adaptation methods for coping with non-stationaritieshave been extensively studied in recent years. However, calibrations are a noisance and impracticalfor real-life BCI applications, [Marathe et al., 2016], and robust design of either features or classifiersis speculated to be insufficient for long term classification of EEG, without eventual recalibration.The periods between calibration may be extended compared to non-robust features and classifiers,but optimally calibration should be done only initially, to make the systems easy to use, and gainas high independencies of health care professionals.
Adaptive filtering may be a good implementation choice for real-life BCIs, as it aims to enhancesignal-to-noise ratio, by adapting to non-stationary noise sources [Woehrle et al., 2015]. However, itis speculated that in the absence of adapting features or classifiers in addition to adaptive filtering,the underlying tendencies which are truly informative about the state of the BCI user, may changeenough to be unrecognizable to the classifier, regardless of the signal-to-noise ratio. This implies thatadaptive filtering is most appropriately implemented in conjunction with adaptive feature extractorsor classifiers, as in Woehrle et al. [2015].
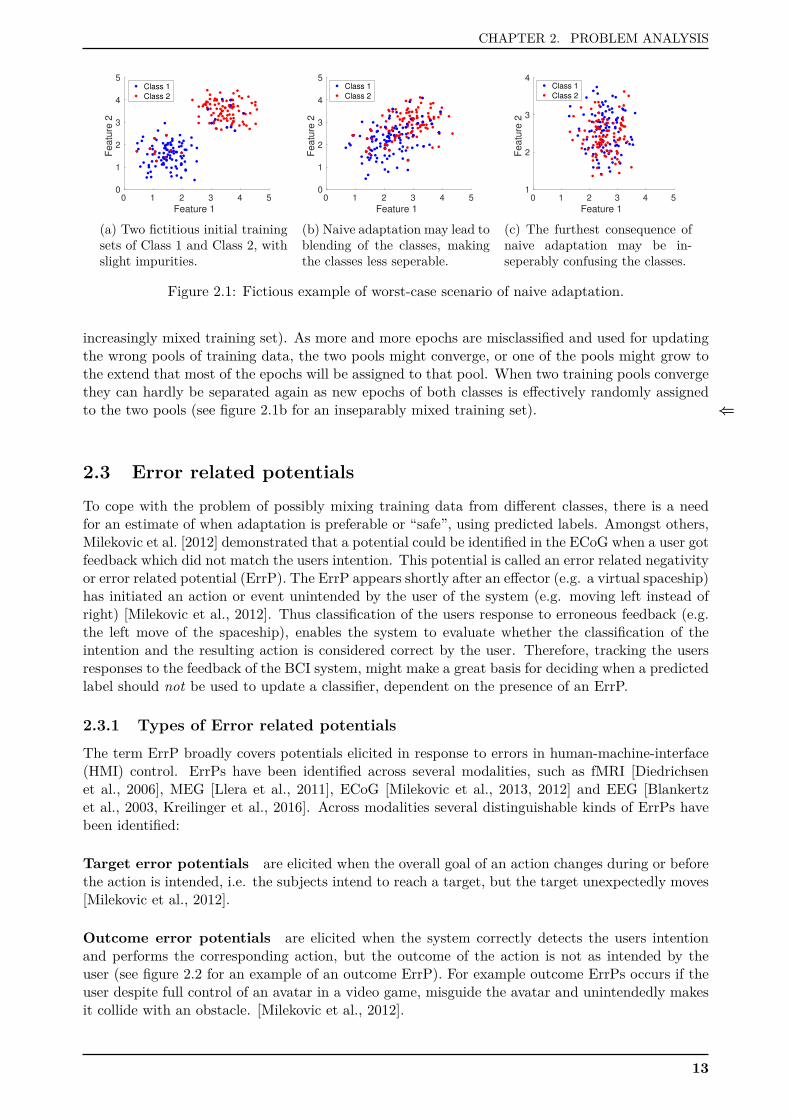
Feature and classifier adaptation in the mentioned studies can be divided into two groups: Eitherthe adaptation is done using true labels, which are never available in real-life BCIs [Galan et al.,2008], or predicted labels are obtained from the classification, and naively used to adapt the featuresand classifier. The latter can be a great estimation and achieve remarkable classification accuracies(see figure 2.1a for a fictitious initial separated BCI training set). However, eventually mistakeswill be made due to fatigue, changes in noise sources etc., which will affect future classificationaccuracies [Galan et al., 2008]. In case an epoch is misclassified and naively pooled with trainingdata from a wrong class, that class will drift towards the true class of the epoch, thus the two classeswill be less separable and more likely to be confused in future classifications (see figure 2.1b for an
12
CHAPTER 2. PROBLEM ANALYSIS
0 1 2 3 4 5
Feature 1
0
1
2
3
4
5
Fe
atu
re 2
Class 1
Class 2
(a) Two fictitious initial trainingsets of Class 1 and Class 2, withslight impurities.
0 1 2 3 4 5
Feature 1
0
1
2
3
4
5
Fe
atu
re 2
Class 1
Class 2
(b) Naive adaptation may lead toblending of the classes, makingthe classes less seperable.
0 1 2 3 4 5
Feature 1
1
2
3
4
Fe
atu
re 2
Class 1
Class 2
(c) The furthest consequence ofnaive adaptation may be in-seperably confusing the classes.
Figure 2.1: Fictious example of worst-case scenario of naive adaptation.
increasingly mixed training set). As more and more epochs are misclassified and used for updatingthe wrong pools of training data, the two pools might converge, or one of the pools might grow tothe extend that most of the epochs will be assigned to that pool. When two training pools convergethey can hardly be separated again as new epochs of both classes is effectively randomly assignedto the two pools (see figure 2.1b for an inseparably mixed training set). ⇐
2.3 Error related potentialsTo cope with the problem of possibly mixing training data from different classes, there is a needfor an estimate of when adaptation is preferable or “safe”, using predicted labels. Amongst others,Milekovic et al. [2012] demonstrated that a potential could be identified in the ECoG when a user gotfeedback which did not match the users intention. This potential is called an error related negativityor error related potential (ErrP). The ErrP appears shortly after an effector (e.g. a virtual spaceship)has initiated an action or event unintended by the user of the system (e.g. moving left instead ofright) [Milekovic et al., 2012]. Thus classification of the users response to erroneous feedback (e.g.the left move of the spaceship), enables the system to evaluate whether the classification of theintention and the resulting action is considered correct by the user. Therefore, tracking the usersresponses to the feedback of the BCI system, might make a great basis for deciding when a predictedlabel should not be used to update a classifier, dependent on the presence of an ErrP.
2.3.1 Types of Error related potentialsThe term ErrP broadly covers potentials elicited in response to errors in human-machine-interface(HMI) control. ErrPs have been identified across several modalities, such as fMRI [Diedrichsenet al., 2006], MEG [Llera et al., 2011], ECoG [Milekovic et al., 2013, 2012] and EEG [Blankertzet al., 2003, Kreilinger et al., 2016]. Across modalities several distinguishable kinds of ErrPs havebeen identified:
Target error potentials are elicited when the overall goal of an action changes during or beforethe action is intended, i.e. the subjects intend to reach a target, but the target unexpectedly moves[Milekovic et al., 2012].
Outcome error potentials are elicited when the system correctly detects the users intentionand performs the corresponding action, but the outcome of the action is not as intended by theuser (see figure 2.2 for an example of an outcome ErrP). For example outcome ErrPs occurs if theuser despite full control of an avatar in a video game, misguide the avatar and unintendedly makesit collide with an obstacle. [Milekovic et al., 2012].
13

CHAPTER 2. PROBLEM ANALYSIS
Execution error potentials are elicited when the HMI does not perform the action intendedby the user. [Milekovic et al., 2012]. This type of ErrP is very relevant when considering BCIapplications, as the detection of an execution ErrP indicates misclassification of the user intention.
In figure 2.2 morphological properties of execution ErrPs is illustrated compared to outcomeErrPs. In the spectral domain the ErrP contained most energy in the gamma and theta band 2.3.Milekovic et al. [2012] additionally investigated the evocation latency of execution ErrPs, and foundthat these most frequenctly peaked 600 ms following the feedback triggering the ErrP. Furthermorethey found that 90% of elicited execution ErrPs peaked within the time window 100-800 ms followingthe triggering event.
Figure 2.2: Temporal representation of outcome (blue) and execution (red) ECoG ErrPs followingfeedback (time 0 ms), recorded from the right parietal region (red dot). Left side: Morphology ofoutcome and execution ErrPs. Right side: Difference in signal to noise ratio between ErrPs andbaseline. Upper and lower half: Representation of low (0 to 7.85 Hz) and high (60 to 128 hz)frequency components, respectively. Modified from [Milekovic et al., 2012].
Figure 2.3: Joint time-frequency representation of Execution (left) and Outcome (right) ECoGErrPs following feedback (time 0 ms), recorded from the right temporal region. Activity is found inthe gamma band and for outcome ErrPs also in the delta and theta band. Modified from [Milekovicet al., 2012].
14
CHAPTER 2. PROBLEM ANALYSIS
2.3.2 Studies utilizing ErrP in BCIsMultiple studies have already studied the impact of utilizing ErrPs in BCIs. It has been found thatthe characteristics of the ErrP is dependent on the experimental paradigm [Milekovic et al., 2012,Diedrichsen et al., 2006]. In Milekovic et al. [2012] it was demonstrated that outcome and executionErrPs could be discriminated with and accuracy of 83 % or more. Thus characteristics of ErrPsdepends on the paradigm in which they are elicited.
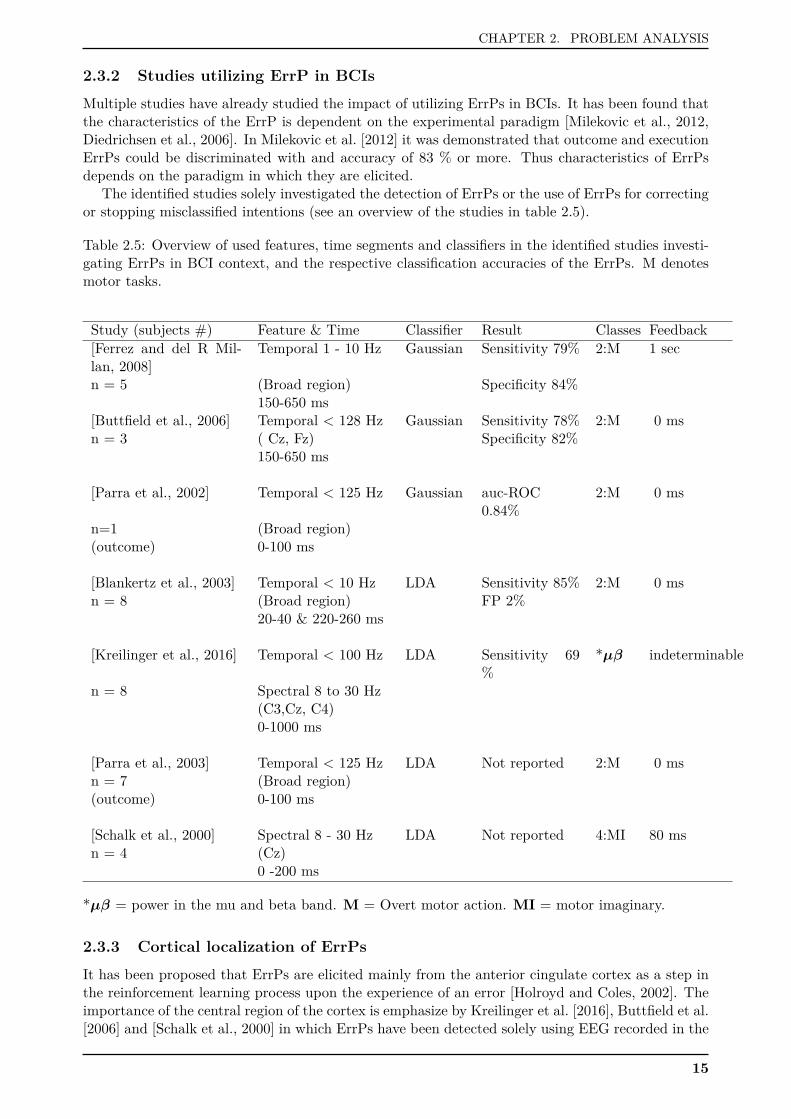
The identified studies solely investigated the detection of ErrPs or the use of ErrPs for correctingor stopping misclassified intentions (see an overview of the studies in table 2.5).
Table 2.5: Overview of used features, time segments and classifiers in the identified studies investi-gating ErrPs in BCI context, and the respective classification accuracies of the ErrPs. M denotesmotor tasks.
Study (subjects #) Feature & Time Classifier Result Classes Feedback[Ferrez and del R Mil-lan, 2008]
Temporal 1 - 10 Hz Gaussian Sensitivity 79% 2:M 1 sec
n = 5 (Broad region) Specificity 84%150-650 ms
[Buttfield et al., 2006] Temporal < 128 Hz Gaussian Sensitivity 78% 2:M 0 msn = 3 ( Cz, Fz) Specificity 82%
150-650 ms
[Parra et al., 2002] Temporal < 125 Hz Gaussian auc-ROC0.84%
2:M 0 ms
n=1 (Broad region)(outcome) 0-100 ms
[Blankertz et al., 2003] Temporal < 10 Hz LDA Sensitivity 85% 2:M 0 msn = 8 (Broad region) FP 2%
20-40 & 220-260 ms
[Kreilinger et al., 2016] Temporal < 100 Hz LDA Sensitivity 69%
*µβ indeterminable
n = 8 Spectral 8 to 30 Hz(C3,Cz, C4)0-1000 ms
[Parra et al., 2003] Temporal < 125 Hz LDA Not reported 2:M 0 msn = 7 (Broad region)(outcome) 0-100 ms
[Schalk et al., 2000] Spectral 8 - 30 Hz LDA Not reported 4:MI 80 msn = 4 (Cz)
0 -200 ms
*µβ = power in the mu and beta band. M = Overt motor action. MI = motor imaginary.
2.3.3 Cortical localization of ErrPsIt has been proposed that ErrPs are elicited mainly from the anterior cingulate cortex as a step inthe reinforcement learning process upon the experience of an error [Holroyd and Coles, 2002]. Theimportance of the central region of the cortex is emphasize by Kreilinger et al. [2016], Buttfield et al.[2006] and [Schalk et al., 2000] in which ErrPs have been detected solely using EEG recorded in the
15
CHAPTER 2. PROBLEM ANALYSIS
central region. Furthermore, Blankertz et al. [2003], and [Ferrez and del R Millan, 2008] confirmedthat ErrPs were prominent in this region.
Time
In Schalk et al. [2000], Blankertz et al. [2003], Parra et al. [2003], and [Parra et al., 2002] it wasfound that the ErrP can be detected within the first 260 ms of the EEG post feedback. In contrastit was found that using ECoG, the ErrP is most prominent after 600 ms, and most informationabout the ErrP can be found within the first 800 ms. Similarly Ferrez and del R Millan [2008] foundthat ErrP peaks occurs within the first 800 ms post stimuli.
Feature types
Ferrez and del R Millan [2008], Buttfield et al. [2006], Parra et al. [2002], Blankertz et al. [2003],Kreilinger et al. [2016], and [Parra et al., 2003] all used simple temporal features to detect ErrPs.Either single samples or means of small time segments were used as features. Ferrez and del R Millan[2008], and [Blankertz et al., 2003] did only use frequency components below 10 Hz for calculatingthe temporal features, whereas Buttfield et al. [2006], Parra et al. [2002, 2003], and [Kreilinger et al.,2016] utilized frequency components up to between 100 and 128 Hz. Futhermore Kreilinger et al.[2016], and [Schalk et al., 2000] utilized the power of spectral bands between 8 and 30 Hz (mu,alpha, and beta band).
Classifier performance
As the main focus of the reported studies were intention correction sensitivity and specificity isnot reported for all studies. Ferrez and del R Millan [2008], Buttfield et al. [2006], Blankertz et al.[2003], and [Kreilinger et al., 2016] reported ErrP sensitivities between 69 % and 85 %. In Ferrezand del R Millan [2008], and [Buttfield et al., 2006] the specificity was reported to be between 82%and 84 %. Finally a review from 2014 concludes that accuracy in ErrP detection is commonly about80 % [Chavarriaga et al., 2014].
Summary
Several studies have detected ErrPs in the EEG and demonstrated feasibility of using ErrPs to cor-rect erroneous classification of control classes. However the potential of using ErrP for continuouslyadaptation of BCIs using active classes is uncovered. Due to the presence of an execution ErrP inthe case of a erroneous BCI command, it seems feasible to use execution ErrP (henceforth referredto as only ErrP) for determining whether predicted labels can be used for adaptation of featuresand classifiers in BCIs.
16
CHAPTER 2. PROBLEM ANALYSIS
2.4 Problem statementThe aim of this project was to determine to what extend EEG based ErrP detection is feasible foradaptation, to enhance the naive adaptation of classifiers. The feasibility of ErrP driven adaptationrelies on a set of assumptions related to the detection of ErrPs. In this study, three criterias forfeasible ErrP driven adaptation was established:
1. Highly sensitive ErrP detectionAs adaption based on predicted labels may be inappropriate, as non-stationarity can lead to mixingof classes, it is important that ErrPs are correctly classified. Specifically it is essential that thesensitivity of the ErrP detection is high, leaving the chance of false positives less important. Thisis true as online use of a BCIs will generate a lot of epochs belonging to the control class, thusa sufficient amount of epochs usable for adaptation will remain, although not all control epochswithout ErrPs are correctly identified. Should this criteria not be met, a BCI would not benefitfrom ErrP detection, as too many ErrPs would be included in the re-training data. In this workthe quality of the system is evaluated as the ratio of non-errps in the adaptation training set versuserrps.
2. The detection of ErrPs should be intention independentThe properties of an ErrP might depend on both the control class, and the machines response tothat control signal. If so, potentionally one ErrP and non-ErrP subclass exists for each combinationof control class and machine response. As it cannot be assumed that the classification of theintention is correct, information about what intention has been performed prior to classification ofthe response to feedback, cannot be available during the classification of response. Thus all ErrPsubclasses must be distinguishable from all non-ErrP subclasses. Effectively it must be possible topool all ErrP subclasses and all non-ErrP subclasses in the ErrP classifier, and obtain sufficientclassification accuracy. Should this criteria not be met, the BCI would either be limited in thenumber of classes possible to implement and benefit from ErrP detection, or the BCI would notbenefit at all.
3. Naive adaptation of the ErrP-classifier should be possibleIn an adaptive BCI, it has been proven necessary to adapt the control classes, thus it is only naturalto presume that adaptation of a ErrP classifier is needed as well. The adaptation of the controlclasses can be guided by ErrP classification, but the adaptation of the ErrP classes can only be donenaively. Thus it is necessary to prove that ErrP and non-ErrP classes can be successfully adaptednaively. Given that the second criteria is met, classification of RTF remains a two class problem,no matter the number of intention classes utilized in the BCI. In Ferrez and del R Millan [2008]a classifier was trained to discriminate between ErrPs and non-ErrP and obtained an accuracy of83.8 %. When tested on data recorded up to three months before the training data the classifierobtained a similar accuracy (81.4 %). This indicates that long term detection of ErrPs might bepossible using either robust classifiers or naive adaptation.
Though not exhaustively, previous work provides evidence for the first and third criteria. Es-pecially longterm detection of ErrPs should be further investigated. However the primary aim inthe current study was to investigate the second criteria. Furthermore, as mainly temporal featureshas been investigated in EEG literature, feasibility of both temporal and spectral features for ErrPdetection was investigated. This gives the following scientific questions:
Can ErrPs reliably be elicited and classified for different control classes, and canErrPs be detected independently of the control-class prior to the ErrP?
17

Chapter 3Methods
In the following, all methodological considerations and procedures will be described. Firstly thedesign of the error-potential elicitation experiment will be described. Secondly the dataanalysisfollowing the experiment will be clarified.
3.1 Subjects and Experimental setup12 subjects (6 females and 2 left-handed) of mean age 24.3 ± 2.3, participated in the study. Nonehad any known neurological disorders.
A NuAmp EEG-recorder was used to record the EEG from 16 electrodes positioned accordingto the international 10/20 standard in position: Fp1, Fp2, F3, Fz, F4, FT7, FT8, C3, Cz, C4, TP7,TP8, P3, P4, O1 and O2, in order to cover all cortical regions. Additionally an EMG electrode wasplaced above the left eyebrow to act as an EOG electrode. All electrodes were grounded to the leftearlope, and referred to the right, although in cases where subjects had small earlopes, the groundand the reference electrodes were placed behind the ears on the mastoid process. Recording wasdone using Neuroscan 4.5 software, using a sampling frequency of 500 Hz.
3.2 ExperimentTo asses the feasibility of ErrP detection for adaptation in BCIs the paradigms for elecitation ofthe ErrPs should resemble a realistic use case of a BCI. Thus ideally the ErrPs should be recordedduring use of an online BCI. Implementation of a such a system was not possible within the timeframe of this project. Instead three paradigms were designed inspired by studies like Blankertz et al.[2003] and Milekovic et al. [2012], whom showed that simple gamified tasks could elicit executionErrPs, when the system responded unexpectedly to control commands from the subjects.
All subjects completed three separate paradigms: Overt arrow paradigm (OAP), covert arrowparadigm (CAP) and the game paradigm (GP). The order in which the subjects completed theparadigms followed a cross-design. Herein each paradigm were equally often completed as the fist,second and third. With 12 subjects, each order of the three paradigms were completed by twosubjects. After completion of one session of each paradigm, all three paradigms were repeated.The sessions were repeated to ensure a sufficient amount of data, while limiting the duration ofeach session, to avoid inducing habituation and fatigue. During all recordings the subjects wereseated in a comfortable chair facing a monitor and instructed to minimize blinking and unneccessarymovements.
The overt arrow paradigm (OAP)
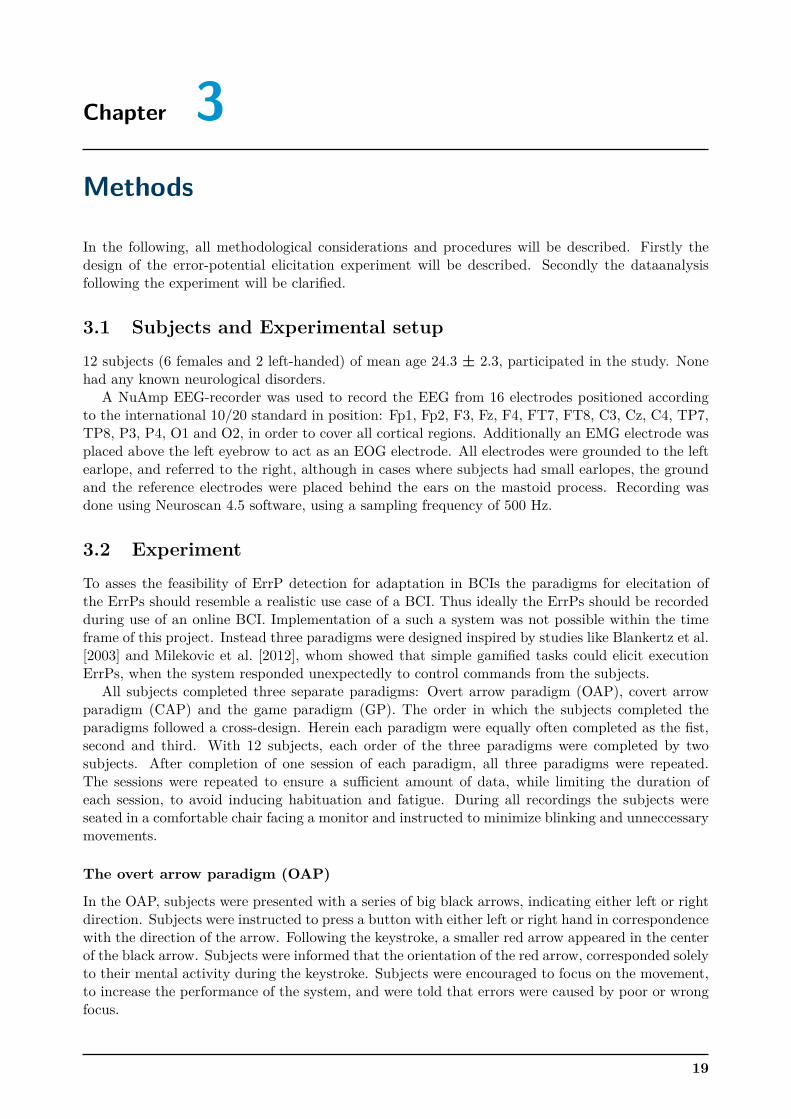
In the OAP, subjects were presented with a series of big black arrows, indicating either left or rightdirection. Subjects were instructed to press a button with either left or right hand in correspondencewith the direction of the arrow. Following the keystroke, a smaller red arrow appeared in the centerof the black arrow. Subjects were informed that the orientation of the red arrow, corresponded solelyto their mental activity during the keystroke. Subjects were encouraged to focus on the movement,to increase the performance of the system, and were told that errors were caused by poor or wrongfocus.
19
CHAPTER 3. METHODS
However, the orientation of the red arrow was independent of the subjects mental activity. In 85% of the trials the orientation of the red arrow corresponded to the orientation of the black arrow,giving the subjects feedback corresponding to a correctly translated intention. In the last 15 % ofthe trials, the red arrow pointed in the opposite direction of the black, giving the subjects feedbackcorresponding to an erroneous translation of the intention. The subjects’ mental response to thecorrect and erroneous feedback was used for non-ErrP and ErrP detection.
Each trial consisted of three phases: A preparation phase of random duration between 1 and3 seconds, a cue phase of subject controlled duration, and a feedback phase of 1 second. The cuephase lasted until the subject hit a key with either right or left hand. Trials were completed inblocks of 20 repetitions. Between blocks subjects’ had a small break which lasted 1 min or until thesubject felt ready to continue. A total of 60 erroneous trials and 340 correct trials were recorded.The timeline of the OAP phases are depicted in figure 3.1.
Figure 3.1: User interface and timeline of one trial in the OAP. The first frame indicates that a trialwill soon begin. The second frame cues the subject to perform a keystroke. This cue lasts until thethe keystroke is completed. The third frame is presented 40 ms after the keystroke and indicatesthe systems response to the users’ mental action, and lasts for 1 s. The EEG recorded during thisframe constitutes one epoch of data, used for ErrP detection.
The covert arrow paradigm (CAP)
The CAP was conducted similarly to the OAP, although subjects were instructed to only use mentalstrategies to control the red arrow, without any overt movement. Subjects were instructed to useMI and/or sensations in the right or left hand/arm corresponding to the direction of the blackarrow. Prior to recording, subjects were trained in performing MI, until they felt comfortable intheir performance.
The CAP showed a countdown following the presentation of the black arrow. The countdownshowed the numbers "3, 2, 1", one at a time with one second delay. Subjects were instructed toperform the mental activity during the countdown, which ended at the time "0" could be expected,resulting in the presentation of the red feedback arrow.
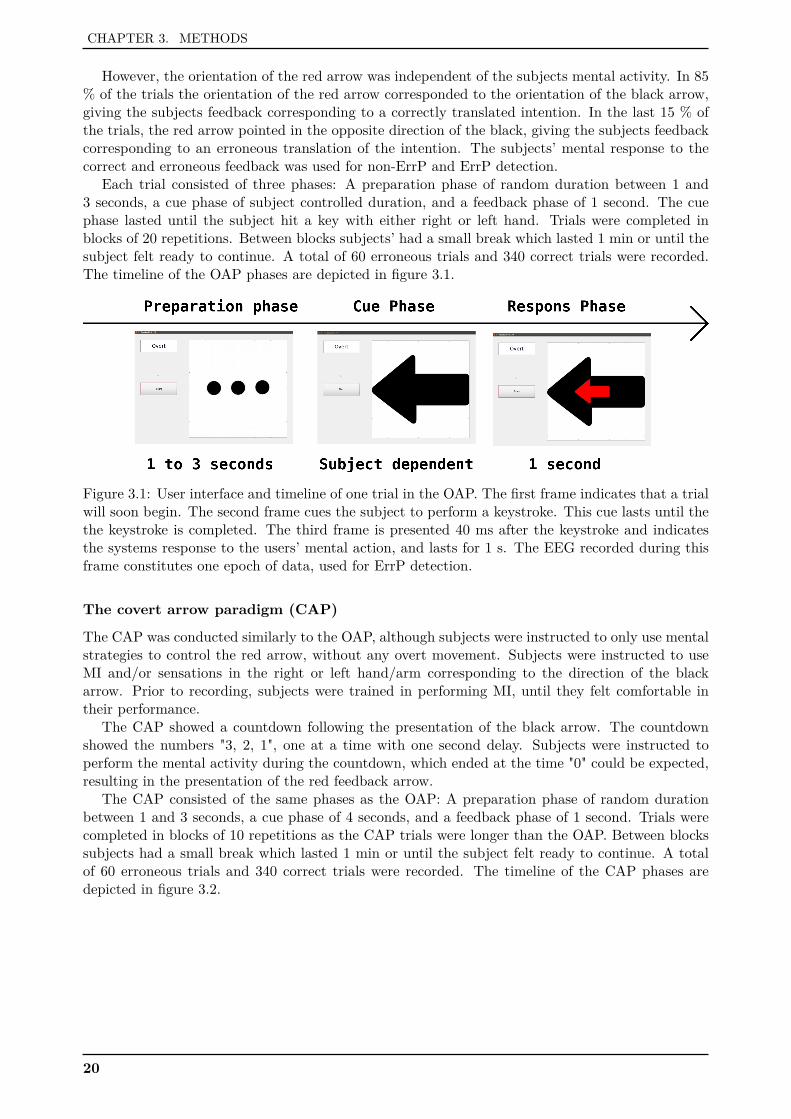
The CAP consisted of the same phases as the OAP: A preparation phase of random durationbetween 1 and 3 seconds, a cue phase of 4 seconds, and a feedback phase of 1 second. Trials werecompleted in blocks of 10 repetitions as the CAP trials were longer than the OAP. Between blockssubjects had a small break which lasted 1 min or until the subject felt ready to continue. A totalof 60 erroneous trials and 340 correct trials were recorded. The timeline of the CAP phases aredepicted in figure 3.2.
20
CHAPTER 3. METHODS
Figure 3.2: User interface and timeline of one trial in the CAP. The first frame indicates that atrial will soon begin. The second frame cues the subject to perform a MI task. The cue lasts for 4seconds. During the 4 seconds a count down from 3 to 0 seconds is presented in the center of theblack arrow. The third frame is presented 40 ms after the end of the countdown and indicates thesystems response to the users’ MI. The third frame lasts for 1 s and the EEG recorded during thisframe constitutes one epoch of data, used for ErrP detection.
The game paradigm (GP)
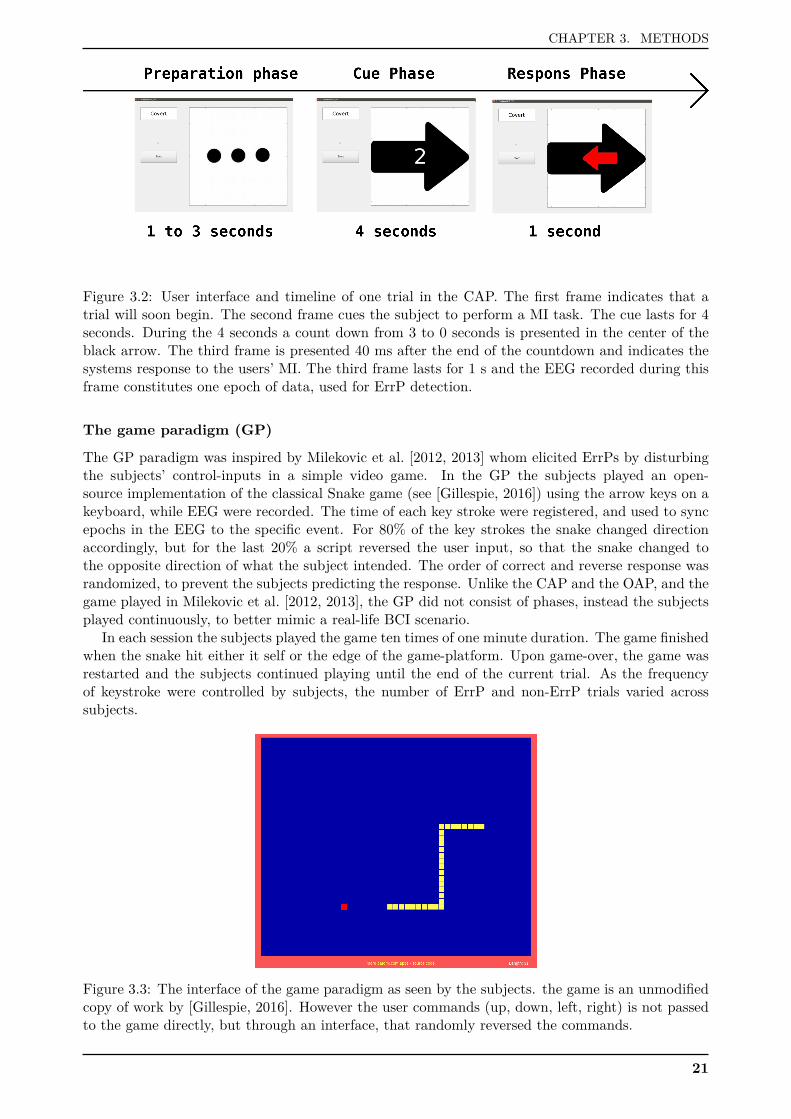
The GP paradigm was inspired by Milekovic et al. [2012, 2013] whom elicited ErrPs by disturbingthe subjects’ control-inputs in a simple video game. In the GP the subjects played an open-source implementation of the classical Snake game (see [Gillespie, 2016]) using the arrow keys on akeyboard, while EEG were recorded. The time of each key stroke were registered, and used to syncepochs in the EEG to the specific event. For 80% of the key strokes the snake changed directionaccordingly, but for the last 20% a script reversed the user input, so that the snake changed tothe opposite direction of what the subject intended. The order of correct and reverse response wasrandomized, to prevent the subjects predicting the response. Unlike the CAP and the OAP, and thegame played in Milekovic et al. [2012, 2013], the GP did not consist of phases, instead the subjectsplayed continuously, to better mimic a real-life BCI scenario.
In each session the subjects played the game ten times of one minute duration. The game finishedwhen the snake hit either it self or the edge of the game-platform. Upon game-over, the game wasrestarted and the subjects continued playing until the end of the current trial. As the frequencyof keystroke were controlled by subjects, the number of ErrP and non-ErrP trials varied acrosssubjects.
Figure 3.3: The interface of the game paradigm as seen by the subjects. the game is an unmodifiedcopy of work by [Gillespie, 2016]. However the user commands (up, down, left, right) is not passedto the game directly, but through an interface, that randomly reversed the commands.
21
CHAPTER 3. METHODS
3.3 DataanalysisThe dataanalysis was designed to explore the established criterias for ErrP usability. Firstly toinvestigate settings for optimal ErrP detection including relevance of features, channels and timesegment, secondly to investigate the separability of ErrP and non-ErrP classes respectively. Theseparability test sought to investigate the similarity between ErrPs and non-ErrPs evoked underdifferent paradigms.
3.3.1 Temporal filteringAll filtering were performed with an IIR implementation of chebyshev type 2 filters, to gain steepattenuation without passband ripples. Filters were of order 10 and had a stopband attenuation of 20dB, however, the filtering was employed in MATLAB using the function filtfilt, effectively makingthe filters of order 20 and providing a stopband attenuation of 40 dB. Filtfilt was preferable as itpreserves phase information. The procedure implies that the filtering of EEG cannot be performedimmediately after recording, as the filter needs data both before and after an epoch to stabilize.This is however not a problem as ErrP driven adaptation, even when running online, does not needto occur immediately. All bandpass filters were implemented as one high and one low pass filter.Preprocessing of the EEG was done by bandpass filtering between 0.05 and 100 Hz. Followingfiltering, EEG data was segmented into epochs, which consisted of 1 s. of data, following feedbackin the OAP and CAP, and 1 s. without further keystrokes in the GP.
3.3.2 Spatial noise reductionOnline ErrP detection prevents manual epoch selection. To reduce noise from EOG, movement andother non-cortical sources, three common noise rejection approaches were implemented and tested.Following preprocessing, noise was removed using common average reference (CAR) or independentcomponent analysis (ICA) or the combination of the two.
CAR was implemented simply by subtracting a mean of all EEG channels, with respect to time,from each individual channel. By removing a mean of all channels the effect of noise sources affectingall the channels is reduced.
ICA was implemented in three steps: The EEG was transformed into the ICA domain using theMATLAB rica function. EOG artifacts was visually prominent in two ICA dimensions. The energyof the most contaminated dimension or both dimensions was removed (henceforth referred to asICA-1 and ICA-2), and the residual EEG was transformed back to the ordinary spatial domain.
3.3.3 Feature extractionFeatures in the present study were kept computationally simple, due to the prospect that featurecalculation should be cheap computation-wise, in order ensure the usability of the features in onlineimplementation. The features consisted of simple means, FFT components and template matching.
Temporal meansMultiple studies have found that temporal features could discriminate ErrPs from non-ErrPs in dif-ferent time windows, spanning to 1 sec following feedback (Blankertz2003, Buttfield2006, Kreilinger2016,Parra2003, Parra2002,Milekovic2012). Following these suggestions simple means of EEG-data werecalculated in steps of 50 ms per channel, resulting in a total of 320 simple mean features.
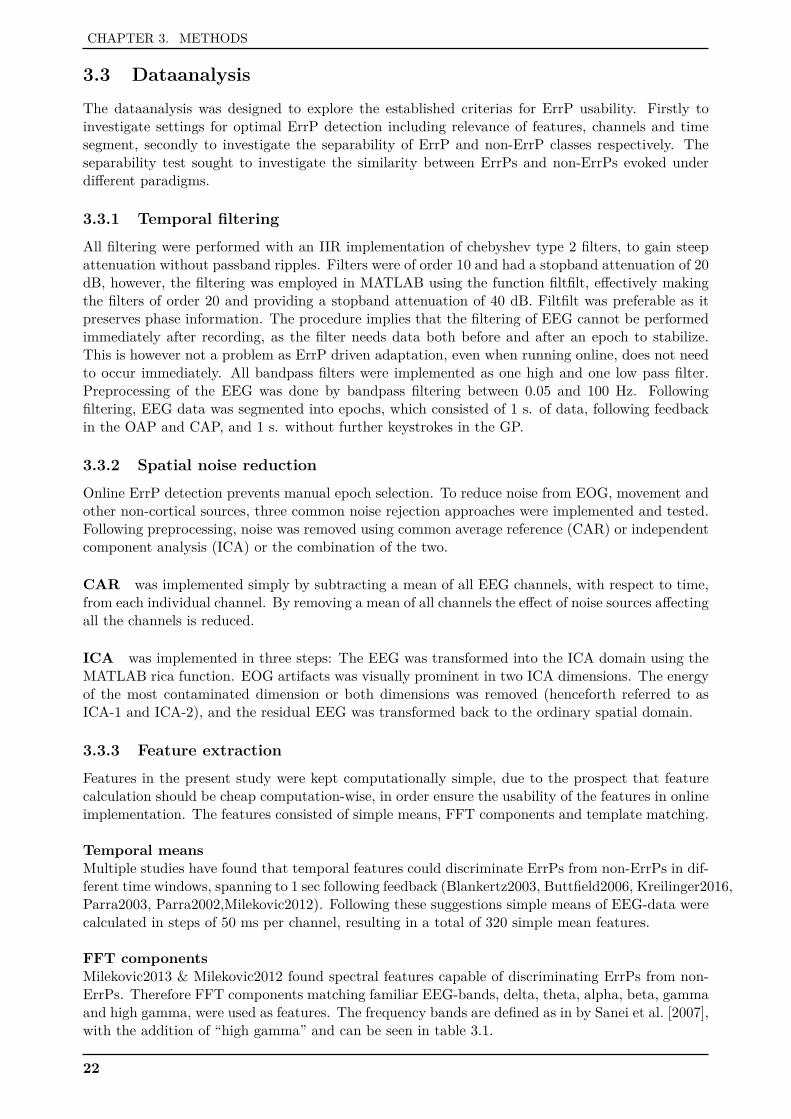
FFT componentsMilekovic2013 & Milekovic2012 found spectral features capable of discriminating ErrPs from non-ErrPs. Therefore FFT components matching familiar EEG-bands, delta, theta, alpha, beta, gammaand high gamma, were used as features. The frequency bands are defined as in by Sanei et al. [2007],with the addition of “high gamma” and can be seen in table 3.1.
22
CHAPTER 3. METHODS
Frequency band Sanei 2007 This studyDelta 0.5 - 4 Hz 1-3 and 2.5-5 HzTheta 4 - 7.5 Hz 5 - 7.5 HzAlpha 8 - 13 Hz 5 - 15 HzBeta 14 - 26 Hz 15 - 30 HzGamma 30 - 45 Hz 30 - 45 HzHigh Gamma - 45 - 100 Hz
Table 3.1: Normal EEG frequency bands as stated by Sanei et al. [2007], and as defined in thisstudy.
For alpha, beta, gamma and high gamma frequency band, spectral features were calculated forfive time windows of 200 ms with no overlap, from 0 to 1 s. after onset of the system feedback.Theta power was derived for three windows of 400 ms, with 100 ms overlap between 0 and 1 s.Finally the delta band was split into a high and a low subband. The high subband covered 2.5 to 5Hz, and were analyzed in the same windows as the theta band. The low delta comprised 0.5 to 2.5Hz and covered the entire epoch.
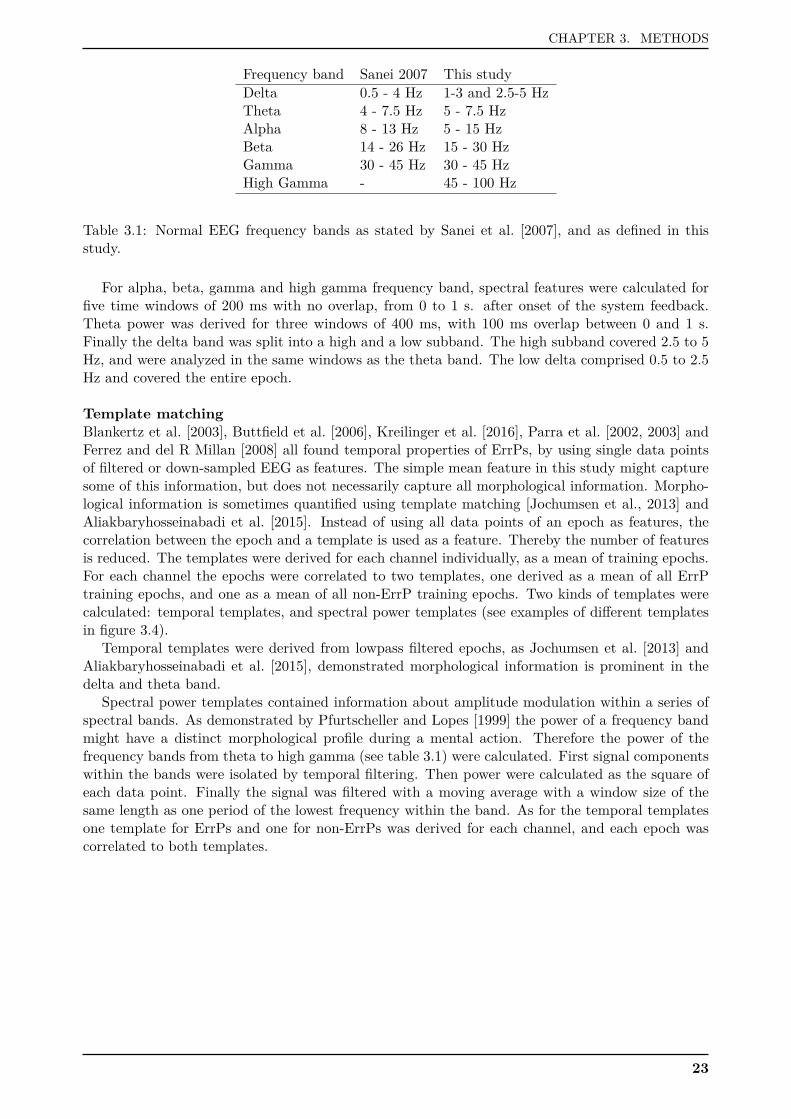
Template matchingBlankertz et al. [2003], Buttfield et al. [2006], Kreilinger et al. [2016], Parra et al. [2002, 2003] andFerrez and del R Millan [2008] all found temporal properties of ErrPs, by using single data pointsof filtered or down-sampled EEG as features. The simple mean feature in this study might capturesome of this information, but does not necessarily capture all morphological information. Morpho-logical information is sometimes quantified using template matching [Jochumsen et al., 2013] andAliakbaryhosseinabadi et al. [2015]. Instead of using all data points of an epoch as features, thecorrelation between the epoch and a template is used as a feature. Thereby the number of featuresis reduced. The templates were derived for each channel individually, as a mean of training epochs.For each channel the epochs were correlated to two templates, one derived as a mean of all ErrPtraining epochs, and one as a mean of all non-ErrP training epochs. Two kinds of templates werecalculated: temporal templates, and spectral power templates (see examples of different templatesin figure 3.4).
Temporal templates were derived from lowpass filtered epochs, as Jochumsen et al. [2013] andAliakbaryhosseinabadi et al. [2015], demonstrated morphological information is prominent in thedelta and theta band.
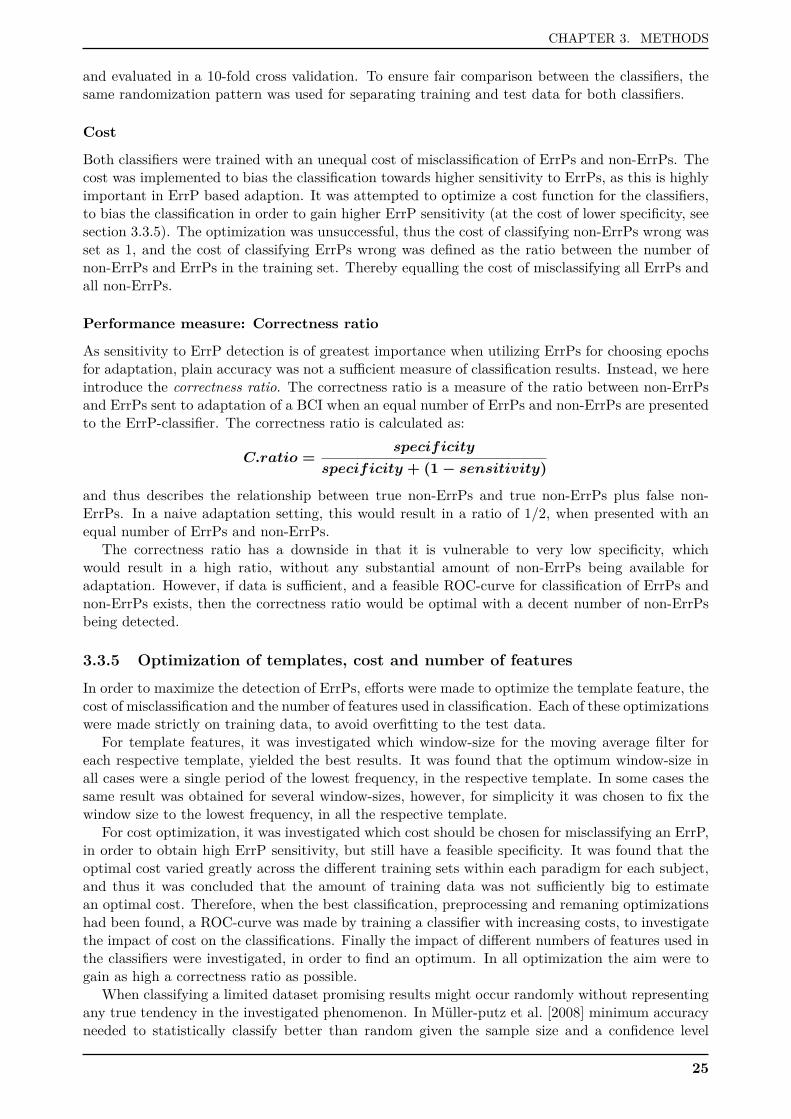
Spectral power templates contained information about amplitude modulation within a series ofspectral bands. As demonstrated by Pfurtscheller and Lopes [1999] the power of a frequency bandmight have a distinct morphological profile during a mental action. Therefore the power of thefrequency bands from theta to high gamma (see table 3.1) were calculated. First signal componentswithin the bands were isolated by temporal filtering. Then power were calculated as the square ofeach data point. Finally the signal was filtered with a moving average with a window size of thesame length as one period of the lowest frequency within the band. As for the temporal templatesone template for ErrPs and one for non-ErrPs was derived for each channel, and each epoch wascorrelated to both templates.
23
CHAPTER 3. METHODS
0 250 500 750 1000
-1
0
1
Am
plit
ude, arb
itra
ry u
nit
Temporal template
0 250 500 750 1000
Time ms
-1
0
1
Theta power template
0 250 500 750 1000
-1
0
1
Alpha power template
Figure 3.4: One subjects temporal, theta and alpha templates for ErrPs (full line) and non-ErrPs(dashed line), for both the OAP (blue) and the CAP (red).
Feature importance and selection
In order to make a comparison between temporal and spectral features’ predictability of ErrPversus non-ErrP, feature importance was evaluated. Several approaches for evaluating features’importance. In this study three feature importance assessment methods were evaluated on perfor-mance in the classifiers: LDA single feature performance, Random Forest (RF) feature importance,and a Principal Component Analysis (PCA) dimension variance. Following evaluation of featureimportance, the classifiers were trained, using the most important features. For all three featureselection approaches a within training data 10 fold cross validation were used to determine the bestnumber of features to use.
Single feature importance was based on single feature prediction accuracy in a LDA. Eachcalculated feature were evaluated on prediction accuracy of training data on its own. The fea-tures selected for classification, were the features providing the highest accuracy in a single featureclassification.
RF feature importance was based on the feature importance calculated in the MATLAB func-tion “Treebagger”, used to generate the RF. The importance of each feature is evaluated by compar-ing the accuracy between a classification using all features, and a classification where the values ofthe current feature is randomly interchanged between epochs. If the interchange impaired the clas-sification it must mean that the feature contributed with important information, the more impairedclassification, the more important the feature.
PCA feature importance was based on PCA transforming the feature matrix. Importance offeatures were derived as variance following the PCA transformation.
3.3.4 ClassificationIn this study two types of classifiers were used, LDA and a RF classifier. These two classifiers werechosen as they meet two different potential challenges in the classification of the data. LDA is a fairlysimple, yet broadly used classifier [Vidaurre et al., 2011a, Kreilinger et al., 2016, Mohammadi et al.,2013]. For limited amounts of training data, as is the case in the present study, LDA approximatesmeans of classes for identifying prominent tendencies in the data with a limited risk of over fitting tothe training data. However for complex patterns, LDA might not provide a good model of the data,due to its simplistic decision plane. Random Forest is an ensemble of decision trees, which classifiesbased on votes from each tree [Breiman, 2001]. Unlike LDA the shape of the discrimination plan isnot constricted and thus provides a more complex model that might better fit the data. The RFwas trained using 2000 decision trees, in order to evaluate feature importance [Breiman, 2002], butonly used 128 when used for classification [Oshiro and Perez, 2012]. Both classifiers were trained
24
CHAPTER 3. METHODS
and evaluated in a 10-fold cross validation. To ensure fair comparison between the classifiers, thesame randomization pattern was used for separating training and test data for both classifiers.
Cost
Both classifiers were trained with an unequal cost of misclassification of ErrPs and non-ErrPs. Thecost was implemented to bias the classification towards higher sensitivity to ErrPs, as this is highlyimportant in ErrP based adaption. It was attempted to optimize a cost function for the classifiers,to bias the classification in order to gain higher ErrP sensitivity (at the cost of lower specificity, seesection 3.3.5). The optimization was unsuccessful, thus the cost of classifying non-ErrPs wrong wasset as 1, and the cost of classifying ErrPs wrong was defined as the ratio between the number ofnon-ErrPs and ErrPs in the training set. Thereby equalling the cost of misclassifying all ErrPs andall non-ErrPs.
Performance measure: Correctness ratio
As sensitivity to ErrP detection is of greatest importance when utilizing ErrPs for choosing epochsfor adaptation, plain accuracy was not a sufficient measure of classification results. Instead, we hereintroduce the correctness ratio. The correctness ratio is a measure of the ratio between non-ErrPsand ErrPs sent to adaptation of a BCI when an equal number of ErrPs and non-ErrPs are presentedto the ErrP-classifier. The correctness ratio is calculated as:
C.ratio =specificity
specificity + (1− sensitivity)
and thus describes the relationship between true non-ErrPs and true non-ErrPs plus false non-ErrPs. In a naive adaptation setting, this would result in a ratio of 1/2, when presented with anequal number of ErrPs and non-ErrPs.
The correctness ratio has a downside in that it is vulnerable to very low specificity, whichwould result in a high ratio, without any substantial amount of non-ErrPs being available foradaptation. However, if data is sufficient, and a feasible ROC-curve for classification of ErrPs andnon-ErrPs exists, then the correctness ratio would be optimal with a decent number of non-ErrPsbeing detected.
3.3.5 Optimization of templates, cost and number of featuresIn order to maximize the detection of ErrPs, efforts were made to optimize the template feature, thecost of misclassification and the number of features used in classification. Each of these optimizationswere made strictly on training data, to avoid overfitting to the test data.
For template features, it was investigated which window-size for the moving average filter foreach respective template, yielded the best results. It was found that the optimum window-size inall cases were a single period of the lowest frequency, in the respective template. In some cases thesame result was obtained for several window-sizes, however, for simplicity it was chosen to fix thewindow size to the lowest frequency, in all the respective template.
For cost optimization, it was investigated which cost should be chosen for misclassifying an ErrP,in order to obtain high ErrP sensitivity, but still have a feasible specificity. It was found that theoptimal cost varied greatly across the different training sets within each paradigm for each subject,and thus it was concluded that the amount of training data was not sufficiently big to estimatean optimal cost. Therefore, when the best classification, preprocessing and remaning optimizationshad been found, a ROC-curve was made by training a classifier with increasing costs, to investigatethe impact of cost on the classifications. Finally the impact of different numbers of features used inthe classifiers were investigated, in order to find an optimum. In all optimization the aim were togain as high a correctness ratio as possible.
When classifying a limited dataset promising results might occur randomly without representingany true tendency in the investigated phenomenon. In Müller-putz et al. [2008] minimum accuracyneeded to statistically classify better than random given the sample size and a confidence level
25
CHAPTER 3. METHODS
is calculated and presented. In the present work, a confidence level of α = 0.05, and individualsubjects generated roughly 60 ErrPs, and when pooled a total of 720 ErrPs were available. In orderto not underestimate the chance level, the individual chance level was based on 40 epochs (only40 and 80 epochs are presented in Müller-putz et al. [2008]) of each class, and the pooled on 160(upper limit of presented chance levels in Müller-putz et al. [2008]), giving a true chance level of 60% and 55.6 % respectively. These were the chance levels considered when presenting results.
Feature, channel and time importance
The individual feature importances were found using the LDA single feature importance, anad wasused to evaluate the importance of single channels, time segment and feature types by averagingthe importance of all features.
While importance does give a general indication of the time and location of information enablingdetection of ErrPs, it does not enable direct comparison of importance between channels or timesegments, as it does not tell if all features within i.e. a channel provides the same or differentinformation.
Time segment importance was calculated as the mean importance of features within or partlywithin time segments in steps of 50 ms. Template features and the spectral feature Low delta powerwere not included as they contained information in the entire epoch. Channel importance wascalculated as a mean of all features derived from the same channel. Finally features were dividedinto four types, temporal means, spectral power, ErrP-templates and non-ErrP templates to assessthe importance of each type of feature.
26

Chapter 4Results
The results are divided into three parts. Firstly the different performances across subjects foreach configuration of spatial filtering, feature selection and classification is compared. Secondly,classification and feature importance within each paradigm is described. Finally classification acrossparadigms is investigated, to asses if ErrP detection complies with the second criteria for feasibilityof ErrP guided adaptation of BCIs.
4.1 ErrP classification accuracyIn order to show the obtainable sensitivity, specificity and correctness ratio of ErrPs, the results ofthe different tests and optimization efforts are presented here.
4.1.1 Classifier performancesA LDA classifier was compared to a RF in order to see whether choice of classifier impacts thedetection accuracy of ErrPs. In addition each classifier was evaluated using different preprocessingtechniques (see table 4.1 for classification accuracies). As the GP were subject to epoch rejection,the results presented for the GP are based on the number of epochs specified in tabel 4.2.
27

CHAPTER 4. RESULTS
Table 4.1: Mean correctness ratio of the two classifiers, in the three paradigms, under different spatialfiltering methods. The best combination preprocessing, feature reduction method and classifier foreach paradigm is presented in bold.
Reduction method Linear Discriminant AnalysisNone CAR ICA-1 ICA-2 CAR + ICA-1 CAR + ICA-2
OAP:Single feature performance 0.77 0.76 0.80 0.74 0.78 0.73RF feature importance 0.83 0.78 0.80 0.78 0.78 0.77PCA Variance 0.72 0.70 0.74 0.73 0.81 0.74
CAP:Single feature performance 0.79 0.79 0.82 0.81 0.82 0.75RF feature importance 0.88 0.85 0.85 0.85 0.84 0.80PCA Variance 0.80 0.78 0.79 0.76 0.83 0.79
GP:Single feature performance 0.57 0.62 0.55 0.55 0.56 0.56RF feature importance 0.63 0.62 0.64 0.60 0.61 0.59PCA Variance 0.63 0.70 0.60 0.61 0.67 0.68
Random Forest
OAP:Single feature performance 0.70 0.67 0.71 0.66 0.71 0.66RF feature importance 0.73 0.71 0.73 0.71 0.71 0.71PCA Variance 0.58 0.58 0.60 0.59 0.62 0.57
CAP:Single feature performance 0.71 0.74 0.76 0.72 0.74 0.70RF feature importance 0.75 0.77 0.79 0.77 0.79 0.71PCA Variance 0.61 0.62 0.62 0.57 0.65 0.62
GP:Single feature performance 0.53 0.56 0.53 0.54 0.55 0.55RF feature importance 0.57 0.55 0.55 0.55 0.57 0.55PCA Variance 0.55 0.57 0.55 0.55 0.56 0.59
Table 4.2: Number of ErrP and non-ErrP epochs in the GP.
Subject: 1 2 3 4 5 6 7 8 9 10 11 12ErrPs 76 70 60 49 66 73 34 59 61 69 67 64Non-ErrPs 294 241 251 273 282 221 150 269 276 302 279 275
With no exceptions, the LDA achieved a higher correctness ratio than the random forrest, inall three paradigms. Additionally the CAP achieved the greatest correctness ratio between theparadigms and GP the lowest. Lastly the RF feature reduction method generally worked best forthe OAP and the CAP, whereas the PCA variance reduction method worked better for the GP.
For both the OAP and the CAP the best configuration was found to be without spatial filtering,using RF feature reduction and a LDA classifier. The CAP achieved the biggest correctness ratio ofthe three paradigms. The GPs best configuration was using CAR filtering and PCA variance featurereduction and a LDA classifier. See the individual subjects’ sensitivity, specificity and correctnessratio under these configurations for each paradigm, in table 4.3.
28

CHAPTER 4. RESULTS
Table 4.3: Subjects’ individual sensitivity, specificity and correctness ratio under the optimal config-urations for each paradigm. Means for each paradigm is calculated using 0, in case of NaN. Betterthan random performance, as defined by Müller-putz et al. [2008], is marked with bold.
OAP CAP GPSub: Sens. Spec. C. ratio Sens. Spec. C. ratio Sens. Spec. C. ratio1 0.86 0.57 0.80 0.98 0.25 0.93 0.88 0.27 0.702 0.88 0.82 0.87 0.92 0.81 0.91 1.00 0.00 NaN3 0.95 0.51 0.91 0.90 0.93 0.91 0.98 0.09 0.834 0.82 0.93 0.84 0.87 0.97 0.88 0.88 0.18 0.605 0.96 0.95 0.96 0.74 0.28 0.52 0.68 0.88 0.736 0.84 0.95 0.86 0.86 0.89 0.86 0.91 0.12 0.577 1.00 0.01 1.00 0.94 0.95 0.94 1.00 0.00 NaN8 0.98 0.81 0.98 0.90 0.60 0.86 0.97 0.01 0.329 0.82 0.55 0.75 0.90 0.29 0.75 0.99 0.03 0.7410 0.53 0.52 0.53 0.90 0.90 0.90 0.97 0.09 0.7411 0.91 0.10 0.52 1.00 0.96 1.00 1.00 0.00 NaN12 1.00 0.08 1.00 0.87 0.83 0.86 0.64 0.84 0.70Mean: 0.88 ±
0.130.57 ±0.35
0.84 ±0.17
0.90 ±0.07
0.72 ±0.29
0.86 ±0.12
0.91 ±0.13
0.21 ±0.32
0.49 ±0.32
Compared to the chance level, as defined by Müller-putz et al. [2008] to be 60% accuracy foreach subject in the setting of this study, not all subjects achieved better than random classificationaccuracies. Subject 7, 10, 11 and 12 did not achieve above chance level in the OAP, subject 5 and9 did not achieve above chance level in the CAP and only subject 5 and 12 achieved above chancelevel for the GP. When pooling epochs, the chance level is 55.6%, which all paradigms achieved,although the GP is just barely above chance level.
Additionally it was found that great intersubject variance existed, evident by the generally highstandard deviations. The lowest standard deviation however, was in the CAP. Thus it seems thatsubjects where more consistent in their performance during the CAP, which is also suggested bythe ROC-curves in figures 4.1-4.3.
Based on the findings presented in table 4.1 the following results for the three paradigms willbe based on the configurations: RF feature importance without spatial filtering for OAP and CAP,and PCA variance and CAR filtering for GP.
4.1.2 Features reduction methodsThe influence of the number of features on the correctness ratio was investigated. This was donein an effort to minimize overfitting to training data. The included features were chosen based onthree feature evaluation methods. The correctness ratio achieved with different numbers of featuresfor the optimal configuration of the three paradigms, is presented in table 4.4.
29
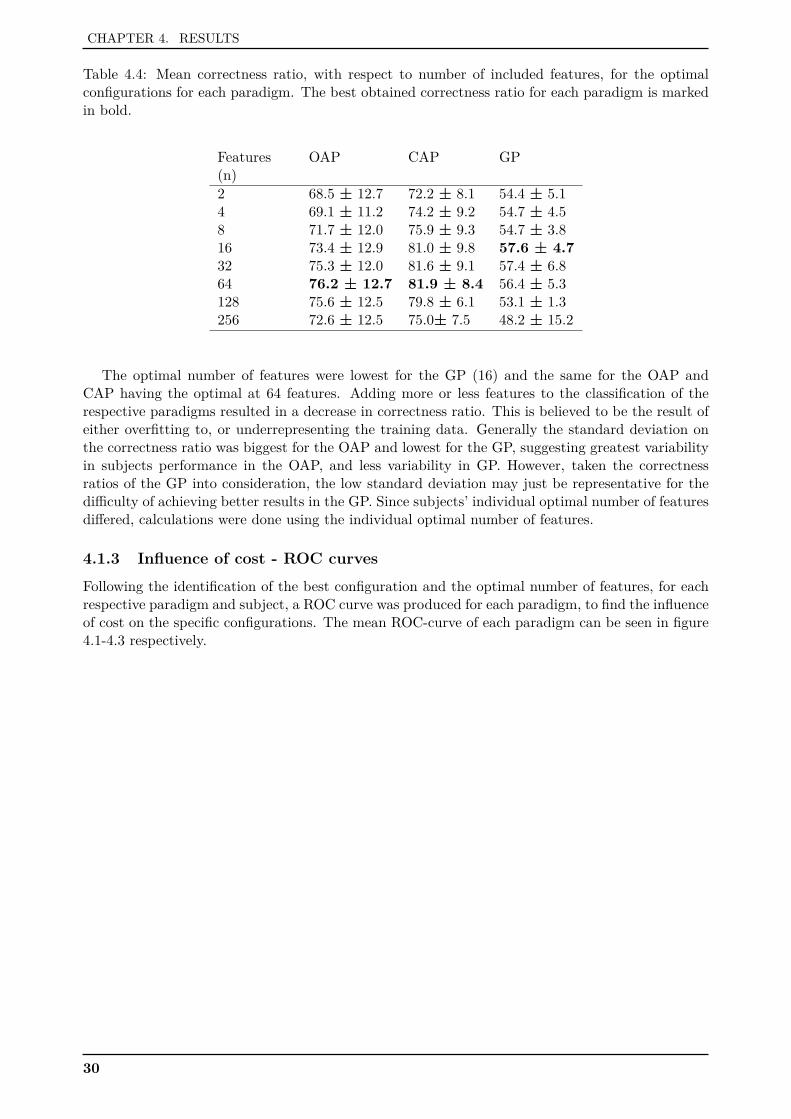
CHAPTER 4. RESULTS
Table 4.4: Mean correctness ratio, with respect to number of included features, for the optimalconfigurations for each paradigm. The best obtained correctness ratio for each paradigm is markedin bold.
Features(n)
OAP CAP GP
2 68.5 ± 12.7 72.2 ± 8.1 54.4 ± 5.14 69.1 ± 11.2 74.2 ± 9.2 54.7 ± 4.58 71.7 ± 12.0 75.9 ± 9.3 54.7 ± 3.816 73.4 ± 12.9 81.0 ± 9.8 57.6 ± 4.732 75.3 ± 12.0 81.6 ± 9.1 57.4 ± 6.864 76.2 ± 12.7 81.9 ± 8.4 56.4 ± 5.3128 75.6 ± 12.5 79.8 ± 6.1 53.1 ± 1.3256 72.6 ± 12.5 75.0± 7.5 48.2 ± 15.2
The optimal number of features were lowest for the GP (16) and the same for the OAP andCAP having the optimal at 64 features. Adding more or less features to the classification of therespective paradigms resulted in a decrease in correctness ratio. This is believed to be the result ofeither overfitting to, or underrepresenting the training data. Generally the standard deviation onthe correctness ratio was biggest for the OAP and lowest for the GP, suggesting greatest variabilityin subjects performance in the OAP, and less variability in GP. However, taken the correctnessratios of the GP into consideration, the low standard deviation may just be representative for thedifficulty of achieving better results in the GP. Since subjects’ individual optimal number of featuresdiffered, calculations were done using the individual optimal number of features.
4.1.3 Influence of cost - ROC curvesFollowing the identification of the best configuration and the optimal number of features, for eachrespective paradigm and subject, a ROC curve was produced for each paradigm, to find the influenceof cost on the specific configurations. The mean ROC-curve of each paradigm can be seen in figure4.1-4.3 respectively.
30

CHAPTER 4. RESULTS
0 0.2 0.4 0.6 0.8 1
1-Specificity
0
0.1
0.2
0.3
0.4
0.5
0.6
0.7
0.8
0.9
1
Se
nsitiv
ity
Sub. 1
Sub. 2
Sub. 3
Sub. 4
Sub. 5
Sub. 6
Sub. 7
Sub. 8
Sub. 9
Sub. 10
Sub. 11
Sub. 12
Mean
Max C. Acc.
Random level
Figure 4.1: Mean ROC-curve across subjects for the best pre-processing classification configurationin the OAP. The red x marks the position on the average ROC-curve, where the correctness ratiowas the highest. In this point, the correctness ratio was 0.9156. The mean ROC curve has an areaunder curve of 0.8557
0 0.2 0.4 0.6 0.8 1
1-Specificity
0
0.1
0.2
0.3
0.4
0.5
0.6
0.7
0.8
0.9
1
Se
nsitiv
ity
Sub. 1
Sub. 2
Sub. 3
Sub. 4
Sub. 5
Sub. 6
Sub. 7
Sub. 8
Sub. 9
Sub. 10
Sub. 11
Sub. 12
Mean
Max C. Acc.
Random level
Figure 4.2: Mean ROC-curve across subjects for the best pre-processing classification configurationin the CAP. The red x marks the position on the average ROC-curve, where the correctness ratiowas the highest. In this point, the correctness ratio was 0.9238. The mean ROC curve has an areaunder curve of 0.9207
31
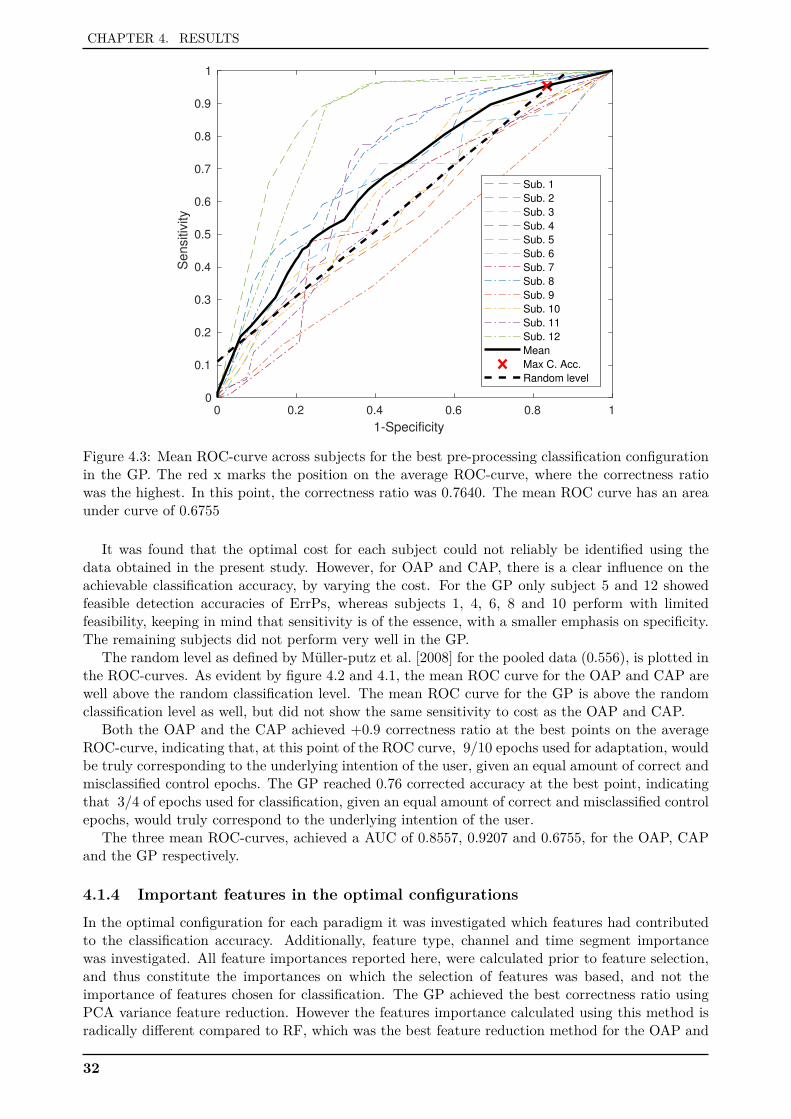
CHAPTER 4. RESULTS
0 0.2 0.4 0.6 0.8 1
1-Specificity
0
0.1
0.2
0.3
0.4
0.5
0.6
0.7
0.8
0.9
1
Se
nsitiv
ity
Sub. 1
Sub. 2
Sub. 3
Sub. 4
Sub. 5
Sub. 6
Sub. 7
Sub. 8
Sub. 9
Sub. 10
Sub. 11
Sub. 12
Mean
Max C. Acc.
Random level
Figure 4.3: Mean ROC-curve across subjects for the best pre-processing classification configurationin the GP. The red x marks the position on the average ROC-curve, where the correctness ratiowas the highest. In this point, the correctness ratio was 0.7640. The mean ROC curve has an areaunder curve of 0.6755
It was found that the optimal cost for each subject could not reliably be identified using thedata obtained in the present study. However, for OAP and CAP, there is a clear influence on theachievable classification accuracy, by varying the cost. For the GP only subject 5 and 12 showedfeasible detection accuracies of ErrPs, whereas subjects 1, 4, 6, 8 and 10 perform with limitedfeasibility, keeping in mind that sensitivity is of the essence, with a smaller emphasis on specificity.The remaining subjects did not perform very well in the GP.
The random level as defined by Müller-putz et al. [2008] for the pooled data (0.556), is plotted inthe ROC-curves. As evident by figure 4.2 and 4.1, the mean ROC curve for the OAP and CAP arewell above the random classification level. The mean ROC curve for the GP is above the randomclassification level as well, but did not show the same sensitivity to cost as the OAP and CAP.
Both the OAP and the CAP achieved +0.9 correctness ratio at the best points on the averageROC-curve, indicating that, at this point of the ROC curve, 9/10 epochs used for adaptation, wouldbe truly corresponding to the underlying intention of the user, given an equal amount of correct andmisclassified control epochs. The GP reached 0.76 corrected accuracy at the best point, indicatingthat 3/4 of epochs used for classification, given an equal amount of correct and misclassified controlepochs, would truly correspond to the underlying intention of the user.
The three mean ROC-curves, achieved a AUC of 0.8557, 0.9207 and 0.6755, for the OAP, CAPand the GP respectively.
4.1.4 Important features in the optimal configurationsIn the optimal configuration for each paradigm it was investigated which features had contributedto the classification accuracy. Additionally, feature type, channel and time segment importancewas investigated. All feature importances reported here, were calculated prior to feature selection,and thus constitute the importances on which the selection of features was based, and not theimportance of features chosen for classification. The GP achieved the best correctness ratio usingPCA variance feature reduction. However the features importance calculated using this method isradically different compared to RF, which was the best feature reduction method for the OAP and
32
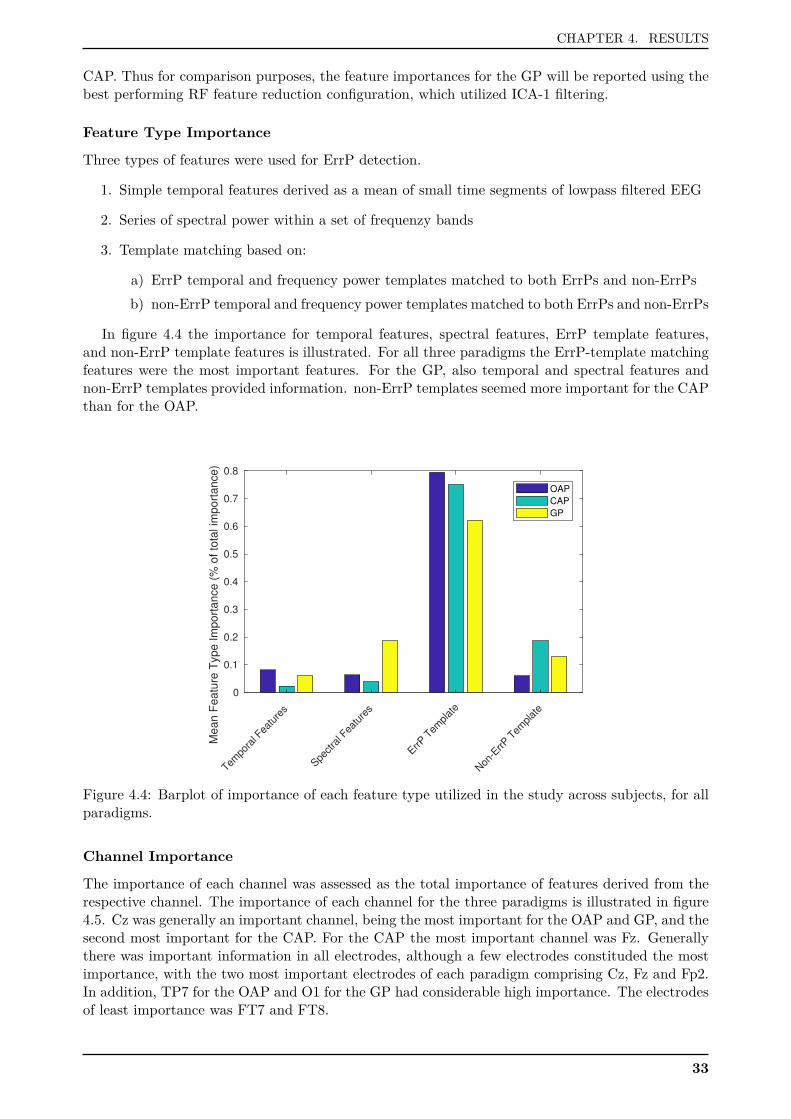
CHAPTER 4. RESULTS
CAP. Thus for comparison purposes, the feature importances for the GP will be reported using thebest performing RF feature reduction configuration, which utilized ICA-1 filtering.
Feature Type Importance
Three types of features were used for ErrP detection.
1. Simple temporal features derived as a mean of small time segments of lowpass filtered EEG
2. Series of spectral power within a set of frequenzy bands
3. Template matching based on:
a) ErrP temporal and frequency power templates matched to both ErrPs and non-ErrPsb) non-ErrP temporal and frequency power templates matched to both ErrPs and non-ErrPs
In figure 4.4 the importance for temporal features, spectral features, ErrP template features,and non-ErrP template features is illustrated. For all three paradigms the ErrP-template matchingfeatures were the most important features. For the GP, also temporal and spectral features andnon-ErrP templates provided information. non-ErrP templates seemed more important for the CAPthan for the OAP.
Tempo
ral F
eatu
res
Spectra
l Fea
ture
s
ErrP T
emplat
e
Non
-ErrP
Tem
plat
e
0
0.1
0.2
0.3
0.4
0.5
0.6
0.7
0.8
Me
an
Fe
atu
re T
yp
e I
mp
ort
an
ce
(%
of
tota
l im
po
rta
nce
)
OAP
CAP
GP
Figure 4.4: Barplot of importance of each feature type utilized in the study across subjects, for allparadigms.
Channel Importance
The importance of each channel was assessed as the total importance of features derived from therespective channel. The importance of each channel for the three paradigms is illustrated in figure4.5. Cz was generally an important channel, being the most important for the OAP and GP, and thesecond most important for the CAP. For the CAP the most important channel was Fz. Generallythere was important information in all electrodes, although a few electrodes constituded the mostimportance, with the two most important electrodes of each paradigm comprising Cz, Fz and Fp2.In addition, TP7 for the OAP and O1 for the GP had considerable high importance. The electrodesof least importance was FT7 and FT8.
33
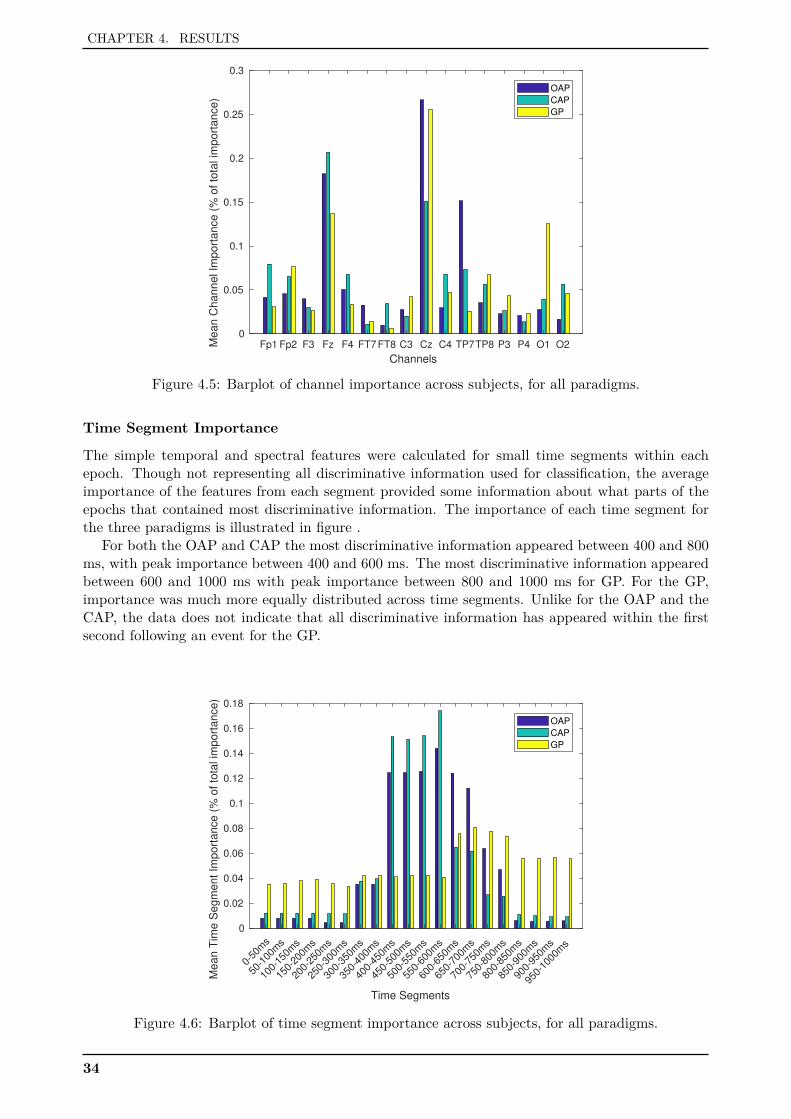
CHAPTER 4. RESULTS
Fp1 Fp2 F3 Fz F4 FT7FT8 C3 Cz C4 TP7TP8 P3 P4 O1 O2
Channels
0
0.05
0.1
0.15
0.2
0.25
0.3
Me
an
Ch
an
ne
l Im
po
rta
nce
(%
of
tota
l im
po
rta
nce
)
OAP
CAP
GP
Figure 4.5: Barplot of channel importance across subjects, for all paradigms.
Time Segment Importance
The simple temporal and spectral features were calculated for small time segments within eachepoch. Though not representing all discriminative information used for classification, the averageimportance of the features from each segment provided some information about what parts of theepochs that contained most discriminative information. The importance of each time segment forthe three paradigms is illustrated in figure .
For both the OAP and CAP the most discriminative information appeared between 400 and 800ms, with peak importance between 400 and 600 ms. The most discriminative information appearedbetween 600 and 1000 ms with peak importance between 800 and 1000 ms for GP. For the GP,importance was much more equally distributed across time segments. Unlike for the OAP and theCAP, the data does not indicate that all discriminative information has appeared within the firstsecond following an event for the GP.
0-50
ms
50-1
00m
s
100-
150m
s
150-
200m
s
200-
250m
s
250-
300m
s
300-
350m
s
350-
400m
s
400-
450m
s
450-
500m
s
500-
550m
s
550-
600m
s
600-
650m
s
650-
700m
s
700-
750m
s
750-
800m
s
800-
850m
s
850-
900m
s
900-
950m
s
950-
1000
ms
Time Segments
0
0.02
0.04
0.06
0.08
0.1
0.12
0.14
0.16
0.18
Me
an
Tim
e S
eg
me
nt
Imp
ort
an
ce
(%
of
tota
l im
po
rta
nce
)
OAP
CAP
GP
Figure 4.6: Barplot of time segment importance across subjects, for all paradigms.
34
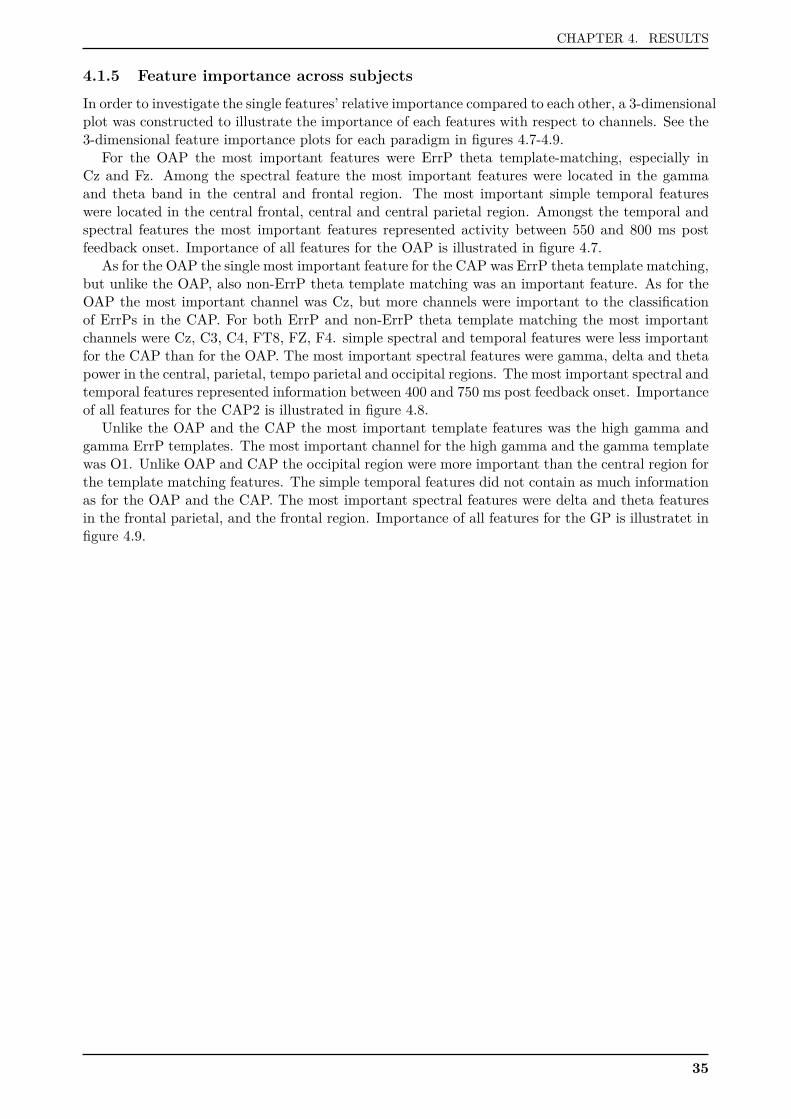
CHAPTER 4. RESULTS
4.1.5 Feature importance across subjectsIn order to investigate the single features’ relative importance compared to each other, a 3-dimensionalplot was constructed to illustrate the importance of each features with respect to channels. See the3-dimensional feature importance plots for each paradigm in figures 4.7-4.9.
For the OAP the most important features were ErrP theta template-matching, especially inCz and Fz. Among the spectral feature the most important features were located in the gammaand theta band in the central and frontal region. The most important simple temporal featureswere located in the central frontal, central and central parietal region. Amongst the temporal andspectral features the most important features represented activity between 550 and 800 ms postfeedback onset. Importance of all features for the OAP is illustrated in figure 4.7.
As for the OAP the single most important feature for the CAP was ErrP theta template matching,but unlike the OAP, also non-ErrP theta template matching was an important feature. As for theOAP the most important channel was Cz, but more channels were important to the classificationof ErrPs in the CAP. For both ErrP and non-ErrP theta template matching the most importantchannels were Cz, C3, C4, FT8, FZ, F4. simple spectral and temporal features were less importantfor the CAP than for the OAP. The most important spectral features were gamma, delta and thetapower in the central, parietal, tempo parietal and occipital regions. The most important spectral andtemporal features represented information between 400 and 750 ms post feedback onset. Importanceof all features for the CAP2 is illustrated in figure 4.8.
Unlike the OAP and the CAP the most important template features was the high gamma andgamma ErrP templates. The most important channel for the high gamma and the gamma templatewas O1. Unlike OAP and CAP the occipital region were more important than the central region forthe template matching features. The simple temporal features did not contain as much informationas for the OAP and the CAP. The most important spectral features were delta and theta featuresin the frontal parietal, and the frontal region. Importance of all features for the GP is illustratet infigure 4.9.
35
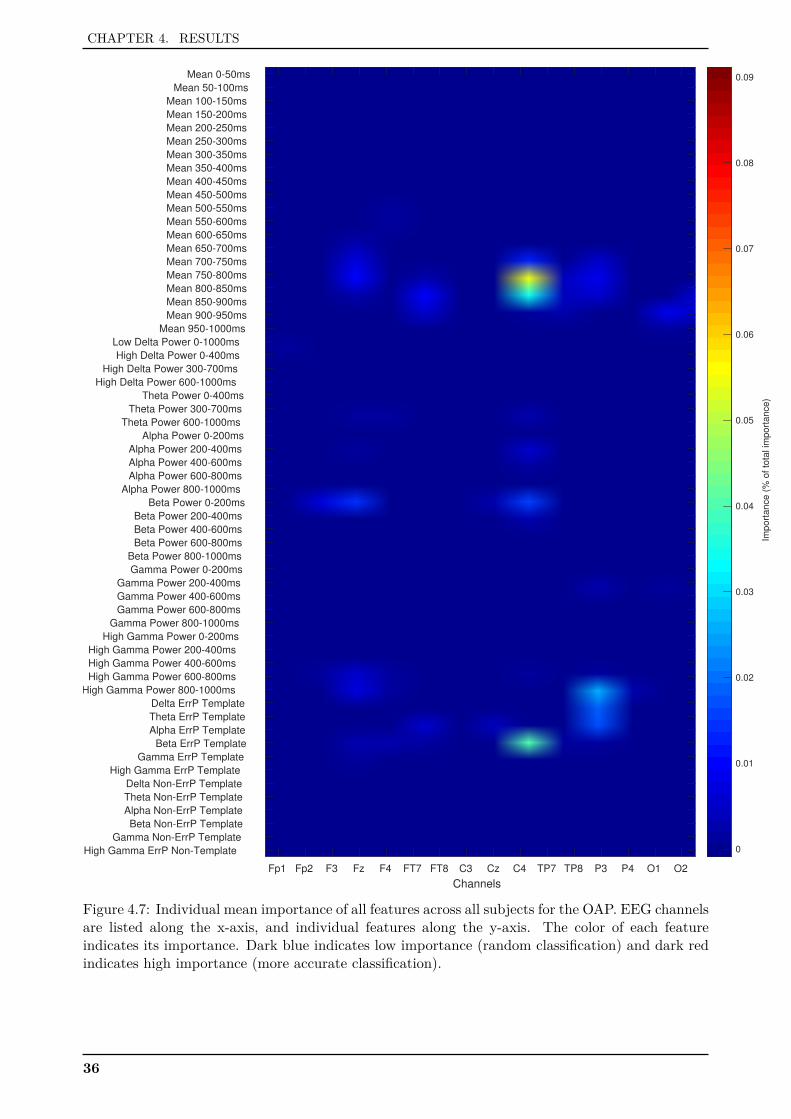
CHAPTER 4. RESULTS
Fp1 Fp2 F3 Fz F4 FT7 FT8 C3 Cz C4 TP7 TP8 P3 P4 O1 O2
Channels
Mean 0-50ms
Mean 50-100ms
Mean 100-150ms
Mean 150-200ms
Mean 200-250ms
Mean 250-300ms
Mean 300-350ms
Mean 350-400ms
Mean 400-450ms
Mean 450-500ms
Mean 500-550ms
Mean 550-600ms
Mean 600-650ms
Mean 650-700ms
Mean 700-750ms
Mean 750-800ms
Mean 800-850ms
Mean 850-900ms
Mean 900-950ms
Mean 950-1000ms
Low Delta Power 0-1000ms
High Delta Power 0-400ms
High Delta Power 300-700ms
High Delta Power 600-1000ms
Theta Power 0-400ms
Theta Power 300-700ms
Theta Power 600-1000ms
Alpha Power 0-200ms
Alpha Power 200-400ms
Alpha Power 400-600ms
Alpha Power 600-800ms
Alpha Power 800-1000ms
Beta Power 0-200ms
Beta Power 200-400ms
Beta Power 400-600ms
Beta Power 600-800ms
Beta Power 800-1000ms
Gamma Power 0-200ms
Gamma Power 200-400ms
Gamma Power 400-600ms
Gamma Power 600-800ms
Gamma Power 800-1000ms
High Gamma Power 0-200ms
High Gamma Power 200-400ms
High Gamma Power 400-600ms
High Gamma Power 600-800ms
High Gamma Power 800-1000ms
Delta ErrP Template
Theta ErrP Template
Alpha ErrP Template
Beta ErrP Template
Gamma ErrP Template
High Gamma ErrP Template
Delta Non-ErrP Template
Theta Non-ErrP Template
Alpha Non-ErrP Template
Beta Non-ErrP Template
Gamma Non-ErrP Template
High Gamma ErrP Non-Template 0
0.01
0.02
0.03
0.04
0.05
0.06
0.07
0.08
0.09
Imp
ort
an
ce
(%
of
tota
l im
po
rta
nce
)
Figure 4.7: Individual mean importance of all features across all subjects for the OAP. EEG channelsare listed along the x-axis, and individual features along the y-axis. The color of each featureindicates its importance. Dark blue indicates low importance (random classification) and dark redindicates high importance (more accurate classification).
36
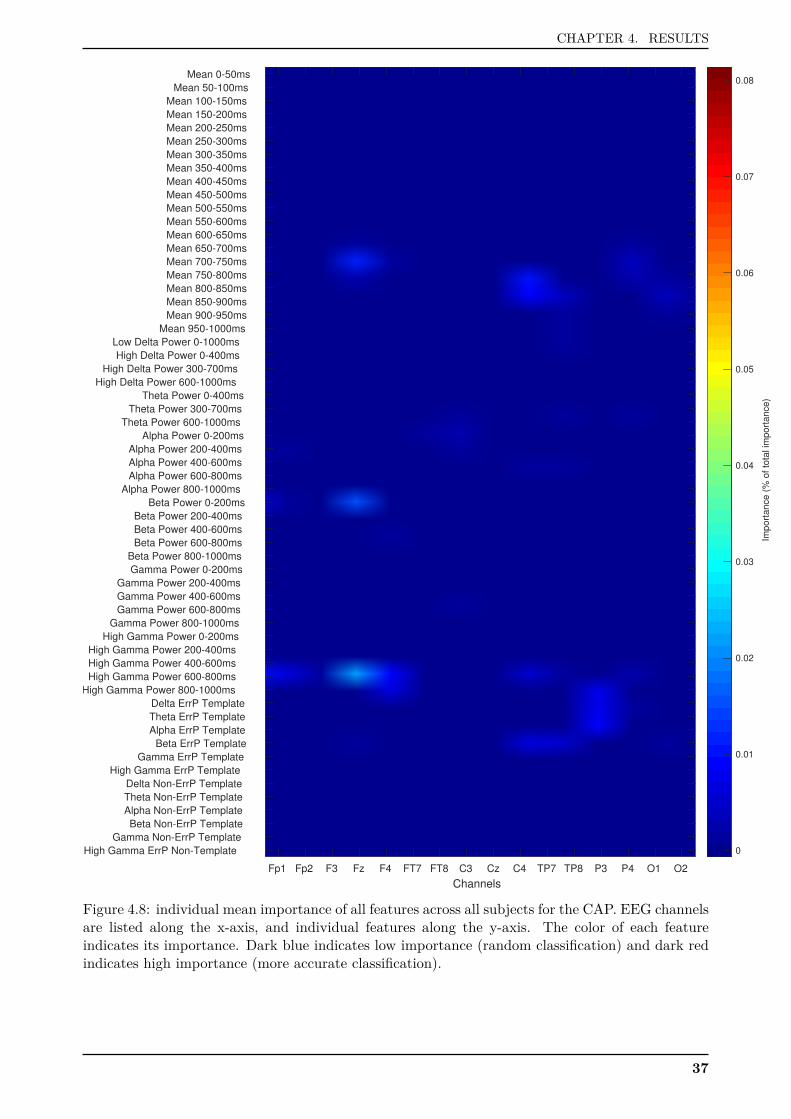
CHAPTER 4. RESULTS
Fp1 Fp2 F3 Fz F4 FT7 FT8 C3 Cz C4 TP7 TP8 P3 P4 O1 O2
Channels
Mean 0-50ms
Mean 50-100ms
Mean 100-150ms
Mean 150-200ms
Mean 200-250ms
Mean 250-300ms
Mean 300-350ms
Mean 350-400ms
Mean 400-450ms
Mean 450-500ms
Mean 500-550ms
Mean 550-600ms
Mean 600-650ms
Mean 650-700ms
Mean 700-750ms
Mean 750-800ms
Mean 800-850ms
Mean 850-900ms
Mean 900-950ms
Mean 950-1000ms
Low Delta Power 0-1000ms
High Delta Power 0-400ms
High Delta Power 300-700ms
High Delta Power 600-1000ms
Theta Power 0-400ms
Theta Power 300-700ms
Theta Power 600-1000ms
Alpha Power 0-200ms
Alpha Power 200-400ms
Alpha Power 400-600ms
Alpha Power 600-800ms
Alpha Power 800-1000ms
Beta Power 0-200ms
Beta Power 200-400ms
Beta Power 400-600ms
Beta Power 600-800ms
Beta Power 800-1000ms
Gamma Power 0-200ms
Gamma Power 200-400ms
Gamma Power 400-600ms
Gamma Power 600-800ms
Gamma Power 800-1000ms
High Gamma Power 0-200ms
High Gamma Power 200-400ms
High Gamma Power 400-600ms
High Gamma Power 600-800ms
High Gamma Power 800-1000ms
Delta ErrP Template
Theta ErrP Template
Alpha ErrP Template
Beta ErrP Template
Gamma ErrP Template
High Gamma ErrP Template
Delta Non-ErrP Template
Theta Non-ErrP Template
Alpha Non-ErrP Template
Beta Non-ErrP Template
Gamma Non-ErrP Template
High Gamma ErrP Non-Template 0
0.01
0.02
0.03
0.04
0.05
0.06
0.07
0.08
Imp
ort
an
ce
(%
of
tota
l im
po
rta
nce
)
Figure 4.8: individual mean importance of all features across all subjects for the CAP. EEG channelsare listed along the x-axis, and individual features along the y-axis. The color of each featureindicates its importance. Dark blue indicates low importance (random classification) and dark redindicates high importance (more accurate classification).
37
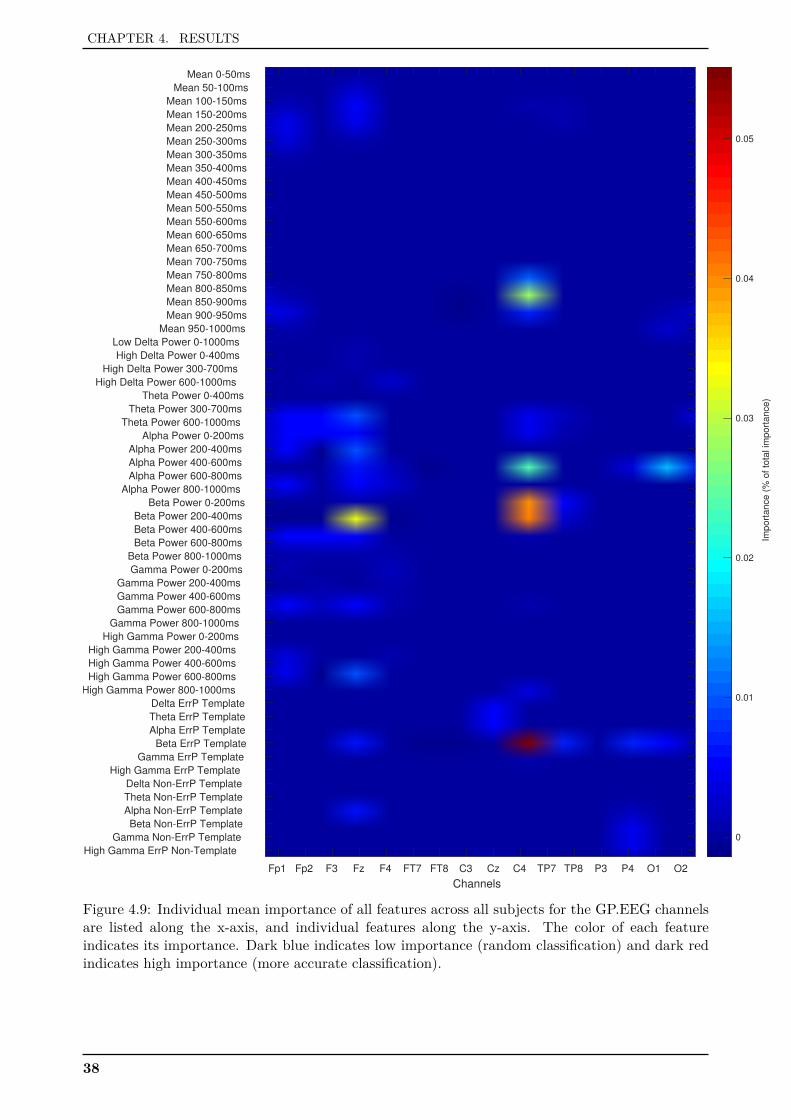
CHAPTER 4. RESULTS
Fp1 Fp2 F3 Fz F4 FT7 FT8 C3 Cz C4 TP7 TP8 P3 P4 O1 O2
Channels
Mean 0-50ms
Mean 50-100ms
Mean 100-150ms
Mean 150-200ms
Mean 200-250ms
Mean 250-300ms
Mean 300-350ms
Mean 350-400ms
Mean 400-450ms
Mean 450-500ms
Mean 500-550ms
Mean 550-600ms
Mean 600-650ms
Mean 650-700ms
Mean 700-750ms
Mean 750-800ms
Mean 800-850ms
Mean 850-900ms
Mean 900-950ms
Mean 950-1000ms
Low Delta Power 0-1000ms
High Delta Power 0-400ms
High Delta Power 300-700ms
High Delta Power 600-1000ms
Theta Power 0-400ms
Theta Power 300-700ms
Theta Power 600-1000ms
Alpha Power 0-200ms
Alpha Power 200-400ms
Alpha Power 400-600ms
Alpha Power 600-800ms
Alpha Power 800-1000ms
Beta Power 0-200ms
Beta Power 200-400ms
Beta Power 400-600ms
Beta Power 600-800ms
Beta Power 800-1000ms
Gamma Power 0-200ms
Gamma Power 200-400ms
Gamma Power 400-600ms
Gamma Power 600-800ms
Gamma Power 800-1000ms
High Gamma Power 0-200ms
High Gamma Power 200-400ms
High Gamma Power 400-600ms
High Gamma Power 600-800ms
High Gamma Power 800-1000ms
Delta ErrP Template
Theta ErrP Template
Alpha ErrP Template
Beta ErrP Template
Gamma ErrP Template
High Gamma ErrP Template
Delta Non-ErrP Template
Theta Non-ErrP Template
Alpha Non-ErrP Template
Beta Non-ErrP Template
Gamma Non-ErrP Template
High Gamma ErrP Non-Template
0
0.01
0.02
0.03
0.04
0.05
Imp
ort
an
ce
(%
of
tota
l im
po
rta
nce
)
Figure 4.9: Individual mean importance of all features across all subjects for the GP.EEG channelsare listed along the x-axis, and individual features along the y-axis. The color of each featureindicates its importance. Dark blue indicates low importance (random classification) and dark redindicates high importance (more accurate classification).
38
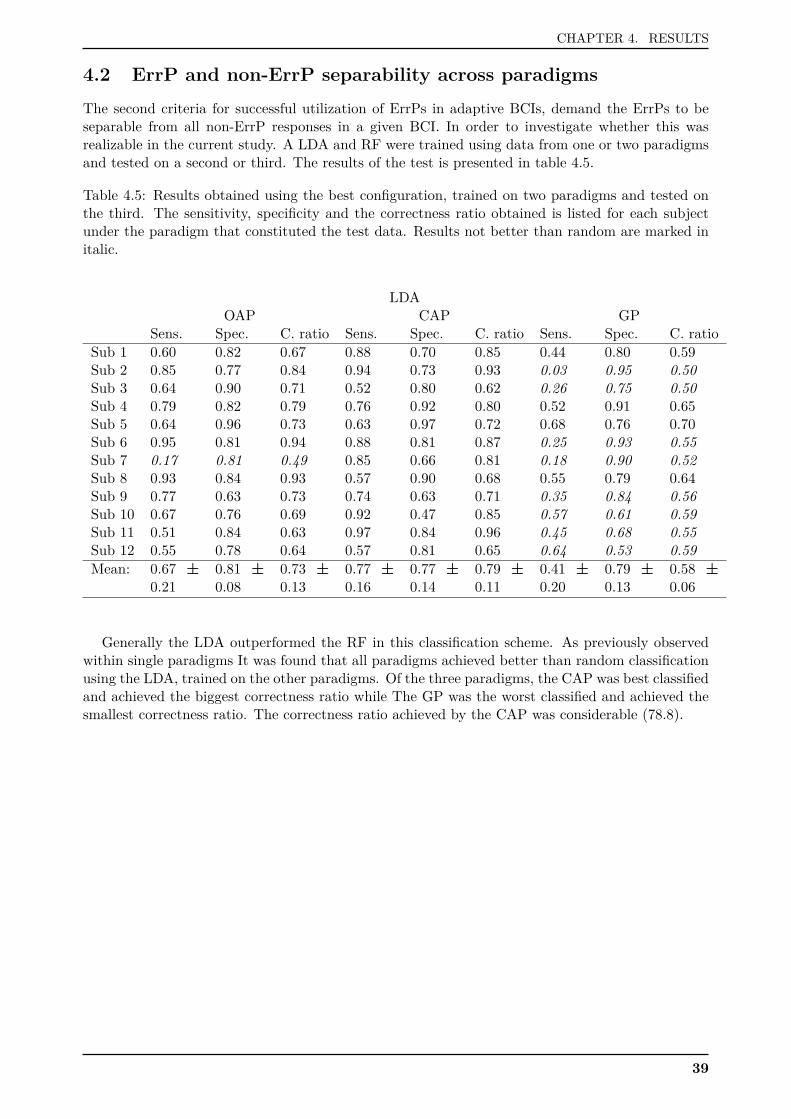
CHAPTER 4. RESULTS
4.2 ErrP and non-ErrP separability across paradigmsThe second criteria for successful utilization of ErrPs in adaptive BCIs, demand the ErrPs to beseparable from all non-ErrP responses in a given BCI. In order to investigate whether this wasrealizable in the current study. A LDA and RF were trained using data from one or two paradigmsand tested on a second or third. The results of the test is presented in table 4.5.
Table 4.5: Results obtained using the best configuration, trained on two paradigms and tested onthe third. The sensitivity, specificity and the correctness ratio obtained is listed for each subjectunder the paradigm that constituted the test data. Results not better than random are marked initalic.
LDAOAP CAP GP
Sens. Spec. C. ratio Sens. Spec. C. ratio Sens. Spec. C. ratioSub 1 0.60 0.82 0.67 0.88 0.70 0.85 0.44 0.80 0.59Sub 2 0.85 0.77 0.84 0.94 0.73 0.93 0.03 0.95 0.50Sub 3 0.64 0.90 0.71 0.52 0.80 0.62 0.26 0.75 0.50Sub 4 0.79 0.82 0.79 0.76 0.92 0.80 0.52 0.91 0.65Sub 5 0.64 0.96 0.73 0.63 0.97 0.72 0.68 0.76 0.70Sub 6 0.95 0.81 0.94 0.88 0.81 0.87 0.25 0.93 0.55Sub 7 0.17 0.81 0.49 0.85 0.66 0.81 0.18 0.90 0.52Sub 8 0.93 0.84 0.93 0.57 0.90 0.68 0.55 0.79 0.64Sub 9 0.77 0.63 0.73 0.74 0.63 0.71 0.35 0.84 0.56Sub 10 0.67 0.76 0.69 0.92 0.47 0.85 0.57 0.61 0.59Sub 11 0.51 0.84 0.63 0.97 0.84 0.96 0.45 0.68 0.55Sub 12 0.55 0.78 0.64 0.57 0.81 0.65 0.64 0.53 0.59Mean: 0.67 ±
0.210.81 ±0.08
0.73 ±0.13
0.77 ±0.16
0.77 ±0.14
0.79 ±0.11
0.41 ±0.20
0.79 ±0.13
0.58 ±0.06
Generally the LDA outperformed the RF in this classification scheme. As previously observedwithin single paradigms It was found that all paradigms achieved better than random classificationusing the LDA, trained on the other paradigms. Of the three paradigms, the CAP was best classifiedand achieved the biggest correctness ratio while The GP was the worst classified and achieved thesmallest correctness ratio. The correctness ratio achieved by the CAP was considerable (78.8).
39

Chapter 5Discussion
In the present study, error related potentials were elicited during three different paradigms, the overtarrow paradigm (OAP), the covert arrow paradigm (CAP) and the game paradigm (GP). It wasfound that the highest classification accuracy and correctness ratio could be achieved in the CAPusing no spatial filtering, selecting important features based on Random Forest feature importance,and using a LDA classifier. This configuration resulted in a sensitivity of 0.90 ± 0.07, specificity of0.72 ± 0.29 and a correctness ratio of 0.86 ± 0.12. Most discriminative information was found incentral region of cortex between 400 and 800 ms after feedback onset. The most important featureswas templates representing modulation of the spectral power of the theta band. For the three groupsthe area under the ROC was 0.92 %, for the CAP, 0.86 % for the OAP and 0.68 % for the GP.
Additionally it was found that ErrPs and non-ErrPs could be classified better than random whentraining epochs from two paradigms were used to classify the third. Using the CAP as test dataachieved the best results, giving a sensitivity of 0.77 ± 0.16, a specificity of 0.77 ± 0.14 and acorrectness ratio of 0.79 ± 0.11.
For the CAP when trained and classified alone, a mean correctness ratio of 86 % was achieved.If used for guiding adaptation of a naive system with an accuracy of 50 %, 86 % of the controlepochs used for classification would be correctly labeled. However for a system with an accuracyof e.g. 85 %, the percent of correctly labeled epochs used for adaptation would be substantiallyhigher, equalling 97 %.
ErrP detectionThe best configurations for classification of ErrPs versus non-ErrPs, was in this study found to be:no spatial filtering, RF feature selection and LDA classification for both the OAP and the CAP,while CAR filtering and PCA variance feature selection and LDA classification worked optimallyfor the GP. Based on these findings it is assumed that spatial filtering distorted the characteristicsof the ErrP epochs sufficiently to alter classification accuracy for the OAP and CAP.
Unlike during the OAP and the CAP it was not possible to ask the subjects to minimize blinkingas they played continuously, and thus did not have breaks for blinking. It is therefore likely thatthe epochs in the GP were more contaminated by blinks. Additionally, it is speculated that thecomplexity of the GP resulted in generally low classification accuracies. These limitations on theGP make room for spatial filtering to improve the signal quality, for detection. This could beinvestigated by recalculating the system performance after removing epochs visually contaminatedby blinks. In a ErrP based adaptation paradigm it would be adequate to always remove EOGcontaminated epochs to insure that the artifacts deos not impair adaptation.
Subject varianceWithin each of the three paradigms the performance of the subjects varied greatly. In the OAP,the performance of subject 7, 10, 11 and 12 was not above random classification, while subject 2, 4,5, 6 and 8 were classified with a specificity and a sensitivity above 80 %. In a study by Blankertzet al. [2010] it was found that the strength of a subjects resting state sensory motor rhythm (SMR)was correlated to the accuracy the subject could obtain using an SMR-modulation based BCI. Itwas therefore speculated that some subjects might be neurophysiologically disposed for beeing BCIilliterate. However, in the present study, subjects how did not performing better than chance levelin one paradigm, either the OAP or the CAP, performed better than chance level in the other.
41

CHAPTER 5. DISCUSSION
Hence poor subject performance can not fully be explained by general BCI illiteracy. If the sumof sensitivity and specificity equals 1, the classification is random. For subjects performing closeto randomly, the sensitivity tends to be close to 1 and the specificity close to 0. In these case thecorrectness ratio was very high and indicated good subject performance. Although this is a badindicator of the individual subjects performance, it does not influence the calculation of the meancorrectness ratio across subjects, as the ratio was calculated from the mean sensitivity and the meanspecificity instead of a mean of each subjects correctness ratio, thereby the ratio was not falselyenhanced by poorly performing subjects.
Timing of important featuresIn line with work by Milekovic et al. [2012] it was found that most of the discriminative features forErrP detection appears within the first 800 ms post system feedback. However, Schalk et al. [2000],Blankertz et al. [2003], Parra et al. [2003] and Parra et al. [2002] suggests that the ErrP appearsin the EEG within the first 260 ms, whereas the present work suggests that information feasiblefor ErrP detection is mostly present after 300 ms post feedback. In both the present work and thementioned studies, the subjects constantly faced a monitor that immediately following users actions,delivered the feedback that elicited the ErrP. Thus the experimental designs does not suggest thatthe high importance of information post 300 ms in the present work is caused by a delay in theexperiments deliverance of feedback. It was not investigated whether it was possible to detect ErrPssolely using data from the first 300 ms post feedback, and Schalk et al. [2000], Blankertz et al. [2003],Parra et al. [2003] and Parra et al. [2002] did not analyse data post 260 ms after feedback, thus thestudies are not completely comparable. However, analyzing features spanning over an entire secondfollowing feedback, the present study suggests higher importance of features within the window300-800 ms post feedback, compared to pre 260 ms following feedback.
The most important time segments in the classification of epochs from the GP, appears laterthan for the other paradigms. Additionally there is no indication that all discriminative informationis found within one second post feedback, as all time segments contained important features. Thelater part of the epochs in the GP might be contaminated with preparatory activity such as Bere-itschaftspotentials, as the game was played continuously. It is also possible that cortical activityinvolved in correcting the previous mistake in the GP, is a benefactor to importance of late timesegments, as this correcting action would only be present following an ErrP. However, the analysisof the GP here presented, is insufficient to answer whether cortical action-correction processes werepresent in the late ErrP epochs. However, it remains important that ErrPs can be accurately de-tected under different cortical loads, as real life BCI use might involve scenarios, where the user hasto consider more than only BCI control, and thus inevitably contaminate the control signal withother mental activity. Another reason why the performance of the GP was lower than for the OAPand CAP might be that subjects were aware that control errors in the game was not related totheir performance. This is worth investigating as it would affects how future ErrP studies shouldbe designed.
Localization of ErrPsAcross the three investigated paradigms OAP, CAP and GP, Cz and Fz were the most importantchannels. This is in accordance with Ferrez and del R Millan [2008], Buttfield et al. [2006], Kreilingeret al. [2016] and Schalk et al. [2000] that also found that ErrPs can be detected in frontal to centralregions and supports the assumption that ErrPs are elicited from the anterior cingulate cortex[Holroyd and Coles, 2002]. With the channels used in this study, the spatial resolution obtainablesuggests that ErrPs appears to be well localized, or at the least most quantifiable, at channels Czand Fz.
Milekovic et al. [2012, 2013] also found that the ErrPs could be found in the parietial andtemporal-parietial region. In the present work this is to some extend supported by the relative highimportance of TP7, however only during the OAP.
42
CHAPTER 5. DISCUSSION
Important features in ErrP detectionIn previous work, classification was based either on down sampled EEG or means of small segments[Blankertz et al., 2003, Buttfield et al., 2006, Kreilinger et al., 2016, Ferrez and del R Millan, 2008,Parra et al., 2002] and [Parra et al., 2003] or power within the alpha and beta band [Schalk et al.,2000]. In this study, theta band-power template-matching consistently provided a more importantfeature, compared to simple temporal features. Some of the information found in the theta band,might have been captured in previous studies using temporal features derived from low pass filteredEEG, but the present work suggests that more information is available if the band power of the signalis considered. In the GP, information from the gamma band was more important than informationfrom the theta band. To the best of our knowledge this is inconsistent with previous findings inEEG studies of ErrPs elicited post movement or movement intention, or at the least uninvestigated.However discriminative information in this frequency band has been found using ECoG Milekovicet al. [2012] for outcome errors but not for execution errors. This suggests that the present studymight have elicited outcome ErrPs. However, the design of the experimental paradigms, were tunedto elicit execution errors, while being inspired by other studies finding execution errors, thus thepresence of important theta frequencies does not imply the elicitation of outcome errors.
Cost EstimationFor subject 5 and 9 the ROC curve indicates that by using the right cost, the performance would beconsiderably better than what is reported in table 4.3. This emphasizes the importance of adjustingthe cost to the individual subjects, and optimization in general. It was unsuccessfully attemptedto optimize the cost using only training data. This indicates that for the suggested optimizationapproach, the training data was not sufficiently big to fully model the ErrP and non-ErrP classes.Further work is needed to determine if more or another within-training-data optimization approachcan reliably estimate proper subject specific misclassification cost. The possibility of insufficientlybig sets of training data is further emphasized by the performance of subject 10 during the OAP.Using the general cost function used across subjects, both sensitivity and specificity of subject 10 iscomparable to random classification, but the ROC curve for subject 10 indicates that remarkablybetter performance could be obtain for that subject.
Generalizability of ErrPs across paradigmsIn order to investigate the generalizability of ErrPs across paradigms, a leave-one-out approach wasused, to see how a classifier would perform if trained on all data from two paradigms, and testedon the third. This was done for all paradigms.
It was found that classification accuracies for the different paradigms were generally high, con-sidering that no optimization efforts were made, to the specific classification scheme. The resultsimply that ErrP detection in this study, complies with the second criteria of usage of ErrPs forBCI adaptation. As it was possible to better than randomly classify ErrPs and non-ErrPs for aparadigm, when trained on others, there must be some general separability of ErrPs and non-ErrPs,independently on the control classes performed, before ErrPs where elicited.
The similarity of ErrPs across the three paradigms is promising. Further work shoud asseswhether ErrPs also can be detected across motor paradigms, abstract paradigms and speech paradigms.Finally ErrP guided adaptation should be tested online, in a long-term scenario. Two questions re-mains: how does ErrP guided adaptation compare to naive adaptation of control classes in practice,and can the ErrP and non-ErrP class be naively adapted without losing accuracy?
43
CHAPTER 5. DISCUSSION
5.1 ConclusionError related potentials are evoked in response to erroneous predection and actuation by a BCI.Detection of error related potentials provides prediction-independent means for guiding adaptation,and potentially enables more accurate adaptation of a BCI. In this work it was investigated iferror related potentials could be reliably classified and detected independently of the user intention.This study demonstrated that error potentials evoked during three different paradigms of intentionclasses, could be comparably accurately classified after training the classifier with either data fromthe same paradigm as the test data or data from two other paradigms. This strongly suggests thatsome properties of error related potentials are independent of the misclassified user intention, andthus error related potentials can be used for nominating epochs usable for adaptation in a BCI.
44
References
Aliakbaryhosseinabadi, Jiang, Petrini, Farina, and Dremstrup, 2015. S Aliakbaryhos-seinabadi, N Jiang, L Petrini, D Farina, and K Dremstrup. Robustness of Movement DetectionTechniques from Motor Execution : single trial movement related cortical potential. Neural Engi-neering, 7th Intern, 13–16, 2015. doi: 10.1109/NER.2015.7146548.
Ang and Guan, dec 2016. Kai Keng Ang and Cuntai Guan. EEG-based strategies to detect motorimagery for control and rehabilitation. IEEE transactions on neural systems and rehabilitationengineering : a publication of the IEEE Engineering in Medicine and Biology Society, 2016. ISSN1558-0210 (Electronic). doi: 10.1109/TNSRE.2016.2646763.
Bamdadian, Guan, Ang, and Xu, 2013. A Bamdadian, C Guan, K K Ang, and J Xu. Improv-ing session-to-session transfer performance of motor imagery-based BCI using Adaptive ExtremeLearning Machine. Conference proceedings : ... Annual International Conference of the IEEEEngineering in Medicine and Biology Society. IEEE Engineering in Medicine and Biology Society.Annual Conference, 2013, 2188–2191, 2013. ISSN 1557-170X. doi: 10.1109/EMBC.2013.6609969.
Barkat, 2005. Mourad Barkat. Signal Detection and Estimation, volume 1. Artech House, 2edition, 2005. ISBN 9788578110796. doi: 10.1017/CBO9781107415324.004.
Bi, Fan, and Liu, 2013. Luzheng Bi, Xin-an Fan, and Yili Liu. EEG-Based Brain-ControlledMobile Robots : A Survey. IEEE Transactions on Human-Machine Systems, 43(2), 161–176, 2013.ISSN 21682291. doi: 10.1109/TSMCC.2012.2219046.
Blankertz, Dornhege, Schafer, Krepki, Kohlmorgen, Muller, Kunzmann, Losch, Cu-rio, Schäfer, Krepki, Kohlmorgen, Müller, Kunzmann, Losch, and Curio, jun 2003.Benjamin Blankertz, Guido Dornhege, Christin Schafer, Roman Krepki, Jens Kohlmorgen, Klaus-Robert Muller, Volker Kunzmann, Florian Losch, Gabriel Curio, C Schäfer, Roman Krepki, JensKohlmorgen, K.-R. Müller, Volker Kunzmann, Florian Losch, and Gabriel Curio. Boosting bitrates and error detection for the classification of fast-paced motor commands based on single-trialEEG analysis. IEEE transactions on neural systems and rehabilitation engineering : a publicationof the IEEE Engineering in Medicine and Biology Society, 11(2), 127–131, 2003. ISSN 1534-4320(Print). doi: 10.1109/TNSRE.2003.814456.
Blankertz, Sannelli, Halder, Hammer, Kübler, Müller, Curio, and Dickhaus, 2010.Benjamin Blankertz, Claudia Sannelli, Sebastian Halder, Eva M. Hammer, Andrea Kübler,Klaus Robert Müller, Gabriel Curio, and Thorsten Dickhaus. Neurophysiological predictor ofSMR-based BCI performance. NeuroImage, 51(4), 1303–1309, 2010. ISSN 10538119. doi:10.1016/j.neuroimage.2010.03.022.
Breiman, 2001. Leo Breiman. Random Forests. pages 1–33, 2001. ISSN 1098-6596. doi: 10.1017/CBO9781107415324.004.
Breiman, 2002. Leo Breiman. Manual on setting up, using, and understanding random forestsv3.1. page 29, 2002. doi: 10.2776/85168.
Bryan, Martin, Cheung, and Rao, dec 2013. Matthew J Bryan, Stefan A Martin, WillyCheung, and Rajesh P N Rao. Probabilistic co-adaptive brain-computer interfacing. Journal ofneural engineering, 10(6), 66008, 2013. ISSN 1741-2552 (Electronic). doi: 10.1088/1741-2560/10/6/066008.
Buttfield, Ferrez, and Millán, jun 2006. Anna Buttfield, Pierre W. Ferrez, and José Del RMillán. Towards a robust BCI: Error potentials and online learning. IEEE Transactions on
45
REFERENCES
Neural Systems and Rehabilitation Engineering, 14(2), 164–168, 2006. ISSN 15344320. doi:10.1109/TNSRE.2006.875555.
Chamanzar, Malekmohammadi, Bahrani, and Shabany, 2015. A Chamanzar, A Malek-mohammadi, M Bahrani, and M Shabany. Accurate single-trial detection of movement intentionmade possible using adaptive wavelet transform. Conference proceedings : ... Annual Interna-tional Conference of the IEEE Engineering in Medicine and Biology Society. IEEE Engineeringin Medicine and Biology Society. Annual Conference, 2015, 1914–1917, 2015. ISSN 1557-170X.doi: 10.1109/EMBC.2015.7318757.
Chavarriaga, Sobolewski, and Millan, 2014. Ricardo Chavarriaga, Aleksander Sobolewski,and Jose Del R Millan. Errare machinale est: the use of error-related potentials in brain-machineinterfaces. Frontiers in neuroscience, 8, 208, 2014. ISSN 1662-4548 (Print). doi: 10.3389/fnins.2014.00208.
Combaz, Chatelle, Robben, Vanhoof, Goeleven, Thijs, Van Hulle, and Laureys, 2013.Adrien Combaz, Camille Chatelle, Arne Robben, Gertie Vanhoof, Ann Goeleven, Vincent Thijs,Marc M. Van Hulle, and Steven Laureys. A Comparison of Two Spelling Brain-Computer In-terfaces Based on Visual P3 and SSVEP in Locked-In Syndrome. PLoS ONE, 8(9), 2013. ISSN19326203. doi: 10.1371/journal.pone.0073691.
Diedrichsen, Hashambhoy, Rane, and Shadmehr, 2006. Jörn Diedrichsen, Yasmin Hashamb-hoy, Tushar Rane, and Reza Shadmehr. Neural Correlates of Reach Errors. 25(43), 9919–9931,2006.
Faller, Vidaurre, Solis-Escalante, Neuper, and Scherer, 2012. J Faller, C Vidaurre, T Solis-Escalante, C Neuper, and R Scherer. Autocalibration and recurrent adaptation: towards a plugand play online ERD-BCI. IEEE transactions on neural systems and rehabilitation engineering: a publication of the IEEE Engineering in Medicine and Biology Society, 20(3), 313–319, 2012.ISSN 1558-0210. doi: 10.1109/TNSRE.2012.2189584.
Faller, Scherer, Costa, Opisso, Medina, and Müller-Putz, 2014. J Faller, R Scherer,U Costa, E Opisso, J Medina, and G R Müller-Putz. A co-adaptive brain-computer interfacefor end users with severe motor impairment. PLoS ONE, 9(7), 2014. ISSN 1932-6203. doi:10.1371/journal.pone.0101168.
Fernandez-Vargas, Pfaff, Rodríguez, and Varona, 2013. J Fernandez-Vargas, H U Pfaff, F BRodríguez, and P Varona. Assisted closed-loop optimization of SSVEP-BCI efficiency. Frontiersin Neural Circuits, (FEBRUARY 2013), 2013. ISSN 1662-5110. doi: 10.3389/fncir.2013.00027.
Ferrez and del R Millan, mar 2008. Pierre W Ferrez and Jose del R Millan. Error-relatedEEG potentials generated during simulated brain-computer interaction. IEEE transactions onbio-medical engineering, 55(3), 923–929, 2008. ISSN 0018-9294 (Print). doi: 10.1109/TBME.2007.908083.
Galan, Nuttin, Lew, Ferrez, Vanacker, Philips, and Millán, 2008. F Galan, M Nuttin,E Lew, P W Ferrez, G Vanacker, J Philips, and J d. R Millán. A brain-actuated wheelchair:Asynchronous and non-invasive Brain-computer interfaces for continuous control of robots. Clin-ical neurophysiology : official journal of the International Federation of Clinical Neurophysiology,119, 2159–2169, 2008. doi: 10.1016/j.clinph.2008.06.001[doi].
Gillespie, 2016. Patrick Gillespie. JavaScript Snake, 2016. URL https://github.com/patorjk/JavaScript-Snake.
Hazrati and Erfanian, 2008. M K Hazrati and A Erfanian. An on-line BCI for control of handgrasp sequence and holding using adaptive probabilistic neural network. Conference proceedings: ... Annual International Conference of the IEEE Engineering in Medicine and Biology Society.
46
REFERENCES
IEEE Engineering in Medicine and Biology Society. Conference, 2008, 1009–1012, 2008. ISSN1557-170X.
Hazrati and Erfanian, 2010. M K Hazrati and A Erfanian. An online EEG-based brain-computerinterface for controlling hand grasp using an adaptive probabilistic neural network. Medical Engi-neering and Physics, 32(7), 730–739, 2010. ISSN 1350-4533. doi: 10.1016/j.medengphy.2010.04.016.
Holroyd and Coles, 2002. Clay B. Holroyd and Michael G.H. Coles. The neural basis of humanerror processing: Reinforcement learning, dopamine, and the error-related negativity. Psycholog-ical Review, 109(4), 679–709, 2002. ISSN 1939-1471. doi: 10.1037/0033-295X.109.4.679.
Hsu, Pion-Tonachini, Jung, and Cauwenberghs, 2015. Sheng-Hsiou Hsu, Luca Pion-Tonachini, Tzyy-Ping Jung, and Gert Cauwenberghs. Tracking non-stationary EEG sources usingadaptive online recursive independent component analysis. Conference proceedings : ... AnnualInternational Conference of the IEEE Engineering in Medicine and Biology Society. IEEE En-gineering in Medicine and Biology Society. Annual Conference, 2015, 4106–4109, 2015. ISSN1557-170X (Print). doi: 10.1109/EMBC.2015.7319297.
Hsu, Mullen, Jung, and Cauwenberghs, mar 2016. Sheng-Hsiou Hsu, Tim R Mullen, Tzyy-Ping Jung, and Gert Cauwenberghs. Real-Time Adaptive EEG Source Separation Using OnlineRecursive Independent Component Analysis. IEEE transactions on neural systems and rehabili-tation engineering : a publication of the IEEE Engineering in Medicine and Biology Society, 24(3), 309–319, 2016. ISSN 1558-0210 (Electronic). doi: 10.1109/TNSRE.2015.2508759.
Huggins, Moinuddin, Chiodo, and Wren, 2015. Jane E. Huggins, Aisha A. Moinuddin,Anthony E. Chiodo, and Patricia A. Wren. What would brain-computer interface users want:opinions and priorities of potential users with spinal cord injury. Archives of physical medicineand rehabilitation, 96(3), e1–e5, 2015. ISSN 1532821X. doi: 10.1016/j.apmr.2014.05.028.
Jeyabalan, Samraj, and Loo, 2010. V Jeyabalan, A Samraj, and C K Loo. Motor imaginary-based brain-machine interface design using programmable logic controllers for the disabled.Computer methods in biomechanics and biomedical engineering, 13(5), 617–623, 2010. doi:10.1080/10255840903405678[doi].
Jochumsen, Niazi, Mrachacz-Kersting, Farina, and Dremstrup, 2013. Mads Jochumsen,Imran Khan Niazi, Natalie Mrachacz-Kersting, Dario Farina, and Kim Dremstrup. Detection andclassification of movement-related cortical potentials associated with task force and speed. Journalof neural engineering, 10(5), 2013. ISSN 1741-2552. doi: 10.1088/1741-2560/10/5/056015.
Kam, Suk, and Lee, 2013. Tae Eui Kam, Heung Il Suk, and Seong Whan Lee. Non-homogeneousspatial filter optimization for ElectroEncephaloGram (EEG)-based motor imagery classification.Neurocomputing, 108, 58–68, 2013. ISSN 09252312. doi: 10.1016/j.neucom.2012.12.002.
Kilicarslan, Grossman, and Contreras-Vidal, 2016. A Kilicarslan, R G Grossman, and J LContreras-Vidal. A robust adaptive denoising framework for real-time artifact removal in scalpEEG measurements. Journal of Neural Engineering, 13(2), 2016. ISSN 1741-2552. doi: 10.1088/1741-2560/13/2/026013.
Krauledat and Naturwissenschaften, 2008. Matthias Krauledat and Doktor Der Naturwis-senschaften. Analysis of Nonstationarities in EEG Signals for Improving Brain-Computer Inter-face Performance. page 139, 2008.
Kreilinger, Hiebel, and Muller-Putz, mar 2016. Alex Kreilinger, Hannah Hiebel, and Ger-not R Muller-Putz. Single Versus Multiple Events Error Potential Detection in a BCI-ControlledCar Game With Continuous and Discrete Feedback. IEEE transactions on bio-medical engineer-ing, 63(3), 519–529, 2016. ISSN 1558-2531 (Electronic). doi: 10.1109/TBME.2015.2465866.
47
REFERENCES
Lee, 2012. Kijoon Lee. Function for estimating the Sample Entropy, 2012.
Li, Li, and Guan, 2006. Huiqi Li, Yuanqing Li, and Cuntai Guan. An effective BCI speller basedon semi-supervised learning. Conference proceedings : ... Annual International Conference of theIEEE Engineering in Medicine and Biology Society. IEEE Engineering in Medicine and BiologySociety. Annual Conference, 1, 1161–1164, 2006. ISSN 1557-170X (Print). doi: 10.1109/IEMBS.2006.260694.
Li and Zhang, 2010. J Li and L Zhang. Bilateral adaptation and neurofeedback for brain computerinterface system. Journal of neuroscience methods, 193, 373–379, 2010. doi: 10.1016/j.jneumeth.2010.09.010[doi].
Li and Guan, 2006a. Y Li and C Guan. A semi-supervised SVM learning algorithm for jointfeature extraction and classification in brain computer interfaces. Conference proceedings : ...Annual International Conference of the IEEE Engineering in Medicine and Biology Society. IEEEEngineering in Medicine and Biology Society. Conference, 1, 2570–2573, 2006. ISSN 1557-170X.
Li and Guan, 2006b. Y Li and C Guan. An extended em algorithm for joint feature extractionand classification in brain-computer interfaces. Neural Computation, 18(11), 2730–2761, 2006.ISSN 0899-7667. doi: 10.1162/neco.2006.18.11.2730.
Li, Kambara, Koike, and Sugiyama, jun 2010. Yan Li, Hiroyuki Kambara, Yasuharu Koike,and Masashi Sugiyama. Application of covariate shift adaptation techniques in brain-computerinterfaces. IEEE transactions on bio-medical engineering, 57(6), 1318–1324, 2010. ISSN 1558-2531(Electronic). doi: 10.1109/TBME.2009.2039997.
Llera, Gerven, Gómez, Jensen, and Kappen, 2011. A Llera, M A J van Gerven, V Gómez,O Jensen, and H J Kappen. On the use of interaction error potentials for adaptive brain computerinterfaces. Neural Networks, 24(10), 1120–1127, 2011. ISSN 0893-6080. doi: 10.1016/j.neunet.2011.05.006.
Lu, Guan, and Zhang, 2009. S Lu, C Guan, and H Zhang. Unsupervised brain computer interfacebased on intersubject information and online adaptation. IEEE Transactions on Neural Systemsand Rehabilitation Engineering, 17(2), 135–145, 2009. ISSN 1534-4320. doi: 10.1109/TNSRE.2009.2015197.
Lule, Noirhomme, Kleih, Chatelle, Halder, Demertzi, Bruno, Gosseries, Vanhauden-huyse, Schnakers, Thonnard, Soddu, Andrea Kubler, and Laureys, 2013. DorothéeLule, Quentin Noirhomme, Sonja C. Kleih, Camille Chatelle, Sebastian Halder, Athena De-mertzi, Marie-Aurélie Bruno, Olivia Gosseries, Audrey Vanhaudenhuyse, Caroline Schnakers,Marie Thonnard, Andrea Soddu, Andrea Kubler, and Steven Laureys. Probing command fol-lowing in patients with disorders of consciousness using a brain-computer interface. Clinicalneurophysiology : official journal of the International Federation of Clinical Neurophysiology, 124(1 PG - 101-106), 101–106, 2013. doi: 10.1016/j.clinph.2012.04.030[doi].
Mak, Arbel, Minett, McCane, Yuksel, Ryan, Thompson, Bianchi, and Erdogmus, 2011.J N Mak, Y Arbel, J W Minett, L M McCane, B Yuksel, D Ryan, D Thompson, L Bianchi, andD Erdogmus. Optimizing the P300-based brain-computer interface: current status, limitationsand future directions. Journal of neural engineering, 8(2), 025003, 2011. ISSN 1741-2560. doi:10.1088/1741-2560/8/2/025003.
Marathe, Lawhern, Wu, Slayback, and Lance, mar 2016. Amar R Marathe, Vernon JLawhern, Dongrui Wu, David Slayback, and Brent J Lance. Improved Neural Signal Classificationin a Rapid Serial Visual Presentation Task using Active Learning. IEEE transactions on neuralsystems and rehabilitation engineering : a publication of the IEEE Engineering in Medicine andBiology Society, 24(3), 333–343, 2016. ISSN 1558-0210 (Electronic). doi: 10.1109/TNSRE.2015.2502323.
48
REFERENCES
Milekovic, Ball, Schulze-Bonhage, Aertsen, and Mehring, apr 2012. Tomislav Milekovic,Tonio Ball, Andreas Schulze-Bonhage, Ad Aertsen, and Carsten Mehring. Error-related electro-corticographic activity in humans during continuous movements. Journal of neural engineering, 9(2), 26007, 2012. ISSN 1741-2552 (Electronic). doi: 10.1088/1741-2560/9/2/026007.
Milekovic, Ball, Schulze-Bonhage, Aertsen, and Mehring, 2013. Tomislav Milekovic, TonioBall, Andreas Schulze-Bonhage, Ad Aertsen, and Carsten Mehring. Detection of error relatedneuronal responses recorded by electrocorticography in humans during continuous movements.PloS one, 8(2), e55235, 2013. ISSN 1932-6203 (Electronic). doi: 10.1371/journal.pone.0055235.
Minguillon, Lopez-Gordo, and Pelayo, 2017. J Minguillon, M A Lopez-Gordo, and F Pelayo.Trends in EEG-BCI for daily-life: Requirements for artifact removal. Biomedical Signal Process-ing and Control, 31, 407–418, 2017. ISSN 1746-8108. doi: 10.1016/j.bspc.2016.09.005.
Mohammadi, Mahloojifar, and Coyle, 2013. Raheleh Mohammadi, Ali Mahloojifar, andDamien Coyle. Unsupervised short-term covariate shift minimization for self-paced BCI. Pro-ceedings of the 2013 IEEE Symposium on Computational Intelligence, Cognitive Algorithms,Mind, and Brain, CCMB 2013 - 2013 IEEE Symposium Series on Computational Intelligence,SSCI 2013, (i), 101–106, 2013. doi: 10.1109/CCMB.2013.6609172.
Mondini, Mangia, and Cappello, 2016. Valeria Mondini, Anna Lisa Mangia, and Angelo Cap-pello. EEG-Based BCI System Using Adaptive Features Extraction and Classification Procedures.Computational intelligence and neuroscience, 2016, 4562601, 2016. ISSN 1687-5273 (Electronic).doi: 10.1155/2016/4562601.
Müller-Putz, Steyrl, Faller, Muller-Putz, Steyrl, Faller, Müller-Putz, Steyrl, and Faller,2014. G R Müller-Putz, David Steyrl, Josef Faller, Gernot R Muller-Putz, David Steyrl, JosefFaller, G R Müller-Putz, David Steyrl, and Josef Faller. Adaptive hybrid brain-computer in-teraction: ask a trainer for assistance! Conference proceedings : ... Annual InternationalConference of the IEEE Engineering in Medicine and Biology Society. IEEE Engineering inMedicine and Biology Society. Annual Conference, 2014, 1493–1496, 2014. ISSN 1557-170X.doi: 10.1109/EMBC.2014.6943884.
Müller-putz, Scherer, Brunner, Leeb, and Pfurtscheller, 2008. Gernot R Müller-putz,Reinhold Scherer, Clemens Brunner, Robert Leeb, and Gert Pfurtscheller. Better than random ?A closer look on BCI results. International Jouranl of Bioelectromagnetism, 10(1), 52–55, 2008.
Nicolas-Alonso, Corralejo, Gomez-Pilar, Álvarez, and Hornero, 2015. L F Nicolas-Alonso,R Corralejo, J Gomez-Pilar, D Álvarez, and R Hornero. Adaptive semi-supervised classification toreduce intersession non-stationarity in multiclass motor imagery-based brain-computer interfaces.Neurocomputing, 159(1), 186–196, 2015. ISSN 1872-8286. doi: 10.1016/j.neucom.2015.02.005.
Oshiro and Perez, 2012. Thais Mayumi Oshiro and Pedro Santoro Perez. Machine Learning andData Mining in Pattern Recognition. 7376(November), 2012. doi: 10.1007/978-3-642-31537-4.
Parra, Spence, Gerson, and Sajda, 2003. L C Parra, C D Spence, A D Gerson, and P Sajda.Response error correction - A demonstration of improved human-machine performance using real-time EEG monitoring. IEEE Transactions on Neural Systems and Rehabilitation Engineering,11(2), 173–177, 2003. ISSN 1534-4320. doi: 10.1109/TNSRE.2003.814446.
Parra, Alvino, Tang, Pearlmutter, Yeung, Osman, and Sajda, 2002. Lucas Parra, ChrisAlvino, Akaysha Tang, Barak Pearlmutter, Nick Yeung, Allen Osman, and Paul Sajda. LinearSpatial Integration for Single-Trial Detection in Encephalography. NeuroImage, 17, 223–230, 2002.ISSN 10538119. doi: 10.1006/nimg.2002.1212.
Perdikis, Leeb, and Millán, 2016. S Perdikis, R Leeb, and J D R Millán. Context-aware adaptivespelling in motor imagery BCI. Journal of Neural Engineering, 13(3), 2016. ISSN 1741-2552. doi:10.1088/1741-2560/13/3/036018.
49
REFERENCES
Pfurtscheller and Lopes, 1999. G Pfurtscheller and F H Lopes. Event-related EEG / MEGsynchronization and desynchronization : basic principles. Clinical Neurophysiology, 110, 1842–1857, 1999.
Saeid Sanei, J. A. Chambers, and Karl E. Misulis. Introduction to EEG. In EEG Signal Processing,chapter 1, pages 1–34. 2007. ISBN 9780199985906. doi: 10.1093/med/9780199985906.003.0001.
Sannelli, Vidaurre, Müller, and Blankertz, 2012. C Sannelli, C Vidaurre, K R Müller, andB Blankertz. Common Spatial Pattern Patches: online evaluation on BCI-naive users. Conferenceproceedings : ... Annual International Conference of the IEEE Engineering in Medicine andBiology Society. IEEE Engineering in Medicine and Biology Society. Conference, 2012, 4744–4747, 2012. ISSN 1557-170X.
Sannelli, Vidaurre, Müller, and Blankertz, 2016. C Sannelli, C Vidaurre, K.-R. Müller,and B Blankertz. Ensembles of adaptive spatial filters increase BCI performance: An onlineevaluation. Journal of Neural Engineering, 13(4), 2016. ISSN 1741-2552. doi: 10.1088/1741-2560/13/4/046003.
Schalk, Wolpaw, McFarland, and Pfurtscheller, dec 2000. G Schalk, J R Wolpaw, D J Mc-Farland, and G Pfurtscheller. EEG-based communication: presence of an error potential. Clinicalneurophysiology : official journal of the International Federation of Clinical Neurophysiology, 111(12), 2138–2144, 2000. ISSN 1388-2457 (Print).
Scherer, Faller, Opisso, Costa, Steyrl, and Muller-Putz, 2015. R Scherer, J Faller, E Opisso,U Costa, D Steyrl, and G R Muller-Putz. Bring mental activity into action! An enhanced onlineco-adaptive brain-computer interface training protocol. Conference proceedings : ... Annual Inter-national Conference of the IEEE Engineering in Medicine and Biology Society. IEEE Engineeringin Medicine and Biology Society. Annual Conference, 2015, 2323–2326, 2015. ISSN 1557-170X.doi: 10.1109/EMBC.2015.7318858.
Shenoy, Krauledat, Blankertz, Rao, and Müller, 2006. Pradeep Shenoy, Matthias Krauledat,Benjamin Blankertz, Rajesh P N Rao, and Klaus-Robert Müller. Towards adaptive classificationfor BCI. Journal of neural engineering, 3(1), R13–R23, 2006. ISSN 1741-2560. doi: 10.1088/1741-2560/3/1/R02.
Shin, Lee, Ahn, Cho, Jun, and Lee, 2015. Y Shin, S Lee, M Ahn, H Cho, S C Jun, andH.-N. Lee. Noise robustness analysis of sparse representation based classification method for non-stationary EEG signal classification. Biomedical Signal Processing and Control, 21, 8–18, 2015.ISSN 1746-8108. doi: 10.1016/j.bspc.2015.05.007.
Song and Yoon, 2015. X Song and S.-C. Yoon. Improving brain-computer interface classificationusing adaptive common spatial patterns. Computers in Biology and Medicine, 61, 150–160, 2015.ISSN 1879-0534. doi: 10.1016/j.compbiomed.2015.03.023.
Sun and Zhang, 2006. S Sun and C Zhang. Adaptive feature extraction for EEG signal classifica-tion. Medical and Biological Engineering and Computing, 44(10), 931–935, 2006. ISSN 0140-0118.doi: 10.1007/s11517-006-0107-4.
Sykacek, Roberts, and Stokes, 2004. P Sykacek, S J Roberts, and M Stokes. Adaptive BCIBased on Variational Bayesian Kalman Filtering: An Empirical Evaluation. IEEE Transactionson Biomedical Engineering, 51(5), 719–727, 2004. ISSN 0018-9294. doi: 10.1109/TBME.2004.824128.
Thomas, Guan, Lau, Vinod, and Ang, 2011. K P Thomas, C Guan, C T Lau, A P Vinod, andK K Ang. Adaptive tracking of discriminative frequency components in electroencephalograms fora robust brain-computer interface. Journal of Neural Engineering, 8(3), 2011. ISSN 1741-2560.doi: 10.1088/1741-2560/8/3/036007.
50
REFERENCES
Tonet, Marinelli, Citi, Rossini, Rossini, Megali, and Dario, 2008. Oliver Tonet, Mar-tina Marinelli, Luca Citi, Paolo Maria Rossini, Luca Rossini, Giuseppe Megali, and Paolo Dario.Defining brain-machine interface applications by matching interface performance with device re-quirements. Journal of neuroscience methods, 167(1), 91–104, 2008. ISSN 0165-0270. doi:10.1016/j.jneumeth.2007.03.015.
Vidaurre, Schlögl, Cabeza, Scherer, and Pfurtscheller, 2005. C Vidaurre, A Schlögl,R Cabeza, R Scherer, and G Pfurtscheller. Adaptive on-line classification for EEG-based BrainComputer Interfaces with ARR parameters and band power estimates. Biomedizinische Technik,50(11), 350–354, 2005. ISSN 0013-5585. doi: 10.1515/BMT.2005.049.
Vidaurre, Schlogl, Cabeza, Scherer, and Pfurtscheller, jun 2006. C Vidaurre, A Schlogl,R Cabeza, R Scherer, and G Pfurtscheller. A fully on-line adaptive BCI. IEEE transactions onbio-medical engineering, 53(6), 1214–1219, 2006. ISSN 0018-9294 (Print). doi: 10.1109/TBME.2006.873542.
Vidaurre, Schlögl, Cabeza, Scherer, and Pfurtscheller, 2007. C Vidaurre, A Schlögl,R Cabeza, R Scherer, and G Pfurtscheller. Study of on-line adaptive discriminant analysis forEEG-based brain computer interfaces. IEEE Transactions on Biomedical Engineering, 54(3),550–556, 2007. ISSN 0018-9294. doi: 10.1109/TBME.2006.888836.
Vidaurre, Kawanabe, Von Bünau, Blankertz, and Müller, 2011a. C Vidaurre, M Kawan-abe, P Von Bünau, B Blankertz, and K R Müller. Toward unsupervised adaptation of LDAfor brain-computer interfaces. IEEE Transactions on Biomedical Engineering, 58(3 PART 1),587–597, 2011. ISSN 0018-9294. doi: 10.1109/TBME.2010.2093133.
Vidaurre, Sannelli, Müller, and Blankertz, 2011b. C Vidaurre, C Sannelli, K.-R. Müller, andB Blankertz. Machine-learning-based coadaptive calibration for brain-computer interfaces. Neuralcomputation, 23(3), 791–816, 2011. ISSN 1530-888X. doi: 10.1162/NECO_a_00089.
Vidaurre, Sannelli, Müller, and Blankertz, 2011c. Carmen Vidaurre, Claudia Sannelli, Klaus-Robert Müller, and Benjamin Blankertz. Co-adaptive calibration to improve BCI efficiency.Journal of Neural Engineering, 8(2), 025009, 2011. ISSN 1741-2552. doi: 10.1088/1741-2560/8/2/025009.
Wang, Xu, Wang, and Zhang, 2011. J Wang, G.-z. Xu, L Wang, and H.-y. Zhang. Featuresextraction of brain-computer interface based on adaptive autoregressive models. Journal of ClinicalRehabilitative Tissue Engineering Research, 15(48), 9007–9010, 2011. ISSN 1673-8225. doi:10.3969/j.issn.1673-8225.2011.48.019.
Wang, Xu, Wang, Yang, and Yan, jan 2007. Lei Wang, Guizhi Xu, Jiang Wang, Shuo Yang,and Weili Yan. Feature extraction of mental task in BCI based on the method of approximateentropy. Conference proceedings : ... Annual International Conference of the IEEE Engineeringin Medicine and Biology Society. IEEE Engineering in Medicine and Biology Society. AnnualConference, 2007, 1941–4, 2007. ISSN 1557-170X. doi: 10.1109/IEMBS.2007.4352697.
Wang, Chaovalitwongse, and Wong, 2014. S Wang, W A Chaovalitwongse, and S Wong. Agradient-based adaptive learning framework for online seisure prediction. International journal ofdata mining and bioinformatics, 10(1), 49–64, 2014. ISSN 1748-5673.
Wang, Veluvolu, and Lee, 2013. Y Wang, K C Veluvolu, and M Lee. Time-frequency analysisof band-limited EEG with BMFLC and Kalman filter for BCI applications. Journal of NeuroEngi-neering and Rehabilitation, 10(1), 2013. ISSN 1743-0003. doi: 10.1186/1743-0003-10-109.
Woehrle, Krell, Straube, Kim, Kirchner, and Kirchner, jul 2015. Hendrik Woehrle,Mario M Krell, Sirko Straube, Su Kyoung Kim, Elsa A Kirchner, and Frank Kirchner. An Adap-tive Spatial Filter for User-Independent Single Trial Detection of Event-Related Potentials. IEEE
51
REFERENCES
transactions on bio-medical engineering, 62(7), 1696–1705, 2015. ISSN 1558-2531 (Electronic).doi: 10.1109/TBME.2015.2402252.
Wu and Ge, 2013. Y Wu and Y Ge. A novel method for motor imagery EEG adaptive classificationbased biomimetic pattern recognition. Neurocomputing, 116, 280–290, 2013. ISSN 0925-2312. doi:10.1016/j.neucom.2012.03.030.
Yoon, Roberts, Dyson, and Gan, 2009. J W Yoon, S J Roberts, M Dyson, and J Q Gan. Adap-tive classification for Brain Computer Interface systems using Sequential Monte Carlo sampling.Neural Networks, 22(9), 1286–1294, 2009. ISSN 0893-6080. doi: 10.1016/j.neunet.2009.06.005.
Yoon, Roberts, Dyson, and Gan, sep 2011. Ji Won Yoon, Stephen J Roberts, Mathew Dyson,and John Q Gan. Bayesian inference for an adaptive Ordered Probit model: an application toBrain Computer Interfacing. Neural networks : the official journal of the International NeuralNetwork Society, 24(7), 726–734, 2011. ISSN 1879-2782 (Electronic). doi: 10.1016/j.neunet.2011.03.019.
Yuxiao Yang, Shanechi, Yang, Shanechi, Yuxiao Yang, and Shanechi, 2014. Yuxiao Yang,Maryam M Shanechi, Yuxiao Yang, Maryam M Shanechi, Yuxiao Yang, and Maryam M Shanechi.An adaptive brain-machine interface algorithm for control of burst suppression in medical coma.Conference proceedings : ... Annual International Conference of the IEEE Engineering in Medicineand Biology Society. IEEE Engineering in Medicine and Biology Society. Annual Conference, 2014,1638–1641, 2014. ISSN 1557-170X. doi: 10.1109/EMBC.2014.6943919.
52