fear of crime in ndc areas: how do perceptions relate to reality?
TRANSCRIPT
New Deal for Communities
National Evaluation
Fear of Crime in NDC areas: How do perceptions relate to reality?
Christina Beatty Mike Grimsley Paul Lawless Julie Manning
Ian Wilson
Centre for Regional Economic and Social Research Sheffield Hallam University
2005 The Neighbourhood Renewal Unit in the Office of the Deputy Prime Minister is sponsoring the 2002-2005 national evaluation of New Deal for Communities. This evaluation is being undertaken by a consortium of organisations co-ordinated by the Centre for Regional Economic and Social Research at Sheffield Hallam University. The views expressed in this report do not necessarily reflect those of the Neighbourhood Renewal Unit. Those wishing to know more about the evaluation should consult the evaluation's web site http://ndcevaluation.adc.shu.ac.uk/ndcevaluation/home.asp
CONTENTS
EXECUTIVE SUMMARY .........................................................................................................i
1. INTRODUCTION..............................................................................................................1
2. FEAR AND EXPERIENCE OF CRIME AT THE NDC AREA LEVEL.....................2
2.1. Measuring crime and fear of crime.................................................................................2
2.2. Crime and fear of crime: variations across NDC areas..................................................3
2.3. Modelling crime and fear of crime across Partnerships.................................................5 2.4. Crime and fear of crime: NDCs and the national picture .............................................10
3. WHICH RESIDENTS ARE MOST LIKELY TO FEAR CRIME OR HAVE BEEN A VICTIM OF CRIME?......................................................................................................... 12
3.1. Variations across demographic groups ........................................................................12
3.2. Crime and fear of crime by gender ...............................................................................12
3.3. Crime and fear of crime by age ....................................................................................13
3.4. Crime and fear of crime by ethnicity .............................................................................13
3.5. Underlying explanatory factors: experience and fear of crime.....................................14
4. CRIME, HEALTH AND QUALITY OF LIFE ............................................................. 18
4.1. Health, quality of life and crime....................................................................................18
4.2. Modelling health and crime...........................................................................................18
5. CRIME AND THE ENVIRONMENT........................................................................... 20
5.1. Satisfaction with housing and the local area ................................................................20
5.2. Modelling community well-being and crime..................................................................20
5.3. Problems in the local area and crime...........................................................................20
5.4. Modelling problems in the local area and crime...........................................................21 5.5. Mobility and crime.........................................................................................................21
5.6. Modelling mobility and crime........................................................................................22
6. CRIME, SOCIAL CAPITAL AND COHESION......................................................... 23
6.1. Social capital and cohesion ..........................................................................................23 6.2. Modelling social capital, cohesion and crime...............................................................23
7. TRUST AND SATISFACTION WITH THE LOCAL POLICE ................................ 25
7.1. Trust and satisfaction with local police.........................................................................25
7.2. Modelling trust and satisfaction with local police across Partnerships ........................26 7.3. Trust, satisfaction and demographics...........................................................................28
7.4. Modelling crime, trust and satisfaction with local police...............................................30
7.5....... Modelling community wellbeing, area problems, trust and satisfaction with local police ...................................................................................................................................................31
7.6. Modelling social capital and dissatisfaction with local police.......................................32
8. SECONDARY AND ADMINISTRATIVE CRIME DATA......................................... 34
8.1. Police Force data ..........................................................................................................34
8.2. Relative crime rates ......................................................................................................36
8.3. Area level crime rates and other measures..................................................................40
8.4. A concluding comment..................................................................................................43
9. INDIVIDUALS AND AREAS ....................................................................................... 44
9.1. Exploratory multilevel models on fear of crime and mental health ..............................44
9.2. A concluding comment..................................................................................................47
10. CHANGE IN NDC AREAS ...................................................................................... 48
10.1. Household Survey change data 2002-2004.............................................................48
10.2. Area level change .....................................................................................................48
10.3. Changes to people in areas: Longitudinal data ........................................................50
10.4. Secondary and administrative change data 2000/1 to 2002/3.................................53 10.5. Possible 'displacement' effect...................................................................................61
10.6. A concluding comment..............................................................................................62
11. SOME POLICY IMPLICATIONS............................................................................ 64
REFERENCES ...................................................................................................................... 66
APPENDIX............................................................................................................................. 68
New Deal for Communities: The National Evaluation i Fear of Crime in NDC Areas
EXECUTIVE SUMMARY
1. Introduction
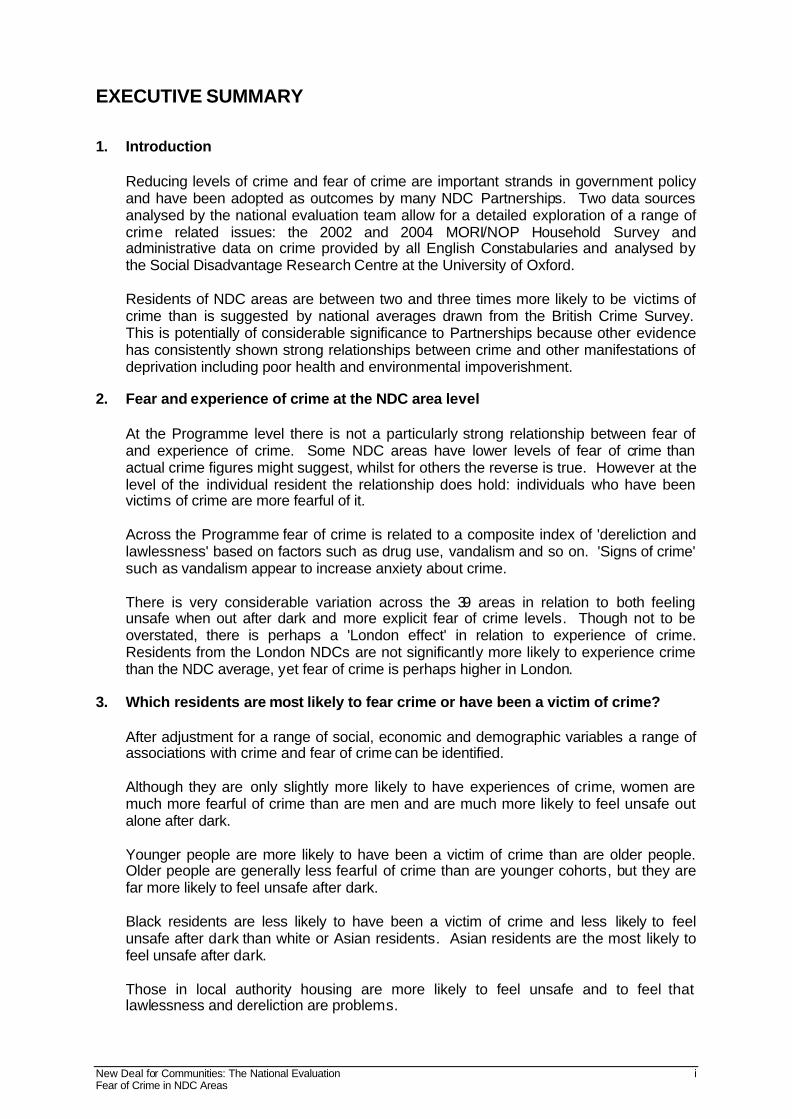
Reducing levels of crime and fear of crime are important strands in government policy and have been adopted as outcomes by many NDC Partnerships. Two data sources analysed by the national evaluation team allow for a detailed exploration of a range of crime related issues: the 2002 and 2004 MORI/NOP Household Survey and administrative data on crime provided by all English Constabularies and analysed by the Social Disadvantage Research Centre at the University of Oxford. Residents of NDC areas are between two and three times more likely to be victims of crime than is suggested by national averages drawn from the British Crime Survey. This is potentially of considerable significance to Partnerships because other evidence has consistently shown strong relationships between crime and other manifestations of deprivation including poor health and environmental impoverishment.
2. Fear and experience of crime at the NDC area level At the Programme level there is not a particularly strong relationship between fear of and experience of crime. Some NDC areas have lower levels of fear of crime than actual crime figures might suggest, whilst for others the reverse is true. However at the level of the individual resident the relationship does hold: individuals who have been victims of crime are more fearful of it. Across the Programme fear of crime is related to a composite index of 'dereliction and lawlessness' based on factors such as drug use, vandalism and so on. 'Signs of crime' such as vandalism appear to increase anxiety about crime. There is very considerable variation across the 39 areas in relation to both feeling unsafe when out after dark and more explicit fear of crime levels. Though not to be overstated, there is perhaps a 'London effect' in relation to experience of crime. Residents from the London NDCs are not significantly more likely to experience crime than the NDC average, yet fear of crime is perhaps higher in London.
3. Which residents are most likely to fear crime or have been a victim of crime? After adjustment for a range of social, economic and demographic variables a range of associations with crime and fear of crime can be identified. Although they are only slightly more likely to have experiences of crime, women are much more fearful of crime than are men and are much more likely to feel unsafe out alone after dark. Younger people are more likely to have been a victim of crime than are older people. Older people are generally less fearful of crime than are younger cohorts, but they are far more likely to feel unsafe after dark. Black residents are less likely to have been a victim of crime and less likely to feel unsafe after dark than white or Asian residents. Asian residents are the most likely to feel unsafe after dark. Those in local authority housing are more likely to feel unsafe and to feel that lawlessness and dereliction are problems.
New Deal for Communities: The National Evaluation ii Fear of Crime in NDC Areas
4. Crime, health and quality of life There is a strong positive relationship between increasing fear of crime and self-reported poor health. Those who have been a victim of crime are significantly more likely than those that have not been a victim to think their health has deteriorated in the previous year.
5. Crime and the environment Residents who score highly on a community well-being index based on attitudes to the area and the local environment are less likely to be fearful of, or to have experienced, crime. Those residents who score highly in relation to perceiving problems such as dereliction and local social problems are much more likely to be fearful, and to have been a victim, of crime. Those who want to move are much more likely to be fearful of crime, to feel unsafe after dark and to have been a victim of crime.
6. Crime, social capital and cohesion Those who express low levels of trust and who do not think their neighbours are friendly are much more likely to feel unsafe when out after dark and to have experienced crime. Interestingly those who are active in terms of voluntary involvement are actually more likely to have experienced crime, as indeed are those who know most people in the neighbourhood.
7. Trust and satisfaction with the local police Residents of NDC areas are less likely to trust their local police and to be less inclined to express satisfaction with the service than is the case nationally. Trust and satisfaction are closely positively correlated. There are marked variations at the Partnership level in relation to both trust and satisfaction. Distrust in Southampton is over one and a half times the NDC average, but it is around half the average in Hammersmith and Fulham. Of the eight NDC areas showing greatest trust in the police, five are in London. Groups which are more distrustful of the police include men, younger cohorts, and white people. These groups also tend to be dissatisfied with the police. Distrust and dissatisfaction rise markedly for those who have experienced two or more crimes and those who express high fear of crime. This also applies to those who identify serious environmental and social problems in the neighbourhood and especially those with little trust in local organisations.
8. Secondary and administrative crime data An initial comparison of recorded crime data with results from the MORI/NOP Household Survey indicates that there are some noticeable apparent inconsistencies. Burglary rates from both data sources are highly correlated. However, rates of recorded violence against the person and theft are not statistically correlated with the self-reported measures in the household survey.
New Deal for Communities: The National Evaluation iii Fear of Crime in NDC Areas
An overall recorded crime index and an index of recorded crime relative to the local authority show a significant positive relationship with worklessness. So, as rates of worklessness increases in an area so do levels of crime. The relationship is very strong between criminal damage rates and worklessness. Rates of pupils staying on in post 16 education also show a strong negative correlation with criminal damage rates.
9. Individuals and areas Multilevel modelling is employed to explore the different degree of variation between both individuals and across NDC areas. The results indicate that not only is there a significant negative relationship between mental health and fear of crime but that this relationship across NDC areas is not constant. At lower levels of fear of crime there is not much variation in mental health levels between NDC areas. However, at higher levels of fear of crime considerable variation across the NDC areas is apparent.
10. Change in NDC areas Comparisons of the 2002 and 2004 household surveys reveal a largely positive picture. Cross sectional and panel data indicate that actual crime rates, feelings of safety and attitudes towards the local police improved. , NDCs are doing at least as well, and in some cases better than are the comparator areas. Panel respondents are most likely to have benefited from Partnership supported interventions as they have remained in the area for the 2002 to 2004 period. Differences in changes between the NDC panel and the comparator panel, therefore, might be tentatively regarded as ‘the NDC effect’. Police recorded crime data revealed that a greater number of NDC areas experienced an improvement, rather than a worsening, in crime rates relative to the wards within which they are located for the categories of burglary, theft and criminal damage than saw a worsening of their ranks. There is no immediate evidence that those NDC Partnerships experiencing a relative improvement in crime rates between 2000-01 and 2002-03 caused a displacement of crime to the surround localities. Indeed, analysis of concentric buffer zones reveals that positive effects appear to be spilling over into these surrounding localities.
11. Some policy implications A number of policy implications for both NDCs and the wider neighbourhood renewal community arise from this analysis of crime data. It should be stressed that some of the policy nuances identified in this work are subtle. Partnerships facing the immediacy of delivering 10 year programmes may not always be able to respond appropriately. But at the very least they should be aware of the issues facing them. Neighbourhood renewal Partnerships need to be aware of the sheer scale of problems which they face in relation to crime and fear of crime; rates of actual crime are often double the national average. They also need to consider a range of data sources which inform them about the nature of both self-reported and recorded crime within an area. There are complex relationships between fear of and experience of crime . There is no particularly strong relationship between the two at the NDC Programme wide level, although there is at the level of the individual respondent.
New Deal for Communities: The National Evaluation iv Fear of Crime in NDC Areas
In practice fear of crime runs ahead of actual experience in some NDCs but the situation is reversed in others. Some NDC areas have lower scores on the composite indicator of fear of crime than actual levels might merit. However, given that fear of crime might have a negative impact on an individual's health or quality of life, it would not seem sensible to actively encourage residents to be more fearful of crime. Perhaps it would, however, be beneficial to promote some crime prevention schemes in these areas including improvements in household security and street lighting. These may act to reduce actual rate of burglary or muggings whilst re-enforcing a sense of personal security. At the other end of the spectrum some areas appear to have a higher fear of crime than would appear to be justified. For these areas focusing on interventions which reduce fear of crime may be most beneficial. So, increasing visibility of police or neighbourhood wardens may help people feel more secure even if it does not necessarily have a significant impact on reducing crime in the area. Adopting 'secured by design' principles in regeneration projects could contribute to a safer environment. There may be a case too for Partnerships to publicise the real, and often diminishing, level of crime in the neighbourhood. This potential imbalance between fear and experience of crime may be a particular problem facing many, though not all, London NDCs. This may well in part reflect higher density levels of those from self-reported Asian backgrounds. In general those from this sub-group, despite being subject to less crime than white people, tend to feel less safe than those from other ethnic backgrounds. There are significant relationships between fear of crime and actual experience of crime on the one hand and a range of socio-economic and demographic variables including age, gender, ethnicity, education and tenure on the other. These variations need to inform all aspects of neighbourhood level crime prevention strategies. Partnerships located in, say, inner London, with relatively higher levels of owner occupation, BME populations and young people may be facing a rather different set of issues than, say, Partnerships with largely white populations and significant public sector housing schemes on the edge of towns and cities in the north of England. Reducing crime and fear of crime will have important implications for other components of disadvantage including health and aspects of social capital. There are especially strong negative relationships between fear and experience of crime and mental health scores. And those most fearful of crime tend to be those with least trust and to be those who view the neighbourhood as unfriendly. Tackling crime through holistic longer term programmes is likely to have important implications for other components of disadvantage. Attacking low level environmental problems may help reduce fear of crime . Those who are most concerned about aspects of local dereliction, lawlessness and local social problems are those who are more likely to feel unsafe after dark, to be frightened of crime in general and to have been a victim of crime. Targeting issues such as reducing worklessness and increasing staying on rates in post compulsory education are likely to have beneficial effects on crime rates in areas. The relationship between higher levels of criminal damage in areas with low staying on rates in school and high levels of worklessness is especially strong. There are important lessons for the local police in their efforts to engage local communities. In particular, levels of trust and satisfaction are lower in Partnership areas than is the case nationally. And within this context, it is perhaps worrying that younger people tend to have less trust in the police and that as educational qualifications rise, satisfaction falls. Most disturbing of all, those who have been the victim of crime are much more likely to be distrustful of the police and to be
New Deal for Communities: The National Evaluation v Fear of Crime in NDC Areas
dissatisfied with the service they provide: such direct contact with the police is associated with much lower levels of trust and satisfaction. But perhaps the most important policy implication of all for Partnerships looking to create sustainable longer term renewal programmes is that those who fear and have direct experience of, crime are those who are most likely to want to move. Attacking crime and fear of crime may have significant longer term implications for renewal Partnerships wishing to create stable and successful communities.

New Deal for Communities: The National Evaluation 1 Fear of Crime in NDC Areas
1. INTRODUCTION
The reduction of crime and fear of crime is an important strand in current government policy. Recent initiatives include targeting street crime, anti social behaviour, drug related crime and youth crime (NRU 2003, pp146-148). The focus on reducing crime is mirrored by the NDC Programme in that it forms one of the five key outcome areas. The NDC Programme aims to reduce the gaps between some of the poorest neighbourhoods and the rest of the country. The gap between NDC areas as a whole and the national average in relation to crime is considerable. Data from the MORI/NOP Household Survey indicates that NDC residents are more likely to have been a victim of crime in the past year than is suggested by the British Crime Survey (BCS) for the nation as a whole (NRU 2003, p148). Fear of crime is also more prevalent amongst NDC residents than BCS statistics would indicate. The fact that fear of crime has a negative effect on the quality of life has been documented elsewhere (Acheson 1998, Home Office 1989, Mirrlees-Black and Allen 1998, Tennyson-Mason 2002). Likewise, being a victim of crime also appears to impact on the health and wellbeing of individuals (Wilkinson et al 1998). Hence, by tackling crime related issues the NDC Programme can help induce a positive 'cross-cutting impact on residents' lives. All 39 NDCs therefore propose initiatives to reduce crime and or fear of crime in their delivery plans. Identifying exactly who will benefit most within NDC areas from crime reduction measures is not clear cut, as neither incidence nor fear of crime is uniform across the population. Acheson (1998) has highlighted that 'there appears to be good evidence that crime and fear of crime is felt disproportionately by disadvantaged groups'. Different types of people are more likely to directly experience, or to be afraid of, different types of crime. For example, both age and sex are related to fear and experience of crime (Mirrlees-Black and Allen 1998, Chivite-Matthews and Maggs 2002). This paper therefore aims to explore a number of issues related to crime and fear of crime amongst NDC residents. In particular which groups of NDC residents are most likely to fear crime or have been a victim of crime? To what extent is fear of crime related to experience of crime in NDC areas? How does fear and experience of crime interact with the health and quality of life of residents? How perceptions of the area and whether people want to leave the area, are related to fear and experience of crime? Does satisfaction with the local police have a bearing on levels of fear of crime in NDC areas? Can any Partnership level effects over and above individual level effects be discerned from the data? In the main, analysis is based on the 2004 MORI/NOP Household Survey to explore these issues. This sample contains the responses of approximately 500 residents in each of the 39 NDC areas, a total of 19,633 residents in all. Where possible, comparisons are made with findings from a 'deprived but non NDC' comparator survey, carried out by MORI / NOP at the same time as the main survey, and national data from the British Crime Survey. The comparator sample consisted of just over 4,000 residents drawn from 39 deprived neighbourhoods which were socio-economically consistent with the 39 NDC areas but were not part of, or contiguous with, these NDC localities. Use is also made of administrative data available from police forces on actual levels of recorded crime which has been collated and analysed by the Social Disadvantage Research Centre at the University of Oxford. A number of analytical techniques are employed to shed light on the relationships emerging from the data including logistic regression modelling and multilevel modelling.

New Deal for Communities: The National Evaluation 2 Fear of Crime in NDC Areas
2. FEAR AND EXPERIENCE OF CRIME AT THE NDC AREA LEVEL
2.1. Measuring crime and fear of crime
The relationship between crime and fear of crime is complicated. Fear of crime is not always proportionate to actual risks of being a victim. For example though older people are less likely to be victims of crime they have similar levels of worry as other age groups (Chivite-Matthews and Maggs, 2002). However, evidence elsewhere suggests that those who have been victims of crime or who live in higher risk areas tend to express most concern (Mirrlees-Black and Allen 1998). How does the relationship between fear and experience of crime play out in NDC areas? The first stage of the analysis is to decide how to measure fear and experience of crime amongst NDC residents. Four main indicators were derived using 2004 MORI/NOP Household Survey. These are described below and used throughout the analysis in the rest of the paper. First, the MORI/NOP Household Survey asks residents about how safe they feel walking alone in and around the area after dark. This is used as an indicator of implicit fear of crime or ontological security (Hiscock et al, 2001). Second, respondents are asked a number of questions about the extent to which they worry about a range of crimes. A factor analysis of these variables indicated a single underlying fear of crime or 'worry about crime' dimension. A composite score for explicit fear of crime has been calculated using a subset of nine of the original eleven questions asked. The two questions excluded from the analysis are related solely to car crime. These questions are omitted from the composite score as they are relevant to less than half of all respondents. Around 52 per cent of sampled individuals neither own nor have access to a car. A full list of the questions included within the composite score is given in the Appendix Table A1. Third, residents are asked about whether they have been a victim of a number of specified crimes in the previous year. A full list of these is provided in Appendix Table A2. These questions are amalgamated to provide an indicator of whether the respondent has been a victim of any crime in the previous year. And finally, a factor analysis was carried out on a series of questions relating to quality of life and problems in the area. This identifies three main components: lawlessness and dereliction, environment problems and social relations problems. For the purposes of this analysis a composite score has been created using the ten questions within the lawlessness and dereliction dimension. A full list of these is provided in Appendix Table A3. An initial examination of the variables related to experience of and fear of crime is given in Table 2.1. Data for NDC areas are given alongside those for the comparator survey and national figures where available. Full details of the average fear of crime score, lawlessness and dereliction score and percentages of residents who have experienced crime by NDC Partnership are given in Appendix Table A4.
New Deal for Communities: The National Evaluation 3 Fear of Crime in NDC Areas
Table 2.1: Experience and fear of crime amongst NDC residents
% of respondents NDC
Areas Comparator
Areas National
Feel unsafe walking alone in area after dark 49 46 33* High fear of crime score 24 21 - High lawless and dereliction score 23 17 - Victim of any crime in the past year 28 25 - Victim of theft from outside the home 10 8 4 Victim of burglary 5 4 3 Victim of theft from the person 3 3 1 Victim of assault 4 3 3
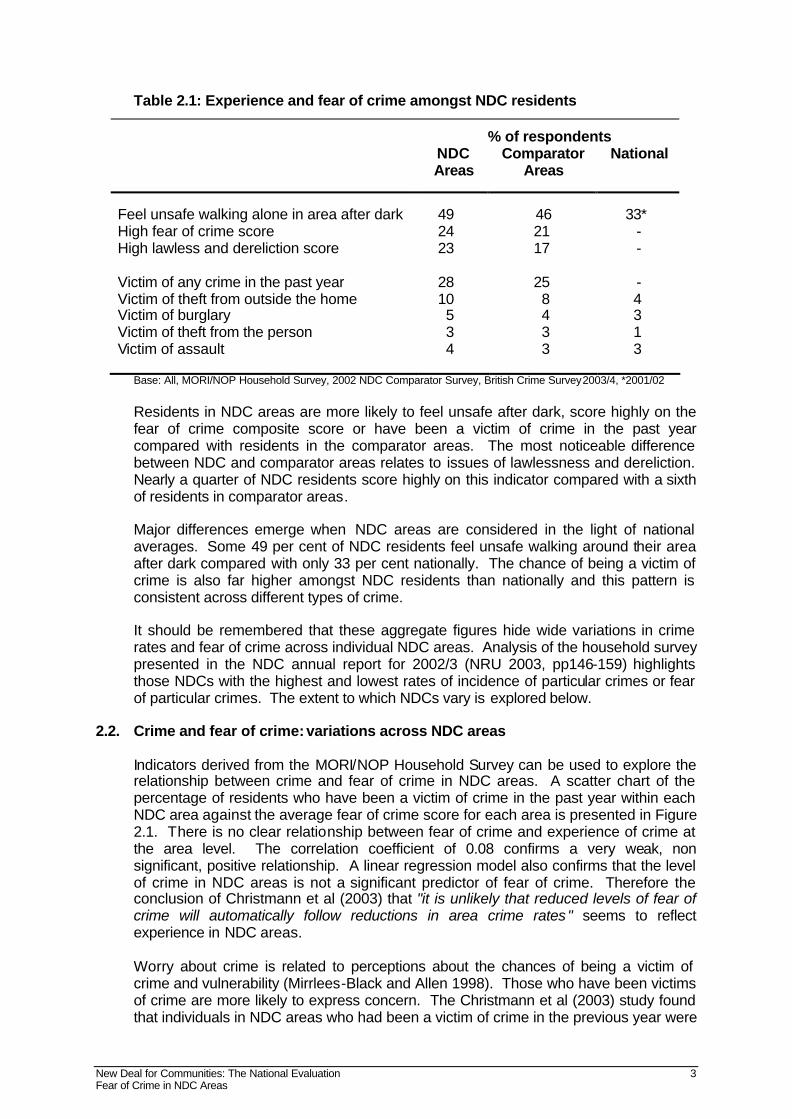
Base: All, MORI/NOP Household Survey, 2002 NDC Comparator Survey, British Crime Survey 2003/4, *2001/02 Residents in NDC areas are more likely to feel unsafe after dark, score highly on the fear of crime composite score or have been a victim of crime in the past year compared with residents in the comparator areas. The most noticeable difference between NDC and comparator areas relates to issues of lawlessness and dereliction. Nearly a quarter of NDC residents score highly on this indicator compared with a sixth of residents in comparator areas. Major differences emerge when NDC areas are considered in the light of national averages. Some 49 per cent of NDC residents feel unsafe walking around their area after dark compared with only 33 per cent nationally. The chance of being a victim of crime is also far higher amongst NDC residents than nationally and this pattern is consistent across different types of crime. It should be remembered that these aggregate figures hide wide variations in crime rates and fear of crime across individual NDC areas. Analysis of the household survey presented in the NDC annual report for 2002/3 (NRU 2003, pp146-159) highlights those NDCs with the highest and lowest rates of incidence of particular crimes or fear of particular crimes. The extent to which NDCs vary is explored below.
2.2. Crime and fear of crime: variations across NDC areas
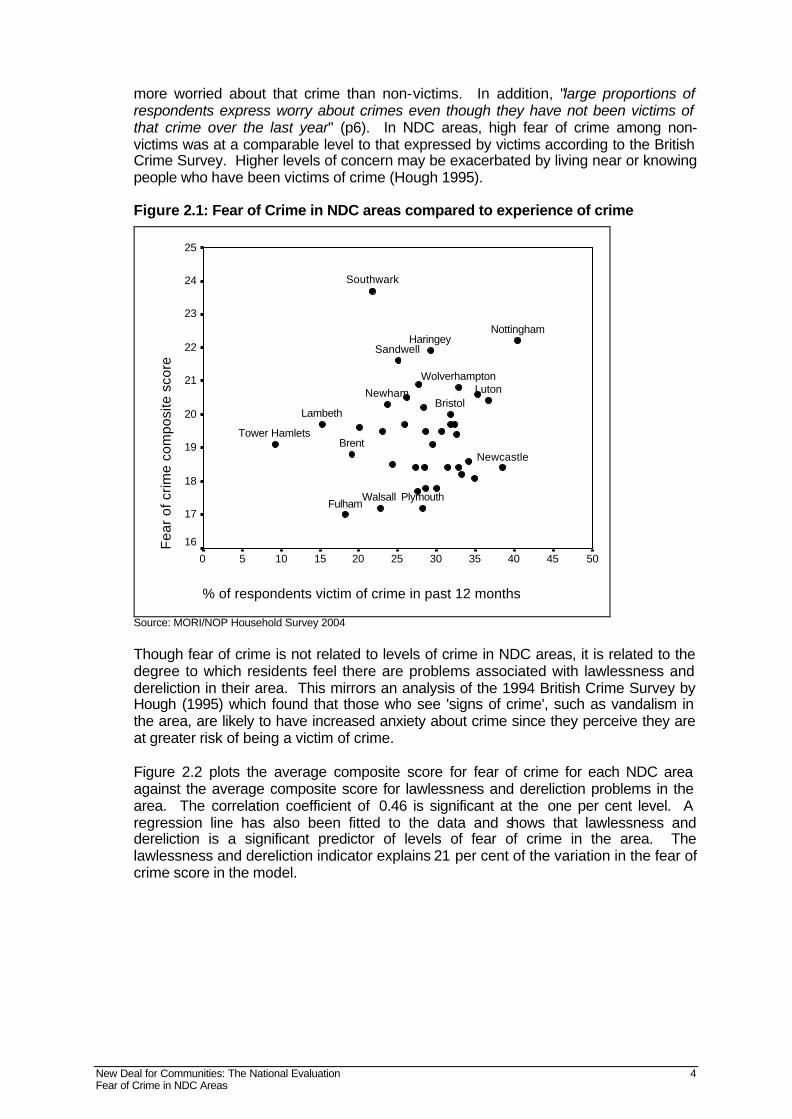
Indicators derived from the MORI/NOP Household Survey can be used to explore the relationship between crime and fear of crime in NDC areas. A scatter chart of the percentage of residents who have been a victim of crime in the past year within each NDC area against the average fear of crime score for each area is presented in Figure 2.1. There is no clear relationship between fear of crime and experience of crime at the area level. The correlation coefficient of 0.08 confirms a very weak, non significant, positive relationship. A linear regression model also confirms that the level of crime in NDC areas is not a significant predictor of fear of crime. Therefore the conclusion of Christmann et al (2003) that "it is unlikely that reduced levels of fear of crime will automatically follow reductions in area crime rates" seems to reflect experience in NDC areas. Worry about crime is related to perceptions about the chances of being a victim of crime and vulnerability (Mirrlees-Black and Allen 1998). Those who have been victims of crime are more likely to express concern. The Christmann et al (2003) study found that individuals in NDC areas who had been a victim of crime in the previous year were
New Deal for Communities: The National Evaluation 4 Fear of Crime in NDC Areas
more worried about that crime than non-victims. In addition, "large proportions of respondents express worry about crimes even though they have not been victims of that crime over the last year" (p6). In NDC areas, high fear of crime among non-victims was at a comparable level to that expressed by victims according to the British Crime Survey. Higher levels of concern may be exacerbated by living near or knowing people who have been victims of crime (Hough 1995). Figure 2.1: Fear of Crime in NDC areas compared to experience of crime
% of respondents victim of crime in past 12 months
50454035302520151050
Fea
r of
crim
e co
mpo
site
sco
re
25
24
23
22
21
20
19
18
17
16
Tower Hamlets
Southwark
Newham
Lambeth
Haringey
Fulham
BrentNewcastle
Nottingham
Wolverhampton
Walsall
Sandwell
Plymouth
BristolLuton
Source: MORI/NOP Household Survey 2004 Though fear of crime is not related to levels of crime in NDC areas, it is related to the degree to which residents feel there are problems associated with lawlessness and dereliction in their area. This mirrors an analysis of the 1994 British Crime Survey by Hough (1995) which found that those who see 'signs of crime', such as vandalism in the area, are likely to have increased anxiety about crime since they perceive they are at greater risk of being a victim of crime. Figure 2.2 plots the average composite score for fear of crime for each NDC area against the average composite score for lawlessness and dereliction problems in the area. The correlation coefficient of 0.46 is significant at the one per cent level. A regression line has also been fitted to the data and shows that lawlessness and dereliction is a significant predictor of levels of fear of crime in the area. The lawlessness and dereliction indicator explains 21 per cent of the variation in the fear of crime score in the model.

New Deal for Communities: The National Evaluation 5 Fear of Crime in NDC Areas
Figure 2.2: Fear of crime in NDC areas compared to the level of lawlessness and dereliction
Lawlessness and dereliction composite score
20191817161514
Fea
r of
crim
e co
mpo
site
sco
re25
24
23
22
21
20
19
18
17
16
Southwark
Newham
Lambeth
Haringey
Sunderland
Hartlepool
Liverpool
Sheffield
Bradford
Nottingham
Wolverhampton
Walsall
Sandwell
Coventry
Plymouth
Bristol
Fulham
Source: 2004 MORI/NOP Household Survey
2.3. Modelling crime and fear of crime across Partnerships
The scatter charts and data in Table A4 illustrate wide variations in crime rates and fear of crime levels across the 39 NDC areas. It is important to understand the extent to which the underlying characteristics of the population may influence, or be associated with, factors such as fear of crime. For example, women fear more about all types of crime than men with the exception of car related crime (Mirrlees-Black and Allen 1998). Therefore, in an area with substantially more women than men this might lead to a higher composite fear of crime score, as women will contribute more towards an overall area average. Other underlying compositional factors of the population such as age, ethnicity and education levels may also relate to fear of and incidence of crime in the area. The distribution of different groups is uneven across NDCs and so the relative influence they may exert on crime measures will also vary by locality. Further analysis of findings which goes beyond bivariate or two-way exploration of the data is needed. Logistic regression can be used to unpick the extent to which different factors which may help to explain why one group of residents is more likely to fear or experience crime than another. This technique is useful as it allows a number of underlying explanatory variables - such as age, ethnicity and tenure - to be taken into account when calculating the extent to which other factors, for example worklessness, may be associated with crime. Results can be presented as a series of odds ratios. Odds ratios reflect the probability of a person being in one group rather than another after all other factors in the model have been taken into account. For example, an odds ratio of two means that a person with a known attribute - say they are in poor health - is, on average, twice as likely to fear crime as a person who has good health, after all other factors (such as age and ethnicity) have been taken into account. Hence odds ratios can be adjusted for other factors.
Nottingha
New Deal for Communities: The National Evaluation 6 Fear of Crime in NDC Areas
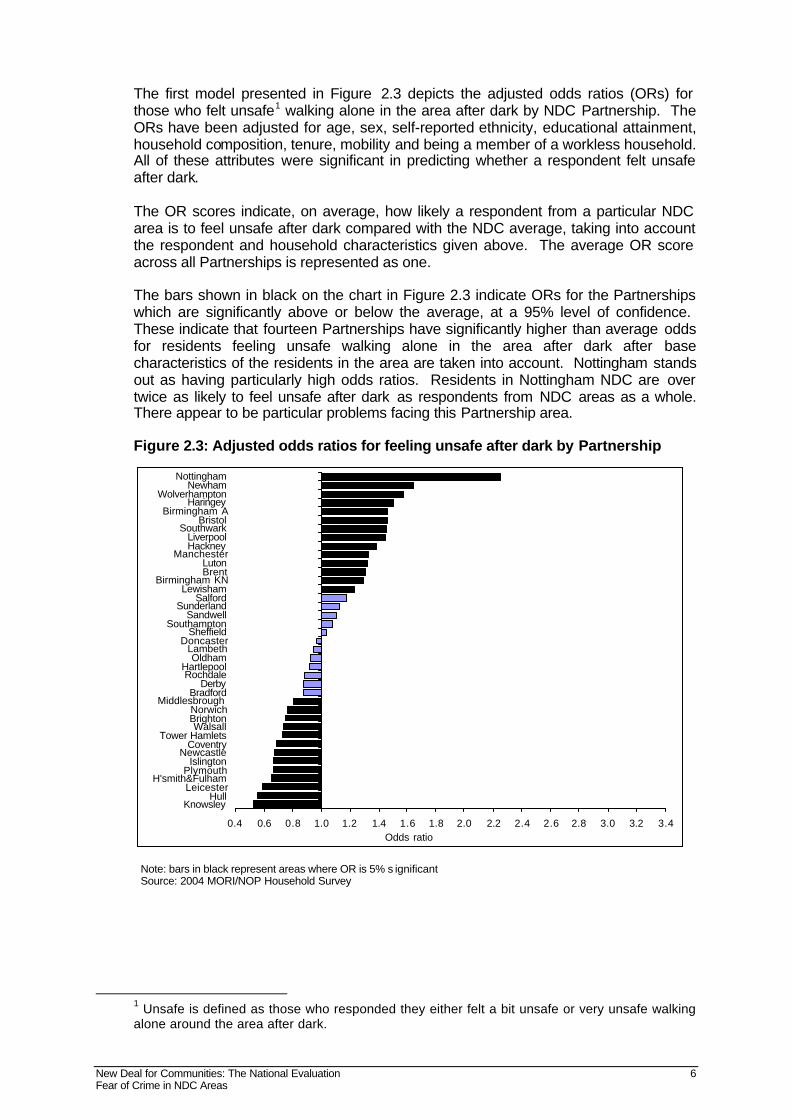
The first model presented in Figure 2.3 depicts the adjusted odds ratios (ORs) for those who felt unsafe1 walking alone in the area after dark by NDC Partnership. The ORs have been adjusted for age, sex, self-reported ethnicity, educational attainment, household composition, tenure, mobility and being a member of a workless household. All of these attributes were significant in predicting whether a respondent felt unsafe after dark. The OR scores indicate, on average, how likely a respondent from a particular NDC area is to feel unsafe after dark compared with the NDC average, taking into account the respondent and household characteristics given above. The average OR score across all Partnerships is represented as one. The bars shown in black on the chart in Figure 2.3 indicate ORs for the Partnerships which are significantly above or below the average, at a 95% level of confidence. These indicate that fourteen Partnerships have significantly higher than average odds for residents feeling unsafe walking alone in the area after dark after base characteristics of the residents in the area are taken into account. Nottingham stands out as having particularly high odds ratios. Residents in Nottingham NDC are over twice as likely to feel unsafe after dark as respondents from NDC areas as a whole. There appear to be particular problems facing this Partnership area. Figure 2.3: Adjusted odds ratios for feeling unsafe after dark by Partnership
0.4 0.6 0.8 1.0 1.2 1.4 1.6 1.8 2.0 2.2 2.4 2.6 2.8 3.0 3.2 3.4
KnowsleyHull
LeicesterH'smith&Fulham
PlymouthIslington
NewcastleCoventry
Tower HamletsWalsall
BrightonNorwich
Middlesbrough Bradford
DerbyRochdale
HartlepoolOldham
LambethDoncaster
SheffieldSouthampton
SandwellSunderland
SalfordLewisham
Birmingham KNBrentLuton
ManchesterHackneyLiverpool
SouthwarkBristol
Birmingham AHaringey
WolverhamptonNewham
Nottingham
Odds ratio
Note: bars in black represent areas where OR is 5% s ignificant Source: 2004 MORI/NOP Household Survey
1 Unsafe is defined as those who responded they either felt a bit unsafe or very unsafe walking alone around the area after dark.
New Deal for Communities: The National Evaluation 7 Fear of Crime in NDC Areas
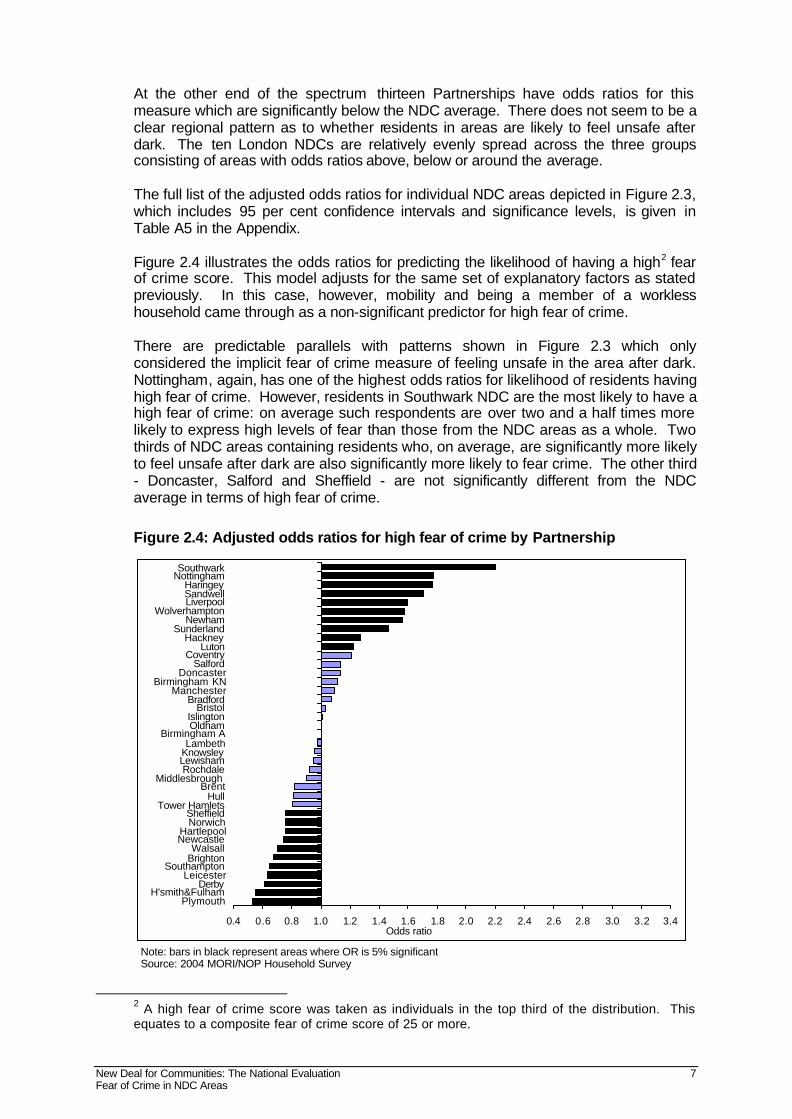
At the other end of the spectrum thirteen Partnerships have odds ratios for this measure which are significantly below the NDC average. There does not seem to be a clear regional pattern as to whether residents in areas are likely to feel unsafe after dark. The ten London NDCs are relatively evenly spread across the three groups consisting of areas with odds ratios above, below or around the average. The full list of the adjusted odds ratios for individual NDC areas depicted in Figure 2.3, which includes 95 per cent confidence intervals and significance levels, is given in Table A5 in the Appendix. Figure 2.4 illustrates the odds ratios for predicting the likelihood of having a high2 fear of crime score. This model adjusts for the same set of explanatory factors as stated previously. In this case, however, mobility and being a member of a workless household came through as a non-significant predictor for high fear of crime. There are predictable parallels with patterns shown in Figure 2.3 which only considered the implicit fear of crime measure of feeling unsafe in the area after dark. Nottingham, again, has one of the highest odds ratios for likelihood of residents having high fear of crime. However, residents in Southwark NDC are the most likely to have a high fear of crime: on average such respondents are over two and a half times more likely to express high levels of fear than those from the NDC areas as a whole. Two thirds of NDC areas containing residents who, on average, are significantly more likely to feel unsafe after dark are also significantly more likely to fear crime. The other third - Doncaster, Salford and Sheffield - are not significantly different from the NDC average in terms of high fear of crime.
Figure 2.4: Adjusted odds ratios for high fear of crime by Partnership
0.4 0.6 0.8 1.0 1.2 1.4 1.6 1.8 2.0 2.2 2.4 2.6 2.8 3.0 3.2 3.4
PlymouthH'smith&Fulham
DerbyLeicester
SouthamptonBrightonWalsall
NewcastleHartlepool
NorwichSheffield
Tower HamletsHull
Brent Middlesbrough
RochdaleLewishamKnowsleyLambeth
Birmingham AOldhamIslington
BristolBradford
ManchesterBirmingham KN
DoncasterSalford
CoventryLuton
HackneySunderland
NewhamWolverhampton
LiverpoolSandwellHaringey
NottinghamSouthwark
Odds ratio
Note: bars in black represent areas where OR is 5% significant Source: 2004 MORI/NOP Household Survey
2 A high fear of crime score was taken as individuals in the top third of the distribution. This equates to a composite fear of crime score of 25 or more.
New Deal for Communities: The National Evaluation 8 Fear of Crime in NDC Areas
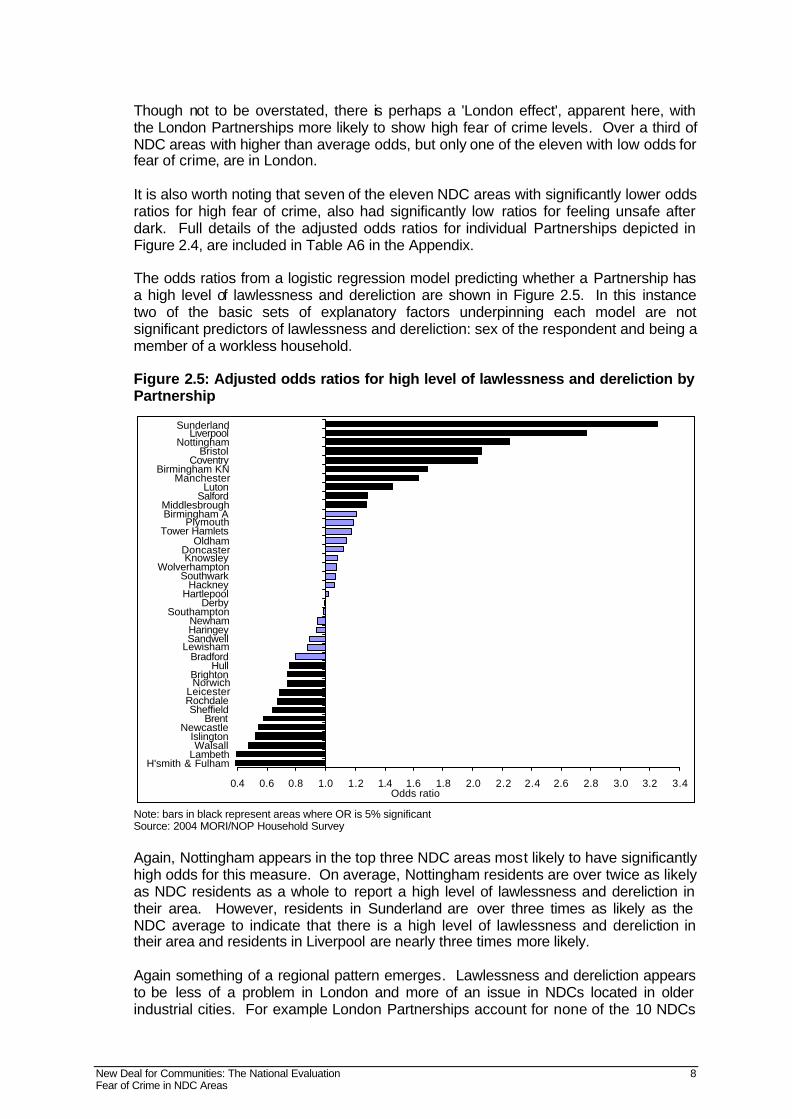
Though not to be overstated, there is perhaps a 'London effect', apparent here, with the London Partnerships more likely to show high fear of crime levels. Over a third of NDC areas with higher than average odds, but only one of the eleven with low odds for fear of crime, are in London. It is also worth noting that seven of the eleven NDC areas with significantly lower odds ratios for high fear of crime, also had significantly low ratios for feeling unsafe after dark. Full details of the adjusted odds ratios for individual Partnerships depicted in Figure 2.4, are included in Table A6 in the Appendix. The odds ratios from a logistic regression model predicting whether a Partnership has a high level of lawlessness and dereliction are shown in Figure 2.5. In this instance two of the basic sets of explanatory factors underpinning each model are not significant predictors of lawlessness and dereliction: sex of the respondent and being a member of a workless household. Figure 2.5: Adjusted odds ratios for high level of lawlessness and dereliction by Partnership
0.4 0.6 0.8 1.0 1.2 1.4 1.6 1.8 2.0 2.2 2.4 2.6 2.8 3.0 3.2 3.4
H'smith & FulhamLambethWalsall
IslingtonNewcastle
BrentSheffield
RochdaleLeicester
NorwichBrighton
HullBradford
LewishamSandwellHaringeyNewham
SouthamptonDerby
HartlepoolHackney
SouthwarkWolverhampton
KnowsleyDoncaster
OldhamTower Hamlets
PlymouthBirmingham AMiddlesbrough
SalfordLuton
ManchesterBirmingham KN
CoventryBristol
NottinghamLiverpool
Sunderland
Odds ratio
Note: bars in black represent areas where OR is 5% significant Source: 2004 MORI/NOP Household Survey Again, Nottingham appears in the top three NDC areas most likely to have significantly high odds for this measure. On average, Nottingham residents are over twice as likely as NDC residents as a whole to report a high level of lawlessness and dereliction in their area. However, residents in Sunderland are over three times as likely as the NDC average to indicate that there is a high level of lawlessness and dereliction in their area and residents in Liverpool are nearly three times more likely. Again something of a regional pattern emerges. Lawlessness and dereliction appears to be less of a problem in London and more of an issue in NDCs located in older industrial cities. For example London Partnerships account for none of the 10 NDCs

New Deal for Communities: The National Evaluation 9 Fear of Crime in NDC Areas
with significantly high odds ratios for lawlessness and dereliction, but one in three of those with significantly low odds. The final model in this series provides odds ratios for being a victim of crime in the past year by NDC area (Figure 2.6). This has again been adjusted for the same underlying explanatory factors as the other models including age, sex and ethnicity of residents. For this model tenure and living in a workless household are not significant predictors of experience of crime. The different ordering of Partnerships in Figure 2.6 compared with earlier charts (Figure 2.3 on feeling unsafe after dark and Figure 2.4 on high fear of crime) highlights the weak relationship between experience of crime and fear of crime. Only 29 per cent of the NDC areas with significantly high odds ratios for residents being a victim of crime also have significantly high odds for high fear of crime. In addition, less than a third of these areas have high odds for feeling unsafe after dark. For example, Southwark, which has high odds ratios for two of the three previous measures explored, actually has an odd ratio for being a victim of crime which is significantly less than the NDC average. Figure 2.6: Adjusted odds ratios for residents being a victim of crime in last 12 months by Partnership
0.4 0.6 0.8 1.0 1.2 1.4 1.6 1.8 2.0 2.2 2.4 2.6 2.8 3.0 3.2 3.4
Tower HamletsLambeth
H'smith & FulhamBrent
SouthwarkBirmingham A
IslingtonNewham
WalsallSouthampton
Birmingham KNSandwell
PlymouthHackneyBradford
KnowsleyLiverpool
LewishamNorwich
HaringeyCoventry
HartlepoolSheffieldOldham
HullBristol
MiddlesbroughSalford
ManchesterWolverhampton
BrightonDoncasterLeicester
DerbyRochdale
LutonSunderlandNottinghamNewcastle
Odds ratio
Note: bars in black represent areas where OR is 5% significant Source: 2004 MORI/NOP Household Survey
A more consistent pattern emerges, however, when comparing ratios for 'victimhood' and perceived high levels of lawlessness and dereliction in an area. Seven out of fourteen Partnerships with significantly high odds ratios for being a victim of crime also have significantly high odds for residents reporting a high degree of lawlessness and dereliction in the area. There also appears to be a very clear 'London effect' in the likelihood of being a victim of crime after taking into consideration the basic characteristics of the residents in these areas. Not one of the fourteen NDCs with significantly high odds ratios for being
New Deal for Communities: The National Evaluation 10 Fear of Crime in NDC Areas
a victim of crime is located in London. In addition, only about a sixth of those with around the average odds ratios are London NDCs. However, seven out of eight NDCs with significantly low ratios for being a victim of crime are London Partnerships. A full set of the odds ratios associated with Figure 2.6 is provided in Appendix Table A8. Two NDC Partnerships Nottingham and Luton have significantly high odds ratios on all four models considered above. Residents in these areas are more likely to have been a victim of crime, have high fear crime, feel unsafe walking alone in the area after dark and think the area has a high level of lawlessness and dereliction. Perhaps for these Partnerships crime should form a particularly strong strand of their planned interventions under the NDC Programme. On the other hand, Hammersmith and Fulham is the only Partnership which has significantly low odds for all four crime measures. It is important to note that even where Partnerships have significantly low odds ratios for crime indicators, this is based on their position relative to other Partnerships and the NDC average. These NDCs are still likely to have crime levels or fear of crime levels which are higher than national figures might suggest. For example, 39 per cent of residents in Fulham NDC feel unsafe walking alone in the area after dark which is far lower than the NDC average of 49 per cent. However, this is still six percentage points higher than the national figure of 33 per cent.
2.4. Crime and fear of crime: NDCs and the national picture
The analyses above have focused on the relationship of crime and fear of crime at an area level. This has highlighted the wide variation in both outcomes at Partnership level. It has demonstrated that, for NDC areas, fear of crime is not directly related to actual levels of crime. This finding to some extent contradicts work by Mirrlees-Black and Allen (1998) which suggested that there is strong evidence from the British Crime Survey of fear of crime being related to actual levels of crime. There are a number of possible explanations for differences in findings. First, although at an area level the relationship does not hold true, at an individual level in NDC areas the relationship does reflect the Mirrlees-Black and Allen findings. Those who have been victims of crime are more likely to record high fear of crime than are those who have not been a victim in the past year (Table 2.2). Second, perhaps the fact that fear of crime does not increase in line with the risk of crime in NDC areas may be due to such areas being at the extreme end of the spectrum. So in some areas with very high levels of crime, the general climate of fear of crime may be out of proportion to actual risk. This may in part be due to past experiences of crime not covered by the survey period. As NDC areas have relatively high crime rates, the likelihood of being a victim of crime is higher over time. Some NDC residents may not have been a victim of crime in the 'last twelve months', but have experienced crime prior to this period. This in turn is likely to have the effect of increasing an individual’s fear of crime which may perhaps be out of line with the actual risk of crime in the area at any one point of time.

New Deal for Communities: The National Evaluation 11 Fear of Crime in NDC Areas
Table 2.2: Fear of crime amongst victims of crime in NDC areas
Fear of crime score
% of those who have not been a victim on crime in past year
% of those who have been a victim on
crime in past year Low (9-17) 48 27 Moderate (18-24) 32 38 High (25-36) 20 35 Total 100 100
Base: All, 2004 MORI/NOP Household Survey Alternatively, in some NDC areas, the types of crime which occur may be less visible than in other areas or may be concentrated within particular sections of the community. This may lead to a false sense of security and fear of crime that is disproportionately low compared to actual risk. Finally, there are interesting patterns amongst London NDCs which are worthy of note. These tend to show high odds ratios for fear of crime, yet they dominate the list of Partnerships which have the lowest odds of all NDCs for being a victim of any crime. In addition, they are less likely to have a serious problem with lawlessness and dereliction than the NDC average. The London NDCs do however have high rates of theft from the person with eight of the ten highest rates being in London Partnerships. This type of crime, which is often accompanied by the threat of violence, is likely to fuel fear of crime. Perhaps fear of crime in London is also magnified by living in such a large city. On a daily basis residents will be exposed to reports of crime in London as a whole on the local news or in newspapers. These crimes will not necessarily be in, or even close to, but the fact they are in London increases perceptions of risk. Partnerships need to be aware of the particular circumstances in their area in relation to crime as there is a wide variation in levels of fear of crime, experience of crime and the visible signs of crime across NDC areas. In some areas the focus should be on enhancing a feeling of security amongst residents through measures such as increased visibility of police or neighbourhood wardens, promotion of crime prevention schemes or better street lighting all of which may reduce fear of crime as well as have an effect on reducing crime levels. There is some evidence that housing regeneration programmes incorporating principles of the 'Secured by Design' agenda, promoted by the Associated of Chief of Police Officers, can help create a safer environment (Critchley et al, 2004). For other NDCs, perhaps the focus should lie in initiatives aimed at reducing particular types of crime such as mugging or burglary is where the focus should lie. Partnerships concentrating on interventions which may reduce specific problems in the area such as abandoned cars, car crime, drug dealing and teenagers hanging around the streets are likely to have a beneficial effect on both reducing levels of crime and fear of crime in such neighbourhoods.
New Deal for Communities: The National Evaluation 12 Fear of Crime in NDC Areas
3. WHICH RESIDENTS ARE MOST LIKELY TO FEAR CRIME OR HAVE BEEN A VICTIM OF CRIME?
3.1. Variations across demographic groups
The previous section explored variations across NDC areas in relation to fear and experience of crime. This section examines relationships between crime and various demographic characteristics. As is mentioned above there are relationships between fear of crime and both age and sex (Mirrlees-Black and Allen 1998). Women generally worry more about most types of crime and are more fearful of going out alone after dark than are men. In addition, older people are less likely to be a victim of crime, although they have similar levels of worry as other age groups (Chivite-Matthews and Maggs, 2002). In addition women and older people, in areas of high deprivation, are likely to feel insecure, particularly when out after dark (Green et al, 2000 and 20020. Analysis of data from the 2001/02 and 2002/03 British Crime Survey also indicates that black and minority ethnic (BME) groups are also at greater risk of crime than are white people (Salisbury and Upson 2004). This work also found that though the risk of crime is higher amongst the BME population, these differences disappear if the younger age profile of this group is taken into account. The relative risk for different ethnic groups also varies across particular types of crime. Hence, BME groups are more likely to experience crime against the person than white groups, but there is no difference in risk for household crime. This study also found that BME groups are also more likely to worry about crime than the white population. To what extent are these national patterns reflected in evidence on NDC areas?
3.2. Crime and fear of crime by gender
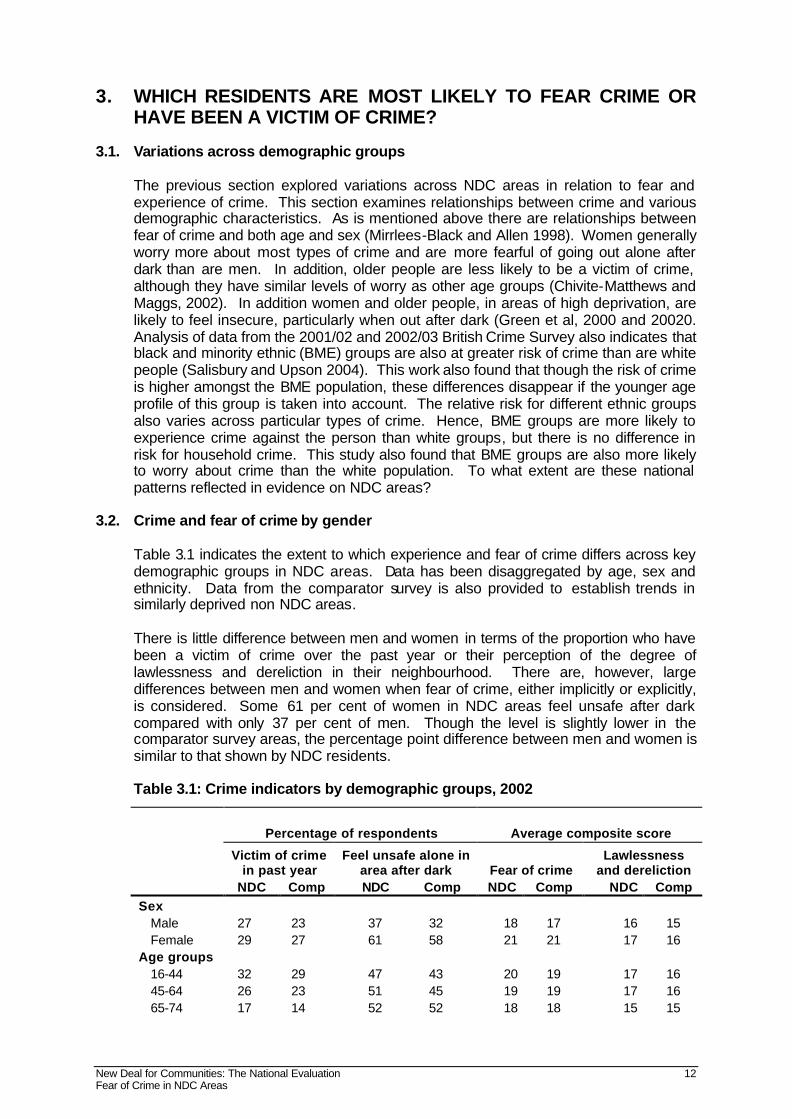
Table 3.1 indicates the extent to which experience and fear of crime differs across key demographic groups in NDC areas. Data has been disaggregated by age, sex and ethnicity. Data from the comparator survey is also provided to establish trends in similarly deprived non NDC areas. There is little difference between men and women in terms of the proportion who have been a victim of crime over the past year or their perception of the degree of lawlessness and dereliction in their neighbourhood. There are, however, large differences between men and women when fear of crime, either implicitly or explicitly, is considered. Some 61 per cent of women in NDC areas feel unsafe after dark compared with only 37 per cent of men. Though the level is slightly lower in the comparator survey areas, the percentage point difference between men and women is similar to that shown by NDC residents. Table 3.1: Crime indicators by demographic groups, 2002
Percentage of respondents Average composite score
Victim of crime
in past year Feel unsafe alone in
area after dark Fear of crime Lawlessness
and dereliction NDC Comp NDC Comp NDC Comp NDC Comp
Sex Male 27 23 37 32 18 17 16 15 Female 29 27 61 58 21 21 17 16 Age groups 16-44 32 29 47 43 20 19 17 16 45-64 26 23 51 45 19 19 17 16 65-74 17 14 52 52 18 18 15 15

New Deal for Communities: The National Evaluation 13 Fear of Crime in NDC Areas
75+ 16 14 62 62 17 17 14 13 Ethnicity White 29 25 51 47 19 19 17 16 Black 25 24 40 37 20 19 16 15 Asian 27 25 50 45 20 20 17 16 Total 28 25 49 46 19 19 17 16
Base: All, 2004 MORI/NOP Household Survey, 2004 NDC Comparator Survey Note: Columns headed Comp are the results for the Comparator Survey The effect of living in a deprived area is reflected in the far higher levels of feeling unsafe for both men and women in NDC areas compared with nationally. This is very apparent in relation to those feeling 'very unsafe'. This represents three per cent of men and 18 per cent of women in the 1998 British Crime Survey but 16 per cent of men and 38 per cent of women in NDC areas. Explicit fear of crime, as measured in the average composite score, is also higher amongst women than for men in NDC areas. Again, the figures are slightly lower for the comparator survey, but the relationship between men and women in the two areas is similar. There is an approximately three point difference between the average fear of crime score for men and women in both NDC and comparator areas.
3.3. Crime and fear of crime by age
Table 3.1 also presents crime indicators by age. There are similar patterns amongst residents in the comparator survey compared with those in NDC areas, although figures for each age group within the comparator survey are slightly lower than for comparable respondents in the MORI/NOP Household Survey. The national trends with regard to differences by age also hold true for NDC areas. Younger residents are more likely than older residents to have been a victim of crime in the past year. For those aged 16-44 the risk is almost double that of the over 75s. There is less variation in the fear of crime score by age than by sex. However, it does decrease slightly with age. Older people in NDC areas are also far more likely to feel unsafe after dark in the area compared to younger people. The differences are quite substantial with almost a 15 percentage point difference between those age over 75 compared to those aged 16-44. This finding is interesting when considered in the context of only slightly declining fear of crime by age. This is perhaps an indication that older people feel especially vulnerable after dark or perhaps that feeling unsafe alone in an area after dark is a proxy for a wider range of worries than just being a victim of crime. Perceptions of levels of lawlessness and dereliction in NDCs also decrease with age. This pattern is similar in the comparator areas. Perhaps this is influenced by different behavioural patterns between older and younger residents. Older people are less likely to go out after dark and therefore may not see evidence of some of the problems covered by this measure which may be more prevalent at night. Examples might be teenagers hanging around on the streets or drug dealing and use. Older people are also less worried about car crime, perhaps because fewer of them own a car.
3.4. Crime and fear of crime by ethnicity
The final section of Table 3.1 highlights how the basket of crime indicators varies by ethnic group. White residents are more likely to say they have been a victim of crime in the past year than either Asian or Black residents. This is, however, a different

New Deal for Communities: The National Evaluation 14 Fear of Crime in NDC Areas
relationship than that which emerges from the 2002/03 British Crime Survey in that nationally people from BME groups are more likely than whites to have been a victim of crime in the previous year. Approximately half of Asian or white residents feel unsafe after dark when walking alone. Just two fifths of the black NDC respondents fall into this category. The degree to which residents feel lawlessness and dereliction is a problem in the area is also slightly lower amongst black residents than either white or Asian residents. White residents are therefore more likely to have been a victim of crime over the past year and a higher proportion of white people also feel unsafe after dark. However, they also have the lowest average fear of crime score for any ethnic group within NDC areas. Having said this, the fear of crime score varies less by ethnicity than by either age or sex.
3.5. Underlying explanatory factors: experience and fear of crime
Table 3.1 demonstrates that differences exist between demographic groups within NDC areas in relation to experience and fear of crime. The composition of the local population in terms of age, sex and ethnicity is therefore likely to reflect the level of victimisation and fear of crime within an area. An area with more women than men is likely to have a higher fear of crime score, whilst one with an older population structure is more likely to have a higher proportion of people who feel unsafe after dark. It is therefore important to consider, and adjust for, a number of basic characteristics of NDC residents using logistic regression modelling. The degree to which a series of socio-demographic variables relate to being a victim of crime, fear of crime, feeling unsafe after dark or perception of lawlessness and dereliction within the area are presented as a series of odds ratios in Table 3.2 Table 3.2: Adjusted odds ratios for explanatory variables in base model for experience and fear of crime
Variable and category
Feel unsafe in area after
dark Adjusted OR
High fear of crime score* Adjusted OR
High lawless and dereliction
score** Adjusted OR
Victim of crime
Adjusted OR Sex
Male 1.00 1.00 n.s. 1.00 Female 2.98 2.94 1.08
Age group 16 – 24 1.00 1.00 1.00 1.00 25 – 34 0.92 1.00 0.90 1.00 35 – 44 1.00 0.90 0.98 1.08 45 – 54 1.09 0.93 0.95 0.97 55 – 64 1.39 0.93 0.65 0.72 65 – 74 1.32 0.71 0.44 0.54
75 & over 1.86 0.59 0.25 0.52 Ethnicity
White 1.00 1.00 1.00 1.00 Black 0.53 1.12 0.74 0.82
Asian 1.03 1.51 0.96 1.00 Household composition
Couple, no dep’t children 1.00 1.00 1.00 1.00 Couple, with dep’t children 0.99 0.94 1.14 1.22 Lone parent 0.82 0.86 1.10 1.41
Single person 0.90 0.84 0.88 1.06

New Deal for Communities: The National Evaluation 15 Fear of Crime in NDC Areas
Large adult*** 0.97 0.87 0.98 1.01 Workless household
No 1.00 n.s n.s n.s Yes 1.23
Tenure Owner 1.00 1.00 1.00 n.s Social rent: local authority 1.01 1.18 1.32 Social rent: housing assoc 1.12 1.07 1.13
Private rent 1.04 0.91 0.75 NVQ level
NVQ 4+ 1.00 1.00 1.00 1.00 No NVQ 0.96 1.16 0.72 0.60 NVQ 1 0.99 1.30 0.81 0.72 NVQ 2 1.02 1.08 0.91 0.72
NVQ 3 1.12 1.16 0.96 0.89 Movers last 5 years
None 1.00 n.s 1.00 1.00 One 1.09 0.67 0.91 Two 1.13 0.82 1.08 Three 1.11 0.88 1.12
Four or more 1.37 1.06 1.28 Note: * A high fear of crime score is taken as individuals in the top third of the distribution. This equates to a composite score of 25 or more. ** A high lawlessness and dereliction score is taken as individuals in the top third of the distribution. This equates to a composite score of 21 or more. *** Large adult households are those containing two or more adults who are neither partners or related to each other Those in bold are significantly greater than or less than 1 at the 5% level of significance. The first category of each variable is the base level with an odds ratio of 1. The odds ratios for other categories within a variable are in relation to this base group for e.g. women in NDC areas are 3.39 times more likely to feel unsafe after dark than men in the area n.s. = non significant. The odds ratios confirm some earlier findings from Table 3.1. Sex is not a significant predictor of perception of lawlessness or dereliction in NDC areas. Women are on average, however, nearly three times as likely as men to either feel unsafe walking alone in the area after dark or to register a high fear of crime score. These results are adjusted to take into account all other factors in the model as outlined in Table 3.2. When odds ratios by age are considered the earlier trends are again re-enforced and to a certain extent magnified. This is after taking into account other basic demographic and contextual factors in the model. The odds of having a high score for the degree of lawlessness and dereliction in the area significantly declines with age for those aged 55 and over. For residents aged 75 and over the likelihood is only a quarter of that for the 16 to 24 year olds. The likelihood of recording a high fear of crime score decreases significantly for those aged 65 and over. For example, those aged over 75 are approximately forty percent less likely than 16-24 year olds to have a high fear of crime score. This is juxtaposed against increasing odds ratios by age for feeling unsafe walking alone in the area after dark. Those aged 75 or over are almost twice as likely as 16-24 year olds to feel unsafe. However, odd ratios indicate that there is no noticeable difference across the under 55 age groups in terms of risk of being a victim of crime. The odds are however significantly lower for those aged over 55 and the likelihood for those aged over 65 drops to approximately half of that for those aged 16-24. A very mixed story emerges when the odds ratios are considered by ethnicity. After adjusting for the other underlying characteristics of the respondents, the model finds that there is no significant difference between white or Asian residents in respect of the risk of being a victim of crime. Black residents are, however, significantly less likely to have been a victim of crime. They also have the lowest odds of having a perception of high local lawlessness and dereliction score.
New Deal for Communities: The National Evaluation 16 Fear of Crime in NDC Areas
There are no significant differences between black and white residents in relation to fear of crime. Black residents are however half as likely as white residents to feel unsafe walking alone in the area after dark. Asian residents in NDC areas are significantly more likely to register a high fear of crime score. For black residents the relationships hold true across all indicators: they are less likely to be a victim of crime, feel unsafe after dark or feel there is a high degree of lawlessness and dereliction in the area. They also show no difference from the base category with regard to reporting high fear of crime levels. For Asian residents the pattern of odds ratios is less straightforward. They show no significant difference from the base category in being a victim of crime, their perceived level of lawlessness and dereliction in the area or in feeling unsafe after dark. However, they have significantly higher odds of having a high fear of crime score. Table 3.2 also explores a number of other explanatory factors for experience and fear of crime. A number of findings emerge. For instance respondents who are not in a couple are less likely to feel unsafe after dark and to record a high fear of crime. Single person households are also significantly less likely to feel lawlessness and crime is a big problem in the area compared with other types of household structure. Lone parent households are however most at risk of being a victim of crime over the previous year. Whether an NDC resident is a member of a workless household appears to have no bearing on either their likelihood of being a victim of crime or perceiving lawlessness and crime as a big problem in the area. It does, however, significantly increase the odds of having a high fear of crime score or feeling unsafe after dark. Tenure has no association with being a victim of crime. However, for the other crime indicators there are significant relationships with the type of housing. Housing association housing is the only tenure category which has significantly higher odds of feeling unsafe after dark. Those who rent from the local authority are more likely than owner occupiers to have a high fear of crime - this is after all the other main effects in the model have been adjusted for. Residents in social housing are also more likely to feel there is a high degree of lawlessness and dereliction in the area. The only outcome where those in the private rented sector differ significantly from owner occupiers is that they are less likely to believe there is a high level of lawlessness and dereliction in the area. Finally, Table 3.2 considers the extent to which educational attainment has a bearing on either experiencing or fearing crime. Education has an influence on fear of crime. Those who possess the equivalent of no NVQ, an NVQ level 1 or an NVQ 3 are significantly more likely to have high fear of crime than those with an NVQ level 4 or above. Conversely, those with no qualifications are least likely to feel there is a high degree of lawlessness or dereliction in the area and are also least likely to be a victim of crime. This analysis by key characteristics of NDC residents has highlighted some interesting tensions between perception and risk of crime. For example, evidence points to high odds for fear of crime and feeling unsafe after dark for women. Yet in reality they are only slightly more likely to be a victim of crime and no more likely to feel the problems in the area are any worse than men. The relationship between implicit and explicit measures of fear of crime is also worth commenting upon. For certain characteristics these two measures are closely correlated: by sex, household composition, worklessness and tenure. For others, the relationship is less clear cut. For example, fear of crime tends to increase with lower
New Deal for Communities: The National Evaluation 17 Fear of Crime in NDC Areas
educational attainment, yet there is no discernable difference in feeling unsafe after dark by level of qualifications. The opposite trends in implicit and explicit fear of crime by age are especially intriguing. The odds of feeling unsafe after dark rapidly increase with age and yet fear of crime decreases with age. This may mean that here two different concepts are being measured. In the following chapter, we will build on previous analysis of the MORI/NOP Household Survey (Beatty et al 2005a) in relation to how crime and fear of crime has a detrimental effect on the health of NDC residents.
New Deal for Communities: The National Evaluation 18 Fear of Crime in NDC Areas
4. CRIME, HEALTH AND QUALITY OF LIFE
4.1. Health, quality of life and crime
Fear of crime is believed to have a negative impact on quality of life and health. Mirrlees-Black et al (1998) examined the relationship between fear of crime and health in their analysis of the British Crime Survey. They found that while 19 per cent of people nationally were very worried about burglary, the figure was 30 per cent for those in poor health. However, Green et al (2002) did not find a consistent correlation across different types of fear variables. Implicit fear measures proved to be a good predictor of health status, particularly mental health, whilst explicit measures of fear were found to have weaker associations. Experience of crime is also believed to have a negative effect on health and quality of life. Wilkinson et al (1998) found that, at large area levels in the USA, actual crime rates are positively associated with standardised mortality. If a relationship can be found between health and crime then initiatives aimed at reducing fear of crime and actual crime levels could have a positive impact on residents' health and wellbeing. The MORI/NOP Household Survey contains a number of variables relating to respondents' self-reported health and health-related quality of life (see Appendix Table A9). These questions include perceptions of health over the previous twelve months, change in health over last twelve months, long standing illness and a number of variables that can be aggregated to create a SF36 mental health score.3
4.2. Modelling health and crime
Beatty et al (2005a), in their study of health in NDC neighbourhoods, fully explored the interaction between health and crime in NDC areas. Bivariate and multivariate analyses found that those individuals who have experienced crime, or are more worried about crime, are more likely to perceive their health to be bad. Table 4.1, taken from the Beatty et al (2005a), provides the adjusted odds ratios for health outcomes given crime as an explanatory variable. The model adjusts for the main demographic characteristics plus problem with the area indicators.
3 SF-36 is one of the most widely evaluated quality of life instruments used in health related research (Garrett et al, 2002). The SF-36 mental health score is one of eight possible domains measured by the SF36. Scores on the index range from zero (worse possible mental health quality of life) to 100 (best possible mental health related quality of life).

New Deal for Communities: The National Evaluation 19 Fear of Crime in NDC Areas
Table 4.1: Adjusted odds ratios for health given crime as an explanatory variable
Variable and category
Poor health in last 12 months
Health worse in last 12 months
Low SF-36 mental health score
Long standing illness or disability
Fear of crime Low 1.00 1.00 1.00 n.s. Moderate 1.06 1.01 1.39 High 1.24 1.17 2.01 No times a victim of crime in 12 months None 1.00 1.00 1.00 1.00 One 1.27 1.24 1.27 1.18 Two 1.25 1.24 1.39 1.50 Three or
more 1.88 1.71 2.15 1.65
Note: Those in bold are significantly greater of less than 1 at the 5% level of significance. Table 4.1.indicates that as residents' fear of crime scores move from low to high they are significantly more likely to report poor health. For example, residents with high fear of crime scores are more than twice as likely to have a low SF36 mental health score as those with a low fear of crime scores. Being a victim of crime also significantly increases the odds of having poor health across all four health variables. For example, those residents who have been a victim of crime once during the last year are 24 per cent more likely to feel their health is worse than 12 months ago. Those who have been victims three or more times are 71 per cent more likely to think their health is worse. The links between crime, fear of crime and health, particularly mental health, appear well established. The policy implications within a regeneration context, however, have been less deeply researched. In their study on housing investment and health in Liverpool, Critchley et al (2004) focused on aspects of various “new-build” initiatives by the Liverpool Housing Action Trust (HAT). The HAT development team worked closely with tenants and the architectural liaison officer from Secured by Design (2004), the UK Police flagship initiative supporting the principles of 'designing out crime ' by use of effective crime prevention and security standards for a range of applications. The reduction of crime and the fear of crime are key objectives of the initiative, which are in accord with the aim of the ODPM guidance to put more emphasis on people and communities. The study found that the HAT interventions did, indeed, lead to a reduction in fear of crime levels with a resultant improvement in health-related quality of life.
New Deal for Communities: The National Evaluation 20 Fear of Crime in NDC Areas
5. CRIME AND THE ENVIRONMENT
5.1. Satisfaction with housing and the local area
The characteristics of an area where people live and their satisfaction with housing are thought to be important correlates with fear of crime. For instance, Green et al (2002), in a study of residents living in residential tower blocks in Liverpool, found those not satisfied with their housing are almost twice as likely to perceive a recent increase in crime (adjusted odds ratio of 1.97). The NDC MORI/NOP Household Survey contains a number of variables relating to housing satisfaction. Four of these variables can be combined to calculate an area wellbeing index (see Appendix Table A10) which increases with satisfaction. Perceptions of satisfaction with accommodation, state of repair of home, area and local quality of life are encompassed within the index (Green et al, 2001).
5.2. Modelling community well-being and crime
Table 5.1 presents odds ratios which have been adjusted for core demographic characteristics: age, gender, household composition, ethnicity, tenure, education, household worklessness and Partnership area.
Table 5.1: Odds ratios for satisfaction with the local area
Variable and category Unsafe after dark
High fear of crime
Crime victim
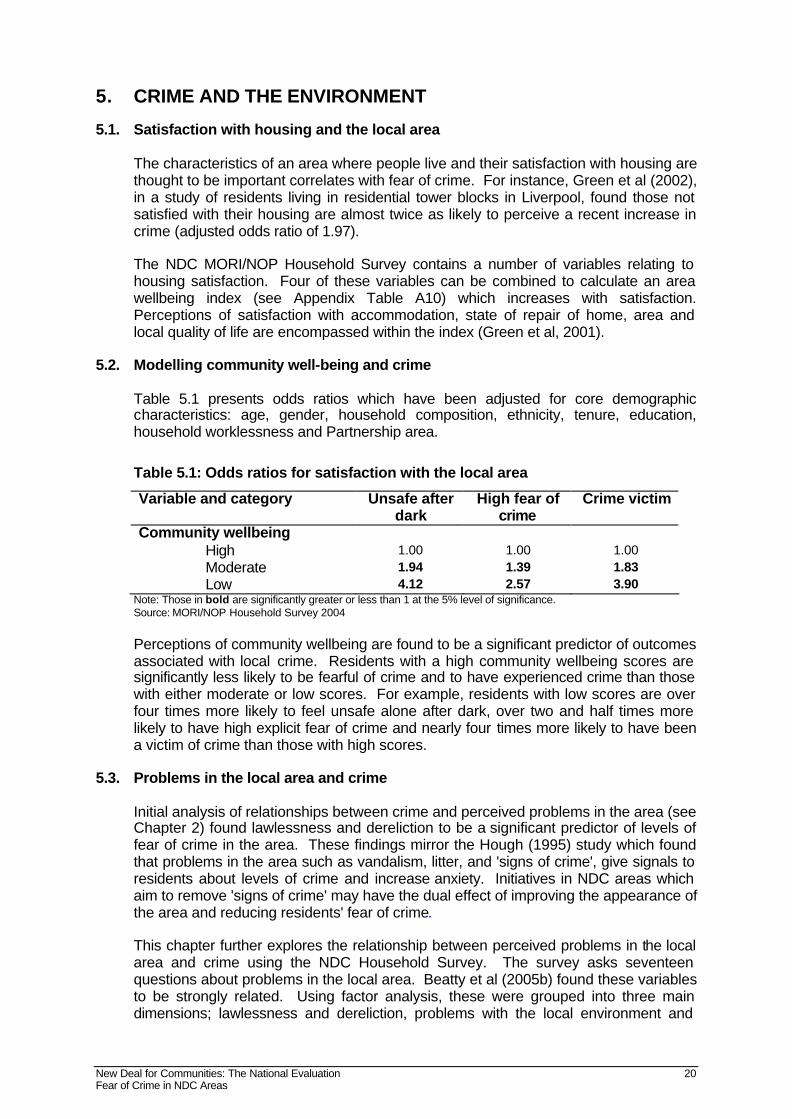
Community wellbeing High 1.00 1.00 1.00 Moderate 1.94 1.39 1.83 Low 4.12 2.57 3.90
Note: Those in bold are significantly greater or less than 1 at the 5% level of significance. Source: MORI/NOP Household Survey 2004 Perceptions of community wellbeing are found to be a significant predictor of outcomes associated with local crime. Residents with a high community wellbeing scores are significantly less likely to be fearful of crime and to have experienced crime than those with either moderate or low scores. For example, residents with low scores are over four times more likely to feel unsafe alone after dark, over two and half times more likely to have high explicit fear of crime and nearly four times more likely to have been a victim of crime than those with high scores.
5.3. Problems in the local area and crime
Initial analysis of relationships between crime and perceived problems in the area (see Chapter 2) found lawlessness and dereliction to be a significant predictor of levels of fear of crime in the area. These findings mirror the Hough (1995) study which found that problems in the area such as vandalism, litter, and 'signs of crime', give signals to residents about levels of crime and increase anxiety. Initiatives in NDC areas which aim to remove 'signs of crime' may have the dual effect of improving the appearance of the area and reducing residents' fear of crime. This chapter further explores the relationship between perceived problems in the local area and crime using the NDC Household Survey. The survey asks seventeen questions about problems in the local area. Beatty et al (2005b) found these variables to be strongly related. Using factor analysis, these were grouped into three main dimensions; lawlessness and dereliction, problems with the local environment and
New Deal for Communities: The National Evaluation 21 Fear of Crime in NDC Areas
difficulties in social relations. A composite score was obtained for each of the dimensions by summing responses across the variables in each group, the higher the score, the greater the perceived level of local problems (see Appendix Table A3).
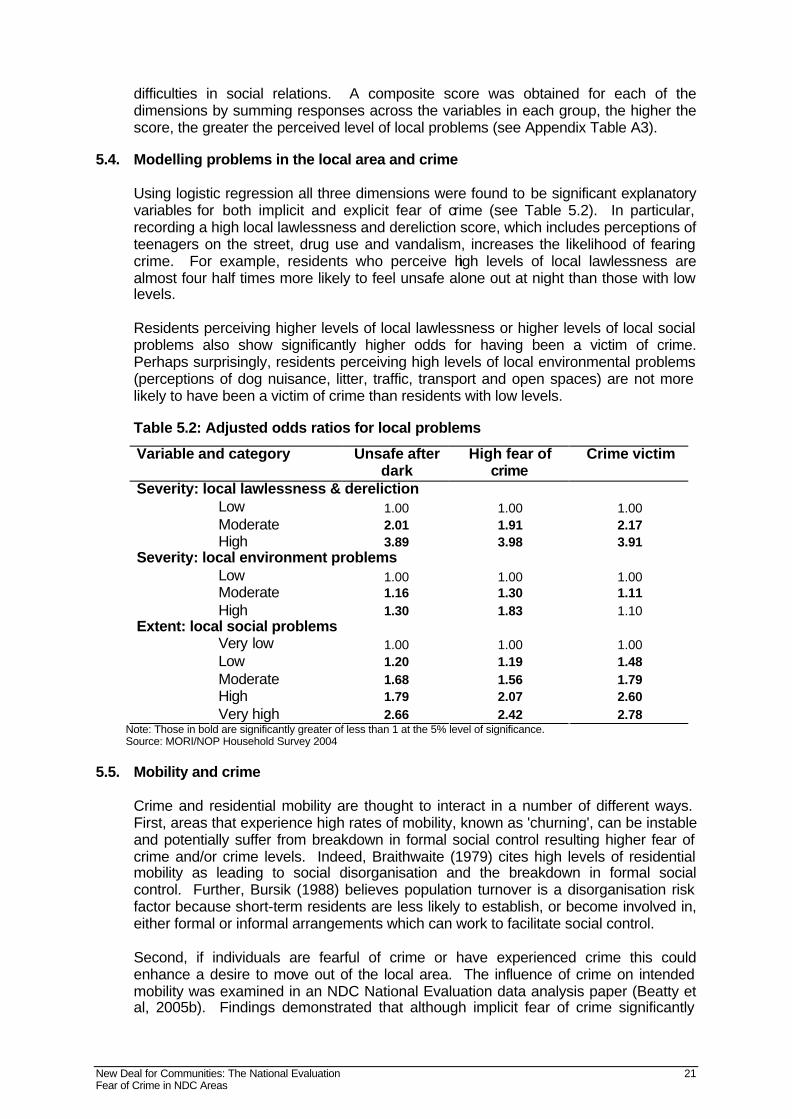
5.4. Modelling problems in the local area and crime
Using logistic regression all three dimensions were found to be significant explanatory variables for both implicit and explicit fear of crime (see Table 5.2). In particular, recording a high local lawlessness and dereliction score, which includes perceptions of teenagers on the street, drug use and vandalism, increases the likelihood of fearing crime. For example, residents who perceive high levels of local lawlessness are almost four half times more likely to feel unsafe alone out at night than those with low levels. Residents perceiving higher levels of local lawlessness or higher levels of local social problems also show significantly higher odds for having been a victim of crime. Perhaps surprisingly, residents perceiving high levels of local environmental problems (perceptions of dog nuisance, litter, traffic, transport and open spaces) are not more likely to have been a victim of crime than residents with low levels. Table 5.2: Adjusted odds ratios for local problems
Variable and category Unsafe after dark
High fear of crime
Crime victim
Severity: local lawlessness & dereliction Low 1.00 1.00 1.00 Moderate 2.01 1.91 2.17
High 3.89 3.98 3.91 Severity: local environment problems
Low 1.00 1.00 1.00 Moderate 1.16 1.30 1.11
High 1.30 1.83 1.10 Extent: local social problems
Very low 1.00 1.00 1.00 Low 1.20 1.19 1.48 Moderate 1.68 1.56 1.79 High 1.79 2.07 2.60
Very high 2.66 2.42 2.78 Note: Those in bold are significantly greater of less than 1 at the 5% level of significance. Source: MORI/NOP Household Survey 2004
5.5. Mobility and crime
Crime and residential mobility are thought to interact in a number of different ways. First, areas that experience high rates of mobility, known as 'churning', can be instable and potentially suffer from breakdown in formal social control resulting higher fear of crime and/or crime levels. Indeed, Braithwaite (1979) cites high levels of residential mobility as leading to social disorganisation and the breakdown in formal social control. Further, Bursik (1988) believes population turnover is a disorganisation risk factor because short-term residents are less likely to establish, or become involved in, either formal or informal arrangements which can work to facilitate social control. Second, if individuals are fearful of crime or have experienced crime this could enhance a desire to move out of the local area. The influence of crime on intended mobility was examined in an NDC National Evaluation data analysis paper (Beatty et al, 2005b). Findings demonstrated that although implicit fear of crime significantly
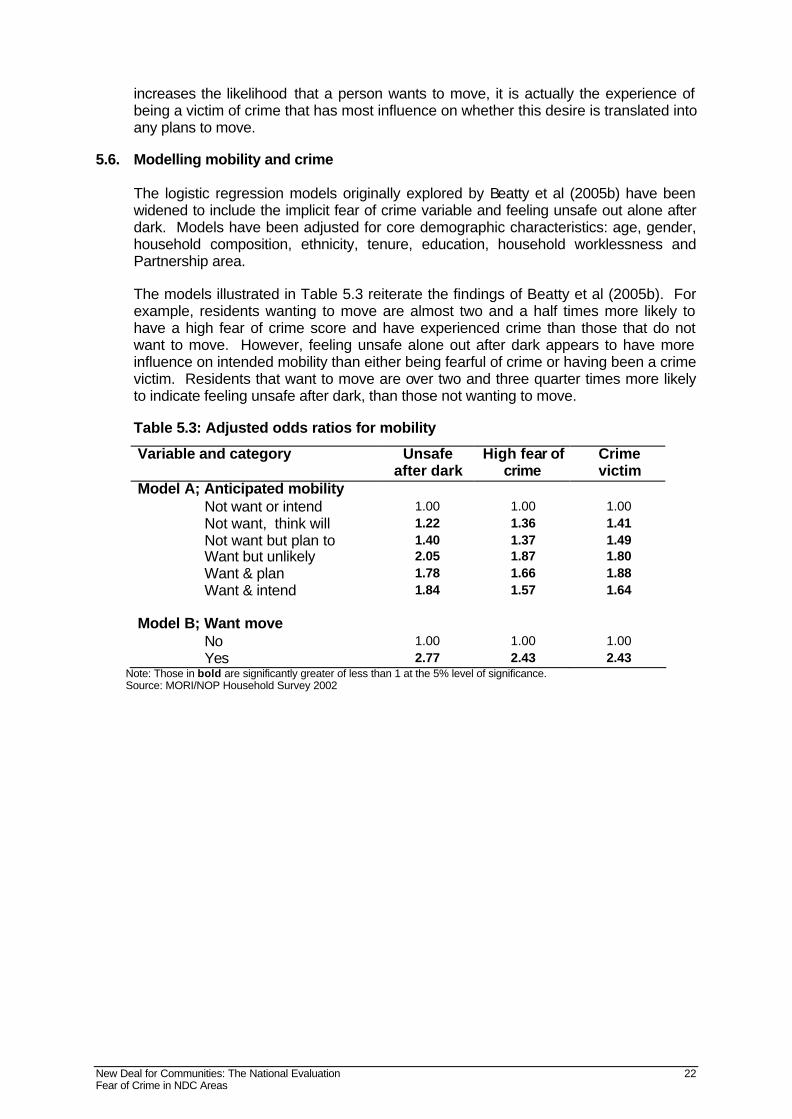
New Deal for Communities: The National Evaluation 22 Fear of Crime in NDC Areas
increases the likelihood that a person wants to move, it is actually the experience of being a victim of crime that has most influence on whether this desire is translated into any plans to move.
5.6. Modelling mobility and crime
The logistic regression models originally explored by Beatty et al (2005b) have been widened to include the implicit fear of crime variable and feeling unsafe out alone after dark. Models have been adjusted for core demographic characteristics: age, gender, household composition, ethnicity, tenure, education, household worklessness and Partnership area. The models illustrated in Table 5.3 reiterate the findings of Beatty et al (2005b). For example, residents wanting to move are almost two and a half times more likely to have a high fear of crime score and have experienced crime than those that do not want to move. However, feeling unsafe alone out after dark appears to have more influence on intended mobility than either being fearful of crime or having been a crime victim. Residents that want to move are over two and three quarter times more likely to indicate feeling unsafe after dark, than those not wanting to move. Table 5.3: Adjusted odds ratios for mobility
Variable and category Unsafe after dark
High fear of crime
Crime victim
Model A; Anticipated mobility Not want or intend 1.00 1.00 1.00 Not want, think will 1.22 1.36 1.41 Not want but plan to 1.40 1.37 1.49 Want but unlikely 2.05 1.87 1.80 Want & plan 1.78 1.66 1.88 Want & intend 1.84 1.57 1.64 Model B; Want move No 1.00 1.00 1.00 Yes 2.77 2.43 2.43
Note: Those in bold are significantly greater of less than 1 at the 5% level of significance. Source: MORI/NOP Household Survey 2002

New Deal for Communities: The National Evaluation 23 Fear of Crime in NDC Areas
6. CRIME, SOCIAL CAPITAL AND COHESION
6.1. Social capital and cohesion
Socially cohesive areas can be defined as areas with relatively high levels of interaction between residents and a strong sense of community (Hirschfield and Bowers, 1997). It is generally believed that levels of social cohesion within a community are linked to levels of fear and actual crime rates. If people know and trust their neighbours then they may be less fearful of crime. Tennyson-Mason (2002) states: 'increased community action and the feeling that neighbours are concerned about each other leads to greater feelings of safety, less fear and less tolerance of crime and disorder'. Although findings were not 'clear cut' Green et al (2002) found a significant relationship between implicit fear and feelings about people in the neighbourhood. This work also found that those who felt local people 'went their own way' tended to be more fearful of being mugged or burgled. Highly cohesive areas are believed to have a higher degree of social control than more disorganised areas. Social cohesion, therefore, may have a part to play in differentiating levels of crime within neighbourhoods (Ebbe, 1989). Hirshfield and Bowers (1997) examined the relationship between crime rates and levels of social cohesion within disadvantaged areas. They found that 'levels of social control do have an effect on levels of assault and robbery in the most disadvantaged areas'. However, they did not find any relationship between levels of social control and burglary. These findings have direct implications for policy. Reducing fear of crime could be achieved through greater community interaction. Tennyson-Mason (2002) believes 'reduction (of fear of crime) is as much about social regeneration, such as providing facilities for young people and bringing people together to develop informal social control mechanisms, as it is about actual reduction in crime.' Similarly, the most appropriate strategy to reduce levels of crime in disadvantaged areas might be through 'fostering an increased sense of community rather than by concentrating resources on economic revival' (Hirschfield and Bowers, 1997).
6.2. Modelling social capital, cohesion and crime
The household survey contains a number of measures which provide an indication of sense of community (see Appendix Table A12). The survey also establishes residents' levels of trust in four agencies at a local level; police, council, health services and schools. The four trust variables have been combined to create a single vertical trust, or community trust, composite score: a high score indicates a high level of trust in organisations (see Appendix Table A11). These measures reflect different dimensions of social cohesion and social capital: neighbourhood reciprocity, social networks, engagement, trust and governance. The interaction between these dimensions and crime has been explored using logistic modelling. Table 6.1 presents the resulting odds ratios, which have been adjusted for core demographic characteristics. Residents with low levels of trust are significantly more likely to be fearful of crime . For example, residents with a low vertical trust score are 78 per cent more likely to feel unsafe out alone at night. Higher levels of fear are also significantly more likely to be experienced by residents who indicate low levels of reciprocity. Residents who perceive their neighbours not to be friendly are 45 per cent more likely to have a high fear of crime score than those who perceive their neighbours to be friendly. However, differences are apparent between implicit and explicit fear of crime when examining links with social networks. Residents with poor social networks are significantly more likely to experience implicit fear of crime, but not explicit fear.

New Deal for Communities: The National Evaluation 24 Fear of Crime in NDC Areas
The relationship between social cohesion and having been a crime victim is more complex. Residents indicating low levels of vertical trust and reciprocity are more likely to have been a victim of a crime, than are residents with higher levels. Interestingly, there is a positive relationship between social networks, governance, community engagement and having been a victim of crime. Residents who know people in their neighbourhood are ten per cent more likely to have been a victim of crime than those that don't know their neighbours. Finally, residents that feel they can influence local decisions are 12 per cent more likely to have been victims of crime than those that do not. Table 6.1: Adjusted odds ratios for community cohesion
Variable and category Unsafe after dark
High fear of crime
Crime victim
Not part of local community No 1.00 1.00 1.00 Yes 1.13 1.10 1.10 Neighbours not friendly No 1.00 1.00 1.00 Yes 1.99 1.45 1.42 Don't know neighbours No 1.00 n.s. 1.00 Yes 1.38 0.91 Neighbours don't look out for each other No 1.00 1.00 1.00 Yes 1.42 1.33 1.60 Can't influence decisions affecting area No 1.00 1.00 1.00 Yes 1.13 0.88 0.89 Trust High 1.00 1.00 1.00 Moderate 1.39 0.98 1.18 Low 1.78 1.39 1.62
Note: Those in bold are significantly greater of less than 1 at the 5% level of significance. Source: MORI/NOP Household Survey 2004 In general, then, higher levels of the “classic” social capital dimension of reciprocity or neighbourliness are associated with lower levels of implicit and explicit fear of crime and, indeed, to some extent “victimhood”. These inter-relationships and the links with health-related quality of life (see Chapter 4) appear consistent with the notion that healthier neighbourhoods are synonymous with healthier people. The connections between efficacy and engagement and the differing aspects of crime, particularly experience of crime, are less clear and demand further study. Perhaps experiencing crime can even act as a spur to community engagement.

New Deal for Communities: The National Evaluation 25 Fear of Crime in NDC Areas
7. TRUST AND SATISFACTION WITH THE LOCAL POLICE
7.1. Trust and satisfaction with local police
The Home Office National Policing Plan, 2004-07, places an emphasis on the concept of citizen focus policing. Central to this concept is the belief that the police can contribute to strengthening communities. This can be achieved by working in cooperation with communities, earning their trust and being, at least in part, accountable to them. In order to achieve this goal the government 'aims to ensure the police inspire public satisfaction and confidence.' In their analysis of the 1996 British Crime Survey, Mirrlees-Black and Budd (1997) found that eight in ten people (81 per cent) think their local police do a very or fairly good job. Levels of satisfaction and confidence with the police in NDC areas can be obtained using the MORI/NOP Household Survey which provides information about levels of trust in the local police and satisfaction with the quality of service provided by them (see Appendix Table A13). Table 7.1: Levels of trust and satisfaction with local police
% or respondents
NDC Areas
Comparator Areas
National
2Trust in local police A great deal 14 12 12 A fair amount 47 48 53 Don't know either way 7 8 5 Not very much 22 23 24 Not at all 9 9 6 1Dissatisfied with quality of police service Very satisfied 12 9 27 Fairly satisfied 41 41 46 Neither satisfied nor dissatisfied 18 20 13 Fairly dissatisfied 14 14 8 Very dissatisfied 9 9 3 Don't know 7 6 3
Source: MORI/NOP Household Survey 2004; National benchmarks: 1People's Panel Baseline 1998; 2MORI Omnibus 2004
Table 7.1 indicates that levels of trust in local police are similar in NDC, comparator areas, and nationally. Some 61 per cent of residents from NDC and comparator areas trust their local police a great deal or fair amount compared with 65 per cent nationally. However, levels of satisfaction with the service provided by the local police are also comparable in NDC and comparator areas, but lower than the national average. Fifty three per cent of those in NDC areas are satisfied (very or fairly) with the quality of police service in their local area compared with 73 per cent nationally. Household Survey data can also be used to explore the relationship between trust and satisfaction with the local police in NDC areas. Figure 7.1 presents a scatter chart of the proportion of residents that are dissatisfied with the service provided by the local police within each NDC area against the proportion of residents that distrust the local police for each area. The scatter chart clearly shows a positive relationship between trust and satisfaction with the local police. The correlation coefficient of 0.86 confirms a strong, positive and significant relationship between the two variables. The two

New Deal for Communities: The National Evaluation 26 Fear of Crime in NDC Areas
variables regarding trust and satisfaction with the local police are possibly measuring a similar concept. Figure 7.1: Levels of dissatisfaction with the service provided by the local police in NDC areas compared with levels of distrust
% dissatisfied with service provided by local police
403530252015105
% d
istr
ust l
ocal
pol
ice
50
45
40
35
30
25
20
15
10
5
Newham
Hackney
FulhamBradford
Southampton
Norwich
Tower Hamlets
Sheffield
Rochdale
Sandwell
Source: MORI/NOP Household Survey 2004 The scatter chart also reveals that although there is a strong relationship between trust and satisfaction, there is wide variation across Partnerships. For example, 44 per cent of respondents distrust the police and 37 per cent are dissatisfied in Southampton compared with 21 per cent who distrust and 11 per cent who are dissatisfied in Hammersmith and Fulham.
7.2. Modelling trust and satisfaction with local police across Partnerships
The variation of levels of trust and satisfaction highlighted in Figure 7.1 can be further explored using multivariate logistic regression. Logistic regression can be used to illustrate the variation in the likelihood of residents distrusting or being dissatisfied with the police depending on which NDC area they live. As NDC areas do not have identical demographic profiles, odds ratios are adjusted for factors such as age, sex, tenure and worklessness. Figures 7.2 and 7.3 present the adjusted odds ratios for distrust and dissatisfaction with the police for individual NDCs compared with the average across all Partnerships (see Appendices Table A14 and Table A15).

New Deal for Communities: The National Evaluation 27 Fear of Crime in NDC Areas
Figure 7.2: Adjusted odds ratios for distrust local police
0.4 0.6 0.8 1.0 1.2 1.4 1.6 1.8 2.0
BrentH'smith&Fulham Newcastle
Hackney Lambeth
Tower Hamlets Plymouth
BradfordRochdale
WalsallIslington
WolverhamptonDoncaster
HartlepoolKnowsley
SunderlandNewham
Southwark Oldham
Coventry Birmingham A
SalfordLewisham
SheffieldBristol
Hull Brighton
Manchester Nottingham
HaringeyLeicester
Birmingham KNLiverpool
DerbyNorwich
Luton Middlesbrough
Sandwell Southampton
Odds ratio
Note: bars in black represent areas where OR is significant at the 5% level Source: MORI/NOP Household Survey 2004 There is wide variation in levels of trust and satisfaction with the local police across NDC areas. Residents from three Partnerships; Southampton, Luton, and Liverpool are significantly more like to both distrust and be dissatisfied with the local police than the NDC average. For example, residents in Southampton are 65 per cent more likely to distrust and 84 per cent more likely to be dissatisfied with the local police compared with the NDC average. Interestingly, the London Partnerships are significantly less likely to distrust and be dissatisfied with their local police. Of the six Partnerships that are both significantly less likely to distrust and be dissatisfied, four are in London: Brent, Hammersmith and Fulham, Hackney and Lambeth.

New Deal for Communities: The National Evaluation 28 Fear of Crime in NDC Areas
Figure 7.3: Adjusted odds ratios for dissatisfied with the police
0.4 0.6 0.8 1.0 1.2 1.4 1.6 1.8 2.0
H'smith & FulhamHackneyLambeth
BrentNewcastle
NewhamPlymouth
WalsallKnowsley
IslingtonDoncaster
SunderlandWolverhampton
HartlepoolNorwich
RochdaleLeicester
SouthwarkOldham
SandwellCoventry
Tower HamletsBradford
HullBrighton
HaringeyBirmingham KN
DerbySalford
LewishamNottingham
MiddlesbroughBristolLuton
LiverpoolBirmingham A
ManchesterSheffield
Southampton
Odds ratio
Note: bars in black represent areas where OR is significant at the 5% level Source: MORI/NOP Household Survey 2004
7.3. Trust, satisfaction and demographics
The logistic regression models presented above take account of a number of underlying explanatory variables when calculating odds ratios for individual Partnerships. The odds ratios are adjusted for respondents; age, sex, self-reported ethnicity, educational attainment, household composition, tenure and whether the respondent is a member of a workless household. The extent to which these factors may influence trust and satisfaction with the local police are presented in Table 7.2. The findings are similar for the influence of demographic factors on both trust and satisfaction with the police. However, given the high correlation between the two variables (see Section 7.1) this not surprising. All of the demographic characteristics explored have a statistically significant influence on likelihood of both distrusting and being dissatisfied with the police apart from the influence of belonging to a workless household. Couples with dependent children, single person households and large adult households (households with more than one adult other than cohabiters) are significantly less likely to distrust the local police and be dissatisfied with the service provided than couples with no dependant children. The MORI/NOP Household Survey indicates that male respondents are 28 per cent more likely to distrust local police and 23 per cent more likely to be dissatisfied with the service provided than female respondents. This mirrors findings from the 1996 British Crime Survey which found that, overall women tend to rate the police more highly than men (Mirrlees-Black and Budd, 1997). Previous surveys (Reisig and Parks 2000, Mirrlees-Black and Budd 1997 and Bucke 1997) have found that older people are more likely to rate the police highly than younger people. For example, Reisig and Parks (2000) found that those aged 18 to 32 report significantly lower levels of satisfaction than older persons. The findings from

New Deal for Communities: The National Evaluation 29 Fear of Crime in NDC Areas
the MORI/NOP Household Survey are not so clear cut. The three oldest age groups (55 to 64, 65 to 74 and 75 and over) are least likely to distrust the police and compared with the youngest age group (16 to 24) this difference is significant. For example, respondents aged over 74 are 44 per cent less likely to distrust the police than respondents aged between 16 and 24. However, when examining the relationship between age and dissatisfaction with service, only those aged 65 and over are significantly less likely to be dissatisfied than the youngest age group. Residents aged 35 to 44 are the most likely to be dissatisfied with the quality of service provided by the local police - 19 per cent more likely to be dissatisfied than those aged 16 to 24. Table 7.2: Adjusted odds ratios for explanatory variables in base model for relationships with local police Variable and category Distrust local
police Dissatisfied with quality of police
service Household composition
Couple, no dep’t children 1.00 1.00 Couple, with dep’t children 0.82 0.80 Lone parent 0.95 0.89 Single person 0.86 0.82
Large adult 0.80 0.79 Sex
Male 1.00 1.00 Female 0.78 0.81
Age group 16 - 24 1.00 1.00 25 - 34 0.99 1.04 35 - 44 1.06 1.19 45 - 54 1.02 1.07 55 - 64 0.87 1.07 65 - 74 0.80 0.78
75 & over 0.56 0.61 Self-report ethnicity
White 1.00 1.00 Black 0.97 0.77
Asian 0.79 0.82 Workless household
No n.s n.s Yes
Tenure Owner 1.00 1.00 Social rent: local authority 1.05 1.11 Social rent: housing assoc 1.19 1.22
Private rent 0.81 0.87 NVQ level
NVQ 4+ 1.00 1.00 NVQ 3 1.21 1.17 NVQ 2 1.24 1.14 NVQ 1 1.42 1.29
No NVQ 1.19 1.05 Moves last 5 years
None 1.00 1.00 One 0.82 0.81 Two 0.79 0.81 Three 0.89 0.88
Four or more 1.24 1.00 Note: Those in bold are significantly greater of less than 1 at the 5% level of significance. Source: MORI/NOP Household Survey 2004
New Deal for Communities: The National Evaluation 30 Fear of Crime in NDC Areas
White residents are significantly more likely to distrust, and be dissatisfied with the police compared with Asian residents and more likely to be dissatisfied with the police compared with Black residents. For example, Asian respondents are 21 per cent likely to trust or be satisfied with the local police than White respondents. These results, again, differ from previous surveys which have found White respondents to express greater satisfaction with the police than BME groups (Resig and Parks, 2000 and Mirrlees-Black and Budd, 1997). Reisig and Parks (2000) also found that the higher a respondents educational attainment, the lower their dissatisfaction with police. The same is true for NDC areas where respondents with at least NVQ level 4 qualifications are significantly less likely to be dissatisfied with the police than those with lower levels of educational attainment. The relationship between tenure and how residents regard the police is explored by categorising respondents into four tenure groups; owner, private renter and two types of social renters (local authority and housing association). Social renters are the most likely of all tenure groups to distrust and be dissatisfied with the police, private renters are least likely.
7.4. Modelling crime, trust and satisfaction with local police
The relationship between how residents regard their local police and their experience or fear of crime is explored using logistic regression. The resulting adjusted odds ratios are presented in Table 7.3. A study in the USA of 5,361 residents found the main factor affecting satisfaction with the police relates to perceptions of safety, accounting for individual characteristics such as race and age (Resig and Parks 2000). Analysis of the NDC survey data reveals significant relationships between fear of crime and perceptions of the police. Residents with moderate and high fear of crime levels are significantly more likely to both distrust and be dissatisfied with the police than those with low fear of crime scores. For example, residents with high fear of crime scores are over one and half times as likely to distrust the police, and are over twice as likely to be dissatisfied with the service provided, as those with low scores. The same USA study reveals that the second most important factor in shaping opinions is direct contact with officers. There is an argument, therefore, that the best way to improve satisfaction with police is by improving the quality of daily interaction between patrol officers and citizens (Reisig and Parks, 2000). Although the MORI/NOP Household Survey does not collect information about incidence of police contact, it does gather information about crime victimisation, a potential catalyst for initiating contact. Analysis of the survey reveals an interesting relationship between being a victim of crime and how residents regard the local police. Residents experiencing crime are significantly more likely to both distrust and be dissatisfied with the police. This is particularly true for those that have had two or more experiences of crime. For example, residents that have been a victim of crime more than once are almost two and half times more likely to be dissatisfied with the service provided by the police and almost two times more likely to distrust the police than those who have not been a victim.
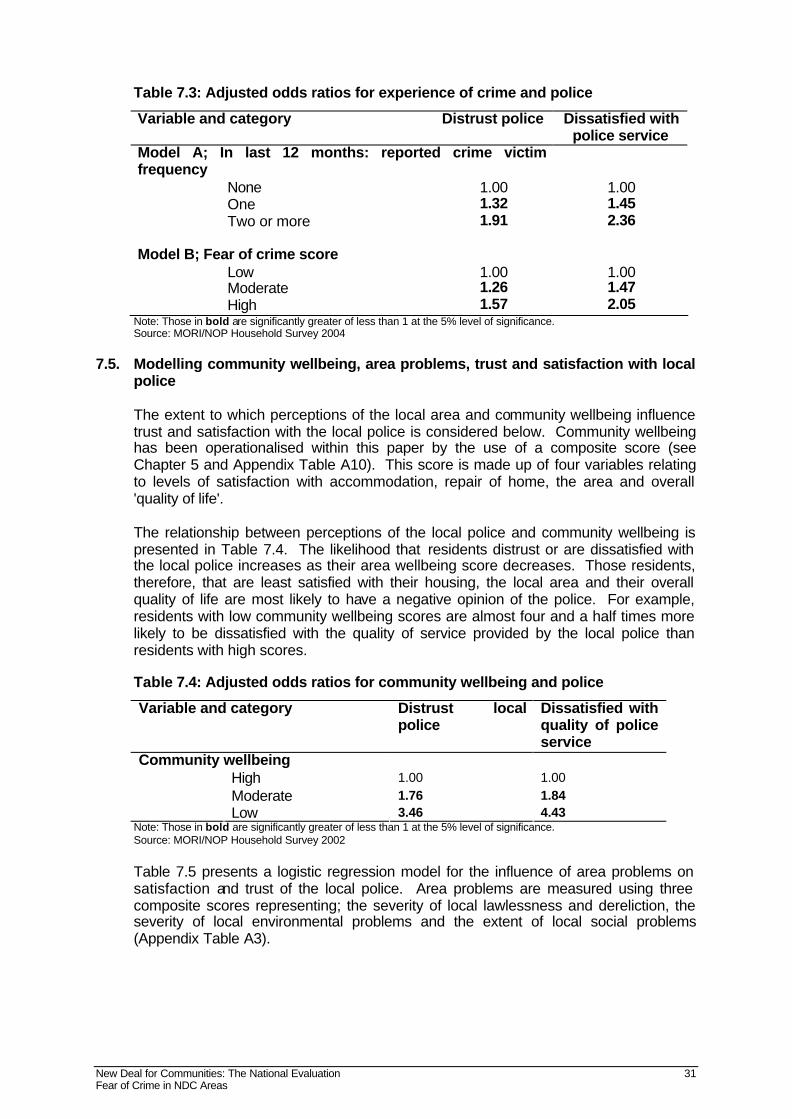
New Deal for Communities: The National Evaluation 31 Fear of Crime in NDC Areas
Table 7.3: Adjusted odds ratios for experience of crime and police
Variable and category Distrust police Dissatisfied with police service
Model A; In last 12 months: reported crime victim frequency
None 1.00 1.00 One 1.32 1.45 Two or more 1.91 2.36 Model B; Fear of crime score Low 1.00 1.00 Moderate 1.26 1.47 High 1.57 2.05
Note: Those in bold are significantly greater of less than 1 at the 5% level of significance. Source: MORI/NOP Household Survey 2004
7.5. Modelling community wellbeing, area problems, trust and satisfaction with local police
The extent to which perceptions of the local area and community wellbeing influence trust and satisfaction with the local police is considered below. Community wellbeing has been operationalised within this paper by the use of a composite score (see Chapter 5 and Appendix Table A10). This score is made up of four variables relating to levels of satisfaction with accommodation, repair of home, the area and overall 'quality of life'. The relationship between perceptions of the local police and community wellbeing is presented in Table 7.4. The likelihood that residents distrust or are dissatisfied with the local police increases as their area wellbeing score decreases. Those residents, therefore, that are least satisfied with their housing, the local area and their overall quality of life are most likely to have a negative opinion of the police. For example, residents with low community wellbeing scores are almost four and a half times more likely to be dissatisfied with the quality of service provided by the local police than residents with high scores. Table 7.4: Adjusted odds ratios for community wellbeing and police
Variable and category Distrust local police
Dissatisfied with quality of police service
Community wellbeing High 1.00 1.00 Moderate 1.76 1.84
Low 3.46 4.43 Note: Those in bold are significantly greater of less than 1 at the 5% level of significance. Source: MORI/NOP Household Survey 2002 Table 7.5 presents a logistic regression model for the influence of area problems on satisfaction and trust of the local police. Area problems are measured using three composite scores representing; the severity of local lawlessness and dereliction, the severity of local environmental problems and the extent of local social problems (Appendix Table A3).
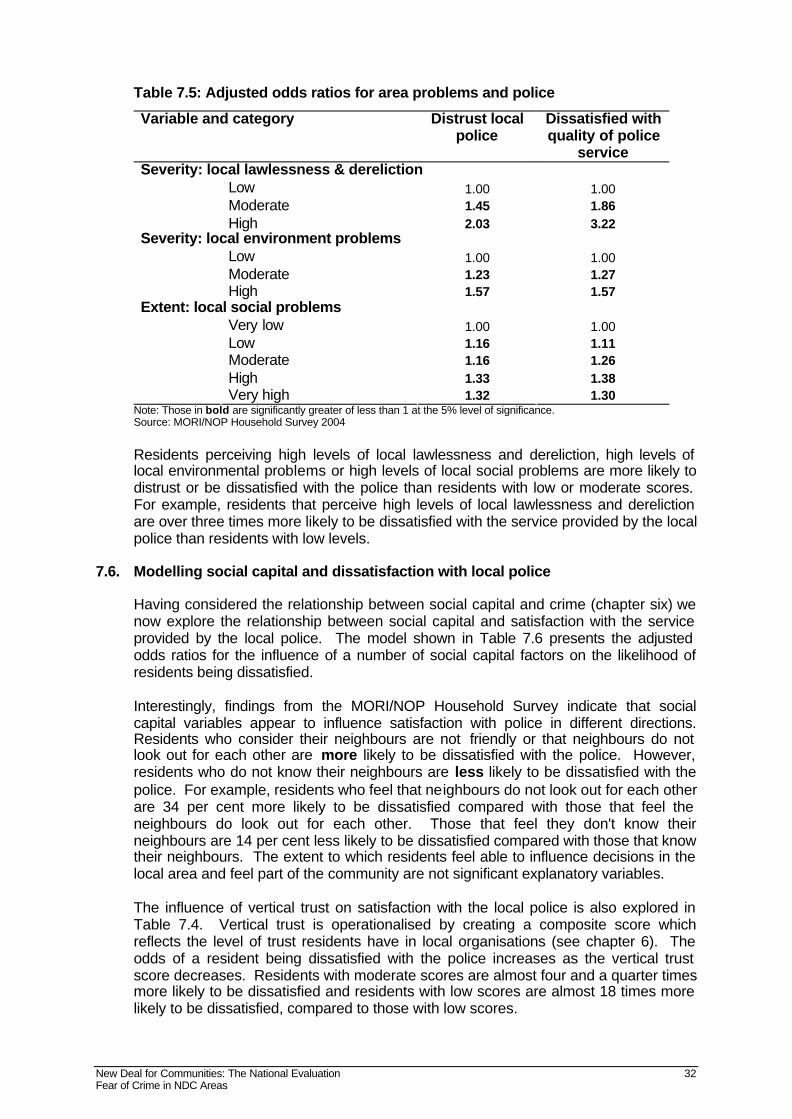
New Deal for Communities: The National Evaluation 32 Fear of Crime in NDC Areas
Table 7.5: Adjusted odds ratios for area problems and police
Variable and category Distrust local police
Dissatisfied with quality of police
service Severity: local lawlessness & dereliction
Low 1.00 1.00 Moderate 1.45 1.86
High 2.03 3.22 Severity: local environment problems
Low 1.00 1.00 Moderate 1.23 1.27
High 1.57 1.57 Extent: local social problems
Very low 1.00 1.00 Low 1.16 1.11 Moderate 1.16 1.26 High 1.33 1.38
Very high 1.32 1.30 Note: Those in bold are significantly greater of less than 1 at the 5% level of significance. Source: MORI/NOP Household Survey 2004
Residents perceiving high levels of local lawlessness and dereliction, high levels of local environmental problems or high levels of local social problems are more likely to distrust or be dissatisfied with the police than residents with low or moderate scores. For example, residents that perceive high levels of local lawlessness and dereliction are over three times more likely to be dissatisfied with the service provided by the local police than residents with low levels.
7.6. Modelling social capital and dissatisfaction with local police
Having considered the relationship between social capital and crime (chapter six) we now explore the relationship between social capital and satisfaction with the service provided by the local police. The model shown in Table 7.6 presents the adjusted odds ratios for the influence of a number of social capital factors on the likelihood of residents being dissatisfied. Interestingly, findings from the MORI/NOP Household Survey indicate that social capital variables appear to influence satisfaction with police in different directions. Residents who consider their neighbours are not friendly or that neighbours do not look out for each other are more likely to be dissatisfied with the police. However, residents who do not know their neighbours are less likely to be dissatisfied with the police. For example, residents who feel that neighbours do not look out for each other are 34 per cent more likely to be dissatisfied compared with those that feel the neighbours do look out for each other. Those that feel they don't know their neighbours are 14 per cent less likely to be dissatisfied compared with those that know their neighbours. The extent to which residents feel able to influence decisions in the local area and feel part of the community are not significant explanatory variables. The influence of vertical trust on satisfaction with the local police is also explored in Table 7.4. Vertical trust is operationalised by creating a composite score which reflects the level of trust residents have in local organisations (see chapter 6). The odds of a resident being dissatisfied with the police increases as the vertical trust score decreases. Residents with moderate scores are almost four and a quarter times more likely to be dissatisfied and residents with low scores are almost 18 times more likely to be dissatisfied, compared to those with low scores.

New Deal for Communities: The National Evaluation 33 Fear of Crime in NDC Areas
Table 7.6: Adjusted odds ratios for social cohesion and satisfaction with local police
Variable and category Dissatisfied with quality of police
service Not part of local community
No n.s. Yes
Neighbours not friendly No 1.00 Yes 1.44
Don't know neighbours No 1.00 Yes 0.86
Neighbours don't look out for each other No 1.00 Yes 1.34
Can't influence decisions affecting area No n.s. Yes
Trust high 1.00 moderate 4.22
low 17.99 Note: Those in bold are significantly greater of less than 1 at the 5% level of significance. Source: MORI/NOP Household Survey 2004 Clearly, from the above, the pattern of social drivers of police service satisfaction is apparently not consistent and again requires deeper investigation. The vertical trust index includes trust in the police as a constituent variable and so the strong relationship with satisfaction in the police service is not surprising. In terms of demographic characteristics, NVQ level tends to be negatively associated with satisfaction and this may be contributing to the negative relationship between satisfaction and feeling part of the community.
New Deal for Communities: The National Evaluation 34 Fear of Crime in NDC Areas
8. SECONDARY AND ADMINISTRATIVE CRIME DATA
8.1. Police Force data
This paper has so far concentrated on findings from the 2004 MORI Household Survey. This explores respondents' reported experience of crime both at an individual and household level in the previous year and worries about crime, lawlessness and dereliction in their area. It has also been possible to relate both experience of and fear of crime to other factors such as their health, levels of social capital and trust in the local police. Two caveats should be stressed here. First, data are based on residents’ experience of crime that they are willing to report to the interviewers of the MORI/NOP Household Survey. This is not necessarily the same as actual levels of crime recorded by police. It is acknowledged that all incidents of crime are not necessarily reported by the public to the police. Also, only those incidents reported to the police that meet the criteria of a Notifiable Offence are recorded as a 'crime'. Evidence from the British Crime Survey (Simmons 2002) confirms that there is a degree of under-reporting of particular crimes. Hence, the MORI/NOP Household Survey may be a more accurate reflection of actual crime levels as perceived amongst NDC residents than Police statistics reveal. Second, the MORI Household Survey relates to individuals living in the area. However, crimes may occur within an area where neither the victim nor the perpetrator are actually resident in that area. This may well be the case for some inner city Partnerships in particular. For such neighbourhoods there may be significant in-flows of daily commuters or people passing through the area for the purpose of work, leisure, or for parking. It is also plausible that in some instances ‘outsiders’ may be specifically targeted for particular types of crime such as car crime or mugging. This may feed a general perception of high fear of crime in an area despite it not impacting on the personal experience of those residents in the area. Conversely, with the exception of the questions relating to household level crime such as burglary, there is no guarantee that crimes reported by NDC residents in the MORI/NOP Household Survey actually take place within the area. This in turn may have the effect of inflating crime rates for an area through incidents which did not take place within it. This chapter therefore aims to complement the MORI/NOP Household Survey data by considering crimes recorded by the Police within each NDC area. In all, a total of eighteen Police forces jurisdictions contain one or more NDC Partnership areas. This evidence has been made possible due to a major data collection exercise by the Social Disadvantage Research Centre (SDRC) at the University of Oxford, a partner in the New Deal for Communities national evaluation team. The database created collates geo-codeable recorded crime data from every Police force in the country. This is a major advance in the resources available for investigating the nature of recorded crime in small areas, as at the beginning of the NDC Evaluation there was no single repository of standardised set of crime statistics for the whole country. A full explanation of the methodology used to compile the data is provided in a paper by SDRC; 'New Deal for Communities National Evaluation: Crime Theme Administrative Data Report: May 2004' (2004). Data relate to the period April 2002 to March 2003. Extractions for later years have been supplied to the research team by most of the forces. However in order to examine Programme wide change it is necessary to have a full complement of force data. These later years are therefore not included in the current analyses. Four key measures are available from the Police recorded crime database:

New Deal for Communities: The National Evaluation 35 Fear of Crime in NDC Areas
• rates of burglary
• theft
• violence
• criminal damage.
Within this section of the paper, recorded crime rates are expressed as a rate per 100 properties within each NDC area for burglary, or per 100 residents for theft, violence or criminal damage. More recently, the SDRC has obtained data from the Office for National Statistics on the non-resident daytime workplace population for each NDC area. This can be used to supplement the resident population used as a base for three of the crime rates. This additional information enables one to take account of "large ‘at-risk’ day time or transient populations and therefore reduce the intensity of town and city centre crime rates" (SDRC 2004, p5). The enhanced methodology is utilised is chapter 10 to analyse change in police recorded crime rates in NDC areas relative to the local authority. It should also be noted that the four indicators are constructed from 33 different Notifiable Offence categories, so they do not necessarily cover every type of crime referred to in the MORI/NOP Household Survey. An initial comparison of the recorded crime data with results from the MORI/NOP Household Survey indicates that there are indeed some noticeable differences between the two. Burglary rates from both the Police data and the household survey are highly correlated when considered by Partnership. However, rates of recorded violence against the person and theft are not statistically correlated with the self-reported measures in the household survey. This pattern does not contradict national findings. In general, self-reported crime rates tend to be higher than police data would suggest. This is due to a combination of under reporting of crimes by the public and recording practices of the police. Indications from the 2001/02 British Crime Survey are that respondents only report 45 per cent of crimes to the police and that only 60 per cent of these are actually recorded by the police (Simmons, 2002). In the case of violence against the person, for example, a large number of incidences of violence may not be reported to the police, especially for particular crimes such as domestic violence. Differences in rates of theft in the MORI/NOP household survey and recorded crime statistics for NDC areas are perhaps due to a combination of circumstances. Under-reporting of theft may occur for crimes such as mobile phone or handbag theft where crimes are unlikely to be recorded unless there is a need to do so for insurance purposes. This would generally depress recorded crime compared with self-reported crime. However, processes may also operate which increase recorded crime in certain locations: thefts to the person may occur to people who are passing through the area but are not actually resident within it. Therefore these crimes may appear in the recorded crime statistics but not within the household survey. There also appears to be something of a London effect. London NDCs tend to report higher levels of being a victim of theft than recorded crime rates suggest. This may be because they have been a victim whilst in another part of London or perhaps because of their not reporting crime to the police as they feel nothing can or will be done about it.
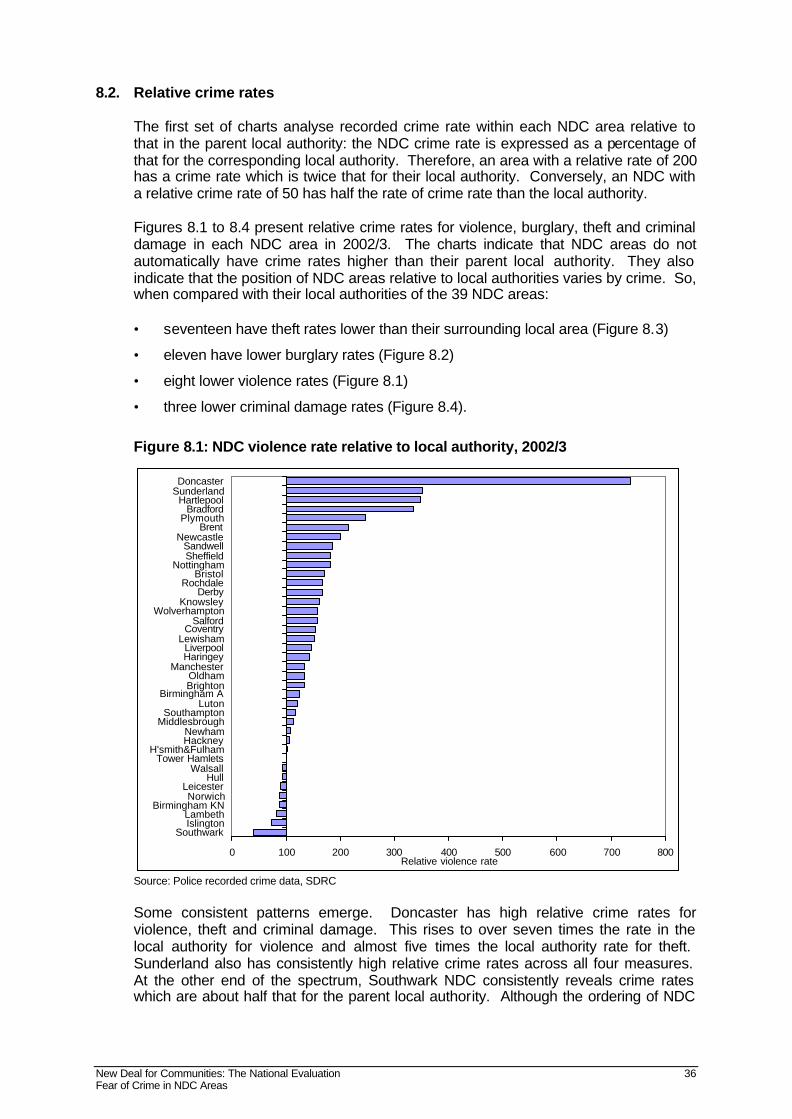
New Deal for Communities: The National Evaluation 36 Fear of Crime in NDC Areas
8.2. Relative crime rates
The first set of charts analyse recorded crime rate within each NDC area relative to that in the parent local authority: the NDC crime rate is expressed as a percentage of that for the corresponding local authority. Therefore, an area with a relative rate of 200 has a crime rate which is twice that for their local authority. Conversely, an NDC with a relative crime rate of 50 has half the rate of crime rate than the local authority. Figures 8.1 to 8.4 present relative crime rates for violence, burglary, theft and criminal damage in each NDC area in 2002/3. The charts indicate that NDC areas do not automatically have crime rates higher than their parent local authority. They also indicate that the position of NDC areas relative to local authorities varies by crime. So, when compared with their local authorities of the 39 NDC areas: • seventeen have theft rates lower than their surrounding local area (Figure 8.3)
• eleven have lower burglary rates (Figure 8.2)
• eight lower violence rates (Figure 8.1)
• three lower criminal damage rates (Figure 8.4).
Figure 8.1: NDC violence rate relative to local authority, 2002/3
0 100 200 300 400 500 600 700 800
SouthwarkIslingtonLambeth
Birmingham KNNorwich
LeicesterHull
Walsall Tower HamletsH'smith&Fulham
HackneyNewham
Middlesbrough Southampton
Luton Birmingham A
BrightonOldham
ManchesterHaringeyLiverpool
LewishamCoventry
Salford Wolverhampton
KnowsleyDerby
RochdaleBristol
NottinghamSheffieldSandwell
NewcastleBrent
PlymouthBradford
HartlepoolSunderlandDoncaster
Relative violence rate
Source: Police recorded crime data, SDRC Some consistent patterns emerge. Doncaster has high relative crime rates for violence, theft and criminal damage. This rises to over seven times the rate in the local authority for violence and almost five times the local authority rate for theft. Sunderland also has consistently high relative crime rates across all four measures. At the other end of the spectrum, Southwark NDC consistently reveals crime rates which are about half that for the parent local authority. Although the ordering of NDC

New Deal for Communities: The National Evaluation 37 Fear of Crime in NDC Areas
areas on each chart is not identical, there do tend to be marked patterns. For instance London NDCs tend to show lower relative crime rates than do many other NDC areas. Figure 8.2: NDC burglary rate relative to local authority, 2002/3
0 50 100 150 200 250 300
SouthwarkSouthampton
Birmingham KNHackneyIslingtonNewhamNorwich
KnowsleyH'smith&Fulham
SalfordBirmingham A
HullCoventry
WalsallTower Hamlets
HaringeyBradford
BrentNottingham
BrightonMiddlesbrough
RochdaleManchester
LeicesterBristol
LambethSheffield
NewcastleSandwell
WolverhamptonDoncasterPlymouth
LutonLiverpool
LewishamHartlepool
DerbyOldham
Sunderland
Relative burglary rate
Source: Police recorded crime data, SDRC
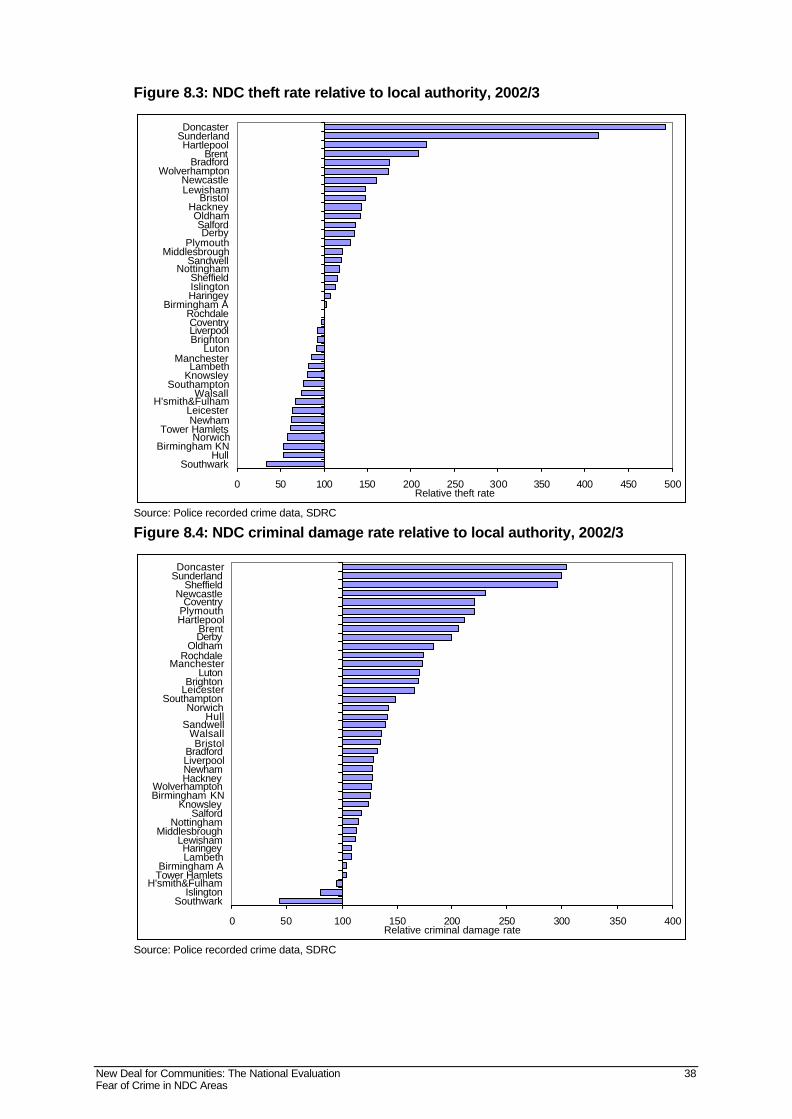
New Deal for Communities: The National Evaluation 38 Fear of Crime in NDC Areas
Figure 8.3: NDC theft rate relative to local authority, 2002/3
0 50 100 150 200 250 300 350 400 450 500
SouthwarkHull
Birmingham KNNorwich
Tower HamletsNewham
LeicesterH'smith&Fulham
Walsall Southampton
KnowsleyLambeth
ManchesterLuton
BrightonLiverpoolCoventry
Rochdale Birmingham A
HaringeyIslingtonSheffield
NottinghamSandwell
MiddlesbroughPlymouth
DerbySalford
OldhamHackney
BristolLewishamNewcastle
WolverhamptonBradford
BrentHartlepool
SunderlandDoncaster
Relative theft rate
Source: Police recorded crime data, SDRC
Figure 8.4: NDC criminal damage rate relative to local authority, 2002/3
0 50 100 150 200 250 300 350 400
SouthwarkIslington
H'smith&FulhamTower HamletsBirmingham A
LambethHaringey
LewishamMiddlesbrough
NottinghamSalford
KnowsleyBirmingham KNWolverhampton
HackneyNewhamLiverpoolBradford
BristolWalsall
SandwellHull
NorwichSouthampton
LeicesterBrighton
LutonManchester
RochdaleOldham
DerbyBrent
HartlepoolPlymouthCoventry
NewcastleSheffield
SunderlandDoncaster
Relative criminal damage rate
Source: Police recorded crime data, SDRC

New Deal for Communities: The National Evaluation 39 Fear of Crime in NDC Areas
In order to combine information on all four crime measures, in terms of both absolute and relative rates, a Principal Component Analyses was carried out. This multivariate technique combines a number of variables into a smaller number of indices which each measure a different dimension in the data. This analysis resulted in two indices or principal components. The first index combines the four crime rates into a single component which explained 65 per cent of the total variance in the data. The second combines the four relative crime rates and explained 74 per cent of the total variance in data. Both indices have a mean of zero and a variance of one. The distributions of the two indices are shown in Figures 8.5 and 8.6. A positive score indicates an above average crime rate or relative crime rate and a negative score indicates that the rate for that area is below average. These charts confirm the patterns emerging from Figures 8.1 to 8.4. Doncaster and Sunderland have by far the highest scores on both indices and there tends to be a concentration of NDCs located in older, northern, industrial towns towards the top end of the distribution. London NDCs tend to have lower than average scores on both indices and make up five of the lowest six Partnerships on the relative crime index. Brent is the only London NDC to be above average on both scores. Figure 8.5: Crime index for NDC Partnerships, 2002/3
-2 -1 0 1 2 3 4
SouthwarkWalsall
Birmingham KNSouthampton
KnowsleyBrighton
H'smith & FulhamNewham
Birmingham ANorwich
LambethTower Hamlets
LutonLewisham
IslingtonLeicesterHaringeyCoventrySandwellHackneySheffield
HullBrent
LiverpoolWolverhampton
SalfordRochdalePlymouth
MiddlesbroughNewcastle
DerbyOldham
BristolBradford
HartlepoolManchesterNottinghamSunderlandDoncaster
Source: Police recorded crime data, SDRC

New Deal for Communities: The National Evaluation 40 Fear of Crime in NDC Areas
Figure 8.6: Relative crime index for NDC Partnerships, 2002/3
-2 -1 0 1 2 3 4
Southwark IslingtonBirmingham KN
H'smith&FulhamTower Hamlets
NewhamNorwich
HullSouthampton
Birmingham ALambeth
WalsallKnowsleyHackney
Haringey Middlesbrough
LeicesterSalford
NottinghamBrighton
ManchesterRochdale
BristolLiverpoolSandwellCoventry
LutonLewisham
WolverhamptonBradford
BrentDerby
NewcastleOldham
SheffieldPlymouth
HartlepoolSunderland
Doncaster
Source: Police recorded crime data, SDRC
8.3. Area level crime rates and other measures
Earlier sections of this paper have explored a number of relationships between individual level data on experience and fear of crime and other factors such as health, social capital and trust in the local police. This section explores relationships between recorded crime and three other sets of area level secondary data relating to worklessness, staying on at school rates and health. Crime and worklessness Table 8.1 shows the correlation between recorded crime rates and rates of worklessness,4 both in terms of absolute rates and relative to the parent local authority. All correlations which show a significant relationship at the 0.05 level are highlighted in bold. Correlations of over 0.5 are also underlined as being of particular interest.
4 Worklessness: The proportion of working age adults in the area who are receiving one of the following benefits – Jobseekers Allowance, Incapacity Benefit, Severe Disablement Allowance, New Deal, New Deal for Lone Parents.
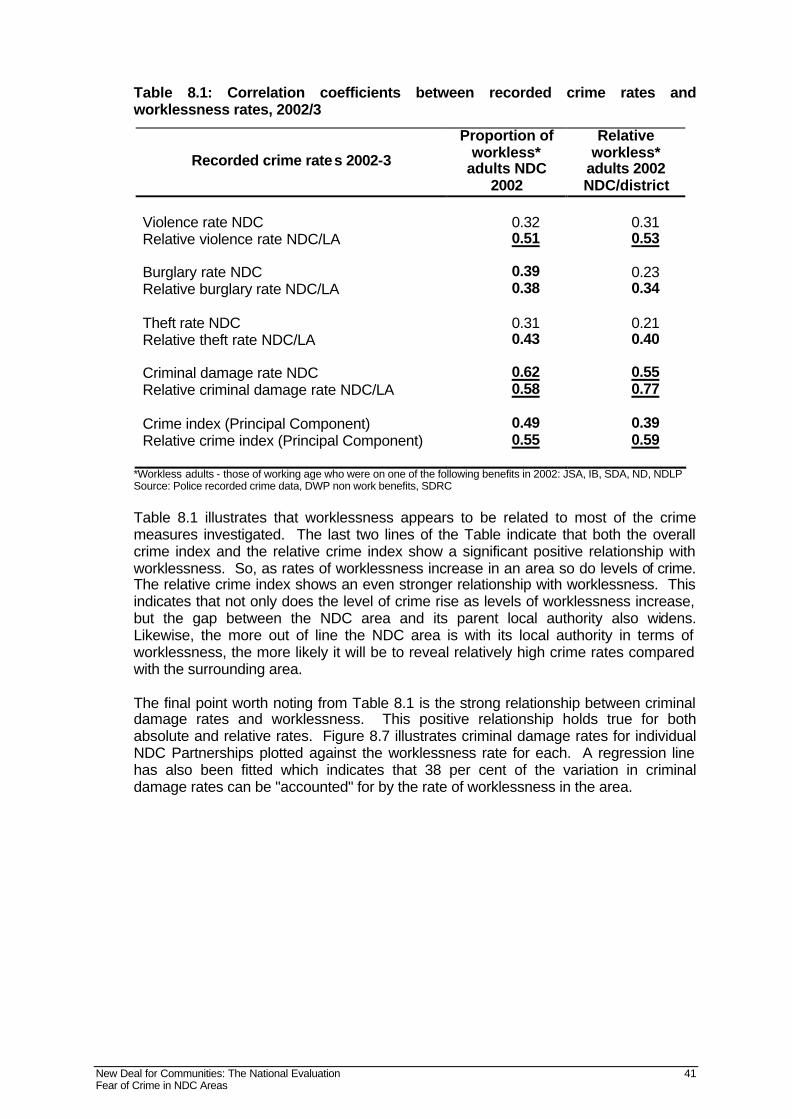
New Deal for Communities: The National Evaluation 41 Fear of Crime in NDC Areas
Table 8.1: Correlation coefficients between recorded crime rates and worklessness rates, 2002/3
Recorded crime rates 2002-3
Proportion of workless*
adults NDC 2002
Relative workless*
adults 2002 NDC/district
Violence rate NDC 0.32 0.31 Relative violence rate NDC/LA 0.51 0.53 Burglary rate NDC 0.39 0.23 Relative burglary rate NDC/LA 0.38 0.34 Theft rate NDC 0.31 0.21 Relative theft rate NDC/LA 0.43 0.40 Criminal damage rate NDC 0.62 0.55 Relative criminal damage rate NDC/LA 0.58 0.77 Crime index (Principal Component) 0.49 0.39 Relative crime index (Principal Component) 0.55 0.59
*Workless adults - those of working age who were on one of the following benefits in 2002: JSA, IB, SDA, ND, NDLP Source: Police recorded crime data, DWP non work benefits, SDRC Table 8.1 illustrates that worklessness appears to be related to most of the crime measures investigated. The last two lines of the Table indicate that both the overall crime index and the relative crime index show a significant positive relationship with worklessness. So, as rates of worklessness increase in an area so do levels of crime. The relative crime index shows an even stronger relationship with worklessness. This indicates that not only does the level of crime rise as levels of worklessness increase, but the gap between the NDC area and its parent local authority also widens. Likewise, the more out of line the NDC area is with its local authority in terms of worklessness, the more likely it will be to reveal relatively high crime rates compared with the surrounding area. The final point worth noting from Table 8.1 is the strong relationship between criminal damage rates and worklessness. This positive relationship holds true for both absolute and relative rates. Figure 8.7 illustrates criminal damage rates for individual NDC Partnerships plotted against the worklessness rate for each. A regression line has also been fitted which indicates that 38 per cent of the variation in criminal damage rates can be "accounted" for by the rate of worklessness in the area.

New Deal for Communities: The National Evaluation 42 Fear of Crime in NDC Areas
Figure 8.7: Worklessness rates versus criminal damage rates in NDC areas 2002/3
Criminal damage rate 2002-3
1086420
Per
cent
age
wor
kles
s in
200
2
40
30
20
10 Rsq = 0.3820
Crime and staying on at school rates When rates of pupils staying on in post 16 education are considered, this shows a strong negative correlation with criminal damage rates (-0.56). This relationship is presented in Figure 8.8. The R2 for the regression line fitted indicates that 31 per cent of the variation in criminal damage rates is 'accounted' for by the staying on rates in post compulsory education. Staying on rates are also significantly negatively correlated with the relative criminal damage rate (-0.34). Therefore the lower the rate of pupils staying on in post 16 education the higher the rates of criminal damage in the area and the wider the gap between the NDC area and its parent authority. This was the only type of crime which showed any significant relationship with staying on rates at school.
Sunderland
Manchester
Hartlepool
Newcastle
Knowsley
Liver
Southampton
Southwark
Norwich
Fulham
Doncaster
Birmingham A
Lambeth
Tower Hamlet
Birmingham KN
Sheffield
Coventry
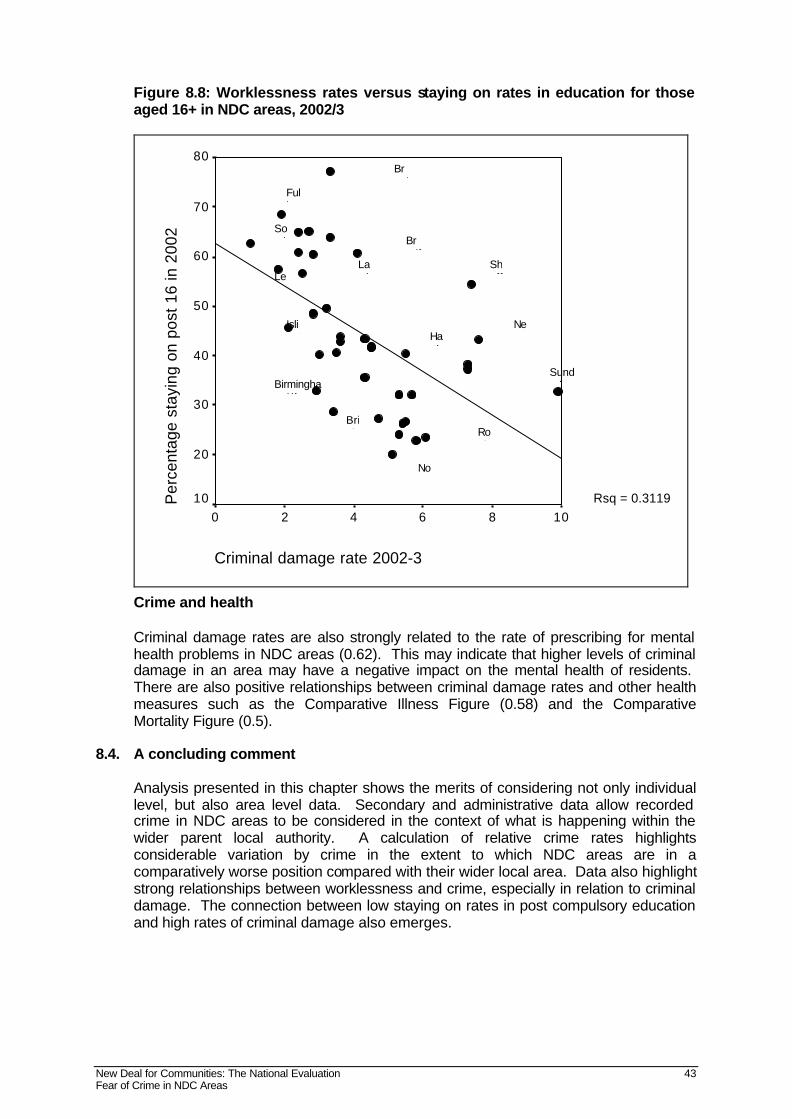
New Deal for Communities: The National Evaluation 43 Fear of Crime in NDC Areas
Figure 8.8: Worklessness rates versus staying on rates in education for those aged 16+ in NDC areas, 2002/3
Criminal damage rate 2002-3
1086420
Per
cent
age
stay
ing
on p
ost 1
6 in
200
280
70
60
50
40
30
20
10 Rsq = 0.3119
Crime and health Criminal damage rates are also strongly related to the rate of prescribing for mental health problems in NDC areas (0.62). This may indicate that higher levels of criminal damage in an area may have a negative impact on the mental health of residents. There are also positive relationships between criminal damage rates and other health measures such as the Comparative Illness Figure (0.58) and the Comparative Mortality Figure (0.5).
8.4. A concluding comment
Analysis presented in this chapter shows the merits of considering not only individual level, but also area level data. Secondary and administrative data allow recorded crime in NDC areas to be considered in the context of what is happening within the wider parent local authority. A calculation of relative crime rates highlights considerable variation by crime in the extent to which NDC areas are in a comparatively worse position compared with their wider local area. Data also highlight strong relationships between worklessness and crime, especially in relation to criminal damage. The connection between low staying on rates in post compulsory education and high rates of criminal damage also emerges.
Brent
Bradf
Newc
Sheffi
Fulha
Sunderlan
Bright
Norwi
Islingt
Birmingham KN
Roch
South
Hartle
Lewi
Lamb
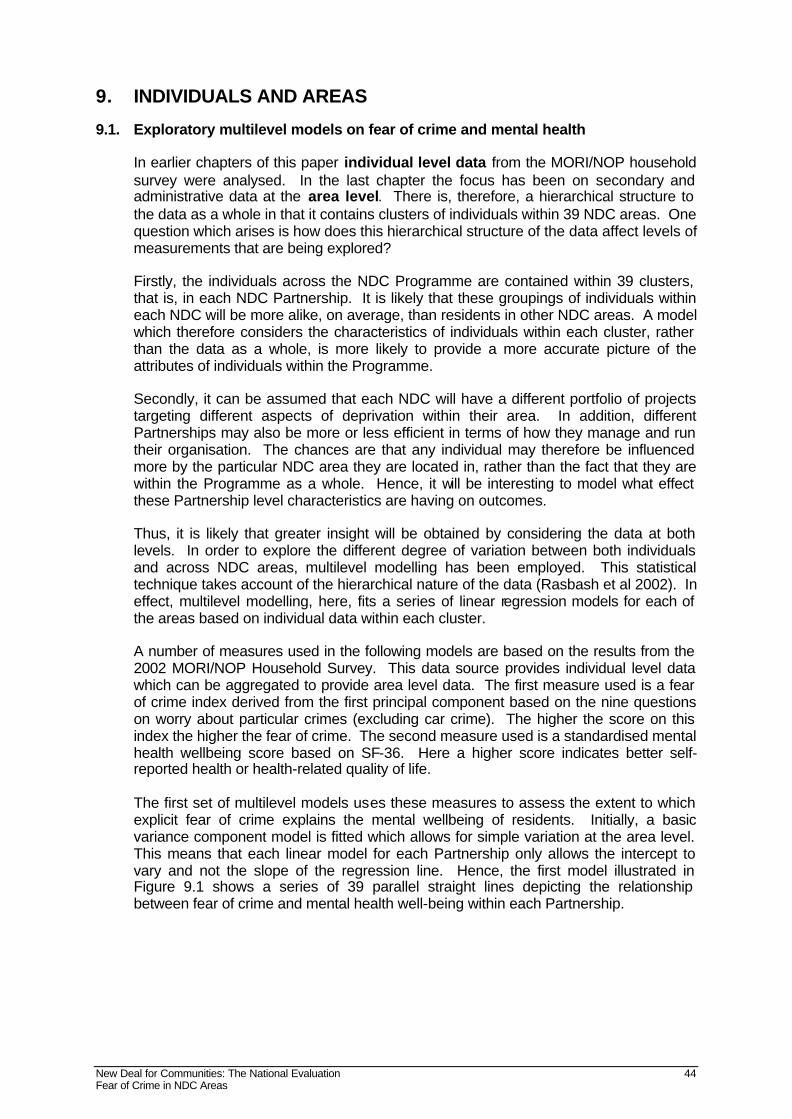
New Deal for Communities: The National Evaluation 44 Fear of Crime in NDC Areas
9. INDIVIDUALS AND AREAS
9.1. Exploratory multilevel models on fear of crime and mental health
In earlier chapters of this paper individual level data from the MORI/NOP household survey were analysed. In the last chapter the focus has been on secondary and administrative data at the area level. There is, therefore, a hierarchical structure to the data as a whole in that it contains clusters of individuals within 39 NDC areas. One question which arises is how does this hierarchical structure of the data affect levels of measurements that are being explored? Firstly, the individuals across the NDC Programme are contained within 39 clusters, that is, in each NDC Partnership. It is likely that these groupings of individuals within each NDC will be more alike, on average, than residents in other NDC areas. A model which therefore considers the characteristics of individuals within each cluster, rather than the data as a whole, is more likely to provide a more accurate picture of the attributes of individuals within the Programme. Secondly, it can be assumed that each NDC will have a different portfolio of projects targeting different aspects of deprivation within their area. In addition, different Partnerships may also be more or less efficient in terms of how they manage and run their organisation. The chances are that any individual may therefore be influenced more by the particular NDC area they are located in, rather than the fact that they are within the Programme as a whole. Hence, it will be interesting to model what effect these Partnership level characteristics are having on outcomes. Thus, it is likely that greater insight will be obtained by considering the data at both levels. In order to explore the different degree of variation between both individuals and across NDC areas, multilevel modelling has been employed. This statistical technique takes account of the hierarchical nature of the data (Rasbash et al 2002). In effect, multilevel modelling, here, fits a series of linear regression models for each of the areas based on individual data within each cluster. A number of measures used in the following models are based on the results from the 2002 MORI/NOP Household Survey. This data source provides individual level data which can be aggregated to provide area level data. The first measure used is a fear of crime index derived from the first principal component based on the nine questions on worry about particular crimes (excluding car crime). The higher the score on this index the higher the fear of crime. The second measure used is a standardised mental health wellbeing score based on SF-36. Here a higher score indicates better self-reported health or health-related quality of life. The first set of multilevel models uses these measures to assess the extent to which explicit fear of crime explains the mental wellbeing of residents. Initially, a basic variance component model is fitted which allows for simple variation at the area level. This means that each linear model for each Partnership only allows the intercept to vary and not the slope of the regression line. Hence, the first model illustrated in Figure 9.1 shows a series of 39 parallel straight lines depicting the relationship between fear of crime and mental health well-being within each Partnership.
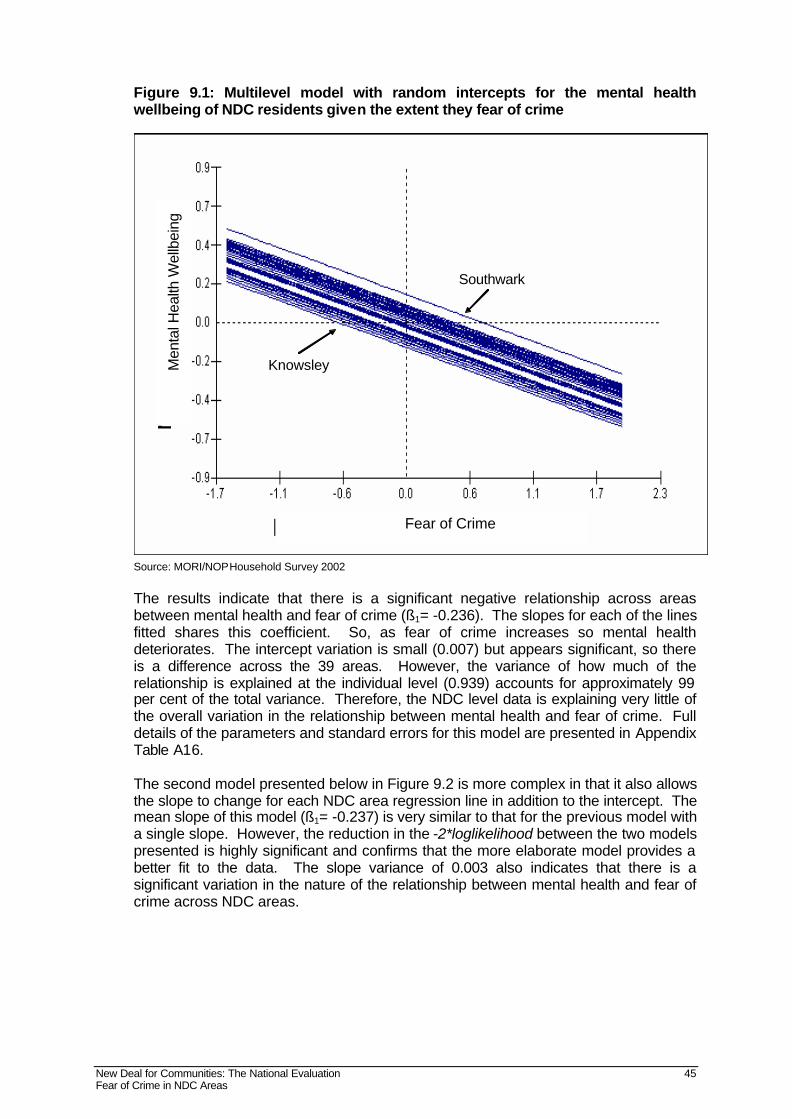
New Deal for Communities: The National Evaluation 45 Fear of Crime in NDC Areas
Knowsley
Southwark
Figure 9.1: Multilevel model with random intercepts for the mental health wellbeing of NDC residents given the extent they fear of crime
Source: MORI/NOP Household Survey 2002 The results indicate that there is a significant negative relationship across areas between mental health and fear of crime (ß1= -0.236). The slopes for each of the lines fitted shares this coefficient. So, as fear of crime increases so mental health deteriorates. The intercept variation is small (0.007) but appears significant, so there is a difference across the 39 areas. However, the variance of how much of the relationship is explained at the individual level (0.939) accounts for approximately 99 per cent of the total variance. Therefore, the NDC level data is explaining very little of the overall variation in the relationship between mental health and fear of crime. Full details of the parameters and standard errors for this model are presented in Appendix Table A16. The second model presented below in Figure 9.2 is more complex in that it also allows the slope to change for each NDC area regression line in addition to the intercept. The mean slope of this model (ß1= -0.237) is very similar to that for the previous model with a single slope. However, the reduction in the -2*loglikelihood between the two models presented is highly significant and confirms that the more elaborate model provides a better fit to the data. The slope variance of 0.003 also indicates that there is a significant variation in the nature of the relationship between mental health and fear of crime across NDC areas.
Fear of Crime
Men
tal H
ealth
Wel
lbei
ng
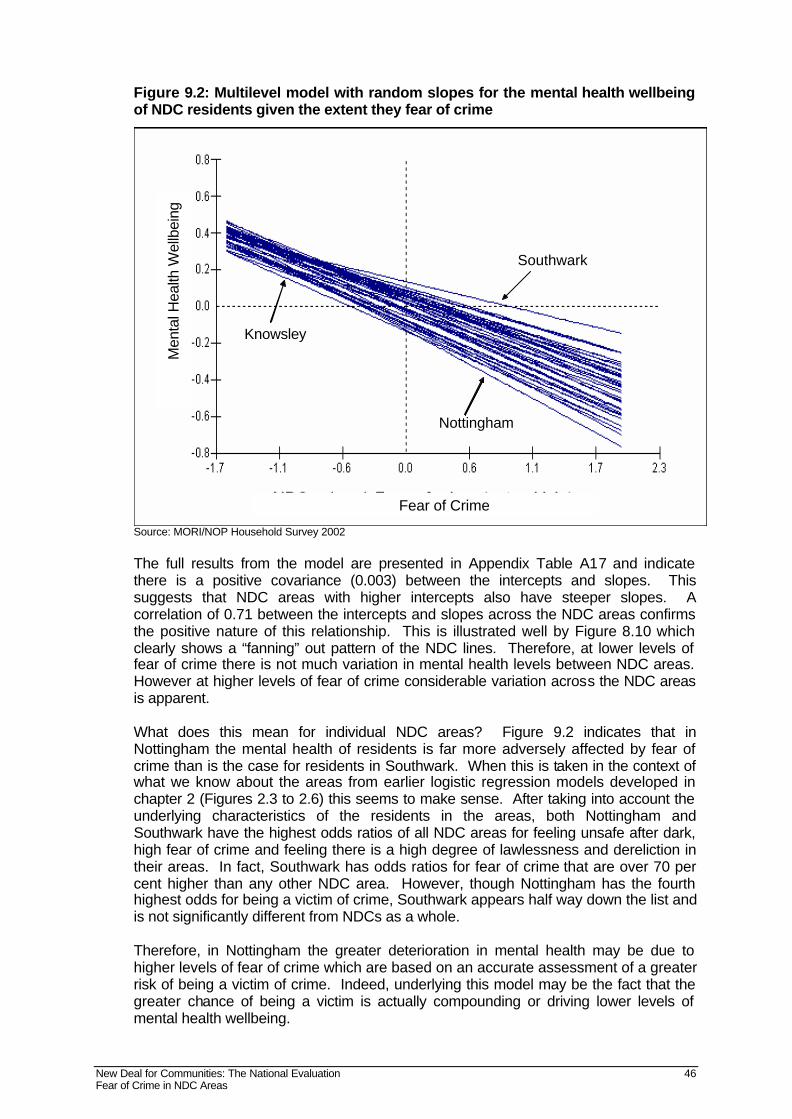
New Deal for Communities: The National Evaluation 46 Fear of Crime in NDC Areas
Figure 9.2: Multilevel model with random slopes for the mental health wellbeing of NDC residents given the extent they fear of crime
Southwark
Knowsley
Nottingham
Source: MORI/NOP Household Survey 2002 The full results from the model are presented in Appendix Table A17 and indicate there is a positive covariance (0.003) between the intercepts and slopes. This suggests that NDC areas with higher intercepts also have steeper slopes. A correlation of 0.71 between the intercepts and slopes across the NDC areas confirms the positive nature of this relationship. This is illustrated well by Figure 8.10 which clearly shows a “fanning” out pattern of the NDC lines. Therefore, at lower levels of fear of crime there is not much variation in mental health levels between NDC areas. However at higher levels of fear of crime considerable variation across the NDC areas is apparent. What does this mean for individual NDC areas? Figure 9.2 indicates that in Nottingham the mental health of residents is far more adversely affected by fear of crime than is the case for residents in Southwark. When this is taken in the context of what we know about the areas from earlier logistic regression models developed in chapter 2 (Figures 2.3 to 2.6) this seems to make sense. After taking into account the underlying characteristics of the residents in the areas, both Nottingham and Southwark have the highest odds ratios of all NDC areas for feeling unsafe after dark, high fear of crime and feeling there is a high degree of lawlessness and dereliction in their areas. In fact, Southwark has odds ratios for fear of crime that are over 70 per cent higher than any other NDC area. However, though Nottingham has the fourth highest odds for being a victim of crime, Southwark appears half way down the list and is not significantly different from NDCs as a whole. Therefore, in Nottingham the greater deterioration in mental health may be due to higher levels of fear of crime which are based on an accurate assessment of a greater risk of being a victim of crime. Indeed, underlying this model may be the fact that the greater chance of being a victim is actually compounding or driving lower levels of mental health wellbeing.
Fear of Crime
Men
tal H
ealth
Wel
lbei
ng
New Deal for Communities: The National Evaluation 47 Fear of Crime in NDC Areas
In contrast, residents in Southwark appear to have an exaggerated fear of crime which does not at face value seem to be grounded in their actual risk of being a victim of crime. The MORI/NOP Household Survey indicates that the risk of a Southwark NDC residents being a victim of any crime is on par with the NDC average. The crime specific rates of recorded crime (SDRC 2004) show that for all four crimes examined Southwark NDC has rates below that of the bottom ranked ward in the district. However, with regard to theft, the recorded crime rate is more than 10 percentage points lower than the self-reported measure from the MORI/NOP Household Survey. Indeed, the survey data gives Southwark the joint highest rate of theft in all NDC areas, perhaps indicating a serious degree of under reporting to the police for this measure. It is possible, therefore, that there are specific issues associated with the particular crime of theft. It can be associated with threats of violence which may make residents feel particularly vulnerable when moving about the area and which hence boosts fear of all crime for residents. Ultimately, this may make respondents feel more at risk from all crime than they actually are. Therefore, the reason Southwark NDC residents’ fear of crime may not translate into poorer mental health may be that it is the actual risk of being a victim of crime, rather than fear of crime, which has more influence on generating poor mental health. Finally, the variances at the area level and individual level given in the output for the multilevel model shown in Appendix Table A17 once again indicate that the overwhelming majority of the relationship is explained by the individual level data.
9.2. A concluding comment
The use of multilevel modelling illustrates that in some instances a Partnership level effect can be identified. The same situation in respect of one aspect of the lives of individuals within an NDC area can therefore lead to different outcomes in different Partnerships.
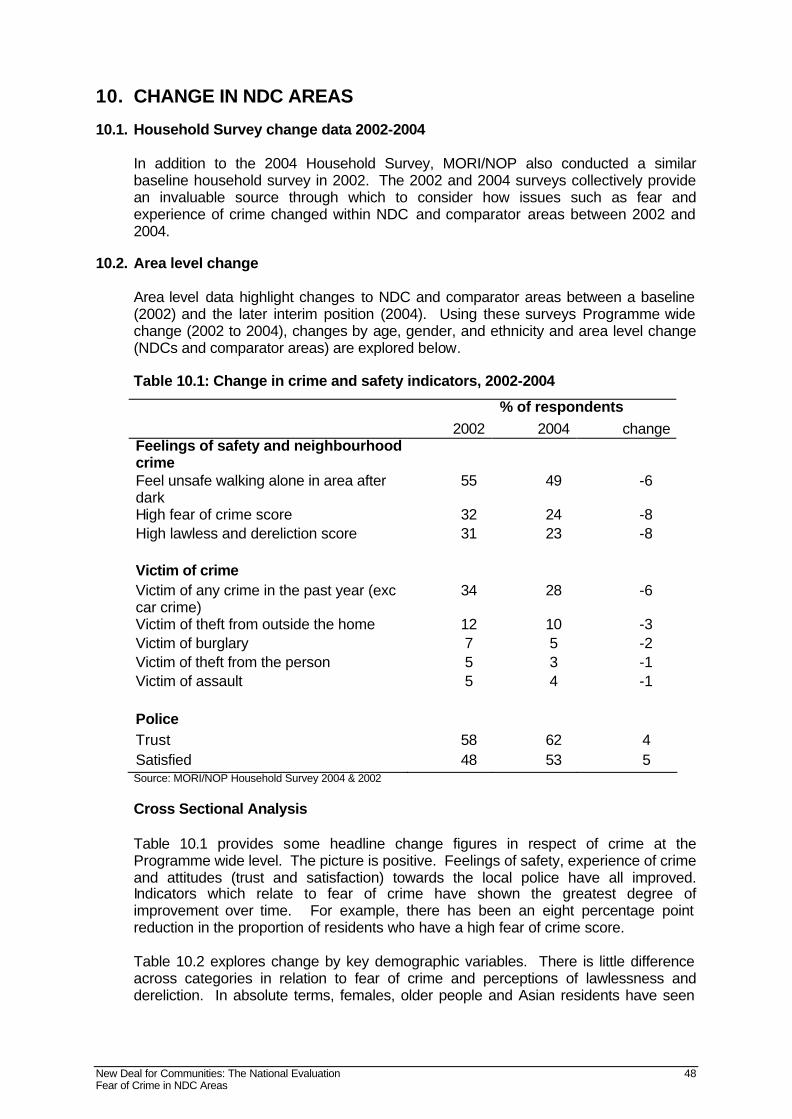
New Deal for Communities: The National Evaluation 48 Fear of Crime in NDC Areas
10. CHANGE IN NDC AREAS
10.1. Household Survey change data 2002-2004
In addition to the 2004 Household Survey, MORI/NOP also conducted a similar baseline household survey in 2002. The 2002 and 2004 surveys collectively provide an invaluable source through which to consider how issues such as fear and experience of crime changed within NDC and comparator areas between 2002 and 2004.
10.2. Area level change
Area level data highlight changes to NDC and comparator areas between a baseline (2002) and the later interim position (2004). Using these surveys Programme wide change (2002 to 2004), changes by age, gender, and ethnicity and area level change (NDCs and comparator areas) are explored below. Table 10.1: Change in crime and safety indicators, 2002-2004
% of respondents 2002 2004 change
Feelings of safety and neighbourhood crime
Feel unsafe walking alone in area after dark
55 49 -6
High fear of crime score 32 24 -8 High lawless and dereliction score 31 23 -8 Victim of crime Victim of any crime in the past year (exc car crime)
34 28 -6
Victim of theft from outside the home 12 10 -3 Victim of burglary 7 5 -2 Victim of theft from the person 5 3 -1 Victim of assault 5 4 -1 Police Trust 58 62 4 Satisfied 48 53 5 Source: MORI/NOP Household Survey 2004 & 2002 Cross Sectional Analysis Table 10.1 provides some headline change figures in respect of crime at the Programme wide level. The picture is positive. Feelings of safety, experience of crime and attitudes (trust and satisfaction) towards the local police have all improved. Indicators which relate to fear of crime have shown the greatest degree of improvement over time. For example, there has been an eight percentage point reduction in the proportion of residents who have a high fear of crime score. Table 10.2 explores change by key demographic variables. There is little difference across categories in relation to fear of crime and perceptions of lawlessness and dereliction. In absolute terms, females, older people and Asian residents have seen
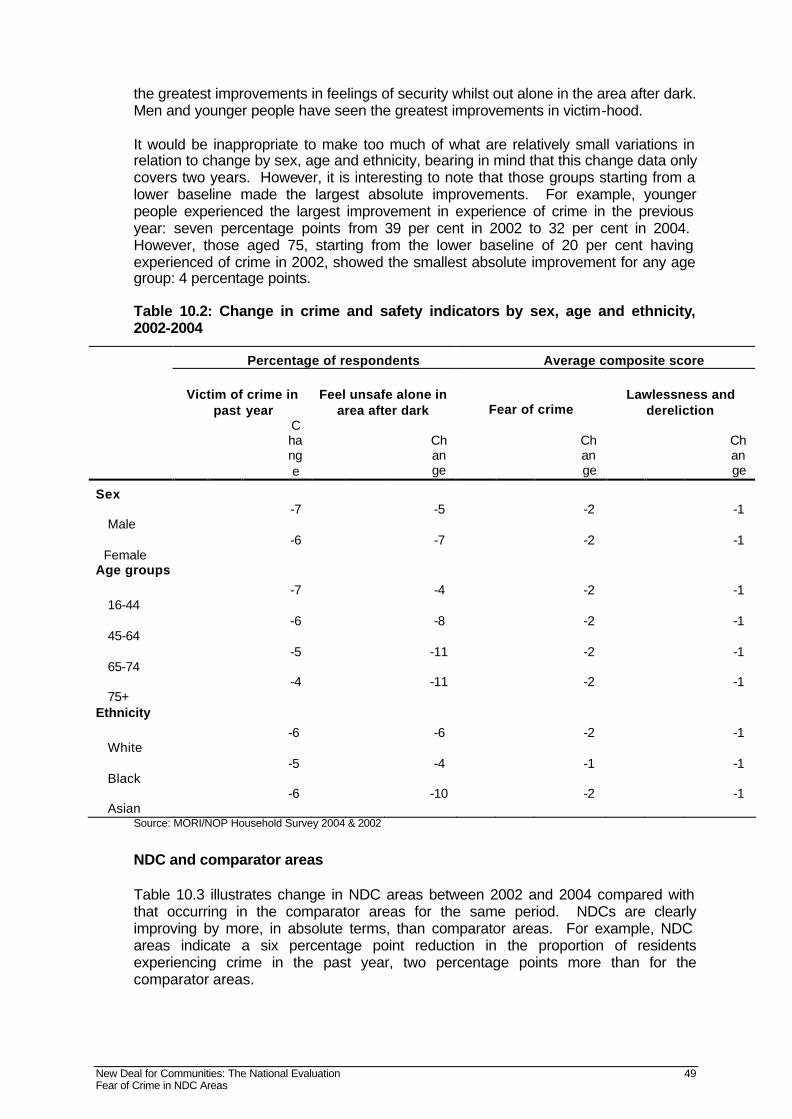
New Deal for Communities: The National Evaluation 49 Fear of Crime in NDC Areas
the greatest improvements in feelings of security whilst out alone in the area after dark. Men and younger people have seen the greatest improvements in victim-hood. It would be inappropriate to make too much of what are relatively small variations in relation to change by sex, age and ethnicity, bearing in mind that this change data only covers two years. However, it is interesting to note that those groups starting from a lower baseline made the largest absolute improvements. For example, younger people experienced the largest improvement in experience of crime in the previous year: seven percentage points from 39 per cent in 2002 to 32 per cent in 2004. However, those aged 75, starting from the lower baseline of 20 per cent having experienced of crime in 2002, showed the smallest absolute improvement for any age group: 4 percentage points. Table 10.2: Change in crime and safety indicators by sex, age and ethnicity, 2002-2004
Percentage of respondents Average composite score
Victim of crime in
past year Feel unsafe alone in
area after dark Fear of crime Lawlessness and
dereliction
Change
Change
Change
Change
Sex
Male -7 -5 -2 -1
Female -6 -7 -2 -1
Age groups
16-44 -7 -4 -2 -1
45-64 -6 -8 -2 -1
65-74 -5 -11 -2 -1
75+ -4 -11 -2 -1
Ethnicity
White -6 -6 -2 -1
Black -5 -4 -1 -1
Asian -6 -10 -2 -1
Source: MORI/NOP Household Survey 2004 & 2002
NDC and comparator areas Table 10.3 illustrates change in NDC areas between 2002 and 2004 compared with that occurring in the comparator areas for the same period. NDCs are clearly improving by more, in absolute terms, than comparator areas. For example, NDC areas indicate a six percentage point reduction in the proportion of residents experiencing crime in the past year, two percentage points more than for the comparator areas.

New Deal for Communities: The National Evaluation 50 Fear of Crime in NDC Areas
Table 10.3: Change in NDC and comparator areas 2002 to 2004
NDC Change 2002 to
2004
Comparator change 2002 to
2004
Difference in change 2002
to 2004 Feelings of safety and neighbourhood crime
Feel unsafe walking alone in area after dark
-6 -4
-2
High fear of crime score -8 -8 0 High lawless and dereliction score
-8 -2 -6
Victim of crime Victim of crime in last past year (ex car crime)
-6 -4 -2
Victim of theft from outside the home
-3 -2
-1
Victim of burglary -2 -1 -1 Victim of theft from the person -1 -1 -1 Victim of assault -1 0 -1 Police Trust 4 1 2 Satisfied 5 1 3
Source: MORI/NOP Household Survey 2004 & 2002
10.3. Changes to people in areas: Longitudinal data
Most of the analysis in this is paper is cross-sectional: areas are compared at different periods of time. However, in 2005 individual level change data from the household surveys became available. Some 10,638 people in NDC areas, and 1,010 in the comparator areas, who had completed questionnaires in 2002 were re-interviewed in 2004. These two 'panels' are exceptionally important in highlighting relationships between interventions and outcomes because: • those constituting the NDC panel remained in the area for the 2002 to 2004
period, and are thus most likely to have benefited from Partnership supported interventions
• it is possible to tease out what happens to individuals through time.
In subsequent phases of the evaluation this data source is likely to play a major role in isolating longer term relationships between NDC interventions, on the one hand, and individual level outcomes, on the other. At this stage however, it is only possible to identify some key differences between what happened for those in NDC areas between 2002 and 2004 when compared with those living in the comparator areas (Table 10.4). In practice, the percentage point differences are not dissimilar to the cross-sectional differences (see Table 10.3). The notable exception to this is the change in proportion of residents indicating a high fear of crime score; for NDC areas this figure improved by 10 percentage points, four percentage points more than for those living in the comparator areas (6 percentage point improvement).
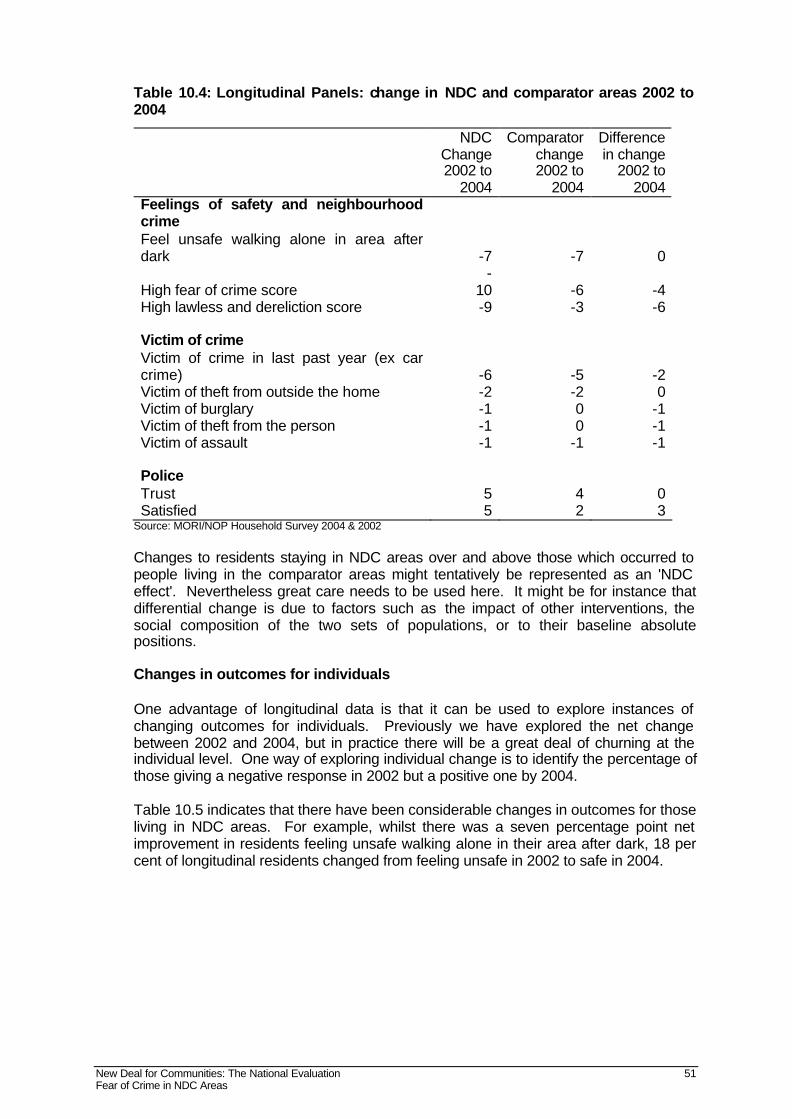
New Deal for Communities: The National Evaluation 51 Fear of Crime in NDC Areas
Table 10.4: Longitudinal Panels: change in NDC and comparator areas 2002 to 2004
NDC Change 2002 to
2004
Comparator change 2002 to
2004
Difference in change
2002 to 2004
Feelings of safety and neighbourhood crime Feel unsafe walking alone in area after dark -7 -7 0
High fear of crime score -
10 -6 -4 High lawless and dereliction score -9 -3 -6 Victim of crime Victim of crime in last past year (ex car crime) -6 -5 -2 Victim of theft from outside the home -2 -2 0 Victim of burglary -1 0 -1 Victim of theft from the person -1 0 -1 Victim of assault -1 -1 -1 Police Trust 5 4 0 Satisfied 5 2 3
Source: MORI/NOP Household Survey 2004 & 2002 Changes to residents staying in NDC areas over and above those which occurred to people living in the comparator areas might tentatively be represented as an 'NDC effect'. Nevertheless great care needs to be used here. It might be for instance that differential change is due to factors such as the impact of other interventions, the social composition of the two sets of populations, or to their baseline absolute positions. Changes in outcomes for individuals One advantage of longitudinal data is that it can be used to explore instances of changing outcomes for individuals. Previously we have explored the net change between 2002 and 2004, but in practice there will be a great deal of churning at the individual level. One way of exploring individual change is to identify the percentage of those giving a negative response in 2002 but a positive one by 2004. Table 10.5 indicates that there have been considerable changes in outcomes for those living in NDC areas. For example, whilst there was a seven percentage point net improvement in residents feeling unsafe walking alone in their area after dark, 18 per cent of longitudinal residents changed from feeling unsafe in 2002 to safe in 2004.
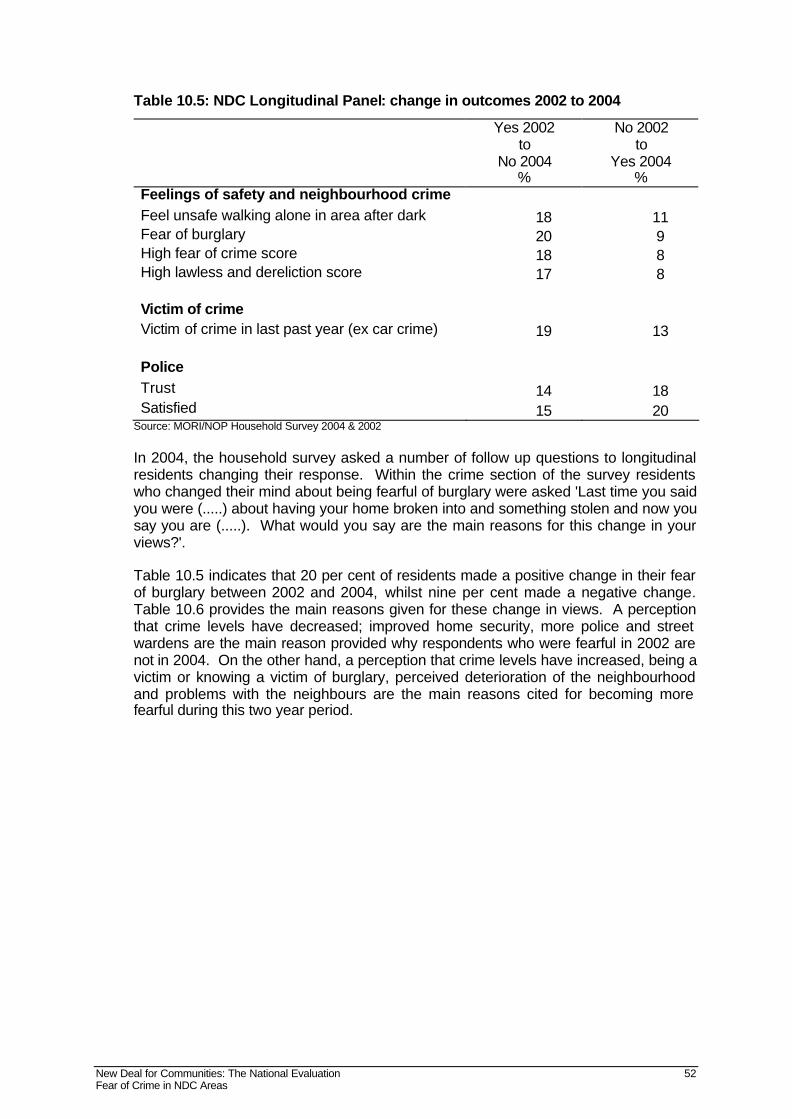
New Deal for Communities: The National Evaluation 52 Fear of Crime in NDC Areas
Table 10.5: NDC Longitudinal Panel: change in outcomes 2002 to 2004
Yes 2002 to
No 2004 %
No 2002 to
Yes 2004 %
Feelings of safety and neighbourhood crime Feel unsafe walking alone in area after dark 18 11 Fear of burglary 20 9 High fear of crime score 18 8 High lawless and dereliction score 17 8 Victim of crime Victim of crime in last past year (ex car crime) 19 13 Police Trust 14 18 Satisfied 15 20
Source: MORI/NOP Household Survey 2004 & 2002
In 2004, the household survey asked a number of follow up questions to longitudinal residents changing their response. Within the crime section of the survey residents who changed their mind about being fearful of burglary were asked 'Last time you said you were (.....) about having your home broken into and something stolen and now you say you are (.....). What would you say are the main reasons for this change in your views?'. Table 10.5 indicates that 20 per cent of residents made a positive change in their fear of burglary between 2002 and 2004, whilst nine per cent made a negative change. Table 10.6 provides the main reasons given for these change in views. A perception that crime levels have decreased; improved home security, more police and street wardens are the main reason provided why respondents who were fearful in 2002 are not in 2004. On the other hand, a perception that crime levels have increased, being a victim or knowing a victim of burglary, perceived deterioration of the neighbourhood and problems with the neighbours are the main reasons cited for becoming more fearful during this two year period.

New Deal for Communities: The National Evaluation 53 Fear of Crime in NDC Areas
Table 10.6: Longitudinal Panels: Explanations for change in fear of burglary 2002 to 2004
% respondents Yes 2002 and No 2004
% respondents No 2002 and Yes 2004
Crime decreased 20
Crime increased
Security windows/doors 18
Victim or know victim
New locks 16
Other
Other 16
Lots of burglaries in area
Burglar alarm 13
People hanging around
More police 11
Area worse generally Security in garden 11 Problems with neighbours Street wardens 8 Home less secure
Source: MORI/NOP Household Survey 2004 & 2002
10.4. Secondary and administrative change data 2000/1 to 2002/3
Police recorded crime data has been collected for the period 1st April to 2000 to 31st March 2003. Although crime rates were constructed for all four composite indicators (violence, burglary, theft and criminal damage) and for all three years, it is difficult to compare change in crime rates directly across these time periods because of revisions to police recording practices which took effect from 1st April 2002 (although most forces underwent a staggered transition to the new practice over preceding year(s))5. This unfortunately means that some changes to crime rates over the time period may be due to the changes in recording practice. However, it is still possible to utilise these crime data to examine change over time by setting the change observed in NDC areas in the context of change observed in neighbouring localities. By making the assumption that the transition to the new recording practice affected wards in a parent local authority at the same time and to the same extent as the NDC area, it is possible to compare the trajectories of NDC area with the trajectories of wards. A further form of analysis is to examine whether the composition of crime changed between 2000-01 and 2002-03 in NDC areas relative to their parent local authorities. Crime composition is defined as the proportional representation of the four composite indicators in the total crime count for the area. For example, did NDC areas with a crime mix substantially different to the local authority crime mix ‘converge’ towards the local authority composition over the period of analysis? Crime rates in NDC areas 2000-01 Figure 10.1 illustrates NDC Programme wide crime rates for the four composite indicators in relation to the distribution of ward level rates in the parent local authorities. NDC Programme wide crime rates are represented by the blue/green columns. Burglary is considered separately to violence, theft and criminal damage as it is based on a difference denominator and therefore is not directly comparable with other crime types. The thick black vertical lines represent the range of ward level
5 National Crime Recording Standard
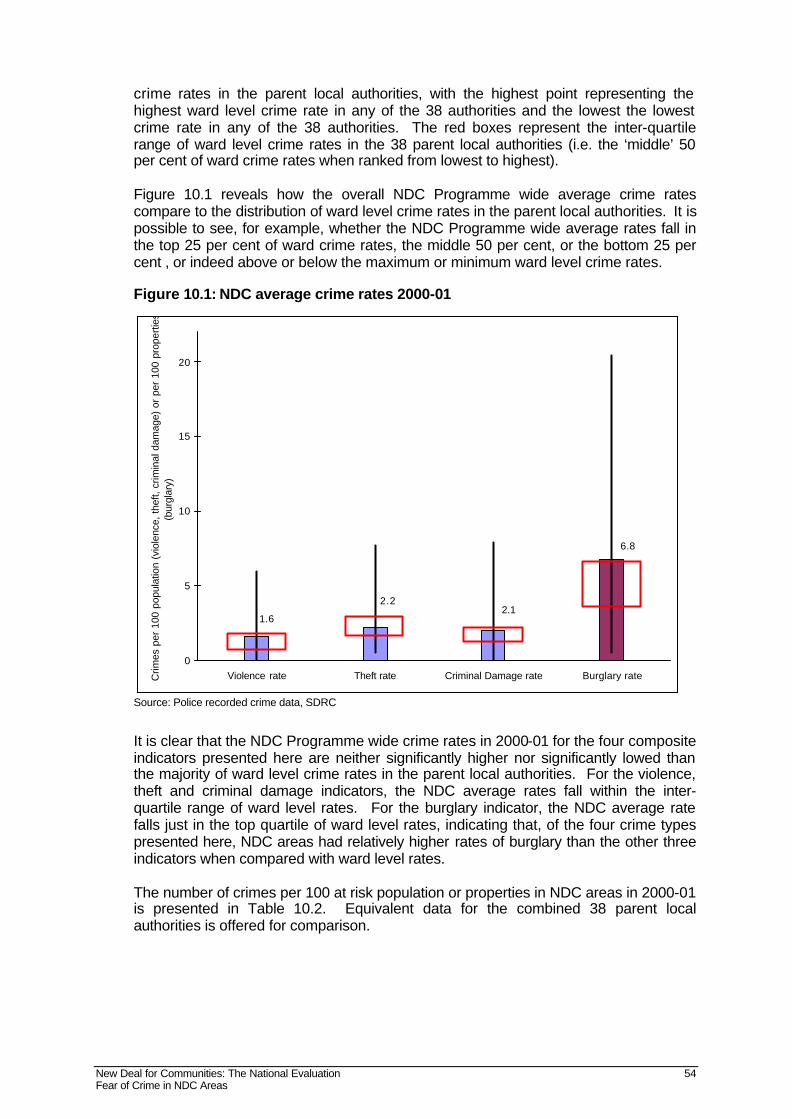
New Deal for Communities: The National Evaluation 54 Fear of Crime in NDC Areas
crime rates in the parent local authorities, with the highest point representing the highest ward level crime rate in any of the 38 authorities and the lowest the lowest crime rate in any of the 38 authorities. The red boxes represent the inter-quartile range of ward level crime rates in the 38 parent local authorities (i.e. the ‘middle’ 50 per cent of ward crime rates when ranked from lowest to highest). Figure 10.1 reveals how the overall NDC Programme wide average crime rates compare to the distribution of ward level crime rates in the parent local authorities. It is possible to see, for example, whether the NDC Programme wide average rates fall in the top 25 per cent of ward crime rates, the middle 50 per cent, or the bottom 25 per cent , or indeed above or below the maximum or minimum ward level crime rates. Figure 10.1: NDC average crime rates 2000-01
6.8
2.12.2
1.6
0
5
10
15
20
Violence rate Theft rate Criminal Damage rate Burglary rateCrim
es p
er 1
00 p
opul
atio
n (v
iole
nce,
thef
t, cr
imin
al d
amag
e) o
r pe
r 10
0 pr
oper
ties
(bur
glar
y)
Source: Police recorded crime data, SDRC
It is clear that the NDC Programme wide crime rates in 2000-01 for the four composite indicators presented here are neither significantly higher nor significantly lowed than the majority of ward level crime rates in the parent local authorities. For the violence, theft and criminal damage indicators, the NDC average rates fall within the inter-quartile range of ward level rates. For the burglary indicator, the NDC average rate falls just in the top quartile of ward level rates, indicating that, of the four crime types presented here, NDC areas had relatively higher rates of burglary than the other three indicators when compared with ward level rates. The number of crimes per 100 at risk population or properties in NDC areas in 2000-01 is presented in Table 10.2. Equivalent data for the combined 38 parent local authorities is offered for comparison.

New Deal for Communities: The National Evaluation 55 Fear of Crime in NDC Areas
Table 10.7: Change over time in crime and safety indicators, 2002-2004
Violence Theft
Criminal Damage Burglary
NDC average 2000-01 1.6 2.2 2.1 6.8
Parent LA average 1.4 2.4 1.7 5.4 Source: Police recorded crime data, SDRC
The NDC Programme wide violence rate in 2000-01 stood at 1.6 crimes per 100 at risk population compared with the parent local authority average of 1.4 crimes per 100 at risk population. The NDC average rate for theft (2.2 crimes per 100 at risk population) was slightly lower than the parent local authority average (2.4 crimes per 100 at risk population), while the NDC average for criminal damage (2.1 crimes per 100 at risk population) was slightly higher than the parent authority average (1.7 crimes per 100 at risk population). In terms of burglary, it is apparent that the NDC average rate (6.8 crimes per 100 at risk properties) is also higher than the parent local authority average (5.4 crimes per 100 at risk properties). Changes in NDC crime rates 2000-01 to 2002-03 As noted above, it is difficult directly to compare changes in crime rates over the three years of data presented here due to revisions in police recording practices. However, by ranking the NDC and ward crimes rates in each parent local authority for each of the three years, and then examining change in ranks over this period, it is possible to assess whether NDC areas experienced a relative improvement compared with surrounding neighbourhoods. Figures 10.2 to 10.5 show relative change in NDC rankings for the four composite indicator groups. The score allocated to each NDC area was derived by identifying the change in rank within the parent local authority between 2000-01 and 2002-03 and then expressing this as a proportion of the maximum possible change in rank. For example, if a parent local authority contained 30 wards and one NDC area, its total number of constituent areas for this analysis would be 31. The maximum possible change in rank would therefore by 30 positions. If the NDC area was ranked as having the highest crime rate of all the areas in the authority in 2000-01 it would be ranked number 31. If by 2002-03 its crime rate had fallen so it was ranked at number 21 then it would have improved by 10 positions (i.e. the rank fell by 10). Its relative change in rank would therefore be -10 positions divided by the maximum possible of 30 positions to give a score of -0.3. Figure 10.2 shows the relative rank changes between 2000-01 and 2002-03 in terms of violence for the 39 NDC Partnership areas. Twelve NDC areas experienced a relative improvement in violence levels in relation to the wards in their own parent local authority. Fifteen NDC areas, on the other hand, saw a relative worsening in violence rates relative to the parent authority wards. The remaining 12 NDC areas saw no change in their ranking. While these findings do not suggest that overall the NDC areas are performing substantially better or worse than their surrounding localities, it is clear that some NDC areas notably Sheffield, experienced significant improvements in reducing rates of violence..

New Deal for Communities: The National Evaluation 56 Fear of Crime in NDC Areas
Figure 10.2: Relative change in violence rank 2000-01 to 2002-03
-0.3
4-0
.12
-0.1
1-0
.10
-0.1
0-0
.09
-0.0
6-0
.06
-0.0
5-0
.05
-0.0
5-0
.05
0.03 0.04
0.05
0.05
0.05
0.05
0.05 0.06
0.06
0.07 0.
10 0.11 0.
150.
200.
28
-0.45
-0.35
-0.25
-0.15
-0.05
0.05
0.15
0.25
0.35
She
ffiel
dN
ewca
stle
Hac
kney
Not
tingh
amW
alsa
llH
ull
H'S
mith
& F
ulha
mB
risto
lS
alfo
rdB
irmin
gham
ALa
mbe
thLe
ices
ter
New
ham
Brig
hton
San
dwel
lS
unde
rland
Sou
tham
pton
Old
ham
Bre
ntIs
lingt
onH
artle
pool
Har
inge
yD
erby
Cov
entry
Live
rpoo
lM
iddl
esbr
ough
Kno
wsl
eyS
outh
war
kD
onca
ster
Roc
hdal
eLu
ton
Tow
er H
amle
tsM
anch
este
rB
radf
ord
Wol
verh
ampt
onLe
wis
ham
Nor
wic
hP
lym
outh
Birm
ingh
am K
N
Rel
ativ
e ch
ange
in r
ank
Source: Police recorded crime data, SDRC
Figure 10.3 shows the relative rank changes between 2000-01 and 2002-03 in terms of burglary for the 39 NDC areas. Eighteen experienced a relative improvement in burglary ranking between 2000-01 and 2002-03 compared to 16 which saw a relative worsening. The remaining 5 NDC areas experienced no change in their ranks. Islington saw the most significant improvement over the period, falling from rank 12 out of 17 in 2000-01 to rank 3 by 2002-03 (i.e. the NDC area rank fell/improved by 9 out of a possible 16 positions).
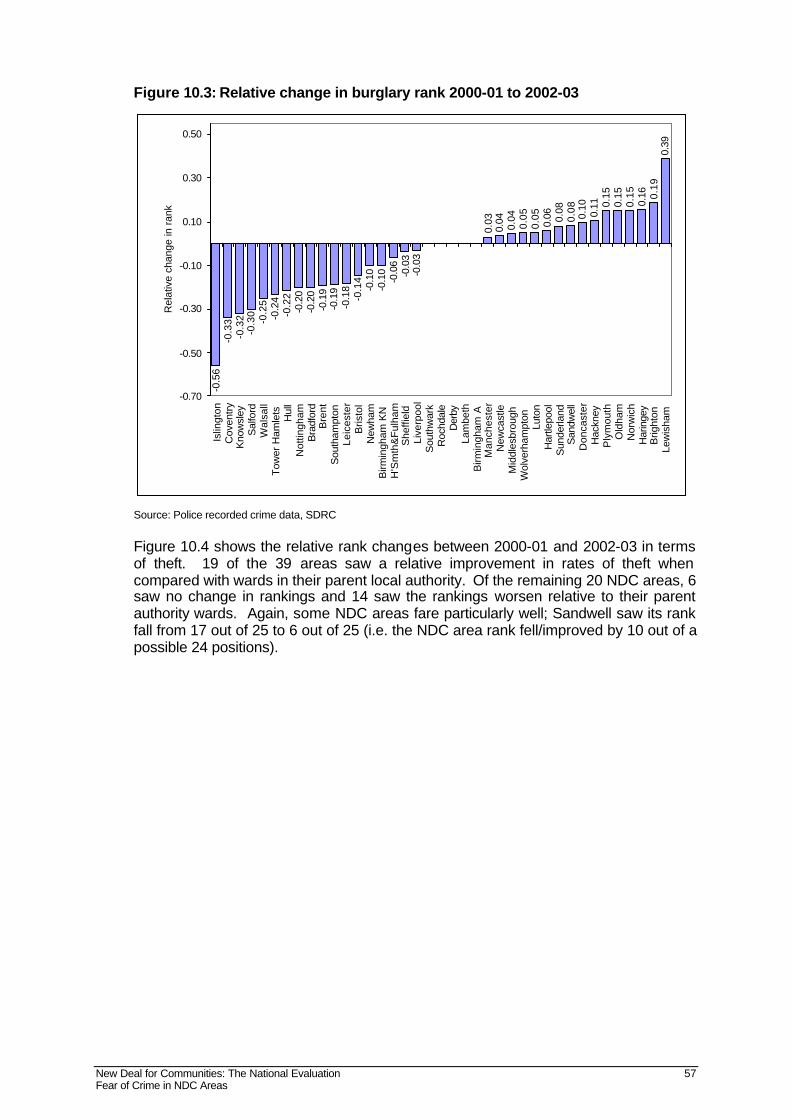
New Deal for Communities: The National Evaluation 57 Fear of Crime in NDC Areas
Figure 10.3: Relative change in burglary rank 2000-01 to 2002-03
-0.5
6-0
.33
-0.3
2-0
.30
-0.2
5-0
.24
-0.2
2-0
.20
-0.2
0-0
.19
-0.1
9-0
.18
-0.1
4-0
.10
-0.1
0-0
.06
-0.0
3-0
.03
0.03
0.04 0.04
0.05
0.05
0.06 0.08
0.08 0.10
0.11 0.
150.
150.
150.
16 0.19
0.39
-0.70
-0.50
-0.30
-0.10
0.10
0.30
0.50
Islin
gton
Cov
entr
yK
now
sley
Sal
ford
Wal
sall
Tow
er H
amle
ts
Hul
lN
ottin
gham
Bra
dfor
dB
rent
Sou
tham
pton
Leic
este
rB
risto
lN
ewha
mB
irmin
gham
KN
H
'Sm
th&
Ful
ham
She
ffiel
d Li
verp
ool
Sou
thw
ark
Roc
hdal
eD
erby
Lam
beth
Birm
ingh
am A
M
anch
este
rN
ewca
stle
Mid
dles
brou
gh
Wol
verh
ampt
on
Luto
nH
artle
pool
Sun
derla
ndS
andw
ell
Don
cast
erH
ackn
eyP
lym
outh
Old
ham
Nor
wic
hH
arin
gey
Brig
hton
Le
wis
ham
Rel
ativ
e ch
ange
in r
ank
Source: Police recorded crime data, SDRC Figure 10.4 shows the relative rank changes between 2000-01 and 2002-03 in terms of theft. 19 of the 39 areas saw a relative improvement in rates of theft when compared with wards in their parent local authority. Of the remaining 20 NDC areas, 6 saw no change in rankings and 14 saw the rankings worsen relative to their parent authority wards. Again, some NDC areas fare particularly well; Sandwell saw its rank fall from 17 out of 25 to 6 out of 25 (i.e. the NDC area rank fell/improved by 10 out of a possible 24 positions).
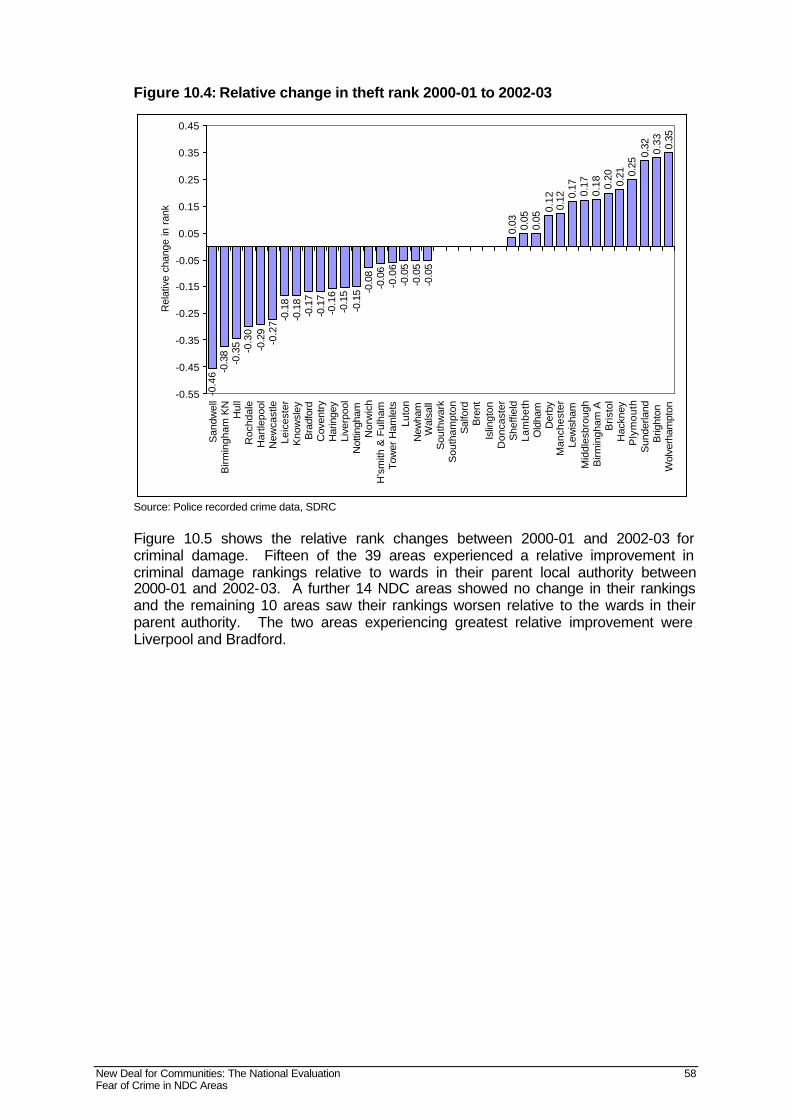
New Deal for Communities: The National Evaluation 58 Fear of Crime in NDC Areas
Figure 10.4: Relative change in theft rank 2000-01 to 2002-03
-0.4
6 -0.3
8-0
.35 -0.3
0-0
.29
-0.2
7 -0.1
8-0
.18
-0.1
7-0
.17
-0.1
6-0
.15
-0.1
5 -0.0
8-0
.06
-0.0
6-0
.05
-0.0
5-0
.05
0.03 0.05
0.05
0.12
0.12 0.
17 0.17
0.18 0.
20 0.21 0.
250.
32 0.33 0.35
-0.55
-0.45
-0.35
-0.25
-0.15
-0.05
0.05
0.15
0.25
0.35
0.45
San
dwel
lB
irmin
gham
KN
Hul
lR
ochd
ale
Har
tlepo
olN
ewca
stle
Leic
este
rK
now
sley
Bra
dfor
dC
oven
tryH
arin
gey
Live
rpoo
lN
ottin
gham
Nor
wic
hH
'sm
ith &
Ful
ham
Tow
er H
amle
tsLu
ton
New
ham
Wal
sall
Sou
thw
ark
Sou
tham
pton
Sal
ford
Bre
ntIs
lingt
onD
onca
ster
She
ffiel
dLa
mbe
thO
ldha
mD
erby
Man
ches
ter
Lew
isha
mM
iddl
esbr
ough
Birm
ingh
am A
Bris
tol
Hac
kney
Ply
mou
thS
unde
rland
Brig
hton
W
olve
rham
pton
Rel
ativ
e ch
ange
in r
ank
Source: Police recorded crime data, SDRC Figure 10.5 shows the relative rank changes between 2000-01 and 2002-03 for criminal damage. Fifteen of the 39 areas experienced a relative improvement in criminal damage rankings relative to wards in their parent local authority between 2000-01 and 2002-03. A further 14 NDC areas showed no change in their rankings and the remaining 10 areas saw their rankings worsen relative to the wards in their parent authority. The two areas experiencing greatest relative improvement were Liverpool and Bradford.
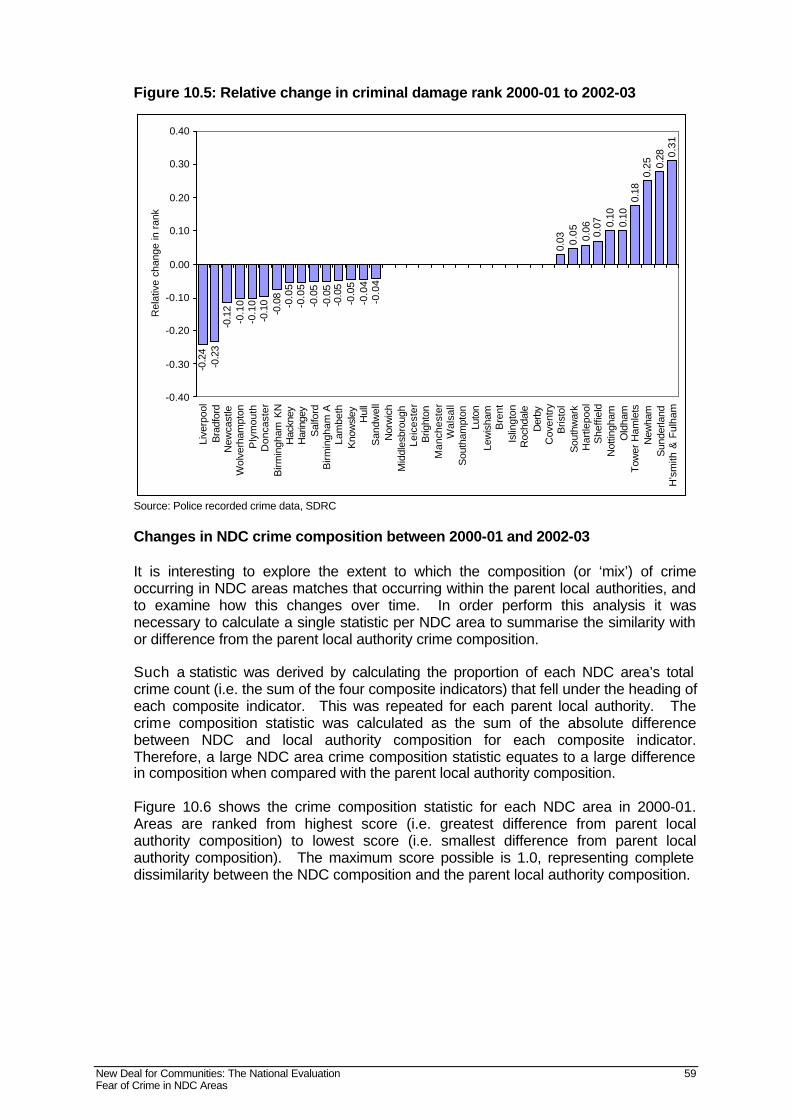
New Deal for Communities: The National Evaluation 59 Fear of Crime in NDC Areas
Figure 10.5: Relative change in criminal damage rank 2000-01 to 2002-03
-0.2
4-0
.23
-0.1
2-0
.10
-0.1
0-0
.10
-0.0
8-0
.05
-0.0
5-0
.05
-0.0
5-0
.05
-0.0
5-0
.04
-0.0
4
0.03 0.
05 0.06 0.07 0.
100.
100.
180.
25 0.28 0.
31
-0.40
-0.30
-0.20
-0.10
0.00
0.10
0.20
0.30
0.40
Live
rpoo
lB
radf
ord
New
cast
leW
olve
rham
pton
Ply
mou
thD
onca
ster
Birm
ingh
am K
NH
ackn
eyH
arin
gey
Sal
ford
Birm
ingh
am A
Lam
beth
Kno
wsl
ey Hul
lS
andw
ell
Nor
wic
hM
iddl
esbr
ough
Leic
este
rB
right
onM
anch
este
rW
alsa
llS
outh
ampt
onLu
ton
Lew
isha
mB
rent
Islin
gton
Roc
hdal
eD
erby
Cov
entr
yB
risto
lS
outh
war
kH
artle
pool
She
ffiel
dN
ottin
gham
Old
ham
Tow
er H
amle
tsN
ewha
mS
unde
rland
H's
mith
& F
ulha
m
Rel
ativ
e ch
ange
in r
ank
Source: Police recorded crime data, SDRC
Changes in NDC crime composition between 2000-01 and 2002-03 It is interesting to explore the extent to which the composition (or ‘mix’) of crime occurring in NDC areas matches that occurring within the parent local authorities, and to examine how this changes over time. In order perform this analysis it was necessary to calculate a single statistic per NDC area to summarise the similarity with or difference from the parent local authority crime composition. Such a statistic was derived by calculating the proportion of each NDC area’s total crime count (i.e. the sum of the four composite indicators) that fell under the heading of each composite indicator. This was repeated for each parent local authority. The crime composition statistic was calculated as the sum of the absolute difference between NDC and local authority composition for each composite indicator. Therefore, a large NDC area crime composition statistic equates to a large difference in composition when compared with the parent local authority composition. Figure 10.6 shows the crime composition statistic for each NDC area in 2000-01. Areas are ranked from highest score (i.e. greatest difference from parent local authority composition) to lowest score (i.e. smallest difference from parent local authority composition). The maximum score possible is 1.0, representing complete dissimilarity between the NDC composition and the parent local authority composition.

New Deal for Communities: The National Evaluation 60 Fear of Crime in NDC Areas
Figure 10.6: Crime composition statistic 2000-01
0.38
0.37
0.37
0.34
0.32
0.32
0.29
0.27
0.26
0.25
0.22
0.21
0.20
0.20
0.20
0.19
0.18
0.18
0.17
0.16
0.16
0.16
0.15
0.15
0.14
0.13
0.12
0.11
0.11
0.11
0.11
0.10
0.10
0.10
0.09
0.08
0.08
0.07
0.05
0.00
0.05
0.10
0.15
0.20
0.25
0.30
0.35
0.40
She
ffiel
dN
orw
ich
Sou
tham
pton Hul
lB
right
onD
onca
ster
Leic
este
rM
anch
este
rD
erby
Birm
ingh
am K
NB
irmin
gham
AN
ewca
stle
Luto
nC
oven
try
Islin
gton
Ply
mou
thN
ewha
mLi
verp
ool
Lam
beth
Sun
derla
ndH
'sm
ith &
Ful
ham
Not
tingh
amW
alsa
llR
ochd
ale
Har
tlepo
olB
radf
ord
Har
inge
yS
andw
ell
Sal
ford
Kno
wsl
eyM
iddl
esbr
ough
Tow
er H
amle
tsS
outh
war
kB
risto
lB
rent
Lew
isha
mH
ackn
eyO
ldha
mW
olve
rham
pton
Source: Police recorded crime data, SDRC
It is clear that there was wide disparity between NDC areas in 2000-01 in terms of the relative crime composition. Sheffield, Norwich and Southampton have the greatest disparity with their parent local authorities. The three NDC areas with crime composition most closely matching the parent local authorities are Hackney, Oldham and Wolverhampton. To what extent did NDCs experience any ‘convergence’ towards the local authority composition over the period of analysis? Figure 10.7 shows, via a scatter plot, how NDC areas’ crime composition statistics for 2000-01 relate to the change in the statistic between 2000-01 and 2002-03.
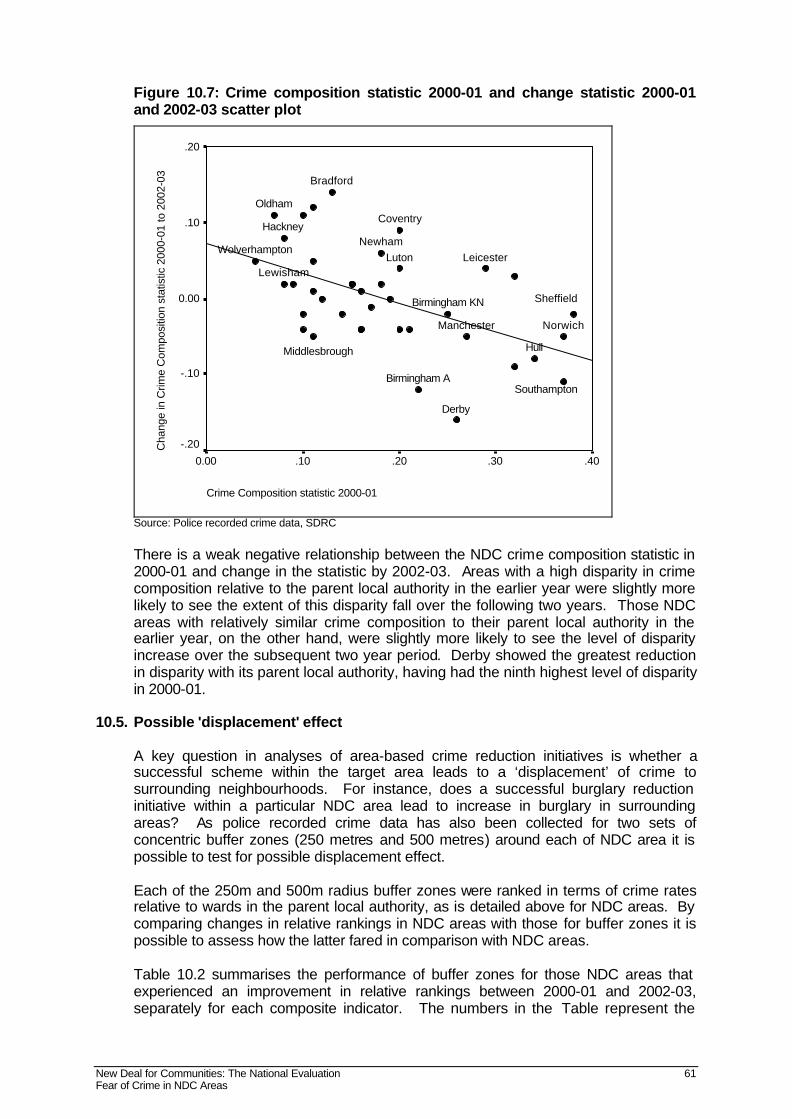
New Deal for Communities: The National Evaluation 61 Fear of Crime in NDC Areas
Figure 10.7: Crime composition statistic 2000-01 and change statistic 2000-01 and 2002-03 scatter plot
Crime Composition statistic 2000-01
.40.30.20.100.00
Cha
nge
in C
rime
Com
posi
tion
stat
istic
200
0-01
to 2
002-
03.20
.10
0.00
-.10
-.20
Birmingham A
Coventry
Derby
LewishamLuton
Oldham
Wolverhampton
Manchester
Hull
Bradford
Birmingham KN
LeicesterNewham
Hackney
Norwich
Sheffield
Middlesbrough
Southampton
Source: Police recorded crime data, SDRC There is a weak negative relationship between the NDC crime composition statistic in 2000-01 and change in the statistic by 2002-03. Areas with a high disparity in crime composition relative to the parent local authority in the earlier year were slightly more likely to see the extent of this disparity fall over the following two years. Those NDC areas with relatively similar crime composition to their parent local authority in the earlier year, on the other hand, were slightly more likely to see the level of disparity increase over the subsequent two year period. Derby showed the greatest reduction in disparity with its parent local authority, having had the ninth highest level of disparity in 2000-01.
10.5. Possible 'displacement' effect
A key question in analyses of area-based crime reduction initiatives is whether a successful scheme within the target area leads to a ‘displacement’ of crime to surrounding neighbourhoods. For instance, does a successful burglary reduction initiative within a particular NDC area lead to increase in burglary in surrounding areas? As police recorded crime data has also been collected for two sets of concentric buffer zones (250 metres and 500 metres) around each of NDC area it is possible to test for possible displacement effect. Each of the 250m and 500m radius buffer zones were ranked in terms of crime rates relative to wards in the parent local authority, as is detailed above for NDC areas. By comparing changes in relative rankings in NDC areas with those for buffer zones it is possible to assess how the latter fared in comparison with NDC areas. Table 10.2 summarises the performance of buffer zones for those NDC areas that experienced an improvement in relative rankings between 2000-01 and 2002-03, separately for each composite indicator. The numbers in the Table represent the

New Deal for Communities: The National Evaluation 62 Fear of Crime in NDC Areas
percentage of total applicable buffer zones (i.e. those buffer zones attached to NDC areas that saw a worsening of their relative rank or no change in rank are not included in the base). Table 10.8: Buffer Zones
Buffer zone
m
Buffer improved
%
Buffer no change
%
Buffer worsened
% Total
% Violence 250 58 33 8 100 500 50 25 25 100 Burglary 250 67 11 22 100 500 61 17 22 100 Theft 250 84 17 22 100 500 74 11 16 100 Criminal Damage 250 73 0 27 100 500 87 7 7 100
Source: Police recorded crime data, SDRC It is clear from Table 10.8 that, rather than observing ‘displacement’ of crime from NDC areas to surrounding areas, there is the possibility that successful NDC initiatives are having a wider geographical impact and are thus helping to reduce crime levels in surrounding neighbourhoods. However, this cannot be stated as yet with total confidence. It may be, for instance, that the buffer zones were subject to the same policing initiatives or wider regeneration initiatives as the NDC areas and therefore both the buffers and the NDC areas experienced similar improvements. Alternatively, it may be that improvements to the buffer zones are common to deprived areas more broadly.
10.6. A concluding comment
Comparisons of the 2002 and 2004 household surveys reveal a largely positive picture. At a cross sectional level, actual crime rates and feelings of safety have improved. In addition, attitudes (trust and satisfaction) towards local police also improved. When these findings are compared with changes in comparator areas, NDCs are doing at least as well, and in some cases substantially better. Panel respondents (residents interviewed in both 2002 and 2004) show slightly greater improvements in crime indicators than for cross sectional respondents. Similar to cross sectional respondents, the NDC panel is doing at least as well as the comparator panel and for seven of ten indicators, better. As NDC panel respondents have remained in the area for the 2002 to 2004 period, they are most likely to have benefited from Partnership supported interventions. This difference in changes for the NDC panel when compared with the comparator areas panel might tentatively be regarded as an NDC effect. In terms of police recorded data a greater number of NDC areas experienced an improvement in crime rates relative to the wards in their parent local authorities for the categories of burglary, theft and criminal damage than saw a worsening of their ranks. But there is considerable variation across NDC areas: no category of crime saw a substantial majority of NDC areas doing better or worse than other wards in their local authority over the period of analysis. Heterogeneity was also observed in the crime composition statistics for 2000-01; some NDC areas exhibited a mix of crime very similar to their parent local authority as a whole while other NDC areas had considerably different crime compositions. Those
New Deal for Communities: The National Evaluation 63 Fear of Crime in NDC Areas
NDC areas with the higher levels of disparity relative to the local authority in 2000-01 were slightly more likely to see a reduction in the level of disparity over the following two years than those NDC areas with smaller disparity to begin with. There is no evidence that those NDC Partnerships experiencing a relative improvement in crime rates between 2000-01 and 2002-03 caused a displacement of crime to the surround localities. Indeed in most instances where NDC areas experienced a reduction in crime so did the surrounding neighbourhoods.

New Deal for Communities: The National Evaluation 64 Fear of Crime in NDC Areas
11. SOME POLICY IMPLICATIONS
A number of policy implications for both NDCs and indeed the wider neighbourhood renewal community arise from this analysis of crime data. It should be stressed that some of the policy nuances identified in this work are subtle. Partnerships facing the immediacy of delivering 10 year programmes may not always be able to respond appropriately. But at the very least they should be aware of the issues facing them. Neighbourhood renewal Partnerships need to be aware of the sheer scale of problems which they face in relation to crime and fear of crime; rates of actual crime are often double the national average. They also need to consider a range of data sources which inform them about the nature of both self-reported and recorded crime within an area. There are complex relationships between fear and experience of crime . There are no particularly strong relationships between the two at the NDC Programme wide level, although there are at the level of the individual respondent. In practice fear of crime runs ahead of actual experience in some NDCs but the situation is reversed in others. Some NDC areas such as Brighton, Plymouth, Newcastle, Hull and Southampton have lower scores on the composite indicator of fear of crime than actual levels might merit. However, given that fear of crime might have a negative impact on an individual's health or quality of life, it would not seem sensible actively to encourage residents to be more fearful of crime. Perhaps it would, however, be beneficial to promote some crime prevention schemes in these areas including improvements in household security and street lighting. These may act to reduce actual rate of burglary or muggings whilst re-enforcing a sense of personal security. At the other end of the spectrum some areas appear to have a higher fear of crime than would appear to be justified. This applies for instance to Tower Hamlets, Sandwell and Southwark. For these areas focusing on interventions which reduce fear of crime may be most beneficial. So, increasing visibility of police or neighbourhood wardens may help people feel more secure even if it doesn't necessarily have a significant impact on reducing crime in the area. Incorporating 'secured by design' principles in housing based regeneration projects could contribute to a safer environment. There may be a case too for Partnerships to publicise the real, and often diminishing, level of crime in the neighbourhood. This potential imbalance between fear of and experience of crime may be a particular problem facing many, though not all, London NDCs. This may well in part reflect higher levels of ethnicity in that those from Asian backgrounds tend to feel less safe than other ethnic groups, although being subject to less crime than white people. There are significant relationships between fear of and actual experience of crime on the one hand and a range of socio-economic and demographic variables including age, gender, ethnicity, education and tenure on the other. These variations need to inform all aspects of neighbourhood level crime prevention strategies. Partnerships located in say inner London with relatively higher levels of owner occupation, BME populations and young people may be facing a rather different set of issues than, say, largely white, public sector housing schemes on the edge of towns and cities in the north of England. Reducing crime and fear of crime will have important implications for other components of disadvantage including health, particularly mental health, and aspects of social capital. There are especially strong relationships between fear and experience of crime and low mental health scores. And those most fearful of crime
New Deal for Communities: The National Evaluation 65 Fear of Crime in NDC Areas
tend to be those with least trust and to be those who view the neighbourhood as unfriendly. Tackling crime through holistic longer term programmes is likely to have important implications for other components of disadvantage. Attacking low level environmental problems may help reduce fear of crime . Those who are most concerned about aspects of local dereliction, lawlessness and local social problems are those who are more likely to feel unsafe after dark, to be frightened of crime in general and to have been a victim of crime. Targeting issues such as reducing worklessness and increasing staying on rates in post compulsory education is likely to have beneficial effects on crime rates in areas. The relationship between higher levels of criminal damage in areas with low staying on rates in school and high levels of worklessness is especially strong. There are important lessons for the local police in their efforts to engage local communities. In particular levels of trust and satisfaction are lower than is the case nationally. And within this context, it is perhaps worrying that younger people tend to have less trust in the police and that as educational qualifications rise, satisfaction falls. Most disturbing of all, those who have been the victim of crime are much more likely to be distrustful of the police and to be dissatisfied with the service they provide: direct contact with the police is associated with much lower levels of trust and satisfaction. Finally, perhaps the most important policy implication of all for Partnerships looking to create sustainable longer term renewal programmes: those who fear and have direct experience of, crime are those who are most likely to want to move. Attacking crime and fear of crime may have significant longer term implications for renewal Partnerships wishing to create stable and successful communities.
New Deal for Communities: The National Evaluation 66 Fear of Crime in NDC Areas
REFERENCES
Acheson, D. (1998) Independent Enquiry into Inequalities in Health Report. London: TSO. Beatty C., Cole, I., Grimsley, M. and Hickman, P. (2005b) Housing and the Physical Environment: Will residents stay and reap the benefits? NDC National Evaluation Paper. Beatty, C., Goyder, E., Grimsley, M., Manning, J. and Peters, J. (2005a) Health of NDC Residents: Who has the most to gain? NDC National Evaluation Paper. Braithewaite, J. (1979) Inequality, Crime and Public Policy. London: Routledge. Bucke, T. (1997) Ethnicity and contacts with the police: latest findings from the British Crime Survey, Home Office Research and Statistics Directorate, Research Findings 59. London: Home Office. Bursik, R. J. (1988) Social disorganisation and theories of crime and delinquency; problems and prospects. Criminology, 26, pp. 519-552. Chivite-Matthews, N. and Maggs, P. (2002) Crime, Policing and Justice: the experience of older people. London: Office for National Statistics. Christmann, K., Rogerson, M. and Walters, D. (2003) Fear of Crime and Insecurity in New Deal for Communities Partnerships - NDC Research Report 14. Sheffield: Sheffield Hallam University. Critchley, R. Gilbertson, J. Green, G. and Grimsley, M. (2004) Housing investment and health in Liverpool. Sheffield: CRESR, Sheffield Hallam University Ebbe, O. (1989) Crime and delinquency in metropolitan Lagos: a study of "crime and delinquency area" theory. Social Forces, 67(3), pp. 751-765. Garratt, A., Schmidt, L., Mackintosh, A. and Fitzpatrick, R. (2002) Quality of life measurement: bibliographic study of patient assessed health outcome measures. BMJ; 324, 1417-1421. Green G, Grimsley M, Suokas A et al (2000) Social Capital, health and economy in South Yorkshire coalfield communities. CRESR, Sheffield Hallam University Green, G. Gilbertson, J.M. and Grimsley, M.F.J. (2002) 'Fear of crime and health in residential tower blocks: a case study in Liverpool UK.' European Journal of Public Health, Vol 12, No.1 pp. 10-15. Green, G. Grimsley, M. and Stafford, B. (2001) Capital accounting for neighbourhood sustainability. Sheffield: CRESR, Sheffield Hallam University Hawdon, J. and Ryan, J. (2003) Police-Resident Interactions and Satisfaction with Police: An Empirical Test of Community Policing Assertions. Criminal Justice Policy Review 14(1), pp. 55 - 74. Hirschfield, A. and Bowers, K.J. (1997) 'The effect of social cohesion on levels of reported crime in disadvantaged areas'. Urban Studies 34, (8), pp. 1275-1295.
New Deal for Communities: The National Evaluation 67 Fear of Crime in NDC Areas
Hiscock R, Kearns A, Macintyre S and Ellaway A (2001) 'Ontological Security and Psycolo-Social Benefits from the Home: Qualitative Evidence on Issues of Tenure. Housing Theory and Society, (18) pp 50-60 Home Office (1989) The Fear of Crime. London: Home Office. Hough, M. (1995) Anxiety about crime; finding from the 1994 British Crime Survey. London: Home Office. Mirrlees-Black, C. and Budd, T. (1997) Policing and the public: findings from the 1996 British Crime Survey. Home Office Research and Statistics Directorate, Research Findings 60. London: Home Office. Mirrlees-Black C. and Allen J. (1998) Concern about Crime: Findings from the 1998 British Crime Survey. London: Home Office. Mirrlees-Black, C., Budd, T., Partridge and Meyhew, P. (1998) The 1998 British Crime Survey, Home Office Statistical Bulletin 21/98. London: Home Office. NRU (2003) Research Report 7: New Deal for Communities, The National Evaluation, Annual Report 2002/3. London: Neighbourhood Renewal Unit/ODPM. Performance Strategic Management Unit, Home Office (2003) National Policing Plan 2004-07. London: Home Office. Rasbash, j., Browne, W., Goldstein, H., Yang, M., Plewis, I., et al (2002) A users guide to MlwiN. London: University of London. Reisig, M.D. and Parks, R.B. (2000) Experience, quality of life, neighbourhood context: A hierarchical analysis of satisfaction of police. Justice Quarterly, 17(3), 607-630. Salisbury, H. and Upson, A. (2004) Ethnicity, victimisation and worry about crime: findings from the 2001/02 and 2002/03 British Crime Surveys. London: Home Office. Secured by Design (2004) Secured by Design. [online] Last accessed 21 January 2005 at www.securedbydesign.com/pdfs/SBD-principles.pdf Simmons, J. (2002) Crime in England and Wales, 2001/2002, London: Research and Statistics Directorate, Home Office. Social Disadvantage Research Centre (2004) New Deal for Communities National Evaluation: Crime Theme Administrative Data Report: May 2004. NDC National Evaluation Paper. Tennyson-Mason, R. (2002) Tackling the Fear of Crime: Putting the Pieces of the Jigsaw Together, Guidance for Crime and Disorder Reduction Partnerships. Government Office for Yorkshire and the Humber. Tennyson-Mason R. (2002) Tackling the Fear of Crime: Putting the Pieces of the Jigsaw Together, Guidance for Crime and Disorder Reduction Partnerships. Government Office for Yorkshire and the Humber. Wilkinson, R., Kawachi, I. and Kennedy, B. (1998) Mortality, the social environment, crime and violence, Sociology of Health and Illness, 20, pp. 578-97.

New Deal for Communities: The National Evaluation 68 Fear of Crime in NDC Areas
APPENDIX
Table A1: Composite score for explicit fear of crime
Table A2: Experience of crime in past 12 months
Table A3: Variables included in composite score for quality of life and problems in
the area
Table A4: Experience and fear of crime indicators by NDC Partnership
Table A5: Odds ratios for residents who feel unsafe walking alone in the area after
dark
Table A6: Odds ratios for residents with high fear of crime by Partnership
Table A7: Odds ratios for high level of lawlessness and dereliction by Partnership
Table A8: Odds ratios for being a victim of crime in past 12 months by Partnership
Table A9: Health questions
Table A10: Composite score for area wellbeing
Table A11: Composite score for vertical trust
Table A12: Community involvement questions
Table A13: Police questions
Table A14: Odds ratios for residents distrust of local police
Table A15: Odds ratios for residents dissatisfied with service provide by the local
Police
Table A16: Multilevel model of mental health wellbeing & fear of crime index with
random intercepts
Table A17: Multilevel model of mental health wellbeing & fear of crime index with
random slopes and intercepts
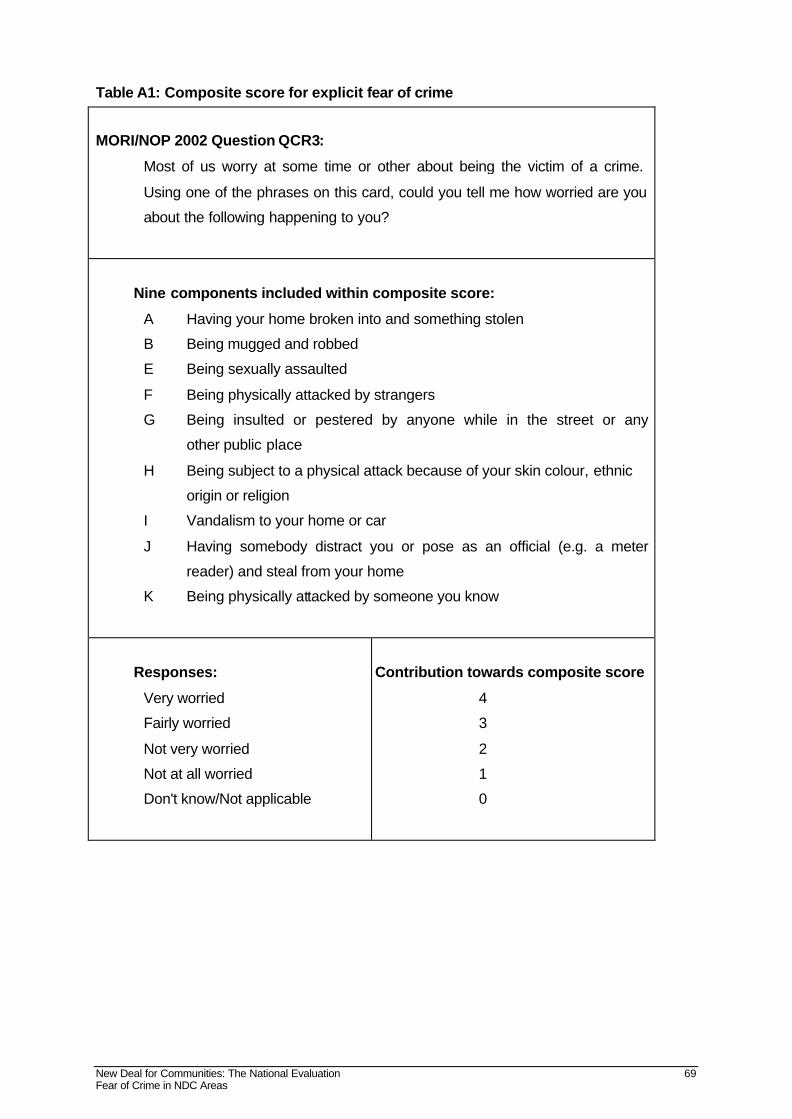
New Deal for Communities: The National Evaluation 69 Fear of Crime in NDC Areas
Table A1: Composite score for explicit fear of crime
MORI/NOP 2002 Question QCR3:
Most of us worry at some time or other about being the victim of a crime.
Using one of the phrases on this card, could you tell me how worried are you
about the following happening to you?
Nine components included within composite score:
A Having your home broken into and something stolen
B Being mugged and robbed
E Being sexually assaulted
F Being physically attacked by strangers
G Being insulted or pestered by anyone while in the street or any
other public place
H Being subject to a physical attack because of your skin colour, ethnic
origin or religion
I Vandalism to your home or car
J Having somebody distract you or pose as an official (e.g. a meter
reader) and steal from your home
K Being physically attacked by someone you know
Responses:
Very worried
Fairly worried
Not very worried
Not at all worried
Don't know/Not applicable
Contribution towards composite score
4
3
2
1
0
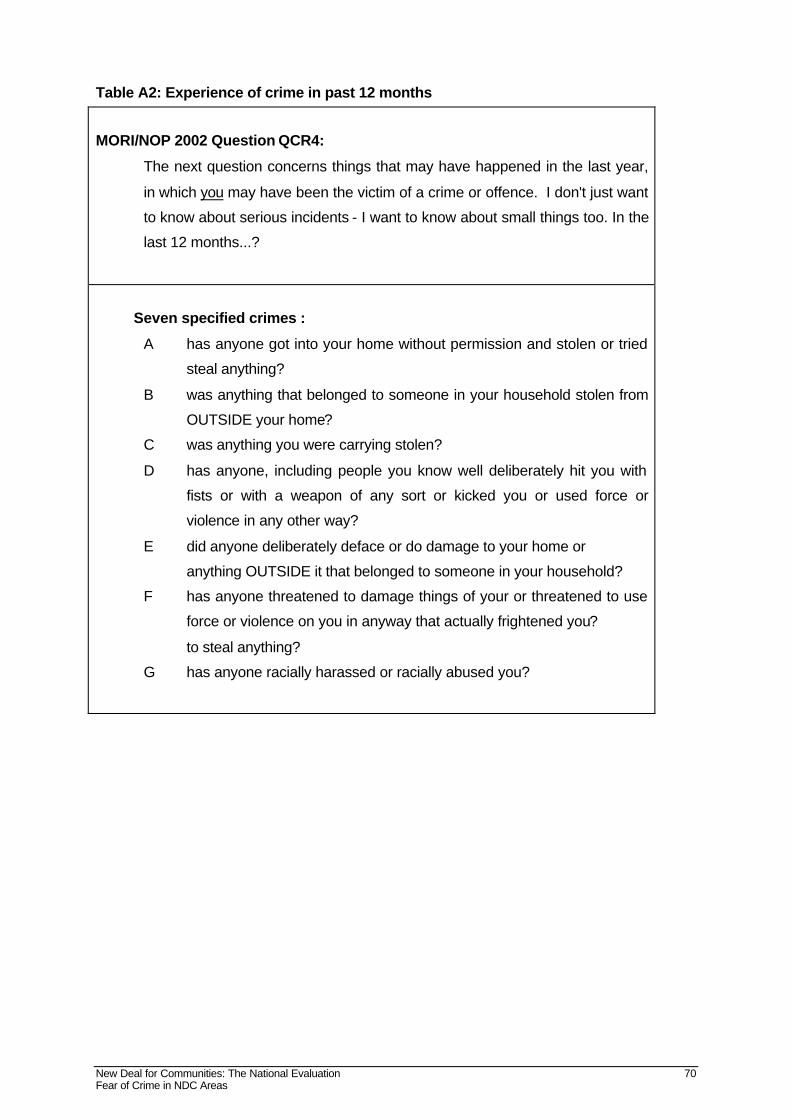
New Deal for Communities: The National Evaluation 70 Fear of Crime in NDC Areas
Table A2: Experience of crime in past 12 months
MORI/NOP 2002 Question QCR4:
The next question concerns things that may have happened in the last year,
in which you may have been the victim of a crime or offence. I don't just want
to know about serious incidents - I want to know about small things too. In the
last 12 months...?
Seven specified crimes :
A has anyone got into your home without permission and stolen or tried
steal anything?
B was anything that belonged to someone in your household stolen from
OUTSIDE your home?
C was anything you were carrying stolen?
D has anyone, including people you know well deliberately hit you with
fists or with a weapon of any sort or kicked you or used force or
violence in any other way?
E did anyone deliberately deface or do damage to your home or
anything OUTSIDE it that belonged to someone in your household?
F has anyone threatened to damage things of your or threatened to use
force or violence on you in anyway that actually frightened you?
to steal anything?
G has anyone racially harassed or racially abused you?

New Deal for Communities: The National Evaluation 71 Fear of Crime in NDC Areas
Table A3: Variables included in composite score for quality of life and problems in the area MORI/NOP 2002 Question QQL3:
I am going to read out a list of things that can cause problems for people in
their area. I would like you to tell me whether each of them is a problem in
this area?
Ten components included within lawlessness and dereliction composite score:
D Run down or boarded up properties
E Abandoned or burnt out cars
I Vandalism, graffiti and other deliberate damage to property
K People being attacked or harassed
L Household burglary
M Car crime (e.g. damage, theft and joyriding)
N Teenagers hanging around on the streets
O Drug dealing and use
P Property being set on fire
Q Disturbance from crowds or hooliganism
Two components included within the social relations composite score:
C Problems with neighbours
J Racial harassment
Five components included within the local environment composite score:
A Dogs causing nuisance or mess
B Litter and rubbish in the streets
F The speed and volume of road traffic
G Poor quality or lack of parks or open spaces
H Poor public transport
Responses:
A serious problem in this area
A problem in this area, but not serious
Not a problem in area
Don't know
Contribution towards composite score
3
2
1
1

New Deal for Communities: The National Evaluation 72 Fear of Crime in NDC Areas
Table A4: Experience and fear of crime indicators by NDC Partnership Percentage of respondents
Been a victim of crime in
past year
Feel a bit/very unsafe walking
alone in the area after
dark
Average composite fear of
crime score
Average composite
lawlessness and
dereliction score
Southwark 21.7 51.5 23.7 17.0 Nottingham 40.4 66.3 22.2 18.8 Haringey 29.3 53.7 21.9 16.1 Sandwell 25.1 52.2 21.6 15.7 Liverpool 27.8 59.6 20.9 18.7 Wolverhampton 32.9 58.3 20.8 16.3 Sunderland 35.3 53.9 20.6 19.4 Bradford 26.2 46.5 20.5 15.9 Luton 36.7 54.0 20.4 17.9 Newham 23.6 58.5 20.3 16.4 Hackney 28.4 53.4 20.2 16.6 Bristol 31.8 57.4 20.0 18.4 Birmingham - Kings Norton 26.0 57.0 19.7 18.0 Manchester 31.9 56.8 19.7 17.6 Doncaster 32.4 49.2 19.7 16.5 Lambeth 15.2 43.1 19.7 15.1 Birmingham - Aston 20.1 56.0 19.6 16.8 Islington 23.0 38.9 19.5 15.7 Lewisham 28.7 48.9 19.5 15.8 Oldham 30.7 50.1 19.5 16.4 Salford 32.6 54.0 19.4 17.3 Coventry 29.6 43.7 19.1 18.4 Tower Hamlets 9.2 43.3 19.1 17.1 Brent 19.1 49.6 18.8 15.3 Rochdale 34.1 48.5 18.6 15.2 Southampton 24.3 53.5 18.5 16.6 Knowsley 27.4 38.1 18.4 16.8 Leicester 32.9 39.4 18.4 15.4 Norwich 28.5 44.5 18.4 15.9 Middlesbrough 31.5 46.2 18.4 16.6 Newcastle 38.5 42.7 18.4 15.0 Derby 33.2 48.4 18.2 16.2 Brighton 34.9 45.5 18.1 15.8 Hull 30.1 38.2 17.8 15.8 Hartlepool 28.7 49.7 17.8 16.3 Sheffield 27.6 48.0 17.7 15.4 Plymouth 28.2 41.8 17.2 17.0 Walsall 22.7 44.8 17.2 14.7 Hammersmith & Fulham 18.2 38.6 17.0 14.7
NDC average 28.2 49.3 19.4 16.5
England 33.0 n/a n/a
Base: All, 2002 MORI/NOP Household Survey
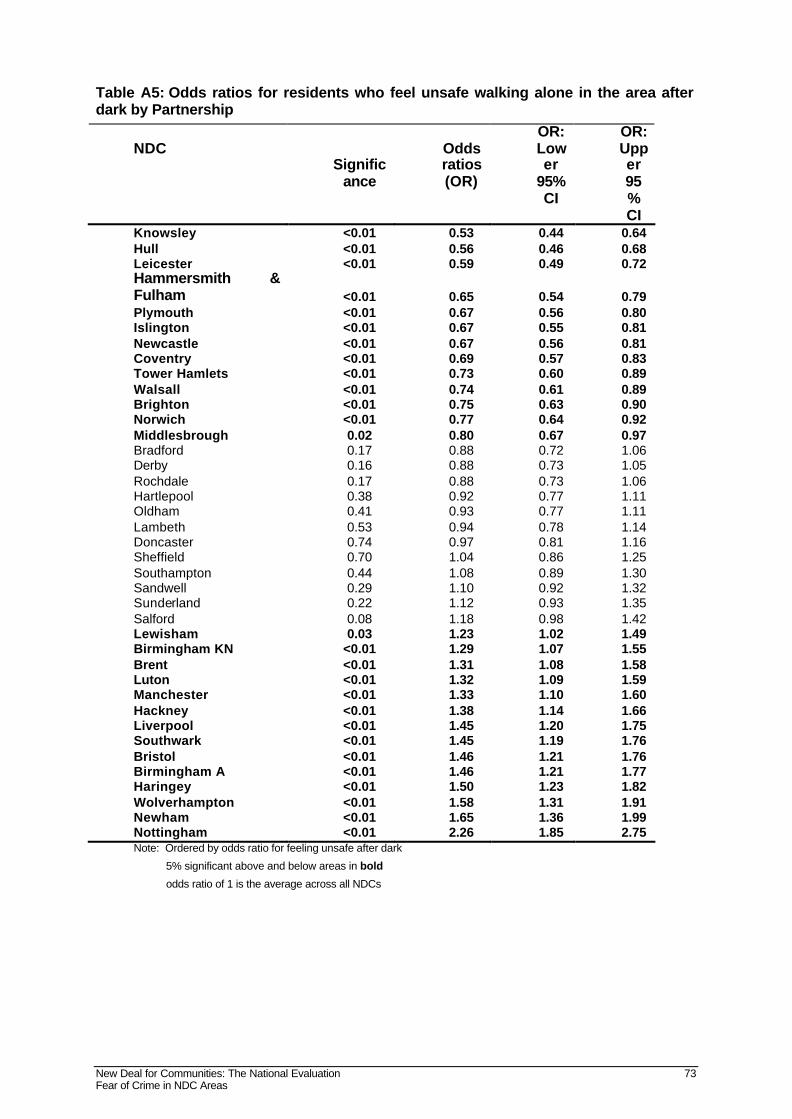
New Deal for Communities: The National Evaluation 73 Fear of Crime in NDC Areas
Table A5: Odds ratios for residents who feel unsafe walking alone in the area after dark by Partnership
NDC
Significance
Odds ratios (OR)
OR: Lower
95% CI
OR: Upper 95% CI
Knowsley <0.01 0.53 0.44 0.64 Hull <0.01 0.56 0.46 0.68 Leicester <0.01 0.59 0.49 0.72 Hammersmith & Fulham <0.01 0.65 0.54 0.79 Plymouth <0.01 0.67 0.56 0.80 Islington <0.01 0.67 0.55 0.81 Newcastle <0.01 0.67 0.56 0.81 Coventry <0.01 0.69 0.57 0.83 Tower Hamlets <0.01 0.73 0.60 0.89 Walsall <0.01 0.74 0.61 0.89 Brighton <0.01 0.75 0.63 0.90 Norwich <0.01 0.77 0.64 0.92 Middlesbrough 0.02 0.80 0.67 0.97 Bradford 0.17 0.88 0.72 1.06 Derby 0.16 0.88 0.73 1.05 Rochdale 0.17 0.88 0.73 1.06 Hartlepool 0.38 0.92 0.77 1.11 Oldham 0.41 0.93 0.77 1.11 Lambeth 0.53 0.94 0.78 1.14 Doncaster 0.74 0.97 0.81 1.16 Sheffield 0.70 1.04 0.86 1.25 Southampton 0.44 1.08 0.89 1.30 Sandwell 0.29 1.10 0.92 1.32 Sunderland 0.22 1.12 0.93 1.35 Salford 0.08 1.18 0.98 1.42 Lewisham 0.03 1.23 1.02 1.49 Birmingham KN <0.01 1.29 1.07 1.55 Brent <0.01 1.31 1.08 1.58 Luton <0.01 1.32 1.09 1.59 Manchester <0.01 1.33 1.10 1.60 Hackney <0.01 1.38 1.14 1.66 Liverpool <0.01 1.45 1.20 1.75 Southwark <0.01 1.45 1.19 1.76 Bristol <0.01 1.46 1.21 1.76 Birmingham A <0.01 1.46 1.21 1.77 Haringey <0.01 1.50 1.23 1.82 Wolverhampton <0.01 1.58 1.31 1.91 Newham <0.01 1.65 1.36 1.99 Nottingham <0.01 2.26 1.85 2.75 Note: Ordered by odds ratio for feeling unsafe after dark
5% significant above and below areas in bold
odds ratio of 1 is the average across all NDCs

New Deal for Communities: The National Evaluation 74 Fear of Crime in NDC Areas
Table A6: Odds ratios for residents with high fear of crime by Partnership NDC
Significance
Odds ratios (OR)
OR: Lower
95% CI
OR: Upper 95% CI
Plymouth <0.01 0.53 0.41 0.68 Hammersmith & Fulham <0.01 0.55 0.43 0.70 Derby <0.01 0.61 0.48 0.77 Leicester <0.01 0.63 0.50 0.80 Southampton <0.01 0.65 0.51 0.82 Brighton <0.01 0.68 0.54 0.85 Walsall <0.01 0.70 0.56 0.88 Newcastle <0.01 0.74 0.60 0.93 Hartlepool 0.02 0.76 0.60 0.95 Norwich 0.01 0.76 0.61 0.94 Sheffield 0.01 0.76 0.61 0.95 Tower Hamlets 0.05 0.81 0.65 1.00 Hull 0.05 0.81 0.65 1.00 Brent 0.08 0.82 0.66 1.03 Middlesbrough 0.34 0.90 0.73 1.12 Rochdale 0.44 0.92 0.74 1.14 Lewisham 0.61 0.95 0.76 1.17 Knowsley 0.67 0.96 0.78 1.18 Lambeth 0.82 0.98 0.79 1.21 Birmingham A 0.99 1.00 0.81 1.23 Oldham 0.98 1.00 0.82 1.23 Islington 0.92 1.01 0.82 1.25 Bristol 0.74 1.04 0.84 1.27 Bradford 0.51 1.07 0.87 1.32 Manchester 0.41 1.09 0.89 1.34 Birmingham KN 0.29 1.11 0.91 1.36 Doncaster 0.24 1.13 0.92 1.39 Salford 0.21 1.14 0.93 1.39 Coventry 0.06 1.21 0.99 1.49 Luton 0.04 1.22 1.00 1.49 Hackney 0.02 1.27 1.04 1.55 Sunderland <0.01 1.46 1.20 1.77 Newham <0.01 1.56 1.29 1.90 Wolverhampton <0.01 1.57 1.30 1.91 Liverpool <0.01 1.60 1.32 1.95 Sandwell <0.01 1.71 1.42 2.06 Haringey <0.01 1.77 1.45 2.16 Nottingham <0.01 1.78 1.46 2.16 Southwark <0.01 2.20 1.81 2.68 Note: Ordered by odds ratio for high fear of crime
5% significant above and below areas in bold
odds ratio of 1 is the average across all NDCs

New Deal for Communities: The National Evaluation 75 Fear of Crime in NDC Areas
Table A7: Odds ratios for high level of lawlessness and dereliction by Partnership NDC
Significance
Odds ratios (OR)
OR: Lower
95% CI
OR: Upper
95% CI
Hammersmith & Fulham <0.01 0.31 0.23 0.43 Lambeth <0.01 0.39 0.29 0.53 Walsall <0.01 0.47 0.36 0.63 Islington <0.01 0.53 0.41 0.69 Newcastle <0.01 0.54 0.42 0.71 Brent <0.01 0.57 0.44 0.74 Sheffield <0.01 0.64 0.50 0.83 Rochdale <0.01 0.67 0.52 0.86 Leicester <0.01 0.68 0.54 0.87 Norwich 0.01 0.74 0.59 0.93 Brighton 0.01 0.75 0.59 0.94 Hull 0.01 0.75 0.60 0.95 Bradford 0.06 0.79 0.62 1.01 Lewisham 0.25 0.87 0.69 1.10 Sandwell 0.31 0.89 0.71 1.11 Haringey 0.61 0.94 0.75 1.19 Newham 0.63 0.95 0.76 1.18 Southampton 0.87 0.98 0.79 1.22 Derby 0.96 0.99 0.80 1.23 Hartlepool 0.87 1.02 0.81 1.27 Hackney 0.61 1.06 0.85 1.31 Southwark 0.58 1.06 0.86 1.32 Wolverhampton 0.55 1.07 0.86 1.33 Knowsley 0.50 1.08 0.87 1.33 Doncaster 0.31 1.12 0.90 1.39 Oldham 0.22 1.14 0.92 1.41 Tower Hamlets 0.15 1.17 0.94 1.46 Plymouth 0.10 1.18 0.97 1.45 Birmingham A 0.10 1.20 0.97 1.50 Middlesbrough 0.02 1.28 1.04 1.57 Salford 0.02 1.28 1.05 1.57 Luton <0.01 1.45 1.19 1.76 Manchester <0.01 1.64 1.34 2.00 Birmingham KN <0.01 1.70 1.40 2.06 Coventry <0.01 2.03 1.68 2.46 Bristol <0.01 2.06 1.71 2.49 Nottingham <0.01 2.25 1.85 2.73 Liverpool <0.01 2.78 2.30 3.35 Sunderland <0.01 3.25 2.71 3.90 Note: Ordered by odds ratio for high level of lawlessness and dereliction
5% significant above and below areas in bold
odds ratio of 1 is the average across all NDCs

New Deal for Communities: The National Evaluation 76 Fear of Crime in NDC Areas
Table A8: Odds ratios for being a victim of crime in past 12 months by Partnership NDC
Significance
Odds ratios (OR)
OR: Lower
95% CI
OR: Upper
95% CI
Tower Hamlets <0.01 0.24 0.17 0.32 Lambeth <0.01 0.42 0.33 0.54 Hammersmith & Fulham <0.01 0.54 0.43 0.69 Brent <0.01 0.56 0.44 0.70 Southwark <0.01 0.70 0.56 0.88 Birmingham A <0.01 0.71 0.56 0.89 Islington <0.01 0.71 0.57 0.88 Newham 0.04 0.81 0.65 0.99 Walsall 0.11 0.84 0.68 1.04 Southampton 0.21 0.87 0.71 1.08 Birmingham KN 0.67 0.96 0.78 1.17 Sandwell 0.70 0.96 0.78 1.18 Plymouth 0.74 0.97 0.79 1.18 Hackney 0.76 0.97 0.79 1.19 Bradford 0.91 0.99 0.80 1.22 Knowsley 0.96 1.01 0.82 1.23 Liverpool 0.81 1.02 0.84 1.25 Lewisham 0.68 1.04 0.85 1.28 Norwich 0.65 1.05 0.86 1.28 Haringey 0.61 1.06 0.86 1.30 Coventry 0.40 1.09 0.89 1.33 Hartlepool 0.39 1.09 0.89 1.33 Sheffield 0.35 1.10 0.90 1.34 Oldham 0.16 1.15 0.95 1.40 Hull 0.07 1.20 0.98 1.45 Bristol 0.03 1.23 1.02 1.49 Middlesbrough 0.03 1.25 1.03 1.51 Salford 0.02 1.26 1.04 1.52 Manchester 0.02 1.27 1.04 1.54 Wolverhampton <0.01 1.31 1.08 1.59 Brighton <0.01 1.35 1.11 1.63 Doncaster <0.01 1.35 1.11 1.63 Leicester <0.01 1.38 1.14 1.67 Derby <0.01 1.39 1.15 1.68 Rochdale <0.01 1.46 1.21 1.76 Luton <0.01 1.47 1.22 1.77 Sunderland <0.01 1.49 1.24 1.79 Nottingham <0.01 1.54 1.28 1.86 Newcastle <0.01 1.56 1.29 1.88 Note: Ordered by odds ratio for being a victim of crime
5% significant above and below areas in bold
odds ratio of 1 is the average across all NDCs

New Deal for Communities: The National Evaluation 77 Fear of Crime in NDC Areas
Table A9: Health questions
MORI/NOP 2002 Questions
Q
H
E
1
Q
H
E
2
Q
H
E
3
Over the last 12 months, would you say that your health has on the
whole been good, fairly good or not good?
Compared with one year ago , how would you rate your health in
general now?
Much better than one year ago
Somewhat better than one year ago
About the same
Somewhat worse than one year ago
Much worse than one year ago
Do you have any long-standing illness, disability or infirmity? By
long-standing, we mean anything that has troubled you over a
period of time, or that is likely to affect you over a period of time.
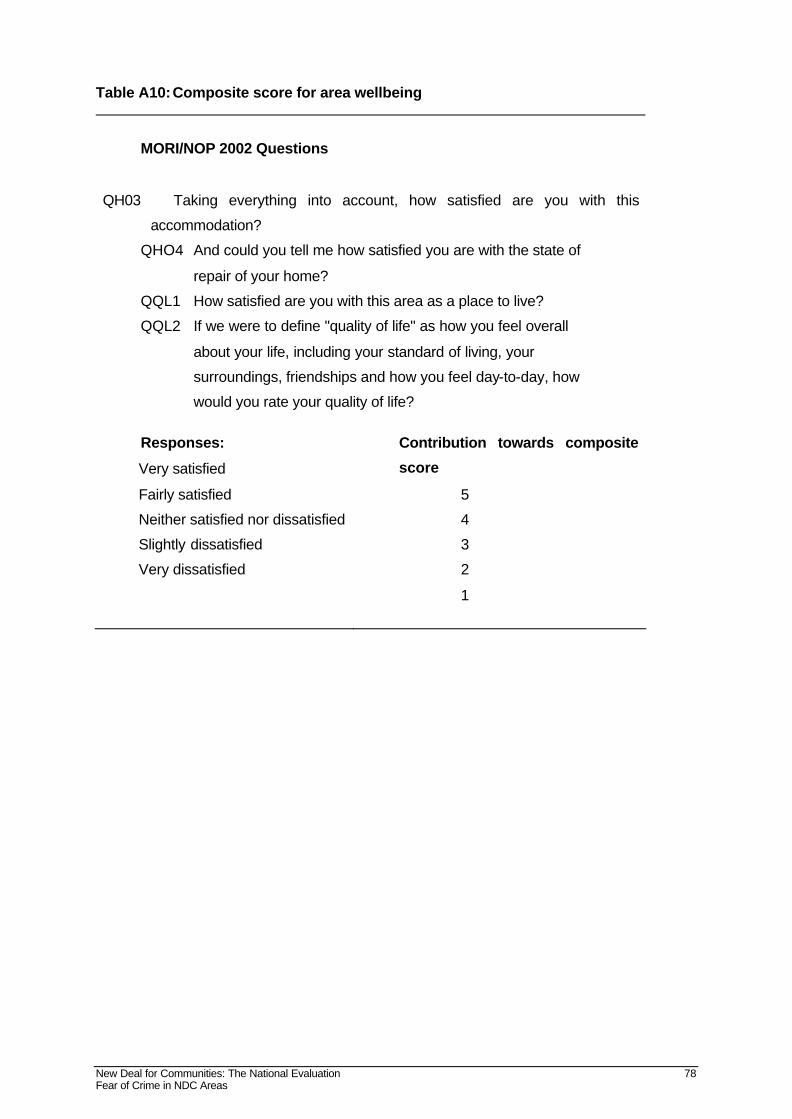
New Deal for Communities: The National Evaluation 78 Fear of Crime in NDC Areas
Table A10: Composite score for area wellbeing
MORI/NOP 2002 Questions
QH03 Taking everything into account, how satisfied are you with this
accommodation?
QHO4 And could you tell me how satisfied you are with the state of
repair of your home?
QQL1 How satisfied are you with this area as a place to live?
QQL2 If we were to define "quality of life" as how you feel overall
about your life, including your standard of living, your
surroundings, friendships and how you feel day-to-day, how
would you rate your quality of life?
Responses:
Very satisfied
Fairly satisfied
Neither satisfied nor dissatisfied
Slightly dissatisfied
Very dissatisfied
Contribution towards composite
score
5
4
3
2
1
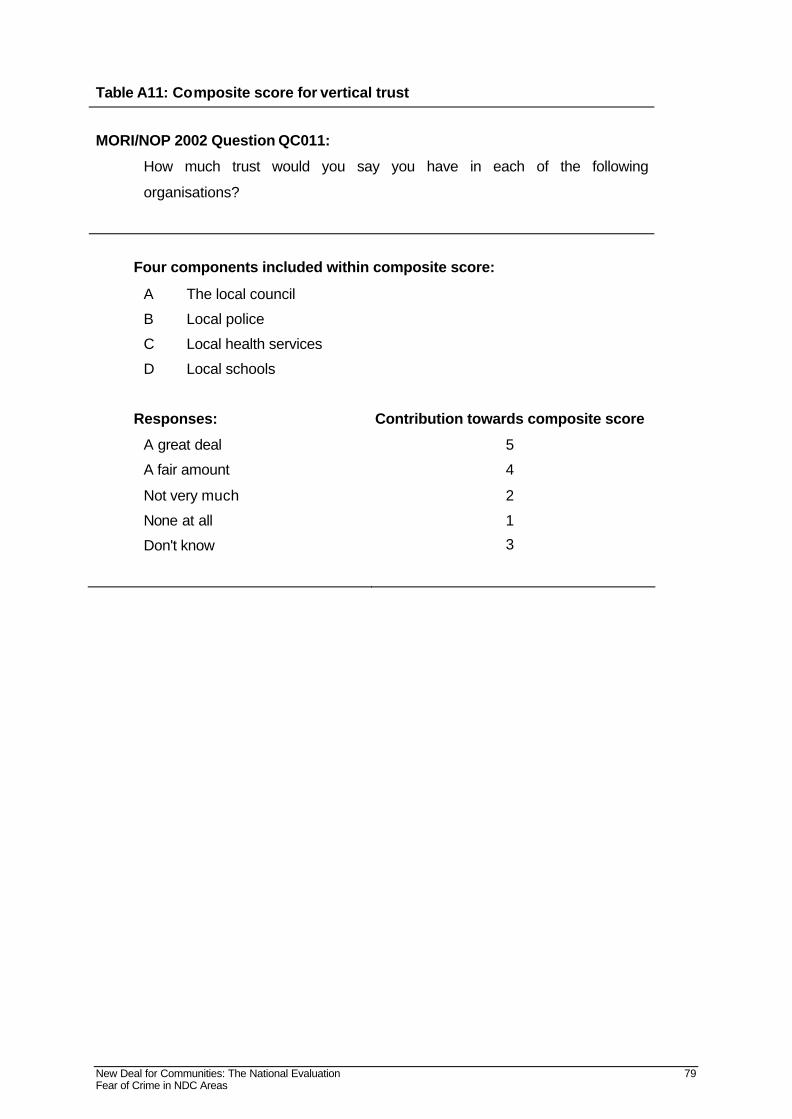
New Deal for Communities: The National Evaluation 79 Fear of Crime in NDC Areas
Table A11: Composite score for vertical trust
MORI/NOP 2002 Question QC011:
How much trust would you say you have in each of the following
organisations?
Four components included within composite score:
A The local council
B Local police
C Local health services
D Local schools
Responses:
A great deal
A fair amount
Not very much
None at all
Don't know
Contribution towards composite score
5
4
2
1
3
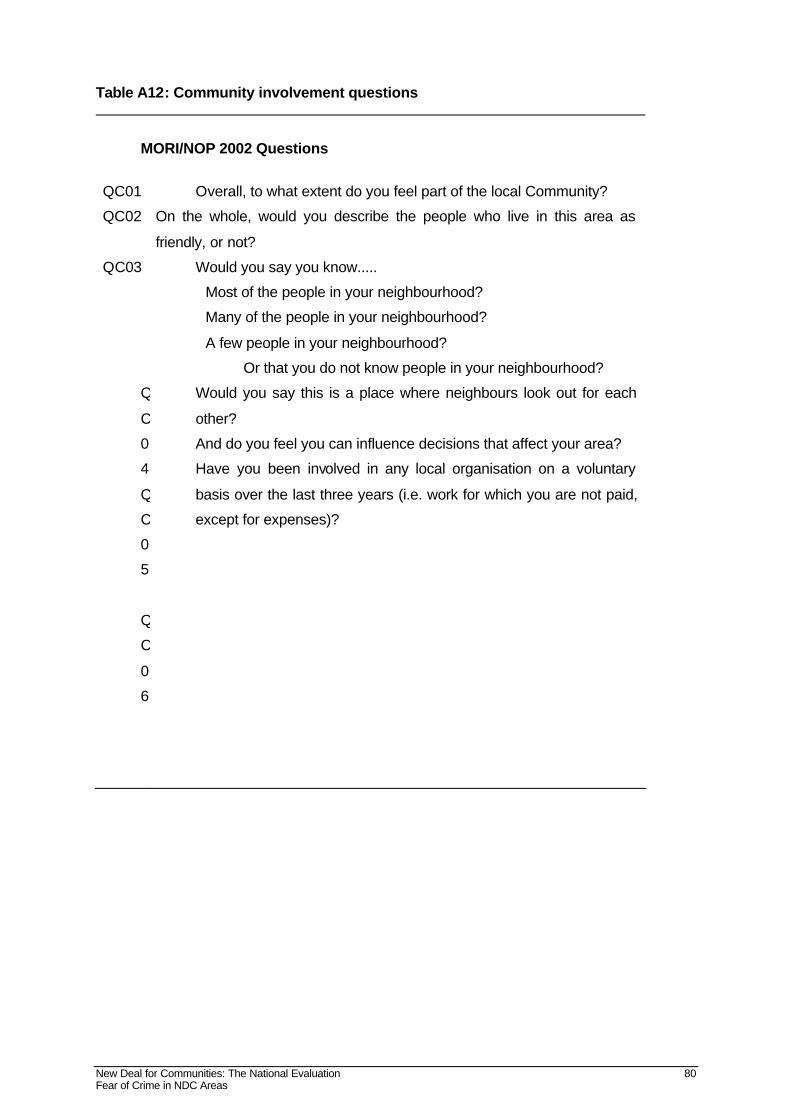
New Deal for Communities: The National Evaluation 80 Fear of Crime in NDC Areas
Table A12: Community involvement questions
MORI/NOP 2002 Questions
QC01
QC02
QC03
Q
C
0
4
Q
C
0
5
Q
C
0
6
Overall, to what extent do you feel part of the local Community?
On the whole, would you describe the people who live in this area as
friendly, or not?
Would you say you know.....
Most of the people in your neighbourhood?
Many of the people in your neighbourhood?
A few people in your neighbourhood?
Or that you do not know people in your neighbourhood?
Would you say this is a place where neighbours look out for each
other?
And do you feel you can influence decisions that affect your area?
Have you been involved in any local organisation on a voluntary
basis over the last three years (i.e. work for which you are not paid,
except for expenses)?
New Deal for Communities: The National Evaluation 81 Fear of Crime in NDC Areas
Table A13: Police Questions
MORI/NOP 2002 Questions
Q
C
R
1
Q
C
1
1
How satisfied or dissatisfied are you with the quality of the service
provided by the police?
Very satisfied
Fairly satisfied
Neither satisfied nor dissatisfied
Fairly dissatisfied
Very dissatisfied
Don't know
How much trust would you say you have in each of the following
organisations? (B) Local police
A great deal
A fair amount
Not very much
None at all
Don't know
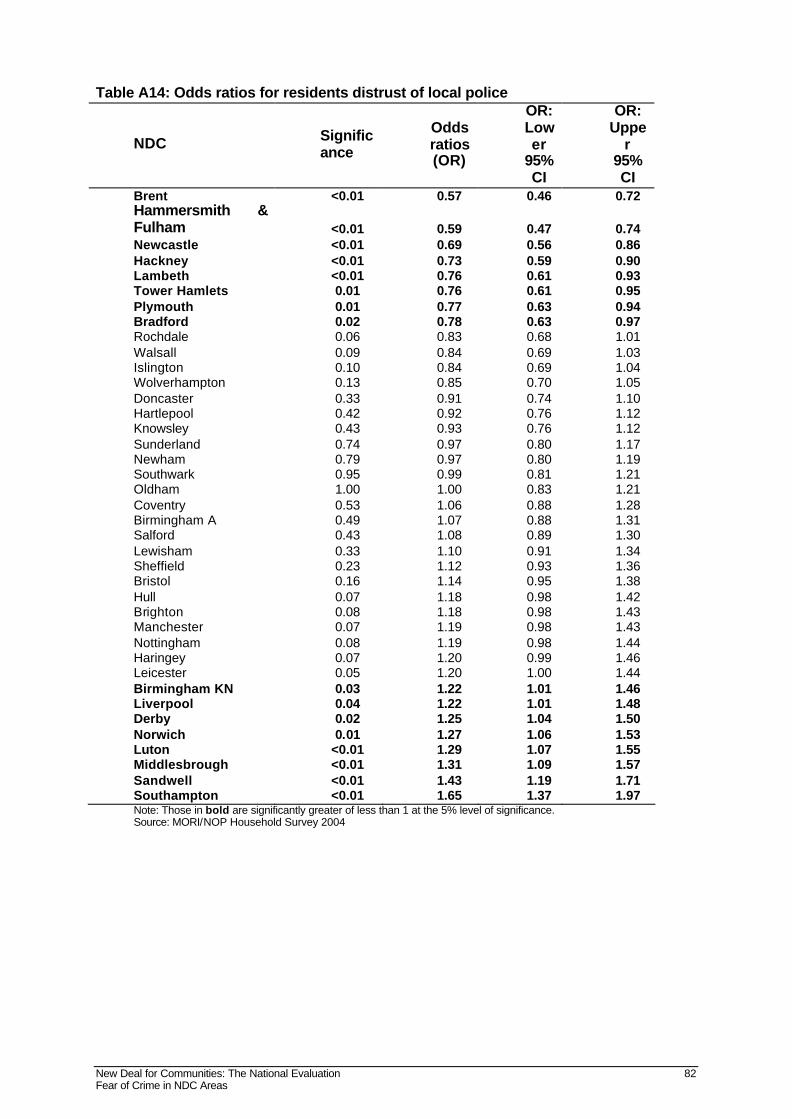
New Deal for Communities: The National Evaluation 82 Fear of Crime in NDC Areas
Table A14: Odds ratios for residents distrust of local police
NDC Significance
Odds ratios (OR)
OR: Lower
95% CI
OR: Uppe
r 95% CI
Brent <0.01 0.57 0.46 0.72 Hammersmith & Fulham <0.01 0.59 0.47 0.74 Newcastle <0.01 0.69 0.56 0.86 Hackney <0.01 0.73 0.59 0.90 Lambeth <0.01 0.76 0.61 0.93 Tower Hamlets 0.01 0.76 0.61 0.95 Plymouth 0.01 0.77 0.63 0.94 Bradford 0.02 0.78 0.63 0.97 Rochdale 0.06 0.83 0.68 1.01 Walsall 0.09 0.84 0.69 1.03 Islington 0.10 0.84 0.69 1.04 Wolverhampton 0.13 0.85 0.70 1.05 Doncaster 0.33 0.91 0.74 1.10 Hartlepool 0.42 0.92 0.76 1.12 Knowsley 0.43 0.93 0.76 1.12 Sunderland 0.74 0.97 0.80 1.17 Newham 0.79 0.97 0.80 1.19 Southwark 0.95 0.99 0.81 1.21 Oldham 1.00 1.00 0.83 1.21 Coventry 0.53 1.06 0.88 1.28 Birmingham A 0.49 1.07 0.88 1.31 Salford 0.43 1.08 0.89 1.30 Lewisham 0.33 1.10 0.91 1.34 Sheffield 0.23 1.12 0.93 1.36 Bristol 0.16 1.14 0.95 1.38 Hull 0.07 1.18 0.98 1.42 Brighton 0.08 1.18 0.98 1.43 Manchester 0.07 1.19 0.98 1.43 Nottingham 0.08 1.19 0.98 1.44 Haringey 0.07 1.20 0.99 1.46 Leicester 0.05 1.20 1.00 1.44 Birmingham KN 0.03 1.22 1.01 1.46 Liverpool 0.04 1.22 1.01 1.48 Derby 0.02 1.25 1.04 1.50 Norwich 0.01 1.27 1.06 1.53 Luton <0.01 1.29 1.07 1.55 Middlesbrough <0.01 1.31 1.09 1.57 Sandwell <0.01 1.43 1.19 1.71 Southampton <0.01 1.65 1.37 1.97 Note: Those in bold are significantly greater of less than 1 at the 5% level of significance. Source: MORI/NOP Household Survey 2004

New Deal for Communities: The National Evaluation 83 Fear of Crime in NDC Areas
Table A15: Odds ratios for residents dissatisfied with service provide by the local police
NDC Significance
Odds ratios (OR)
OR: Lower 95% CI
OR: Upper 95% CI
Hammersmith & Fulham <0.01 0.43 0.32 0.58 Hackney <0.01 0.54 0.42 0.70 Lambeth <0.01 0.57 0.44 0.74 Brent <0.01 0.57 0.44 0.74 Newcastle <0.01 0.60 0.46 0.77 Newham 0.02 0.75 0.59 0.95 Plymouth 0.02 0.78 0.62 0.97 Walsall 0.20 0.87 0.70 1.08 Knowsley 0.33 0.90 0.73 1.11 Islington 0.49 0.92 0.74 1.15 Doncaster 0.69 0.96 0.77 1.19 Sunderland 0.83 0.98 0.79 1.20 Wolverhampton 0.98 1.00 0.81 1.25 Hartlepool 0.95 1.01 0.82 1.24 Norwich 0.89 1.01 0.83 1.25 Rochdale 0.88 1.02 0.83 1.25 Leicester 0.88 1.02 0.83 1.25 Southwark 0.75 1.04 0.83 1.29 Oldham 0.69 1.04 0.85 1.28 Sandwell 0.69 1.04 0.85 1.29 Coventry 0.57 1.06 0.86 1.30 Tower Hamlets 0.43 1.09 0.87 1.37 Bradford 0.38 1.10 0.89 1.37 Hull 0.21 1.14 0.93 1.39 Brighton 0.17 1.15 0.94 1.41 Haringey 0.20 1.15 0.93 1.44 Birmingham KN 0.13 1.16 0.95 1.42 Derby 0.12 1.17 0.96 1.43 Salford 0.12 1.17 0.96 1.44 Lewisham 0.11 1.19 0.96 1.47 Nottingham 0.09 1.20 0.97 1.49 Middlesbrough 0.06 1.21 1.00 1.48 Bristol 0.05 1.22 1.00 1.49 Luton 0.04 1.23 1.01 1.51 Liverpool 0.01 1.29 1.05 1.58 Birmingham A 0.02 1.30 1.05 1.61 Manchester <0.01 1.32 1.08 1.61 Sheffield <0.01 1.42 1.17 1.74 Southampton <0.01 1.84 1.52 2.22 Note: Those in bold are significantly greater of less than 1 at the 5% level of significance. Source: MORI/NOP Household Survey 2004

New Deal for Communities: The National Evaluation 84 Fear of Crime in NDC Areas
Table A16: Multilevel model of mental health wellbeing & fear of crime index with
random intercepts
Notes: stan_mhi= Standardised SF-36 mental health wellbeing score
W1_foc9= Fear of crime index based on 9 questions related to worry
about particular crimes (excluding car crime).
cons= Constant
U0j= Intercept Partnership level variance
e0ij= Individual level variance
Figures in curved brackets after each parameter are the standard errors.

New Deal for Communities: The National Evaluation 85 Fear of Crime in NDC Areas
Table A17: Multilevel model of mental health wellbeing & fear of crime index with random slopes and intercepts
Notes: stan_mhi= Standardised SF-36 mental health wellbeing score
W1_foc9= Fear of crime index based on 9 questions related to worry
about particular crimes (excluding car crime).
cons= Constant
ß1j= Mean slope
U0j= Intercept Partnership level variance
U1j= Covariance, Slope variance
e0ij= Individual level variance
Figures in curved brackets after each parameter are the standard errors.