fcm migration modelling estimation of specific migration...
TRANSCRIPT
Eddo J. Hoekstra (Ed.), Rainer Brandsch, ClaudeDequatre, Peter Mercea, Maria-Rosaria Milana, Angela Störmer, Xenia Trier, Olivier Vitrac Annette Schäfer and Catherine Simoneau
In support of Regulation (EU) No 10/2011 on plastic food contact materials
Practical guidelines on the application of migration modelling for the estimation of specific migration
2015
EUR 27529 EN
211
1 2
h
CCCD
t
CC ni
ni
ni
ni
ni −+
+ +−=∆−


Practical guidelines on the application of migration modelling for the estimation of specific migration

This publication is a Technical report by the Joint Research Centre, the European Commission’s in-house science service. It aims to
provide evidence-based scientific support to the European policy-making process. The scientific output expressed does not imply a
policy position of the European Commission. Neither the European Commission nor any person acting on behalf of the Commission is
responsible for the use which might be made of this publication.
JRC Science Hub
https://ec.europa.eu/jrc
Contact information
E-mail: [email protected]
JRC98028
EUR 27529 EN
ISBN 978-92-79-52790-6 (PDF)
ISSN 1831-9424 (online)
doi:10.2788/04517 (online)
© European Union, 2015
Reproduction is authorised provided the source is acknowledged.
Printed in Italy
All images © European Union 2015
How to cite: E.J. Hoekstra, R. Brandsch, C. Dequatre, P. Mercea, M.R. Milana, A. Störmer, X. Trier, O. Vitrac A. Schäfer and C. Simoneau; Practical guidelines on the application of migration modelling for the estimation of specific migration; EUR 27529 EN; doi:10.2788/04517
Table of contents
1 Introduction.................................................................................................................................................. 5
2 Concepts of migration modelling ......................................................................................................... 7
3 Estimation of diffusion coefficient and polymer specific parameters .................................. 9
3.1 Estimation of diffusion coefficients .......................................................................................... 9
3.2 Estimation of polymer specific parameters ........................................................................ 11
3.2.1 Polyolefines ................................................................................................................................. 11
3.2.2 Polystyrenes ............................................................................................................................... 12
3.2.3 Polyesters .................................................................................................................................... 13
3.2.4 Polyamides .................................................................................................................................. 13
3.2.5 Polyvinylchloride ...................................................................................................................... 14
3.2.6 Other polymers, migrants and other parameter range ............................................ 15
4 Estimation of partition coefficient .................................................................................................... 16
4.1 Monolayers ....................................................................................................................................... 16
4.2 Multi-layers ...................................................................................................................................... 16
5 Other diffusion model input parameters ........................................................................................ 18
5.1 Initial concentration ..................................................................................................................... 18
5.2 Food and food simulant............................................................................................................... 18
5.3 Contact time-temperature conditions ................................................................................... 19
5.4 Contact surface, food volume and effective thickness of food .................................... 19
5.5 Remaining input parameters .................................................................................................... 19
5.6 Plastic multi-layer materials ..................................................................................................... 19
6 Procedures, practical applications, examples .............................................................................. 20
6.1 Compliance testing of substances with specific migration limits (SML) ................ 20
6.2 Optimising compliance control ................................................................................................ 21
7 REFERENCES .............................................................................................................................................. 25
8 Annex – List of symbols and abbreviations ................................................................................... 28
9 Annex – Transport equations .............................................................................................................. 30
9.1 Analytical solution to the diffusion equation ..................................................................... 30
9.2 Numerical approaches ................................................................................................................. 30
10 Annex – List of substances from the positive list of amended Regulation (EU) No 10/2011, indicating their eligibility for migration modelling ......................................................... 32
11 Annex PM/REF-numbers, chemical names, molecular mass, SML-values and highest concentrations of some additives used in polymers ............................................................................ 33
Executive summary
The aim of this document is to assist users of diffusion models to predict conservative, upper bound specific migration values from plastic food contact materials for compliance purposes by providing guidance on the relevant input parameters. This document replaces the previous version "Estimation of specific migration by generally recognised diffusion models in support of EU Directive 2002/72/EC" and updates to the current legal basis (Regulation (EU) No 10/2011) and enables the use of migration models for the estimation of specific migration from plastic multi-layers.
This document represents the current validity of the model input parameters based on constant periodical evaluations of new experimental migration data performed by the Task Force on Migration Modelling chaired by the Joint Research Centre of the European Commission on behalf of Directorate General Health and Food Safety. The members of the Task Force are E.J. Hoekstra, R. Brandsch, C. Dequatre, P. Mercea, M.R. Milana, A. Störmer, X. Trier, O. Vitrac A. Schäfer and C. Simoneau and they are the authors of this practical guidance document.
1 Introduction
The European legislation requires verification of compliance for migration of substances from plastic food contact materials with existing specific and overall migration limits. To do so, there are migration tests to carry out using food/food simulants under the test conditions specified in Regulation (EU) No 10/2011.
Numerous scientific investigations during the last two decades have demonstrated that migration from food contact materials into food and food simulants follow predictable physical processes. In the absence of specific interactions with food, migration is a mass transfer of substances from a plastic material into foodstuffs and obeys in most cases to Fick´s laws of diffusion (Crank, 1979; Vieth, 1991).
Hence, in addition to experimental methods an alternative tool based on theoretical migration estimations can be applicable for verifying the compliance of a migrant. The European Union introduced this option to use generally recognised diffusion models as a novel compliance and quality assurance tool with Directive 2001/62/EC as an amendment of Directive 90/128/EEC. Directive 90/128/EEC was repealed by Directive 2002/72/EC which was repealed by Regulation (EU) No 10/2011. Chapter 2.2.3. of Annex V of this Regulation states that migration modelling can be applied as screening tool for specific migration as long as the method is considered more severe1 than the verification method:
“To screen for specific migration the migration potential can be calculated based on the residual content of the substance in the material or article applying generally recognised diffusion models based on scientific evidence that are constructed such as to overestimate1 real migration”.
Article 18.3 regulates the compliance check using migration models:
“For materials and articles not yet in contact with food screening of compliance with the specific migration limit can be performed applying screening approaches in accordance with the rules set out in Chapter 2, Section 2.2 of Annex V. If a material or article fails to comply with the migration limits in the screening approach a conclusion of non-compliance has to be confirmed by verification of compliance …”.
A generally recognised model must be based on scientific evidence. The realisation of this requirement was achieved within the European project SMT-CT98-7513 “Evaluation of Migration Models in Support of Directive 90/128/EEC” under the 5th Framework Programme for monolayers in contact with well mixed liquids (Hinrichs and Piringer, 2002).
The major objectives of this project were
• To demonstrate that a correspondence between the specific migration limit(SML) and a permitted maximum initial concentration (MIC) of a substance inthe finished product can be established within some boundary limits and
1 Note: a future revision of Regulation (EU) No 10/2011 may change "more severe than" into "at least as severe as"
• To establish documentation that demonstrates the validity of underlyingmigration models for compliance purposes. Consequently, parameters usedin the migration model were selected in a way that an “upper-bound”estimate of migration rate was generated.
The final report of this project was published in a peer-reviewed scientific journal (Begley et al., 2005). This research project validated the diffusion model, the mathematical equations to be applied, the estimation procedure for the mass transfer coefficients and the conditions for their appropriate application with special focus on monolayer polyolefin plastics.
The established diffusion models have the ability to estimate upper bound migration values, provided the boundary and simplifying assumptions are fulfilled. The model is subjected to a continuous update and refinement process and should be practiced only by users with appropriate skills and training.
According to the current state-of-the-art, the scope and applicability of migration prediction comprises the mass transfer of the migrants listed in Annex 10 from plastics when in contact with food simulants according to Regulation (EU) No 10/2011, provided that all the settled conditions are fulfilled.
For other polymers and situations not listed in section 3.2 of this document, diffusion modelling can be used provided that the procedures described in section 3.2.6 have been followed and properly documented to demonstrate that the use of the model in that particular case leads to an overestimation1 of the specific migration compared to experimental testing.
This document represents a continuous update and validation of the fields of application regarding the estimation procedure for diffusion and partition coefficients for a given number of polymers and migrants.
2 Concepts of migration modelling
Migration is a global term to describe a net mass transfer of chemical substances from a packaging material into the food (Crompton, 2007). In the case of plastic food contact materials (FCM) covered by Regulation (EU) No 10/2011, migration includes several macroscopic mass transfer mechanisms including: i) mass diffusion in and through the different plastic materials as well as the liquid or gas phases separating the primary source from the food, and ii) desorption/sorption at the interface between each crossed medium. When it involves fluid phases, migration may also cover an additional transport or mixing effect by advection. In the frame of the FCM legislation, migration modelling is an abstract process aiming at calculating with various simplifications and assumptions the maximum amount of substances which might be transferred to the food in contact. It is important to note that the migration models to be used for the purpose of this document do not seek to reproduce all the details of the real mechanisms (e.g. exact concentration profile in the food or in a particular element of the packaging assembly), but a sufficient realistic and upper value of the concentration in food or in food simulant to reach a decision (Brandsch et al., 2002; Vergnaud and Rosca, 2006; Vitrac and Hayert, 2007a; Gillet et al., 2009b).
To predict the specific migration from plastic food contact materials into a contact medium for a given substance, one needs a scientific model as physical description of the mass transport (see Annex 9), a value or a generally recognized estimation procedure for the diffusion coefficient in plastics (see section 3), and assumptions on partitioning conditions (see section 4) at the plastic-food and the plastic-plastic (multilayer structures) interface.
Migration modelling itself covers several aspects: setting simplifications and coding them along with the geometry and contact conditions in mass balance, initial and boundary conditions; doing calculations; clarifying uncertain parameters, refinement and hinting conclusions.
Examples of constitutive equations for migration problems with constant and uniform diffusion coefficient in each constitutive packaging layer can be found in various text books (Crank, 1975; Piringer and Baner, 2000, 2008; Vergnaud, 1991; Vitrac and Hayert, 2007) and in peer-reviewed journals with sometimes different conventions, as reviewed by Helmroth et al. (2002) and Pocas et al. (2008). For monolayer materials, the most general formulation and analytical solutions with a general boundary condition enabling to simulate solid or liquid food is given by Vitrac and Hayert (2006). They extend earlier solutions proposed by Sagiv (2001, 2002). For multilayer materials, no general analytical solution exists and numerical modelling must be used. Among proposed numerical schemes (Roduit et al., 2005; Tosa et al., 2008; Torres et al., 2012), a general formulation including a very efficient scheme combining semi-analytical solutions and an efficient free-volume formulation is reported by Nguyen et al. (2013).
The margin of overestimation of a specific migration calculated by a migration model can vary with the combination of polymer and migrant, and the contact conditions; it is generally higher in cases of lower diffusion (e.g. high molecular mass migrants, non-polyolefines) but might not overestimate1 in all cases.

Consequently the model shall be used in the range of migrant molecular masses, temperatures and contact conditions that were experimentally tested and used for the derivation of the “upper-bound” diffusion coefficients. Useful explanations to provide guidance to the user of the model are reported in the following paragraphs.
3 Estimation of diffusion coefficient and polymer specific
parameters
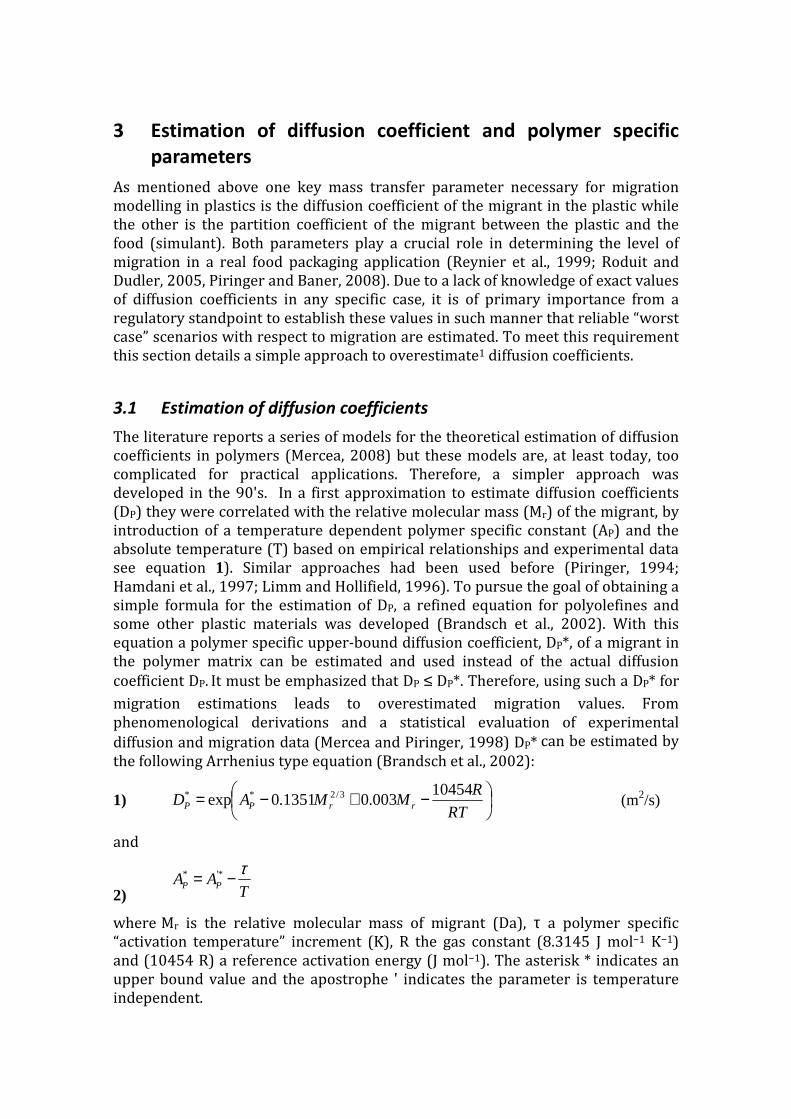
As mentioned above one key mass transfer parameter necessary for migration modelling in plastics is the diffusion coefficient of the migrant in the plastic while the other is the partition coefficient of the migrant between the plastic and the food (simulant). Both parameters play a crucial role in determining the level of migration in a real food packaging application (Reynier et al., 1999; Roduit and Dudler, 2005, Piringer and Baner, 2008). Due to a lack of knowledge of exact values of diffusion coefficients in any specific case, it is of primary importance from a regulatory standpoint to establish these values in such manner that reliable “worst case” scenarios with respect to migration are estimated. To meet this requirement this section details a simple approach to overestimate1 diffusion coefficients.
3.1 Estimation of diffusion coefficients
The literature reports a series of models for the theoretical estimation of diffusion coefficients in polymers (Mercea, 2008) but these models are, at least today, too complicated for practical applications. Therefore, a simpler approach was developed in the 90's. In a first approximation to estimate diffusion coefficients (DP) they were correlated with the relative molecular mass (Mr) of the migrant, by introduction of a temperature dependent polymer specific constant (AP) and the absolute temperature (T) based on empirical relationships and experimental data see equation 1). Similar approaches had been used before (Piringer, 1994; Hamdani et al., 1997; Limm and Hollifield, 1996). To pursue the goal of obtaining a simple formula for the estimation of DP, a refined equation for polyolefines and some other plastic materials was developed (Brandsch et al., 2002). With this equation a polymer specific upper-bound diffusion coefficient, DP*, of a migrant in the polymer matrix can be estimated and used instead of the actual diffusion coefficient DP. It must be emphasized that DP ≤ DP*. Therefore, using such a DP* for
migration estimations leads to overestimated migration values. From phenomenological derivations and a statistical evaluation of experimental diffusion and migration data (Mercea and Piringer, 1998) DP* can be estimated by the following Arrhenius type equation (Brandsch et al., 2002):
1)
−+−=RT
RMMAD rrPP
10454003.01351.0exp 3/2** (m2/s)
and
2) TAA PP
τ−= '**
where Mr is the relative molecular mass of migrant (Da), τ a polymer specific “activation temperature” increment (K), R the gas constant (8.3145 J mol−1 K−1) and (10454 R) a reference activation energy (J mol−1). The asterisk * indicates an upper bound value and the apostrophe ' indicates the parameter is temperature independent.
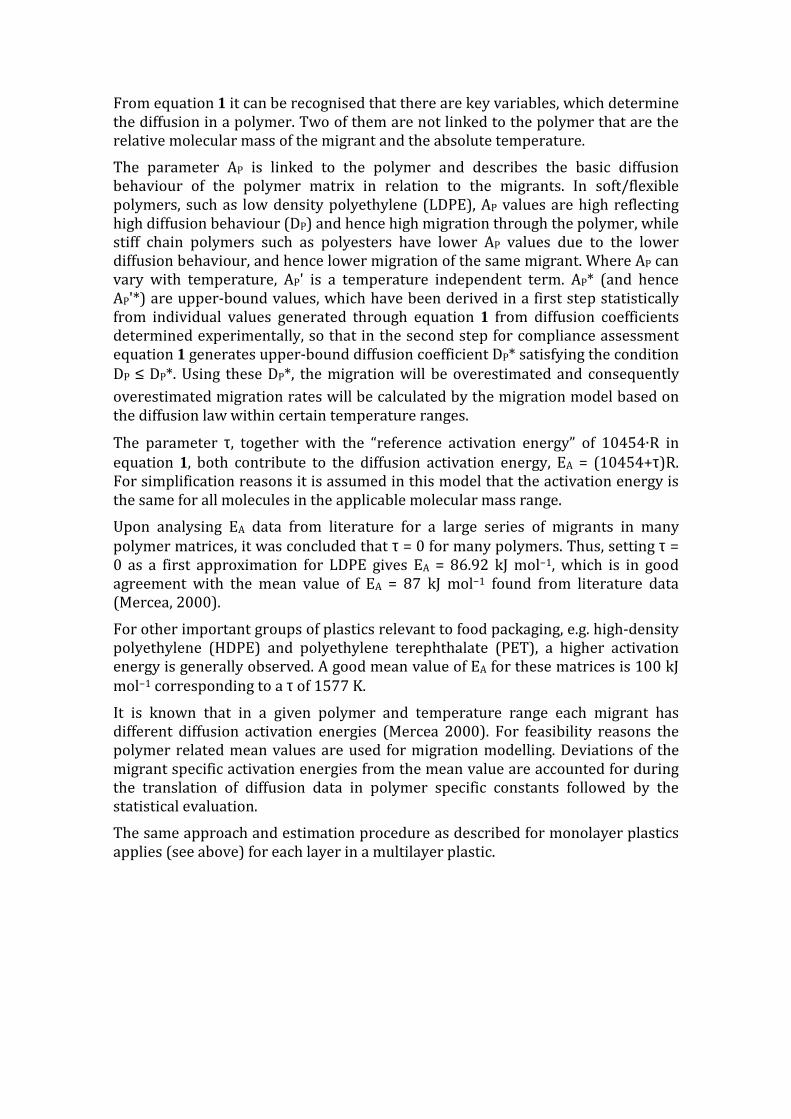
From equation 1 it can be recognised that there are key variables, which determine the diffusion in a polymer. Two of them are not linked to the polymer that are the relative molecular mass of the migrant and the absolute temperature.
The parameter AP is linked to the polymer and describes the basic diffusion behaviour of the polymer matrix in relation to the migrants. In soft/flexible polymers, such as low density polyethylene (LDPE), AP values are high reflecting high diffusion behaviour (DP) and hence high migration through the polymer, while stiff chain polymers such as polyesters have lower AP values due to the lower diffusion behaviour, and hence lower migration of the same migrant. Where AP can vary with temperature, AP' is a temperature independent term. AP* (and hence AP'*) are upper-bound values, which have been derived in a first step statistically from individual values generated through equation 1 from diffusion coefficients determined experimentally, so that in the second step for compliance assessment equation 1 generates upper-bound diffusion coefficient DP* satisfying the condition DP ≤ DP*. Using these DP*, the migration will be overestimated and consequently
overestimated migration rates will be calculated by the migration model based on the diffusion law within certain temperature ranges.
The parameter τ, together with the “reference activation energy” of 10454∙R in equation 1, both contribute to the diffusion activation energy, EA = (10454+τ)R. For simplification reasons it is assumed in this model that the activation energy is the same for all molecules in the applicable molecular mass range.
Upon analysing EA data from literature for a large series of migrants in many polymer matrices, it was concluded that τ = 0 for many polymers. Thus, setting τ = 0 as a first approximation for LDPE gives EA = 86.92 kJ mol−1, which is in good agreement with the mean value of EA = 87 kJ mol−1 found from literature data (Mercea, 2000).
For other important groups of plastics relevant to food packaging, e.g. high-density polyethylene (HDPE) and polyethylene terephthalate (PET), a higher activation energy is generally observed. A good mean value of EA for these matrices is 100 kJ mol−1 corresponding to a τ of 1577 K.
It is known that in a given polymer and temperature range each migrant has different diffusion activation energies (Mercea 2000). For feasibility reasons the polymer related mean values are used for migration modelling. Deviations of the migrant specific activation energies from the mean value are accounted for during the translation of diffusion data in polymer specific constants followed by the statistical evaluation.
The same approach and estimation procedure as described for monolayer plastics applies (see above) for each layer in a multilayer plastic.

3.2 Estimation of polymer specific parameters
The experts participating to the European project SMT-CT98-7513 ‘Evaluation of Migration Models in Support of Directive 90/128/EEC’ agreed to consider the prediction tool fully validated for polyolefines (PO), on the basis of the large number of consistent results. During this project, experts agreed that although much less data were available for the non-PO such as polystyrene (PS), high impact polystyrene (HIPS), polyethylene terephthalate (PET), polyethylene naphthalate (PEN), polyamide (PA), compared to PO, the basis was considered sufficiently solid due to the fact that well-defined migration experiments were selected and performed by internationally recognised laboratories. For the non-PO samples covering the market situation, it could be shown that these equations overestimate the experimental migration values. For polycarbonate (PC) and plasticised polyvinylcholoride (PVC), experts at the time of the SMT project considered the data insufficient to create a reliable set of parameters for migration modelling.
This current update is the result of a dedicated Task Force co-ordinated by the JRC which considered experimental migration data produced since the project SMT (i.e. period 2000-2004) and it takes into the outcome of the evaluation of new (until 2008) available data, which is in particular the case for PET polymer. Newer data have not been assessed yet and will be part of a future revision.
Where appropriate, previous values of the key parameters have been refined. In addition, the migration behaviour of new polymers in terms of their polymer specific constant (AP'*-value) was evaluated based on experimental data and their relevant parameters introduced in this update.
Consequently, the updated requirements for polymer specific migration modelling are described in the following paragraphs.
3.2.1 Polyolefines
The most important polyolefines (PO) used for food packaging are low density polyethylenes (LDPE and LLDPE), high-density polyethylene (HDPE) and various types of polypropylenes (PP-random, PP-homo and PP-blockcopolymer)2. These materials have specific temperature ranges for which the integrity of the food package is maintained. Using product knowledge of these packages, the temperature range to use PO is generally limited to less than 100°C (or 121 °C in case of homo- and random PP) which is also valid for the applicability of migration modelling (Table 1). Under these temperature conditions and with an initial migrant concentration, cP,0, not higher than about 1%, the migration process in PO’s follows the general physical law of diffusion.
2 The copolymers with non-olefinic monomers, e.g. acrylics, vinylics, etc., are not yet evaluated.
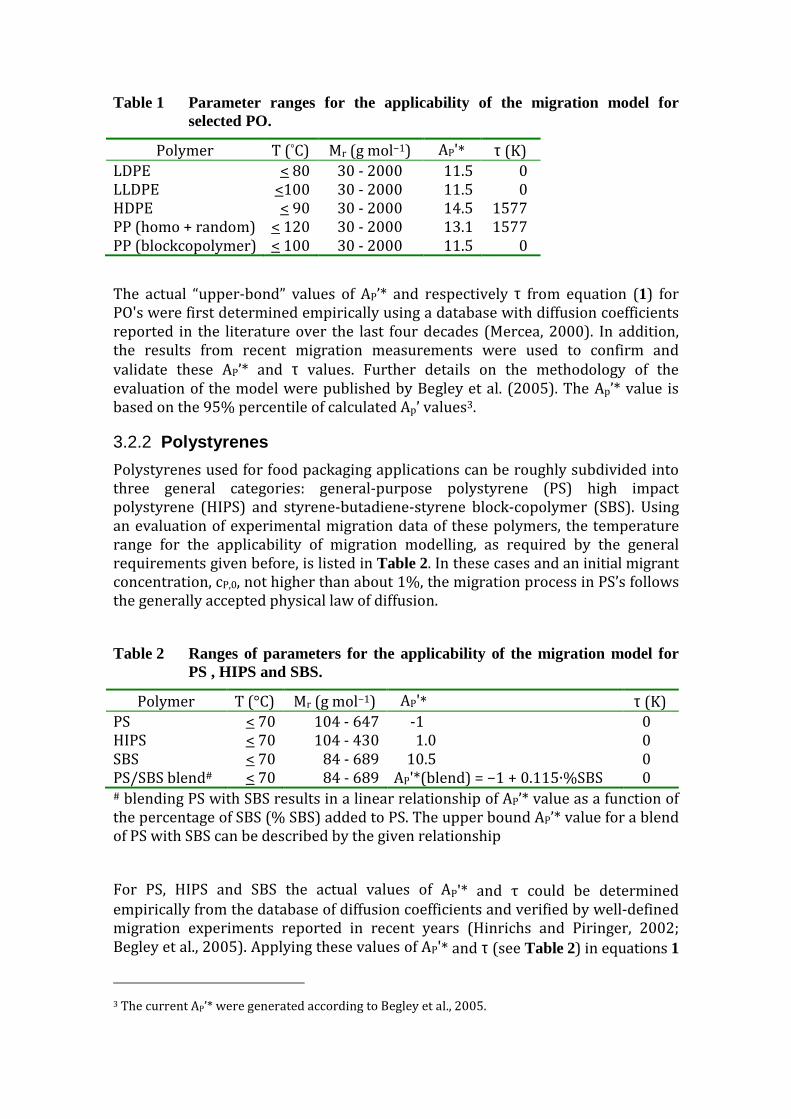
Table 1 Parameter ranges for the applicability of the migration model for selected PO.
Polymer T (°C) Mr (g mol−1) AP'* τ (K) LDPE < 80 30 - 2000 11.5 0 LLDPE <100 30 - 2000 11.5 0 HDPE < 90 30 - 2000 14.5 1577 PP (homo + random) < 120 30 - 2000 13.1 1577 PP (blockcopolymer) < 100 30 - 2000 11.5 0
The actual “upper-bond” values of AP’* and respectively τ from equation (1) for PO's were first determined empirically using a database with diffusion coefficients reported in the literature over the last four decades (Mercea, 2000). In addition, the results from recent migration measurements were used to confirm and validate these AP’* and τ values. Further details on the methodology of the evaluation of the model were published by Begley et al. (2005). The Ap’* value is based on the 95% percentile of calculated Ap’ values3.
3.2.2 Polystyrenes
Polystyrenes used for food packaging applications can be roughly subdivided into three general categories: general-purpose polystyrene (PS) high impact polystyrene (HIPS) and styrene-butadiene-styrene block-copolymer (SBS). Using an evaluation of experimental migration data of these polymers, the temperature range for the applicability of migration modelling, as required by the general requirements given before, is listed in Table 2. In these cases and an initial migrant concentration, cP,0, not higher than about 1%, the migration process in PS’s follows the generally accepted physical law of diffusion.
Table 2 Ranges of parameters for the applicability of the migration model for PS , HIPS and SBS.
Polymer T (°C) Mr (g mol−1) AP'* τ (K) PS < 70 104 - 647 -1 0 HIPS < 70 104 - 430 1.0 0 SBS < 70 84 - 689 10.5 0 PS/SBS blend# < 70 84 - 689 AP'*(blend) = −1 + 0.115∙%SBS 0 # blending PS with SBS results in a linear relationship of AP’* value as a function of the percentage of SBS (% SBS) added to PS. The upper bound AP’* value for a blend of PS with SBS can be described by the given relationship
For PS, HIPS and SBS the actual values of AP'* and τ could be determined empirically from the database of diffusion coefficients and verified by well-defined migration experiments reported in recent years (Hinrichs and Piringer, 2002; Begley et al., 2005). Applying these values of AP'* and τ (see Table 2) in equations 1
3 The current AP’* were generated according to Begley et al., 2005.
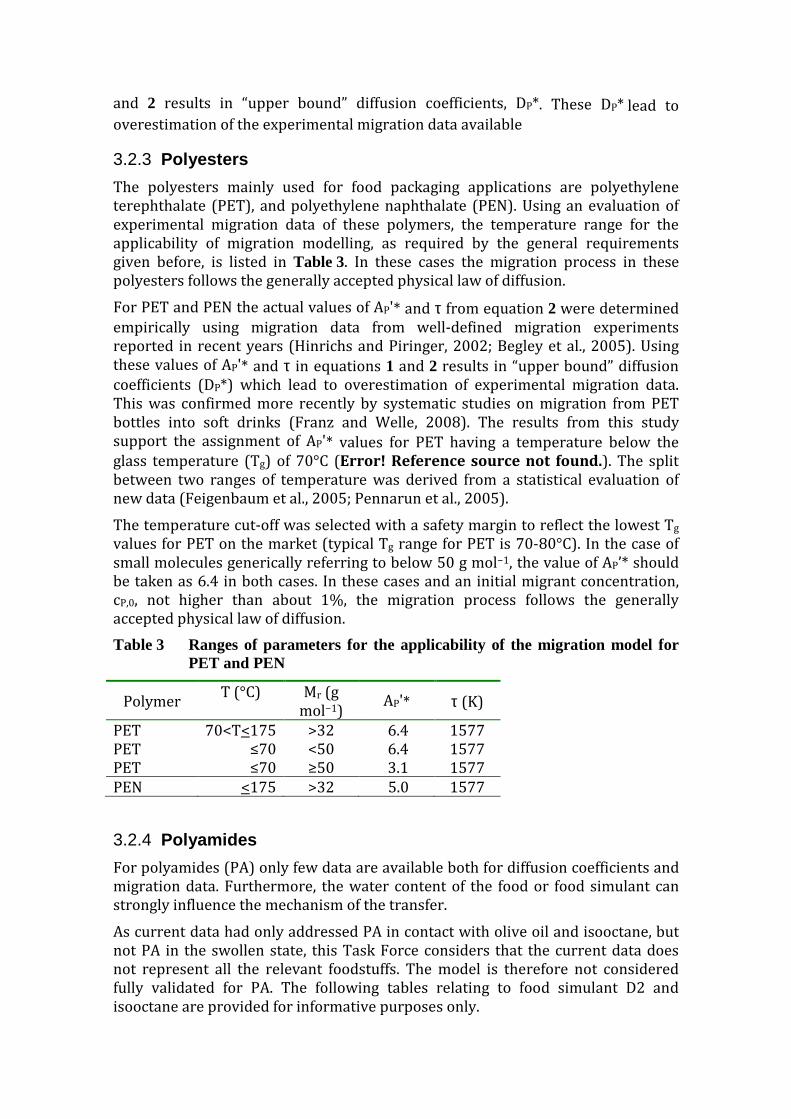
and 2 results in “upper bound” diffusion coefficients, DP*. These DP* lead to overestimation of the experimental migration data available
3.2.3 Polyesters
The polyesters mainly used for food packaging applications are polyethylene terephthalate (PET), and polyethylene naphthalate (PEN). Using an evaluation of experimental migration data of these polymers, the temperature range for the applicability of migration modelling, as required by the general requirements given before, is listed in Table 3. In these cases the migration process in these polyesters follows the generally accepted physical law of diffusion.
For PET and PEN the actual values of AP'* and τ from equation 2 were determined empirically using migration data from well-defined migration experiments reported in recent years (Hinrichs and Piringer, 2002; Begley et al., 2005). Using these values of AP'* and τ in equations 1 and 2 results in “upper bound” diffusion coefficients (DP*) which lead to overestimation of experimental migration data. This was confirmed more recently by systematic studies on migration from PET bottles into soft drinks (Franz and Welle, 2008). The results from this study support the assignment of AP'* values for PET having a temperature below the glass temperature (Tg) of 70°C (Error! Reference source not found.). The split between two ranges of temperature was derived from a statistical evaluation of new data (Feigenbaum et al., 2005; Pennarun et al., 2005).
The temperature cut-off was selected with a safety margin to reflect the lowest Tg values for PET on the market (typical Tg range for PET is 70-80°C). In the case of small molecules generically referring to below 50 g mol−1, the value of AP’* should be taken as 6.4 in both cases. In these cases and an initial migrant concentration, cP,0, not higher than about 1%, the migration process follows the generally accepted physical law of diffusion.
Table 3 Ranges of parameters for the applicability of the migration model for PET and PEN
Polymer T (°C) Mr (g
mol−1) AP'* τ (K)
PET 70<T<175 >32 6.4 1577 PET ≤70 <50 6.4 1577 PET ≤70 ≥50 3.1 1577 PEN <175 >32 5.0 1577
3.2.4 Polyamides
For polyamides (PA) only few data are available both for diffusion coefficients and migration data. Furthermore, the water content of the food or food simulant can strongly influence the mechanism of the transfer.
As current data had only addressed PA in contact with olive oil and isooctane, but not PA in the swollen state, this Task Force considers that the current data does not represent all the relevant foodstuffs. The model is therefore not considered fully validated for PA. The following tables relating to food simulant D2 and isooctane are provided for informative purposes only.
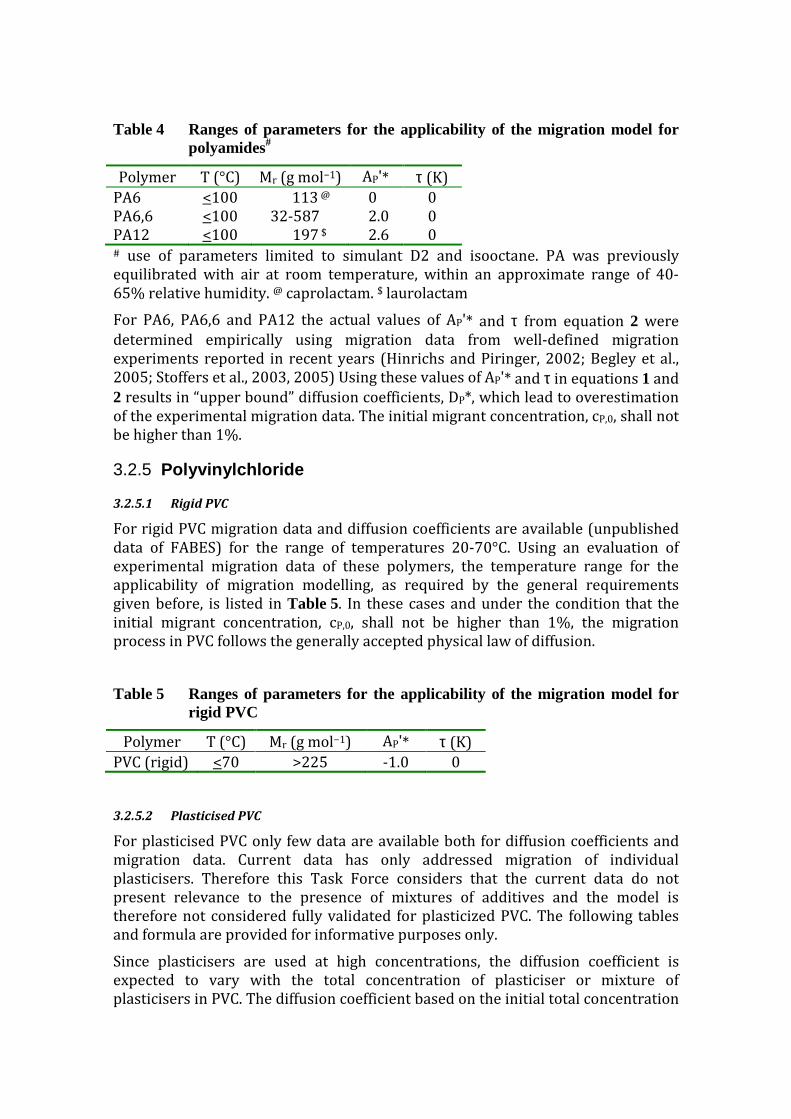
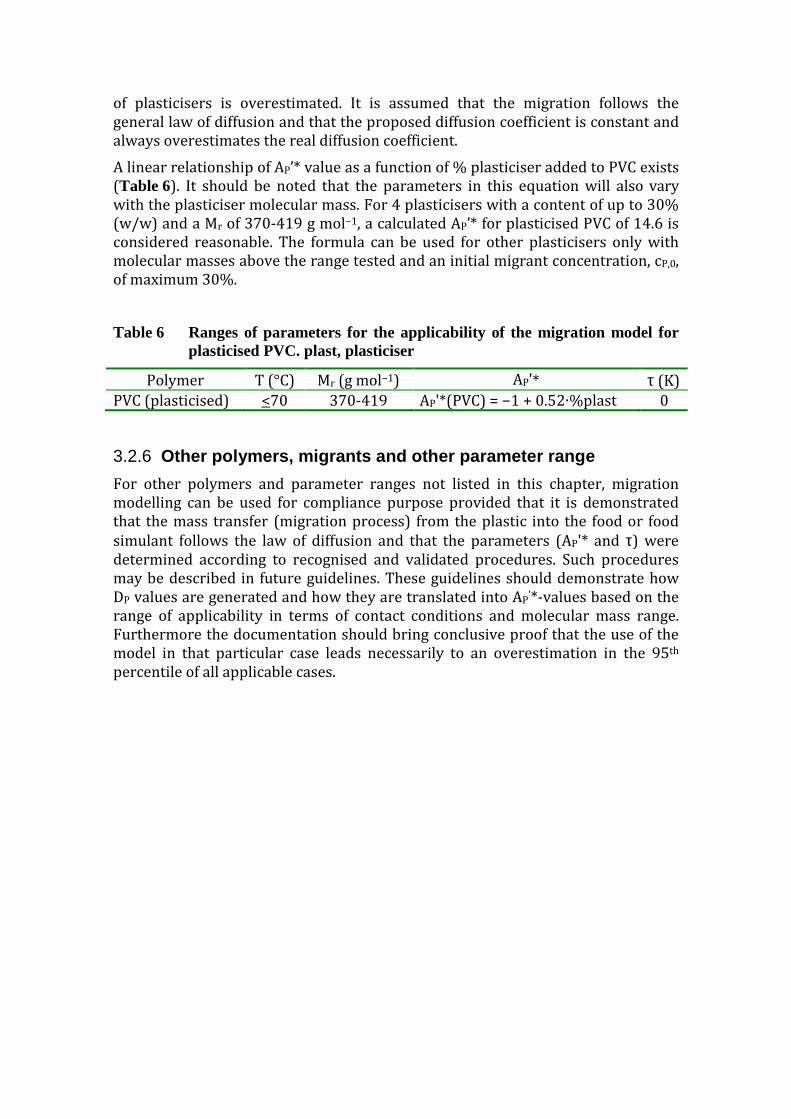
Table 4 Ranges of parameters for the applicability of the migration model for polyamides#
Polymer T (°C) Mr (g mol−1) AP'* τ (K) PA6 <100 113 @ 0 0 PA6,6 <100 32-587 2.0 0 PA12 <100 197 $ 2.6 0 # use of parameters limited to simulant D2 and isooctane. PA was previously equilibrated with air at room temperature, within an approximate range of 40-65% relative humidity. @ caprolactam. $ laurolactam
For PA6, PA6,6 and PA12 the actual values of AP'* and τ from equation 2 were determined empirically using migration data from well-defined migration experiments reported in recent years (Hinrichs and Piringer, 2002; Begley et al., 2005; Stoffers et al., 2003, 2005) Using these values of AP'* and τ in equations 1 and 2 results in “upper bound” diffusion coefficients, DP*, which lead to overestimation of the experimental migration data. The initial migrant concentration, cP,0, shall not be higher than 1%.
3.2.5 Polyvinylchloride
3.2.5.1 Rigid PVC
For rigid PVC migration data and diffusion coefficients are available (unpublished data of FABES) for the range of temperatures 20-70°C. Using an evaluation of experimental migration data of these polymers, the temperature range for the applicability of migration modelling, as required by the general requirements given before, is listed in Table 5. In these cases and under the condition that the initial migrant concentration, cP,0, shall not be higher than 1%, the migration process in PVC follows the generally accepted physical law of diffusion.
Table 5 Ranges of parameters for the applicability of the migration model for rigid PVC
Polymer T (°C) Mr (g mol−1) AP'* τ (K) PVC (rigid) <70 >225 -1.0 0
3.2.5.2 Plasticised PVC
For plasticised PVC only few data are available both for diffusion coefficients and migration data. Current data has only addressed migration of individual plasticisers. Therefore this Task Force considers that the current data do not present relevance to the presence of mixtures of additives and the model is therefore not considered fully validated for plasticized PVC. The following tables and formula are provided for informative purposes only.
Since plasticisers are used at high concentrations, the diffusion coefficient is expected to vary with the total concentration of plasticiser or mixture of plasticisers in PVC. The diffusion coefficient based on the initial total concentration
of plasticisers is overestimated. It is assumed that the migration follows the general law of diffusion and that the proposed diffusion coefficient is constant and always overestimates the real diffusion coefficient.
A linear relationship of AP’* value as a function of % plasticiser added to PVC exists (Table 6). It should be noted that the parameters in this equation will also vary with the plasticiser molecular mass. For 4 plasticisers with a content of up to 30% (w/w) and a Mr of 370-419 g mol−1, a calculated AP’* for plasticised PVC of 14.6 is considered reasonable. The formula can be used for other plasticisers only with molecular masses above the range tested and an initial migrant concentration, cP,0, of maximum 30%.
Table 6 Ranges of parameters for the applicability of the migration model for plasticised PVC. plast, plasticiser
Polymer T (°C) Mr (g mol−1) AP'* τ (K) PVC (plasticised) <70 370-419 AP'*(PVC) = −1 + 0.52∙%plast 0
3.2.6 Other polymers, migrants and other parameter range
For other polymers and parameter ranges not listed in this chapter, migration modelling can be used for compliance purpose provided that it is demonstrated that the mass transfer (migration process) from the plastic into the food or food simulant follows the law of diffusion and that the parameters (AP'* and τ) were determined according to recognised and validated procedures. Such procedures may be described in future guidelines. These guidelines should demonstrate how DP values are generated and how they are translated into AP'*-values based on the range of applicability in terms of contact conditions and molecular mass range. Furthermore the documentation should bring conclusive proof that the use of the model in that particular case leads necessarily to an overestimation in the 95th percentile of all applicable cases.
4 Estimation of partition coefficient
4.1 Monolayers
In absence of specific data, in order to model worst case scenarios, the partition coefficient of the migrant between polymer P and food F should be taken as KP,F = 1, which means that the substance is well soluble in F. This option leads to the highest migration values, i.e. complete transfer of the migrant from the food contact material to food at equilibrium. The question whether this equilibrium partitioning will be reached in a practical application, depends on the polymer type and more specifically on the diffusion behaviour of the polymer under the practical contact conditions. For all other cases, that is for which the migrant is only sparingly soluble in F the partition constant should be set at KP,F = 1000, e.g. for lipophilic substances when the polymeric material is in contact with aqueous food/simulant.
4.2 Multi-layers
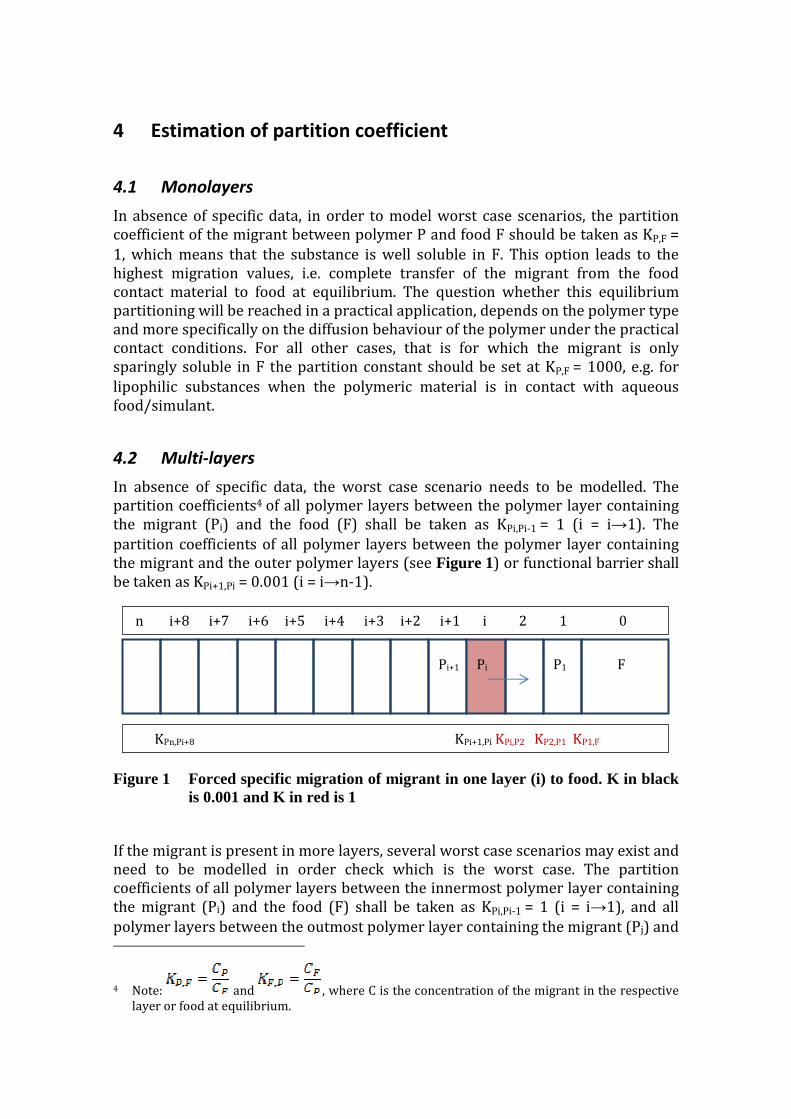
In absence of specific data, the worst case scenario needs to be modelled. The partition coefficients4 of all polymer layers between the polymer layer containing the migrant (Pi) and the food (F) shall be taken as KPi,Pi-1 = 1 (i = i→1). The partition coefficients of all polymer layers between the polymer layer containing the migrant and the outer polymer layers (see Figure 1) or functional barrier shall be taken as KPi+1,Pi = 0.001 (i = i→n-1).
Figure 1 Forced specific migration of migrant in one layer (i) to food. K in black is 0.001 and K in red is 1
If the migrant is present in more layers, several worst case scenarios may exist and need to be modelled in order check which is the worst case. The partition coefficients of all polymer layers between the innermost polymer layer containing the migrant (Pi) and the food (F) shall be taken as KPi,Pi-1 = 1 (i = i→1), and all polymer layers between the outmost polymer layer containing the migrant (Pj) and
4 Note: and , where C is the concentration of the migrant in the respective layer or food at equilibrium.
n i+8 i+7 i+6 i+5 i+4 i+3 i+2 i+1 i 2 1 0
KPn,Pi+8 KPi+1,Pi KPi,P2 KP2,P1 KP1,F
Pi P1 Pi+1 F

the outermost polymer layer (Pn) or functional barrier shall be taken as KPj+1,Pj = 0.001 (j = j→n-1). For each scenario the partition coefficient between one particular polymer layer containing the migrant (Px) and its outer layer is set to K
Px+1,Px = 0.001 (x = x→j-1), whereas all the remaining partition coefficients are set at KPx,Px-1 = 1 (x = i+1→x).
Figure 2 Example of scenario’s of forced specific migration of one migrant that is present in three layers (i, j, x), to food. In this example three scenario's are necessary to be calculated. K in black is 0.001 and K in red is 1
n i+8 i+7 j i+5 i+4 x i+2 i+1 i 2 1 0
KPn,Pi+8 KPj+1,Pj KPj,Pj-1 KPx+1,Px KPx,Px-1 KPi+1,Pi KPi,P2 KP2,P1 KP1,F
Scenario 1: only migration from Pi to food
n i+8 i+7 j i+5 i+4 x i+2 i+1 i 2 1 0
KPn,Pi+8 KPj+1,Pj KPx+1,Px KPx,Px-1 ← → KPi+1,Pi KPi,P2 KP2,P1 KP1,F
Scenario 2: migration from Px and Pi to food
n i+8 i+7 j i+5 i+4 x i+2 i+1 i 2 1 0
KPn,Pi+8 KPj+1,Pj KPj,Pj-1← → KPx+1,Px KPx,Px-1 ←→ KPi+1,Pi KPi,P2 KP2,P1 KP1,F
Scenario 3: migration from Pj, Px and Pi to food
Pi
Pi
Pi P1 Pi+1 F
F P1 Pi+1
Pi+1 P1 F
5 Other diffusion model input parameters
5.1 Initial concentration
The initial concentration (cP,0) of all substances listed in Annex 10 shall not be higher than 1%. A level above 1% may cause a plasticising effect in given polymers and diffusion modelling cannot be used. If a plasticising effect is observed, the use of the migration model is possible only with an AP-value accounting for the plasticising effect and determined by experiments.
As an exception the concentration of plasticisers in plasticised PVC may be up to 30% under the condition that the relative molecular mass is 225 g mol−1 or higher (see section 3.2.5.2).
When a substance is blooming out of the polymer, the substance is not homogenously distributed in the polymer anymore and modelling is not applicable. The problem of blooming must be considered case by case with respect to the polymer/migrant combination investigated. It is well known that antistatic and antifogging agents typically incorporated into polyolefines deliberately migrate at the surface of the polymeric materials. The same substance does not bloom out from a more polar polymeric material like polyester or polyamide. The user of the migration model is strongly advised to carefully consider the possibility of blooming, to avoid application of the migration model for special cases where blooming influences the level of migration.
5.2 Food and food simulant
Food and food simulant are not as such selected in the diffusion model. They are represented by the density and the diffusion coefficient in food. Regulation (EU) No 10/2011 sets by convention the density of food at 1 kg dm−3. For foods with a higher density the specific migration will be underestimated when the conventional value is used. Therefore it is recommended to use a density of food of 1 kg dm−3 for polymers in contact with unknown foods, for foods with a lower density then the conventional one or for liquid food simulants. If the density of the food is known and higher than the conventional density then the use of real density of the worst case food is recommended.
To fulfil the condition of “well-mixing” the diffusion coefficient in the food or liquid food simulant is set as default at 10-6 m2 s−1.
Migration models cannot be used when swelling of the polymer occurs. Examples of swelling are polyolefines in contact with iso-octane or other combinations of polymers with test media having a high swelling power, because according to the initial and boundary conditions, it is assumed that diffusion in the polymer is uniform and does not vary with time.
5.3 Contact time-temperature conditions
The contact time and temperature shall be chosen such that they represent the worst foreseeable conditions, following relevant sections of Chapter 2 of Annex V of Regulation (EU) No 10/2011. The highest modelled specific migration shall be compared with the SML.
5.4 Contact surface, food volume and effective thickness of food
The contact surface and volume of food shall be chosen such that they represent the worst case foreseeable surface-to-volume ratio or 6 dm2/kg for articles specified in Article 17.2 of Regulation (EU) No 10/2011. For caps, gaskets, stoppers and other sealing Article 17.3 additional rules are applicable (see also Technical guidelines for compliance testing in the framework of Regulation (EU) No 10/2011 on plastic food contact materials, 2016)
The effective thickness of food is the ratio of the volume of food and the contact surface. For a surface to volume ratio of 6 dm²/kg this corresponds to a food thickness of 16666,7 µm in the model.
5.5 Remaining input parameters
For the remaining input parameters, i.e. thickness and density of polymer or polymer layers, the real values have to be used.
5.6 Plastic multi-layer materials
During manufacturing and storage of plastic multi-layer materials diffusion and partition processes between the layers of the material already occur.
If the plastic multi-layer material is stored by piling sheets or articles on each other, diffusion between the different sheets occurs. There are three different possibilities for piling: 1) all food contact layers come into contact with the non-food contact layer of the next sheet (set-off), 2) the food contact layers come into contact with the food contact layer of the next sheet and 3) the food contact layers come randomly into contact with the food contact layer or the non-food contact layer of the next sheet.
If the plastic multi-layer material is put and stored on a roll the food contact layer comes into contact with the non-food contact layer (set-off).
For migration modelling of plastic multi-layer materials these processes and the resulting phenomena before contact with food need to be taken into account. Otherwise the migration model result may underestimate the real specific migration.
6 Procedures, practical applications, examples
The model allows the following estimations:
(i) Based on knowledge of the existing initial concentration of a migrant of known molecular mass in a polymer, its specific time and temperature dependent migration into a given food simulant or food can be calculated from equation 3 (Annex 9.1) or numerical solutions.
(ii) Reversely, based on a given migration limit or SML value from legislation, the maximum initial concentration (MIC) of a migrant of known molecular mass in a polymer that can be used in a food contact can be estimated from equation 7 (Annex 9.1) or numerical solutions.
As a general rule: in cases where the migration estimation scheme outlined above leads to results which are above the specific migration limit (SML), an experimental test of compliance is compulsory.
If the upper-bound polymer specific AP’* value is not known or applicable from the tables given in Chapter 3.2, migration model cannot be used and the procedures given in section 3.2.6 shall be carried out in order to extent the applicability of the migration models.
6.1 Compliance testing of substances with specific migration limits
(SML)
One major objective of this document is to give guidance for compliance testing. Consequently, one major field of application concerns the control for compliance of substances listed in the Regulation (EU) No 10/2011 and its amendments with respect to their SML’s.
It must be emphasised that at the present stage of knowledge the migration model is only suitable for the polymers and under the conditions described in chapter 3.2. In addition, Annex 10 lists all substances in Regulation (EU) No 10/2011 and indicates their theoretical eligibility for modelling based on the criteria listed below. However, before applying the model one always has to ensure that the model assumptions (Chapter 2) are fulfilled for the substance(s) considered.
The following criteria for eligibility for migration modelling are applied:
All organic, non-gaseous substances with a well-defined molecular mass, soluble in the polymeric matrix, are eligible for migration modelling.
All polymeric additives with a well-defined molecular mass distribution, i.e. accessible by gel permeation chromatography, mass spectrometry or any other analytical technique capable to deliver the molecular mass distribution are eligible for migration modelling. Migration modelling is applicable provided that the actual molecular mass distribution of the polymeric additive under investigation is available by application of a suitable analytical technique. Polymeric additives are marked with "pa" in Annex 10. An overestimated modelled migration result is obtained when the lowest molecular mass of the mass distribution is used for the estimation of the diffusion coefficients.
All organic substances known to deliberately bloom out from some polymeric materials, e.g. antistatic or antifogging agents incorporated in polyolefines, were included in the list under reserve. Migration modelling is applicable only in those cases (polymer/migrant combinations), in which blooming does not occur.
Note: Blooming out of a given component from the plastic occurs if the difference in polarity between the component and the polymeric matrix is high resulting in low solubility of the component in the polymer. Furthermore blooming often occurs when substances have a surfactant structure (polar head, non-polar tail). Due to blooming the component is migrating in short time at the polymer/air interface resulting in high migration values for short contact times. From migration modelling point of view the assumption that a migrant is distributed homogeneously in P, is not fulfilled anymore and accordingly if blooming occurs migration modelling cannot be applied.
All organic mixtures with undefined molecular mass, typically derived from natural sources like fats and oils, rosins, waxes, starch, proteins, cellulose, cotton are not eligible for migration modelling. However a specific substance with well-defined molecular mass below 2000 g mol−1 that is a component of a mixture can be addressed by migration modelling estimations.
All inorganic substances, metals, metal oxides, metal salts, etc. are generally not eligible for migration modelling unless differently indicated in Annex 10.
This list in Annex 10 is a reference for users, who perform estimations. Once selected from this list, migration modelling can be applied for the substance, provided the substance is contained in one of the polymers specified in chapter 3.2 and also the proper value for the partition coefficient , KP,F is applied.
6.2 Optimising compliance control
When the necessary inputs to the model are available, migration models can be used to optimise compliance control strategies.
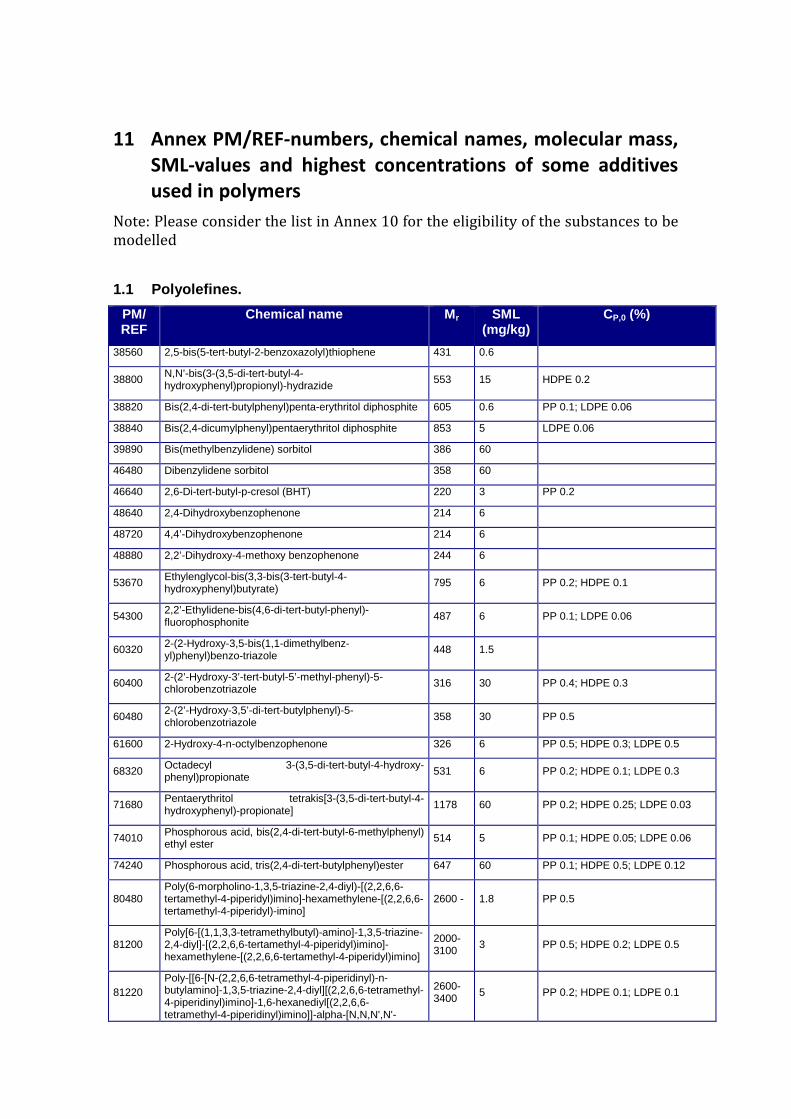
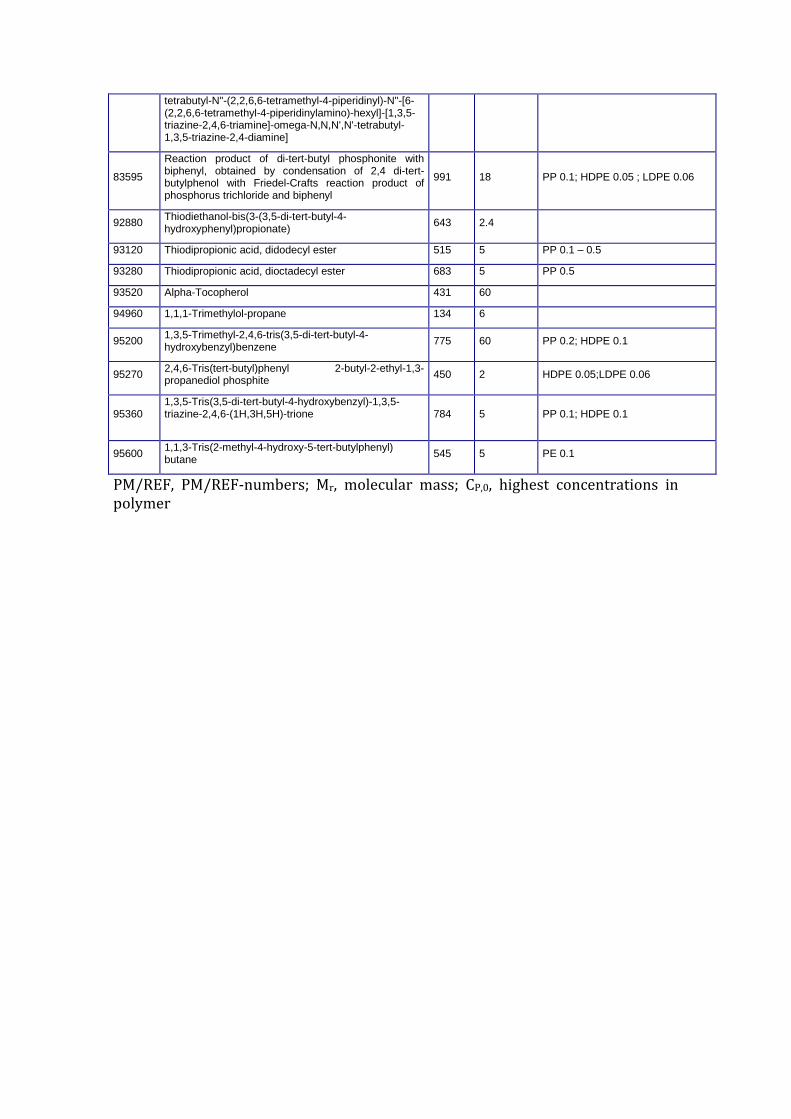
Tables of FCM and PM/REF-numbers, chemical names, Mr-, SML-values and highest concentrations (cP,0) of some additives usually used in polyolefines and non-polyolefines can be found in Annex 11.
It is the responsibility for every company involved in the production, conversion, import and retail sale of FCM to demonstrate compliance with existing EU legislation. National authorities in turn are responsible to enforce that the legislation is followed. To fulfil their obligations, both companies (or the contracted control laboratories) and enforcement employ compliance testing of FCMs, e.g. by experimental chemical testing of migration and/or by migration modelling.
The migration results obtained by modelling are however only as good as the data put into the model, and only valid if the assumptions of the model are fulfilled. In order to use migration models successfully, it is essential to have a well-described FCM. This typically requires good traceability and information flow through the production and supply chain, from raw material producers, to the food industry and to the “seller” of the finished FCM article. It should also be emphasized, that migration models can determine only the migration of known substances with known initial concentrations.
When testing compliance of a plastic FCM, the first question to ask is which type of polymer is at hand – if in doubt infrared spectroscopy (FTIR) can possibly be of
some help. If the polymer is listed in tables of this guide, migration modelling can be applied. If not, the polymer specific constants (AP'* and τ) must be determined as described in section 3.2.6 and then the migration model can be applied. Otherwise experimental migration-chemical testing needs to be performed.
Apart from the polymer identity, it is crucial to know
1. Which releasable substances are present in the objects to test (e.g. additives, residual amounts of monomers)?
2. What are their initial concentrations, e.g. amount of additive as seen from formulation, or determined in an experimental test (see guidance in Feigenbaum et al. (2002))?
3. What is the “worst-case” foreseeable use (type of food, maximum temperature and maximum packaging time) in practical life, based on the function of FCM and any given advisory to the user?
4. What is the intended shape of the final article, specifically what surface area will contact what portion of food, i.e. the surface-to-volume ratio?
5. Which of these substances can be used in practice in the polymer and fulfil the limitations of substances that can be modelled, e.g. blooming agents are not homogeneously distributed in the polymer and hence cannot be modelled?
In practice it is a challenge to obtain all the necessary information (Petersen et al., 2005), of which 1, 3 and 4 are inherent requirements to any control laboratories that do experimental testing, but 2 and 5 are specific to migration modelling. Typically two situations exist (Figure 3):
• All necessary information is available. An example is when a raw material producer tests the compliance of polymer samples representative for its final intended use, which is known to them, e.g. coffee cups.
• Necessary information is missing. An example is when somewhere in the marketing stage of the product, an intermediate product manufacturer has not documented the contacts of the producer of their starting material for retrieval of the supporting documents for the purpose of the enforcement authorities. This situation is against Art. 5 of Regulation (EC) No 2023/2006 and Art. 17 of the Framework Regulation (EC) No 1935/2004.
The quality of information received should always be judged critically, as is the case with experimental results. When the data are found to be trustworthy, the application of a migration model is straightforward and extremely time saving. In particular if the migration model predicts migration below the SML, no further action needs to be taken. If the migration model predicts migration above the SML, experimental migration testing must be conducted. An additional useful option offered by the migration model to producers is to use the migration model for the calculation of the maximum allowed initial concentration (MIC). This information allows for the reformulation of the FCM or for the restriction of use of the product (e.g. food types, lower contact temperatures, times and/or surface-to-volume ratios) to keep migration below the SML.
As a first step in enforcement the authorities have to make an effort to retrieve the information from the production chain. If the information is available migration modelling can follow as described above. If the substances that migrate, are known, but their cP,0 are unknown, then there are three possibilities. The producer needs to retrieve from the company the usual max. concentrations (cP,0) of additives that can be used in various polymers (listed in tables 4.2.1 (PO) and 4.2.2 (non-PO)). These substances are extracted from the table in Annex 10, based on the usual compositions for a given polymer. The tables were prepared by consulting the most important producers of plastic materials and the secondary literature referring additives for plastic materials (Zweifel, 2001). In addition to the identification numbers the upper limits of initial concentrations reported to be used in plastic materials for food contact are shown. Nevertheless, as fully specified by Milana and Piringer (2002), “this table should be considered only as an example to offer a first guide in selecting specific additives if no other information is available about the composition of a sample to be tested”. Whereas enforcement has the legal right to obtain all information asked for, private companies may encounter difficulties in practice due to confidentiality issues in relation to the composition.
As shown in Figure 3 the endpoint to decide on compliance of a material is the experimental migration testing. This means, that in practice there should be an (accredited for enforcement) experimental migration test available to decide if the FCM is legal or not.
In conclusion, migration modelling can be time and cost saving, in particular to those who have readily access to all necessary information about the FCM.
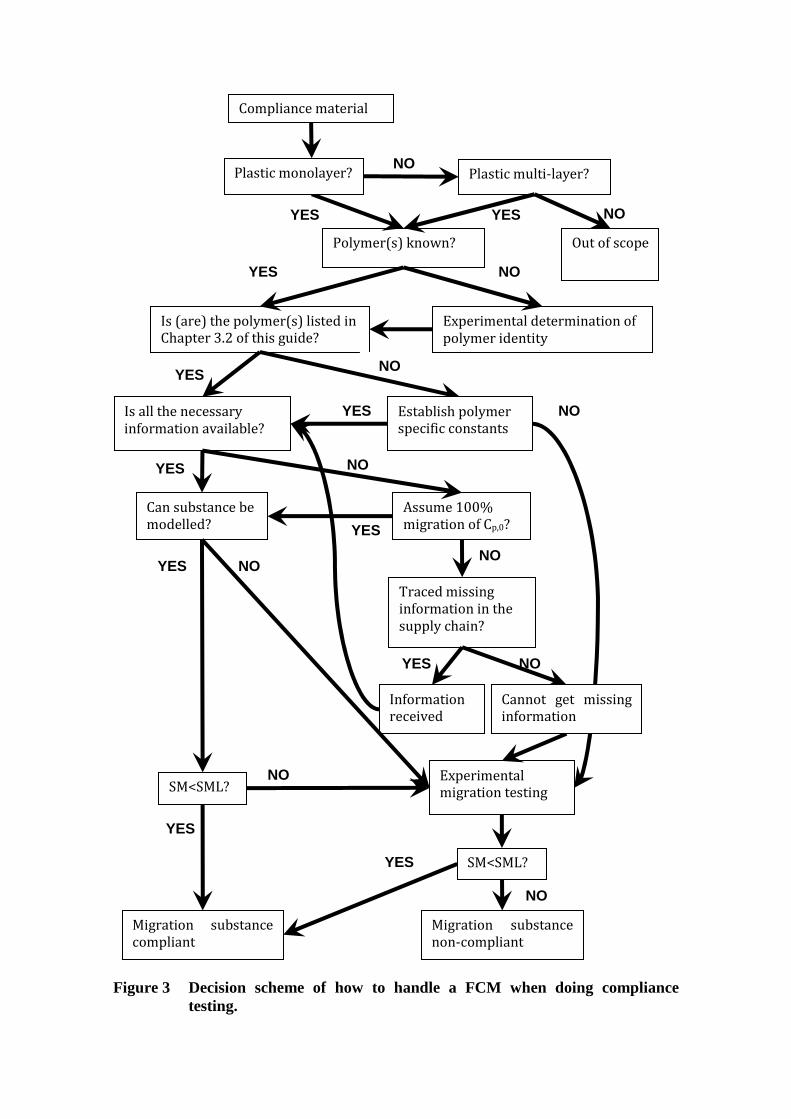
Figure 3 Decision scheme of how to handle a FCM when doing compliance testing.
NO
YES
YES
NO
NO
YES
NO YES
NO
NO
YES
NO
YES
YES NO
NO
NO
YES NO
Polymer(s) known?
Is (are) the polymer(s) listed in Chapter 3.2 of this guide?
Experimental determination of polymer identity
YES
YES NO
Is all the necessary information available?
Experimental migration testing
Plastic monolayer? Plastic multi-layer?
Establish polymer specific constants
Information received
Can substance be modelled?
Assume 100% migration of Cp,0?
Traced missing information in the supply chain?
YES
SM<SML?
Migration substance compliant
Migration substance non-compliant
SM<SML?
Compliance material
Out of scope
Cannot get missing information
7 REFERENCES
Baner, A. L. (2000). The Estimation of Partition Coefficients, Solubility Coefficients, and Permeability Coefficients for Organic Molecules in Polymers. Food Packaging, American Chemical Society. 753: 37-55.
Baner, A. L. and O. G. Piringer (2008). Partition Coefficients. Plastic Packaging: Interactions with Food and Pharmaceuticals. O. G. Piringer and A. L. Baner, Wiley: 89-121.
Begley, T., L. Castle, A. Feigenbaum, R. Franz, K. Hinrichs, T. Lickly, P. Mercea, M. Milana, A. O'Brien, S. Rebre, R. Rijk and O. Piringer (2005). "Evaluation of migration models that might be used in support of regulations for food-contact plastics." Food Additives and Contaminants 22(1): 73-90.
Brandsch, J., P. Mercea, M. Ruter, V. Tosa and O. Piringer (2002). "Migration modelling as a tool for quality assurance of food packaging." Food Additives and Contaminants 19: 29-41.
Crank, J. (1979). The Mathematics of Diffusion, Clarendon Press. Crompton, T. R. (2007). Additive Migration from Plastics Into Foods: A Guide for
Analytical Chemists, Smithers Rapra Technology. Feigenbaum A., Dole P., Aucejo S., Dainelli D., De La Cruz Garcia C., Hankemeier T.,
N’Gono Y., Papaspyrides C. D., Paseiro P., Pastorelli S., Pavlidou S., Pennarun P. Y., Saillard P., Vidal L., Vitrac O., Voulzatis Y. (2005) Functional barriers: Properties and evaluation. Food Additives and Contaminants 22(10), 956–967
Feigenbaum A., Scholler D., Bouquant J., Brigot G., Ferrier D., Franz R., Lillemark L., Riquet A.M., Petersen J.H., Van Lierop B., Yagoubi N. (2002) Safety and quality of food contact materials 1: Evaluation of analytical strategies to introduce migration testing into good manufacturing practice. Food Additives and Contaminants, 19(2), 184-201
Franz R., Welle F. (2008) Migration measurement and modelling from poly(ethylene terephthalate) (PET) into softdrinks and fruit juices in comparison with food simulants. Food Additives and Contaminants 25(8), 1033 – 1046.
Gillet, G., O. Vitrac and S. p. Desobry (2009a). "Prediction of Solute Partition Coefficients between Polyolefins and Alcohols Using a Generalized Flory−Huggins Approach." Industrial & Engineering Chemistry Research 48(11): 5285-5301.
Gillet, G., O. Vitrac, D. Tissier, P. Saillard and S. Desobry (2009b). "Development of decision tools to assess migration from plastic materials in contact with food." Food Additives and Contaminants Part a-Chemistry Analysis Control Exposure & Risk Assessment 26(12): 1556-1573.
Hamdani M., Feigenbaum A., Vergnaud J.M. (1997) Prediction of worst-case migration from packaging to food using mathematical models. Food Additives and Contaminants, 14(5), 499-506
Helmroth, E., R. Rijk, M. Dekker and W. Jongen (2002). "Predictive modelling of migration from packaging materials into food products for regulatory purposes." Trends in Food Science & Technology 13(3): 102-109.
Hinrichs K., Piringer O. (editors) (2002) Evaluation of migration models to used under Directive 90/128/EEC. Final report contract SMT4-CT98-7513,
European Commission, Directorate General for Research, Brussels. EUR 20604 EN
Hoekstra E.J. (2016) Technical guidelines for compliance testing in the framework of Regulation (EU) No 10/2011 on plastic food contact materials. in draft
Limm W., Hollifield H.C. (1996) Modelling of additive diffusion in polyolefines. Food Additives and Contaminants 13(…), 949-967
Mercea P., Piringer O. (1998) Data bank to validate a mathematical model to estimate the migration of additives and monomers from polyolefines into foodstuffs and food simulants. EU-contract No. ETD/97/501370 (DG3).
Mercea P. (2008) Models for diffusion in polymers. In: Plastic Packaging - interactions with food and pharmaceuticals (Piringer O.-G., Baner A.L. editors). 2nd edition. WILEY-VCH, Weinheim, New York
Mercea P. (2000) Appendix I – Diffusion data for LDPE, HDPE and PP. In: Plastic Packaging Materials for Food - Barrier Function, Mass Transport, Quality Assurance and Legislation ( Piringer O.-G., Baner A.L. editors) (Weinheim: Wiley-VCH)
Milana M.R., Piringer O. (2002) Guidance Document for Enforcement Laboratories: How to Use Migration Models. In: Evaluation of migration models to used under Directive 90/128/EEC (Hinrichs K., Piringer O. (editors)). Office for Official Publications of the European Communities, Luxembourg. EUR 20604 EN, 222-249
Nguyen, P.-M., A. Goujon, P. Sauvegrain and O. Vitrac (2013). "A computer-aided methodology to design safe food contact materials and related materials." AIChE Journal: accepted.
Og zal, T. A., C. Peter, B. Hess and N. F. A. van der Vegt (2008). "Modeling Solubilities of Additives in Polymer Microstructures: Single-Step Perturbation Method Based on a Soft-Cavity Reference State." Macromolecules 41(13): 5055-5061.
Pennarun P.Y. Saillard P., Feigenbaum A., Dole P. (2005) Experimental direct evaluation of functional barriers in PET recycled bottles: Comparison of migration behaviour of mono- And multilayers. Packaging Technology and Science 18(3), 107-123
Petersen J.H., Trier X.T., Fabech B. (2005) Mathematical modelling of migration: a suitable tool for the enforcement authorities? Food Additives and Contaminants 22(10), 938 – 944Piringer O.G., Baner A.L. (2008) Plastic Packaging - interactions with food and pharmaceuticals. 2nd edition. WILEY-VCH, Weinheim, New York.
Piringer O. (1994) Evaluation of plastics for food packaging. Food Additives and Contaminants 11(2), 221-230
Piringer, O. G. and A. L. Baner (2008). Plastic Packaging: Interactions with Food and Pharmaceuticals, Wiley.
Reynier A., Dole P., Feigenbaum A. (2002) Integrated approach of migration prediction using numerical modelling associated to experimental determination of key parameters. Food Additives and Contaminants 19(Supplement), 42 – 55
Reynier A., Dole P., Feigenbaum A. (1999) Prediction of worst case migration: presentation of a rigorous methodology. Food Additives and Contaminants 16(4), 137-152.
Roduit, B., C. H. Borgeat, S. Cavin, C. Fragniere and V. Dudler (2005). "Application of Finite Element Analysis (FEA) for the simulation of release of additives from multilayer polymeric packaging structures." Food Additives and Contaminants 22(10): 945-955.
Sagiv, A. (2001). "Exact solution of mass diffusion into a finite volume." Journal of Membrane Science 186(2): 231-237.
Sagiv, A. (2002). "Theoretical formulation of the diffusion through a slab-theory validation." Journal of Membrane Science 199(1-2): 125-134.
Simoneau C. (2010) Estimation of specific migration by generally recognised diffusion models in support of EU Directive 2002/72/EC.
Stoffers N.H., Dekker M., Linssen J.P.H., Störmer A., Franz R. (2003) Alternative fatty food simulants and diffusion kinetics of nylon 12 food packaging. Food Additives and Contaminants 20(10), 949 – 959.
Stoffers N.H., Brandsch R., Bradley E., Cooper J., Dekker M., Störmer A., Franz R. (2005) Feasibility study for the development of certified reference materials for specific migration testing. Part II: Estimation of diffusion parameters and comparison of experimental and predicted data. Food Additives and Contaminants 22(2), 173-184
Torres, A., A. Guarda, N. Moraga, J. Romero and M. J. Galotto (2012). "Experimental and theoretical study of thermodynamics and transport properties of multilayer polymeric food packaging." European Food Research and Technology 234: 713-722.
Tosa, V., K. Kovacs, P. Mercea and O. Piringer (2008). "A Finite Difference Method for Modeling Migration of Impurities in Multilayer Systems." Numerical Analysis and Applied Mathematics 1048: 802-805.
Vergnaud, J. M. (1991). Liquid transport processes in polymeric materials: modeling and industrial applications, Prentice Hall.
Vergnaud, J. M. and I. D. Rosca (2006). Assessing Food Safety of Polymer Packaging, Rapra Technology.
Vieth, W. R. (1991). Diffusion in and Through Polymers: Principles and Applications, Hanser.
Vitrac, O. and M. Hayert (2006). "Identification of Diffusion Transport Properties from Desorption/Sorption Kinetics: An Analysis Based on a New Approximation of Fick Equation during Solid−Liquid Contact." Industrial & Engineering Chemistry Research 45(23): 7941-7956.
Vitrac, O. and M. Hayert (2007). Design of safe food packaging under uncertainty. New trends in chemical engineering research. P. Berton. New York, Nova Science Publishers: 251-292.
Zweifel H. (2001) Plastic Additives Handbook, 5th Edition. HANSER Publishers, Munich
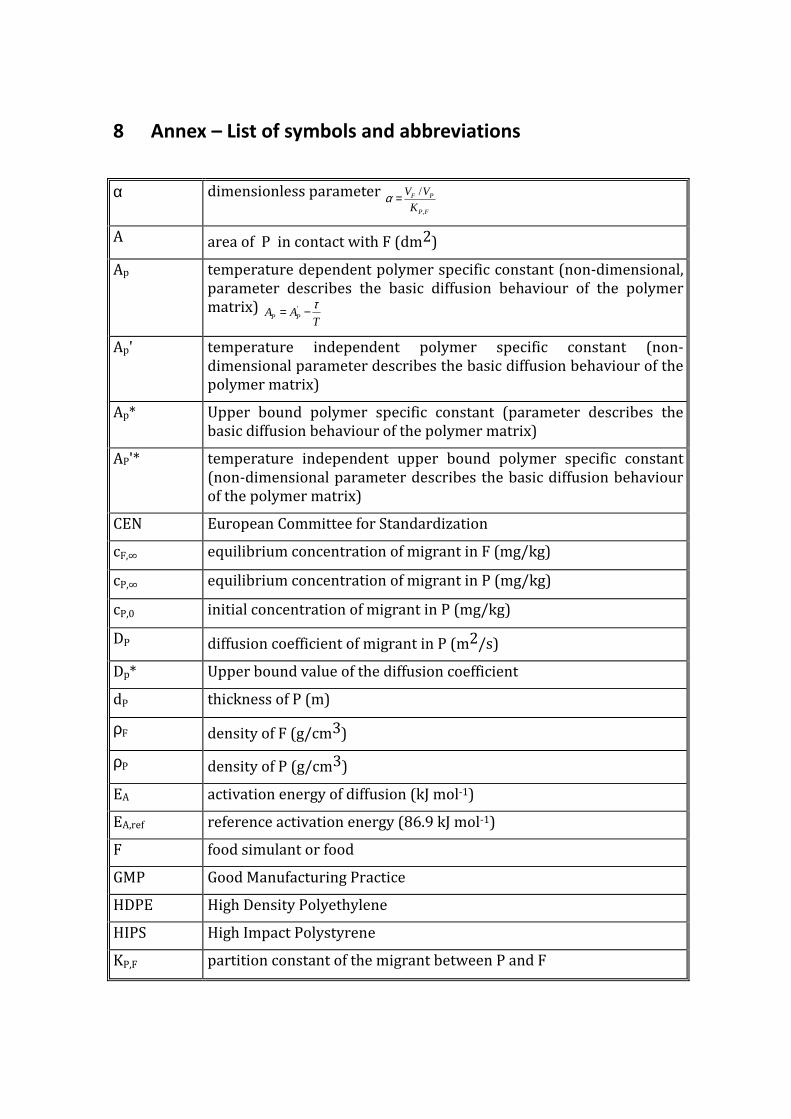
8 Annex – List of symbols and abbreviations
α dimensionless parameter FP
PF
K
VV
,
/=α
A area of P in contact with F (dm2)
Ap temperature dependent polymer specific constant (non-dimensional, parameter describes the basic diffusion behaviour of the polymer matrix)
TAA PP
τ−= '
Ap' temperature independent polymer specific constant (non-dimensional parameter describes the basic diffusion behaviour of the polymer matrix)
Ap* Upper bound polymer specific constant (parameter describes the basic diffusion behaviour of the polymer matrix)
AP'* temperature independent upper bound polymer specific constant (non-dimensional parameter describes the basic diffusion behaviour of the polymer matrix)
CEN European Committee for Standardization
cF,∞ equilibrium concentration of migrant in F (mg/kg)
cP,∞ equilibrium concentration of migrant in P (mg/kg)
cP,0 initial concentration of migrant in P (mg/kg)
DP diffusion coefficient of migrant in P (m2/s)
Dp* Upper bound value of the diffusion coefficient
dP thickness of P (m)
ρF density of F (g/cm3)
ρP density of P (g/cm3)
EA activation energy of diffusion (kJ mol-1)
EA,ref reference activation energy (86.9 kJ mol-1)
F food simulant or food
GMP Good Manufacturing Practice
HDPE High Density Polyethylene
HIPS High Impact Polystyrene
KP,F partition constant of the migrant between P and F
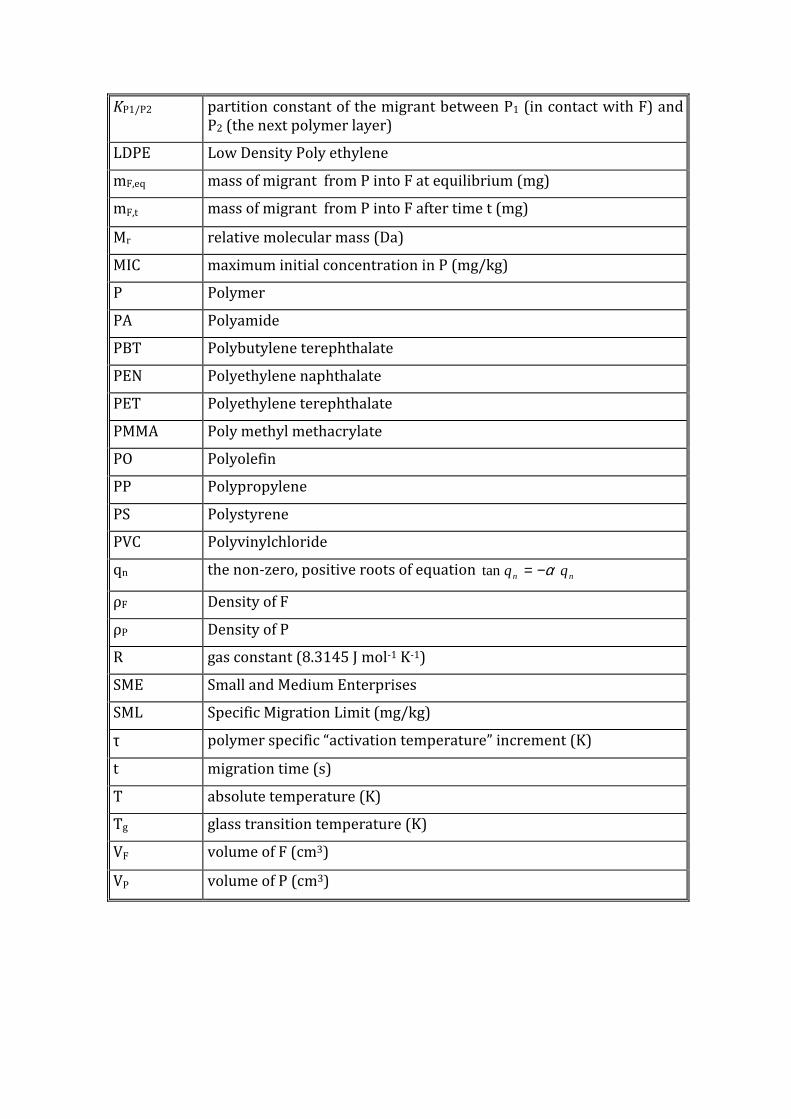
KP1/P2 partition constant of the migrant between P1 (in contact with F) and P2 (the next polymer layer)
LDPE Low Density Poly ethylene
mF,eq mass of migrant from P into F at equilibrium (mg)
mF,t mass of migrant from P into F after time t (mg)
Mr relative molecular mass (Da)
MIC maximum initial concentration in P (mg/kg)
P Polymer
PA Polyamide
PBT Polybutylene terephthalate
PEN Polyethylene naphthalate
PET Polyethylene terephthalate
PMMA Poly methyl methacrylate
PO Polyolefin
PP Polypropylene
PS Polystyrene
PVC Polyvinylchloride
qn the non-zero, positive roots of equation nn qq α−=tan
ρF Density of F
ρP Density of P
R gas constant (8.3145 J mol-1 K-1)
SME Small and Medium Enterprises
SML Specific Migration Limit (mg/kg)
τ polymer specific “activation temperature” increment (K)
t migration time (s)
T absolute temperature (K)
Tg glass transition temperature (K)
VF volume of F (cm3)
VP volume of P (cm3)

9 Annex – Transport equations
9.1 Analytical solution to the diffusion equation
The analytical solution for the specific migration of a migrant from a plastic monolayer in contact with a well-mixed liquid of limited volume (VF) is given by equation 4.37 in Cranck (1975):
3)
−
+++Σ−
+=
∞
=t
d
Dq
qdc
A
m
P
Pn
nn
PPPtF
22
2210,
, exp1
)1(21
1 αααα
ααρ
where:
4) ∞
∞
∞
∞ ===,
,
,
,
,
1
P
F
P
F
P
F
P
F
P
F
FP m
m
V
V
c
c
V
V
K ρρα
5) nn qq α−=tan
6) 0,,, PPF mmm =+ ∞∞
where mF,t is the mass of migrant transferred from P into F after time t (note mF,0 = 0), cP,0 the initial concentration of migrant in P, VP the volume of P, A the contact area between P and F, P and F the densities of P and respectively F and qn the non-zero, positive roots of equation 5.
Note 1: it is important to use the correct dimensions for the different parameters
Note 2: To obtain, for a given time t a good estimate of mF,t /A the summation in Eq. 3 should be done until the relative difference between the last two calculations is less than 1%.
For compliance check of the initial concentration in the product, equation 3 can be rearranged to calculate the maximum initial concentration of the migrant (MIC) in the plastic based on the specific migration limit (SML):
7) 1
22
221exp
1
)1(21
1
−∞
=
−
+++Σ−
+= t
d
Dq
qd
A
VSMLMIC
P
Pn
nn
PPFF
αααα
ααρρ
9.2 Numerical approaches
Beside analytical solutions of the diffusion equation (see section 9.1), numerical solutions have to be used for most cases. In general numerical solutions are used for multilayer plastics (Roduit and Dudler, 2005, Tosa et al., 2008, Reynier et al., 2002) and for mono-layers for more complex situations, e.g. concentration dependent diffusion coefficients and non-linear boundary conditions (Piringer and Baner, 2008).
How to solve partial differential equations numerically is described in standard textbooks and goes beyond the scope of this guidance document. Numerical algorithms need to be reliable and require validation. A reliable numerical

algorithm needs to conserve the substance mass in the system, i.e. does not build up or consume mass of the migrant due to the applied numerical methodology. Validation of a numerical algorithm can be achieved in two ways (1) by direct comparison with case examples results as and/or (2) by comparison with the analytical solution of the diffusion equation for monolayer structures or multilayer structures which can be simplified to a monolayer.

10 Annex – List of substances from the positive list of
amended Regulation (EU) No 10/2011, indicating their
eligibility for migration modelling
This annex is published as separate document since it needs to be updated following each revision of Table 1 of Annex I of Regulation (EU) No 10/2011
11 Annex PM/REF-numbers, chemical names, molecular mass,
SML-values and highest concentrations of some additives
used in polymers
Note: Please consider the list in Annex 10 for the eligibility of the substances to be modelled
1.1 Polyolefines.
PM/ REF
Chemical name Mr SML (mg/kg)
CP,0 (%)
38560 2,5-bis(5-tert-butyl-2-benzoxazolyl)thiophene 431 0.6
38800 N,N’-bis(3-(3,5-di-tert-butyl-4-hydroxyphenyl)propionyl)-hydrazide
553 15 HDPE 0.2
38820 Bis(2,4-di-tert-butylphenyl)penta-erythritol diphosphite 605 0.6 PP 0.1; LDPE 0.06
38840 Bis(2,4-dicumylphenyl)pentaerythritol diphosphite 853 5 LDPE 0.06
39890 Bis(methylbenzylidene) sorbitol 386 60
46480 Dibenzylidene sorbitol 358 60
46640 2,6-Di-tert-butyl-p-cresol (BHT) 220 3 PP 0.2
48640 2,4-Dihydroxybenzophenone 214 6
48720 4,4’-Dihydroxybenzophenone 214 6
48880 2,2’-Dihydroxy-4-methoxy benzophenone 244 6
53670 Ethylenglycol-bis(3,3-bis(3-tert-butyl-4-hydroxyphenyl)butyrate)
795 6 PP 0.2; HDPE 0.1
54300 2,2’-Ethylidene-bis(4,6-di-tert-butyl-phenyl)-fluorophosphonite 487 6 PP 0.1; LDPE 0.06
60320 2-(2-Hydroxy-3,5-bis(1,1-dimethylbenz-yl)phenyl)benzo-triazole
448 1.5
60400 2-(2’-Hydroxy-3’-tert-butyl-5’-methyl-phenyl)-5-chlorobenzotriazole 316 30 PP 0.4; HDPE 0.3
60480 2-(2’-Hydroxy-3,5’-di-tert-butylphenyl)-5-chlorobenzotriazole 358 30 PP 0.5
61600 2-Hydroxy-4-n-octylbenzophenone 326 6 PP 0.5; HDPE 0.3; LDPE 0.5
68320 Octadecyl 3-(3,5-di-tert-butyl-4-hydroxy-phenyl)propionate 531 6 PP 0.2; HDPE 0.1; LDPE 0.3
71680 Pentaerythritol tetrakis[3-(3,5-di-tert-butyl-4-hydroxyphenyl)-propionate] 1178 60 PP 0.2; HDPE 0.25; LDPE 0.03
74010 Phosphorous acid, bis(2,4-di-tert-butyl-6-methylphenyl) ethyl ester 514 5 PP 0.1; HDPE 0.05; LDPE 0.06
74240 Phosphorous acid, tris(2,4-di-tert-butylphenyl)ester 647 60 PP 0.1; HDPE 0.5; LDPE 0.12
80480 Poly(6-morpholino-1,3,5-triazine-2,4-diyl)-[(2,2,6,6-tertamethyl-4-piperidyl)imino]-hexamethylene-[(2,2,6,6-tertamethyl-4-piperidyl)-imino]
2600 - 1.8 PP 0.5
81200 Poly[6-[(1,1,3,3-tetramethylbutyl)-amino]-1,3,5-triazine-2,4-diyl]-[(2,2,6,6-tertamethyl-4-piperidyl)imino]-hexamethylene-[(2,2,6,6-tertamethyl-4-piperidyl)imino]
2000-3100
3 PP 0.5; HDPE 0.2; LDPE 0.5
81220 Poly-[[6-[N-(2,2,6,6-tetramethyl-4-piperidinyl)-n-butylamino]-1,3,5-triazine-2,4-diyl][(2,2,6,6-tetramethyl-4-piperidinyl)imino]-1,6-hexanediyl[(2,2,6,6-tetramethyl-4-piperidinyl)imino]]-alpha-[N,N,N',N'-
2600-3400 5 PP 0.2; HDPE 0.1; LDPE 0.1
tetrabutyl-N"-(2,2,6,6-tetramethyl-4-piperidinyl)-N"-[6-(2,2,6,6-tetramethyl-4-piperidinylamino)-hexyl]-[1,3,5-triazine-2,4,6-triamine]-omega-N,N,N',N'-tetrabutyl-1,3,5-triazine-2,4-diamine]
83595
Reaction product of di-tert-butyl phosphonite with biphenyl, obtained by condensation of 2,4 di-tert-butylphenol with Friedel-Crafts reaction product of phosphorus trichloride and biphenyl
991 18 PP 0.1; HDPE 0.05 ; LDPE 0.06
92880 Thiodiethanol-bis(3-(3,5-di-tert-butyl-4-hydroxyphenyl)propionate)
643 2.4
93120 Thiodipropionic acid, didodecyl ester 515 5 PP 0.1 – 0.5
93280 Thiodipropionic acid, dioctadecyl ester 683 5 PP 0.5
93520 Alpha-Tocopherol 431 60
94960 1,1,1-Trimethylol-propane 134 6
95200 1,3,5-Trimethyl-2,4,6-tris(3,5-di-tert-butyl-4-hydroxybenzyl)benzene
775 60 PP 0.2; HDPE 0.1
95270 2,4,6-Tris(tert-butyl)phenyl 2-butyl-2-ethyl-1,3-propanediol phosphite 450 2 HDPE 0.05;LDPE 0.06
95360 1,3,5-Tris(3,5-di-tert-butyl-4-hydroxybenzyl)-1,3,5-triazine-2,4,6-(1H,3H,5H)-trione
784 5 PP 0.1; HDPE 0.1
95600 1,1,3-Tris(2-methyl-4-hydroxy-5-tert-butylphenyl) butane 545 5 PE 0.1
PM/REF, PM/REF-numbers; Mr, molecular mass; CP,0, highest concentrations in polymer
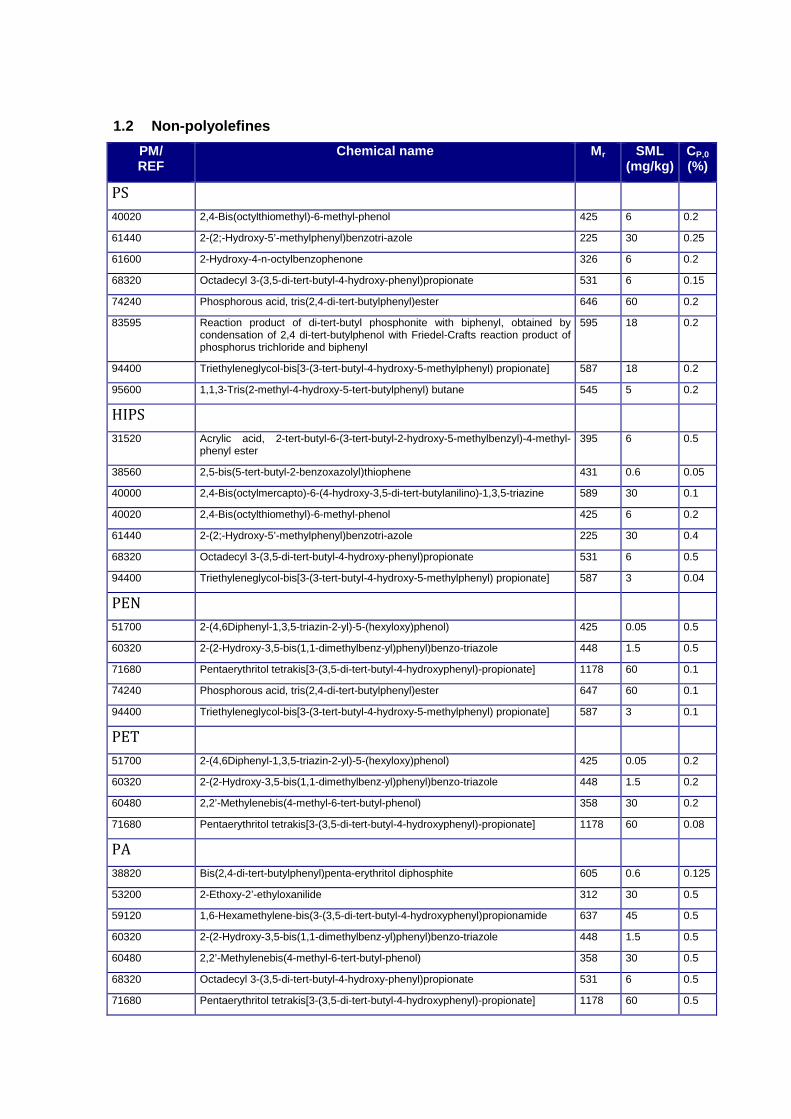
1.2 Non-polyolefines
PM/ REF
Chemical name Mr SML (mg/kg)
CP,0 (%)
PS
40020 2,4-Bis(octylthiomethyl)-6-methyl-phenol 425 6 0.2
61440 2-(2;-Hydroxy-5’-methylphenyl)benzotri-azole 225 30 0.25
61600 2-Hydroxy-4-n-octylbenzophenone 326 6 0.2
68320 Octadecyl 3-(3,5-di-tert-butyl-4-hydroxy-phenyl)propionate 531 6 0.15
74240 Phosphorous acid, tris(2,4-di-tert-butylphenyl)ester 646 60 0.2
83595 Reaction product of di-tert-butyl phosphonite with biphenyl, obtained by condensation of 2,4 di-tert-butylphenol with Friedel-Crafts reaction product of phosphorus trichloride and biphenyl
595 18 0.2
94400 Triethyleneglycol-bis[3-(3-tert-butyl-4-hydroxy-5-methylphenyl) propionate] 587 18 0.2
95600 1,1,3-Tris(2-methyl-4-hydroxy-5-tert-butylphenyl) butane 545 5 0.2
HIPS
31520 Acrylic acid, 2-tert-butyl-6-(3-tert-butyl-2-hydroxy-5-methylbenzyl)-4-methyl-phenyl ester
395 6 0.5
38560 2,5-bis(5-tert-butyl-2-benzoxazolyl)thiophene 431 0.6 0.05
40000 2,4-Bis(octylmercapto)-6-(4-hydroxy-3,5-di-tert-butylanilino)-1,3,5-triazine 589 30 0.1
40020 2,4-Bis(octylthiomethyl)-6-methyl-phenol 425 6 0.2
61440 2-(2;-Hydroxy-5’-methylphenyl)benzotri-azole 225 30 0.4
68320 Octadecyl 3-(3,5-di-tert-butyl-4-hydroxy-phenyl)propionate 531 6 0.5
94400 Triethyleneglycol-bis[3-(3-tert-butyl-4-hydroxy-5-methylphenyl) propionate] 587 3 0.04
PEN
51700 2-(4,6Diphenyl-1,3,5-triazin-2-yl)-5-(hexyloxy)phenol) 425 0.05 0.5
60320 2-(2-Hydroxy-3,5-bis(1,1-dimethylbenz-yl)phenyl)benzo-triazole 448 1.5 0.5
71680 Pentaerythritol tetrakis[3-(3,5-di-tert-butyl-4-hydroxyphenyl)-propionate] 1178 60 0.1
74240 Phosphorous acid, tris(2,4-di-tert-butylphenyl)ester 647 60 0.1
94400 Triethyleneglycol-bis[3-(3-tert-butyl-4-hydroxy-5-methylphenyl) propionate] 587 3 0.1
PET
51700 2-(4,6Diphenyl-1,3,5-triazin-2-yl)-5-(hexyloxy)phenol) 425 0.05 0.2
60320 2-(2-Hydroxy-3,5-bis(1,1-dimethylbenz-yl)phenyl)benzo-triazole 448 1.5 0.2
60480 2,2’-Methylenebis(4-methyl-6-tert-butyl-phenol) 358 30 0.2
71680 Pentaerythritol tetrakis[3-(3,5-di-tert-butyl-4-hydroxyphenyl)-propionate] 1178 60 0.08
PA
38820 Bis(2,4-di-tert-butylphenyl)penta-erythritol diphosphite 605 0.6 0.125
53200 2-Ethoxy-2’-ethyloxanilide 312 30 0.5
59120 1,6-Hexamethylene-bis(3-(3,5-di-tert-butyl-4-hydroxyphenyl)propionamide 637 45 0.5
60320 2-(2-Hydroxy-3,5-bis(1,1-dimethylbenz-yl)phenyl)benzo-triazole 448 1.5 0.5
60480 2,2’-Methylenebis(4-methyl-6-tert-butyl-phenol) 358 30 0.5
68320 Octadecyl 3-(3,5-di-tert-butyl-4-hydroxy-phenyl)propionate 531 6 0.5
71680 Pentaerythritol tetrakis[3-(3,5-di-tert-butyl-4-hydroxyphenyl)-propionate] 1178 60 0.5
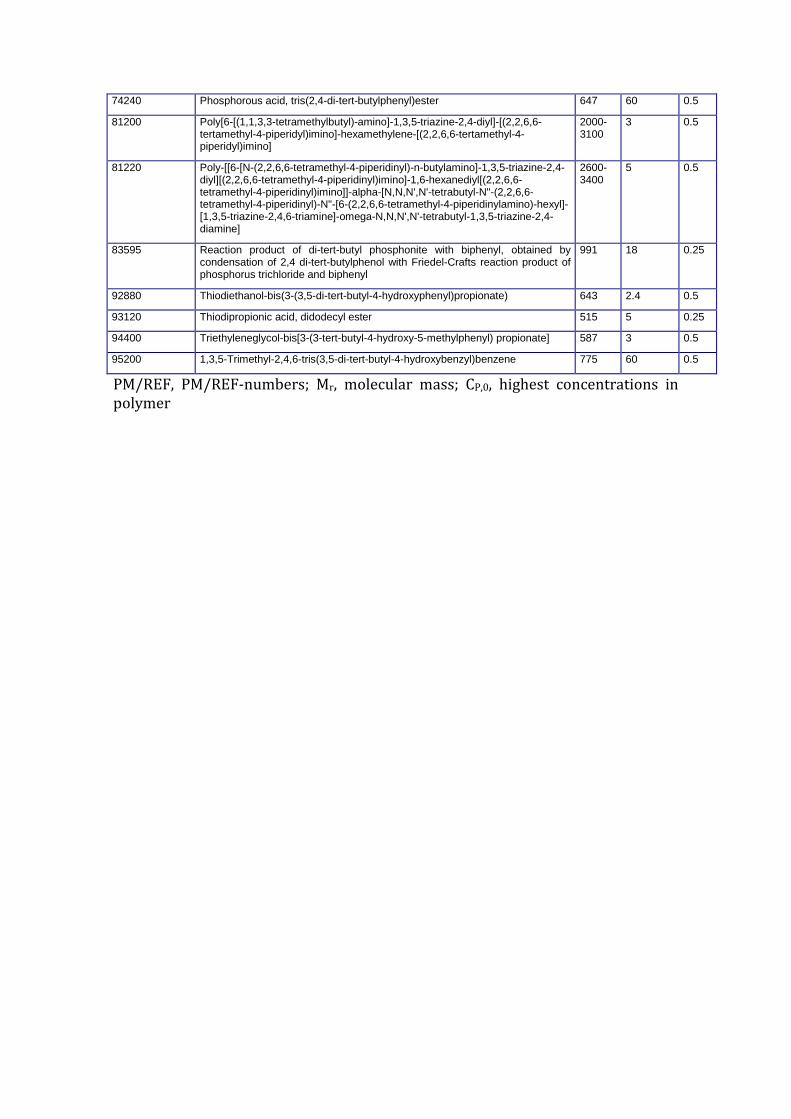
74240 Phosphorous acid, tris(2,4-di-tert-butylphenyl)ester 647 60 0.5
81200 Poly[6-[(1,1,3,3-tetramethylbutyl)-amino]-1,3,5-triazine-2,4-diyl]-[(2,2,6,6-tertamethyl-4-piperidyl)imino]-hexamethylene-[(2,2,6,6-tertamethyl-4-piperidyl)imino]
2000-3100
3 0.5
81220 Poly-[[6-[N-(2,2,6,6-tetramethyl-4-piperidinyl)-n-butylamino]-1,3,5-triazine-2,4-diyl][(2,2,6,6-tetramethyl-4-piperidinyl)imino]-1,6-hexanediyl[(2,2,6,6-tetramethyl-4-piperidinyl)imino]]-alpha-[N,N,N',N'-tetrabutyl-N"-(2,2,6,6-tetramethyl-4-piperidinyl)-N"-[6-(2,2,6,6-tetramethyl-4-piperidinylamino)-hexyl]-[1,3,5-triazine-2,4,6-triamine]-omega-N,N,N',N'-tetrabutyl-1,3,5-triazine-2,4-diamine]
2600-3400
5 0.5
83595 Reaction product of di-tert-butyl phosphonite with biphenyl, obtained by condensation of 2,4 di-tert-butylphenol with Friedel-Crafts reaction product of phosphorus trichloride and biphenyl
991 18 0.25
92880 Thiodiethanol-bis(3-(3,5-di-tert-butyl-4-hydroxyphenyl)propionate) 643 2.4 0.5
93120 Thiodipropionic acid, didodecyl ester 515 5 0.25
94400 Triethyleneglycol-bis[3-(3-tert-butyl-4-hydroxy-5-methylphenyl) propionate] 587 3 0.5
95200 1,3,5-Trimethyl-2,4,6-tris(3,5-di-tert-butyl-4-hydroxybenzyl)benzene 775 60 0.5
PM/REF, PM/REF-numbers; Mr, molecular mass; CP,0, highest concentrations in polymer

How to obtain EU publications
Our publications are available from EU Bookshop (http://publications.europa.eu/howto/index_en.htm),
where you can place an order with the sales agent of your choice.
The Publications Office has a worldwide network of sales agents.
You can obtain their contact details by sending a fax to (352) 29 29-42758.
Europe Direct is a service to help you find answers to your questions about the European Union
Free phone number (*): 00 800 6 7 8 9 10 11
(*) Certain mobile telephone operators do not allow access to 00 800 numbers or these calls may be billed.
A great deal of additional information on the European Union is available on the Internet.
It can be accessed through the Europa server http://europa.eu
0
doi:10.2788/04517
ISBN 978-92-79-52790-6
LB
-NA
-27
52
9-E
N-N
JRC Mission
As the Commission’s
in-house science service,
the Joint Research Centre’s
mission is to provide EU
policies with independent,
evidence-based scientific
and technical support
throughout the whole
policy cycle.
Working in close
cooperation with policy
Directorates-General,
the JRC addresses key
societal challenges while
stimulating innovation
through developing
new methods, tools
and standards, and sharing
its know-how with
the Member States,
the scientific community
and international partners.
Serving society Stimulating innovation Supporting legislation