faunalytics study of current and former vegetarians … product consumption of ... nuggets, chicken...
TRANSCRIPT

Study of Current and Former Vegetarians and Vegans
February 2016
Secondary Findings
Photo: Jo-Anne McArthur/We Animals

This report is a follow-up to Faunalytics’ 2014 Study of Current
and Former Vegetarians and Vegans: Initial Findings, in which
we shared the early results of our large-scale research into
those who do, or have, followed a vegetarian or vegan diet.
Following this release, Faunalytics heard from researchers and
advocates who had further questions that they thought our
study might be able to answer. In response, we spent time
mining the dataset to look for answers to these questions,
which are presented in the following pages.
For more on the study’s sample, methodology, and limitations,
see Asher et al., 2014a and 2014b. Note that data from
respondents sourced from an online panel are subject to
quality issues, which impacts the accuracy of the findings we
report. Note also that the study focused exclusively on dietary
vegetarianism and veganism and that the terms “vegetarian”
and “vegan” have been used as shorthand in this report to
indicate diet rather than both lifestyle and diet.
Introduction
Team: Kathryn Asher, Che Green, Carolyn Peake, Mirna Jewell, Hans Gutbrod, Galina Hale, and Brock Bastian
Sponsors: Animal Welfare Trust, VegFund, FARM & Stephen Kaufman, MD • Thanks: to Peter Hurford for reviewing an early draft, and to Gary Shapiro, David Schoenfeld, and Devin Terhune with Statistics Without Borders for statistical advice
© Faunalytics 2016
Contents
Key Findings (page 2)
Former Vegetarians/Vegans’ Meat Consumption Compared to the U.S. Population (page 3)
Animal Product Consumption of Former Vegetarians/Vegans Who Avoid Beef & Pork (page 7)
Former Vegetarians/Vegans’ Animal Product Consumption Given Strength of Motivations (page 8)
Single and Multiple Motivations of Current and Former Vegetarians/Vegans (page 10)
Reported Motivations and Difficulties of Former Vegetarians/Vegans by Gender and Age (page 12)
Length of Adherence and its Association with Former Vegetarians/Vegans’ Motivations and Difficulties (page 14)
Difficulties Cited by Former Vegetarians/Vegans Interested in Re-adopting their Diet (page 16)
Differences Between Vegetarians and Vegans (page 17)
Methodology for Motivations and Difficulties (page 21)
References (page 22)

This report covers diverse ground, presented in eight standalone sections. Below we offer the most noteworthy takeaways for advocates from each. These findings come with their own caveats and limitations, which are described in the following pages.
1. Lapsed Vegetarians/Vegans Eat Less Meat than the U.S. Population: The average former vegetarian/vegan may be more appropriately thought of as a meat reducer or possibly even a semi-vegetarian, given that on average they eat only slightly more than half the daily servings of meat compared to the U.S. population in general.
2. No Indication of Substitution Effects: Compared to former vegetarians/vegan who eat beef and/or pork, former vegetarians/vegan who avoid both beef and pork do not consume more types of other animal products.
3. Concern for Animals May Have Limits: With the exception of pork, lapsed vegetarians/vegans who were motivated by animal protection consume animal products in a similar fashion as those without animal protection motivations.
4. Motivations are Layered: Only a small proportion of current and former vegetarians/vegans cite just one motivation for consuming the diet, with health as the most frequently mentioned reason for both groups. This suggests that the majority of those who adhere to a vegetarian/vegan diet—or have in the past—have multiple reasons for doing so.
5. Differences Associated with Gender & Age: There are differences relating to age and gender when it comes to the motivations former vegetarians/vegans had for eating the diet, as well as how they experienced difficulties with their diet.
6. Differences Associated with Length of Adherence: Former vegetarians/vegans who ate the diet for a year or more reported different experiences regarding motivations for, and difficulties with, the diets than those who adhered to the diet for less than a year.
7. Challenges May Make a Lasting Impression: With one exception, former vegetarians/vegans who are not interested in re-adopting the diet were more likely to indicate greater difficulty with the diet than those who are interested in following it once more.
8. Former Vegetarians/Vegans are Alike in Many Ways: When it comes to animal product consumption, as well as motivations for and difficulties with vegetarian/vegan diets, there are relatively few differences between former vegetarians and former vegans, or between current vegetarians and current vegans.
❖ Further key findings related to food consumption patterns are presented in a supplemental document: Study of Current and Former Vegetarians and Vegans: Companion to the Secondary Findings.
Key Findings
page 2

Former Vegetarians/Vegans’ Meat Consumption Compared to the U.S. Population
Table 1. Former Vegetarians/Vegans’ Meat Consumption Compared to the U.S. Population
Food(daily servings)
Former vegetarians/vegans(n = 1,108)
U.S. population representative sample(n = 200)
Significance (t-test)
Chicken 0.33 0.78 ***
Turkey 0.17 0.18
Pork 0.14 0.27 ***
Beef 0.21 0.36 ***
Fish 0.16 0.21
Seafood 0.09 0.16 *
Other meats (duck, lamb, rabbit, deer, goat, etc.)
0.03 0.15 ***
Total meat 1.13 2.10 ***
*p < .05 **p < .01 ***p < .001
Compared to the U.S. population, former vegetarians/vegans eat significantly less meat, notably chicken, pork, beef, seafood, and other meats (duck, lamb, rabbit, deer, goat, etc.). The biggest difference is in chicken consumption: former vegetarians/vegans eat 1/3 of a serving per day, compared to 4/5 of a serving for the U.S. population, which is noteworthy given that chickens account for the overwhelming majority of land-based farmed animals. However, there are limitations to the chicken calculations as discussed in the following pages. These findings suggest that the average former vegetarian/vegan may be more appropriately thought of as a meat reducer or possibly even a semi-vegetarian, given that on average they eat only slightly more than half the daily servings of meat (1.13 versus 2.10). Although they no longer consume a meat-free diet, former vegetarians/vegans’ lower levels of animal product consumption have a positive effect on animals raised for food.
Note: One limitation to these findings is that we do not know the frequency with which former vegetarians/vegans ate animal products before adopting the diet. This means that we cannot say with certainty that they eat less now (as lapsed vegetarians/vegans) than they did before trying the diet. Another limitation, here and elsewhere, is that former vegetarians/vegans may have downplayed their meat consumption in the survey due to social desirability bias.
Photo: Jo-Anne McArthur/We Animalspage 3

Table 2. Details on the Samples
Former vegetarians/vegans sample
Full sample U.S. population representative sample
Origin Faunalytics’ Study of Current and Former Vegetarians and Vegans
Data collected by Kathryn Asher, PhD Candidate, University of New Brunswick, with funding from an Animal Welfare Trust Student Internship Grant
Data collection method May 2014. Online survey. Sample provided by Harris Interactive.
November 2014. Online survey. Sample provided by Survey Sampling International.
Sample size 1,166 (1,108 provided food frequency data)
11,399 200
Age of sample 17+ 17+ 21+
Average age 48.4 51.2 48.0
Female (%) 69.4 57.9 51.0
U.S. Region
Midwest (%) 23.2 25.3 22.0
Northeast (%) 20.5 21.6 18.0
South (%) 29.1 31.5 36.0
West (%) 27.2 21.0 24.0
N/A (%) 0.0 0.6 0.0
The sample of former vegetarians/vegans was taken from a larger sample (labelled full sample) considered generally representative of those in the U.S. aged 17 and over (for more on this sample see Asher et al., 2014a and 2014b). Its representativeness is subject to limitations, however (see Asher et al., 2014b, page 1).
The sample of the U.S. population was considered generally representative of those aged 21 and over in the U.S. based on quotas for age, gender, education, and region. However, its representativeness is also limited given the use of non-interlocking quotas for four demographic characteristics.
page 4
A Note on Methodology

Table 3. Food Lists for Each Sample
Food list used in survey with former vegetarians/vegans Food list used in survey with U.S. population representative sample
Turkey (turkey dinner, turkey sandwich, turkey gravy, turkey burger, etc.)
Turkey (turkey dinner, turkey sandwich, turkey burger, turkey bacon, turkey soup, etc.)
Fish, not including seafood (salmon, tuna, fish sticks, fish & chips, haddock, etc.)
Fish, not including seafood (salmon, tuna, fish sticks, haddock, fish & chips, etc.)
Seafood (lobster, shrimp, scallops, oyster, crab, etc.) Seafood (lobster, shrimp, scallops, oyster, crab, etc.)
Pork (bacon, ham, pork chops, spare ribs, ham sandwich, etc.) Pork (bacon, ham, pork chops, spare ribs, bacon bits, etc.)
Beef (hamburger, steak, roast beef, meatloaf, in stew/lasagna/spaghetti/pizza, etc.)
Beef (hamburger, steak, roast beef, meatloaf, in stews/lasagna/pasta/pizza, etc.)
Other meats (duck, lamb, rabbit, deer, goat, etc.) Other meats (duck, lamb, rabbit, deer, goat, etc.)
Chicken (wings, nuggets, chicken noodle soup, chicken salad, chicken sandwich, etc.)
Chicken (main dish) (wings, nuggets, chicken breast, chicken sandwich, chicken burger, etc.)
Chicken (mixed dish) (chicken soup, chicken gravy, chicken salad, etc.)
Each sample was given a non-quantitative food frequency questionnaire and asked to indicate the frequency (Table 4) with which they consume the listed items in Table 3. Both groups were presented with a food list that included animal and non-animal foods (fruits, vegetables, nuts, soft drinks, etc.). Former vegetarians/vegans were given a 17-item food/beverage list, while a 26-item list was used for the U.S. population sample. Table 3 shows that, with one exception, the way meat items were defined was similar in each case, which helped facilitate comparison between the two groups. The former vegetarians/vegans sample was asked about chicken consumption as a whole, while the U.S. population sample was asked to indicate their consumption of chicken as a main and as a mixed dish.
page 5

Table 4. Frequency Scale Conversions
Frequency scale used in survey with former vegetarians/vegans, for the question: “On average, how often do you currently eat the following foods?”
Frequency scale used in survey with U.S. population representative sample, for the question: “On average, how often do you usually consume the following foods/beverages?”
7-point frequency scale Conversion 9-point frequency scale Conversion
Never 0 Never 0
Less than 1 time per month 0.016 (half a time/month, i.e. every second month, 6/365)
Less than 1 time per month 0.016 (half a time/month, i.e. every second month, 6/365)
1–3 times per month 0.066 (2 times/month, 24/365) 1–3 times per month 0.066 (2 times/month, 24/365)
1 time per week 0.142 (52/365) 1–3 times per week 0.285 (2*52/365)
2–6 times per week 0.570 (4*52/365) 4–6 times per week 0.712 (5*52/365)
1 time per day 1 1 time per day 1
2 or more times per day 2.5 2 times per day
2.53 times per day
4 or more times per day
During data analysis, we converted the frequency scales into quantitative measures of frequency of consumption, which represents daily servings consumed. With this formula, if an individual indicated they ate beef once per day they were said to have consumed one serving. For frequencies presented as a range, the midpoint was used (Doidge & Segal, 2012; Pollard, Steptoe, & Wardle, 1998; Salvini et al., 1989) and “2 or more times per day” was considered to represent 2.5 times per day (Pollard et al., 1998). The category “less than 1 time per month” was treated as half a time per month. To avoid over-inflating the U.S. population sample’s consumption, the three categories representing 2 or more times per day were collapsed into one category. To allow a comparison for chicken consumption, a new chicken variable was created for the U.S. population sample where total consumption was considered to be the score for chicken main dish plus half of the score for chicken mixed dish. The comparison of chicken consumption is subject to notable limitations given the different ways the food was listed for each sample. As Table 5 shows, however, even if chicken consumption for the U.S. population was considered to only include chicken as a main dish, the difference in consumption would still be statistically significant. The different frequency scales used for each sample as well as the process of transforming a categorical variable into a continuous one creates potential limitations.
page 6
Table 5. Chicken Consumption Conversions
Food(daily servings)
significance (t-test)
Chicken (former vegetarians/vegans)
0.33
Chicken main dish only (U.S. population)
0.57 ***
Chicken (former vegetarians/vegans)
0.33
Chicken main dish + mixed dish (U.S. population
1.00 ***
*p < .05 **p < .01 ***p < .001

Animal Product Consumption of Former Vegetarians/Vegans Who Avoid Beef & Pork
Table 6. Animal Product Consumption of Former Vegetarians/Vegans Who Avoid Beef & Pork
Food(daily servings)
Former vegetarians/vegans who consume no beef and no
pork(n = 119)
Former vegetarians/vegans who consume
beef and/or pork(n = 989)
Significance (t-test)
Chicken 0.24 0.34 **
Turkey 0.13 0.17
Fish 0.12 0.16
Seafood 0.08 0.10
Other meats (duck, lamb, rabbit, deer, goat, etc.)
0.01 0.03 ***
Eggs 0.38 0.40
Dairy 0.94 0.93
*p < .05 **p < .01 ***p < .001
Compared to former vegetarians/vegan who eat beef and/or pork, former vegetarians/vegan who avoid both beef and pork largely consume a similar quantity of the various types of animal products tested. The exceptions are that former vegetarians/vegan who avoid beef and pork eat less chicken as well as less other meats (duck, lamb, rabbit, deer, goat, etc.). There were no instances of beef and pork avoiders consuming significantly more of a particular type of animal product than those who do not avoid beef and/or pork. These findings add information—specific to former vegetarians/vegans—to an ongoing conversation about whether there are substitution effects that advocates should be cognizant of when individuals eliminate beef and pork from their diet.
Note: The findings cannot be extrapolated to all omnivores because those under study are unique in being lapsed vegetarians/vegans. Note also that on the advice of Statistics Without Borders, we used the output for equal variances not assumed for all t-tests regardless of the results of Levene's Test for Equality of Variances, which resulted in only one change (for chicken in this table).
Photo: Jo-Anne McArthur/We Animalspage 7
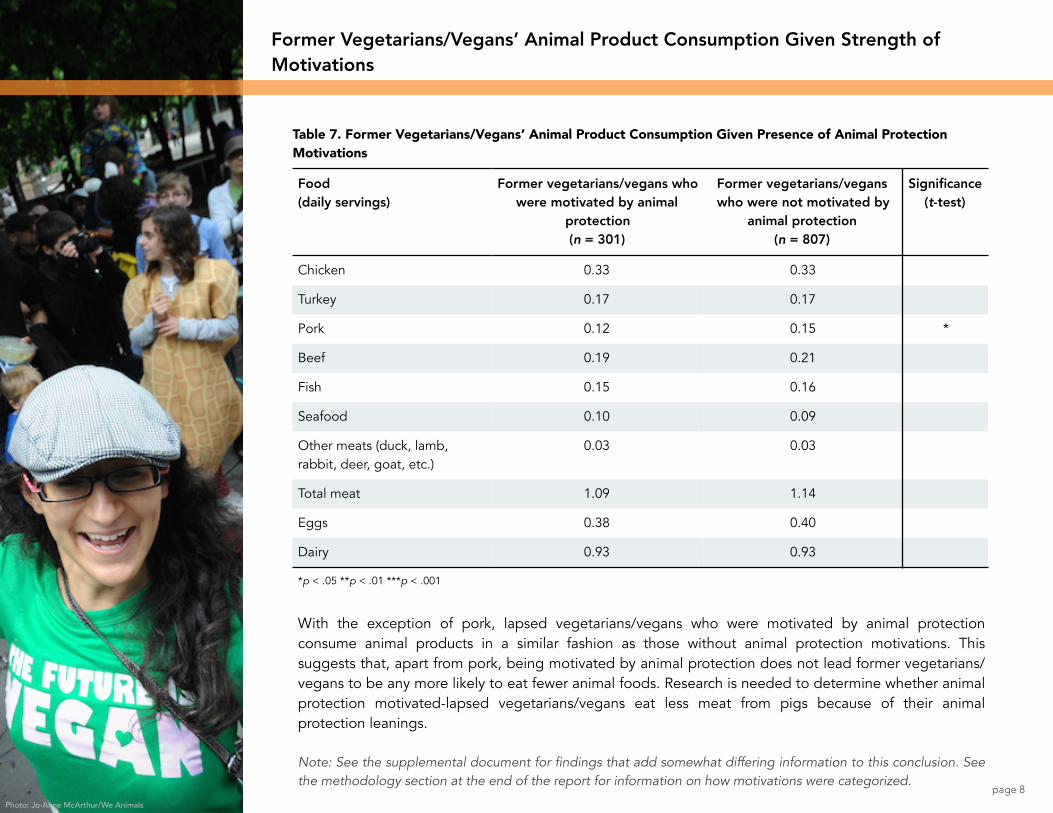
Former Vegetarians/Vegans’ Animal Product Consumption Given Strength of Motivations
Table 7. Former Vegetarians/Vegans’ Animal Product Consumption Given Presence of Animal Protection Motivations
Food(daily servings)
Former vegetarians/vegans who were motivated by animal
protection(n = 301)
Former vegetarians/vegans who were not motivated by
animal protection(n = 807)
Significance (t-test)
Chicken 0.33 0.33
Turkey 0.17 0.17
Pork 0.12 0.15 *
Beef 0.19 0.21
Fish 0.15 0.16
Seafood 0.10 0.09
Other meats (duck, lamb, rabbit, deer, goat, etc.)
0.03 0.03
Total meat 1.09 1.14
Eggs 0.38 0.40
Dairy 0.93 0.93
*p < .05 **p < .01 ***p < .001
Photo: Jo-Anne McArthur/We Animals
With the exception of pork, lapsed vegetarians/vegans who were motivated by animal protection consume animal products in a similar fashion as those without animal protection motivations. This suggests that, apart from pork, being motivated by animal protection does not lead former vegetarians/vegans to be any more likely to eat fewer animal foods. Research is needed to determine whether animal protection motivated-lapsed vegetarians/vegans eat less meat from pigs because of their animal protection leanings.
Note: See the supplemental document for findings that add somewhat differing information to this conclusion. See the methodology section at the end of the report for information on how motivations were categorized.
page 8

With the exception of fish and beef, lapsed vegetarians/vegans who were motivated by health consume animal products in a similar fashion as those without health motivations. Health-motivated former vegetarians/vegans eat less beef than those who were not motivated by health. Conversely, those who listed health as a motivation eat more fish. Research is needed to determine whether health motivated-lapsed vegetarians/vegans eat less beef and more fish because they view these foods as impacting their health, but it seems likely.
Relating the findings from Table 7 and Table 8 to Table 1, we see that whether former vegetarians/vegans had health or animal protection motivations does not seem to change the fact that their total meat consumption is still notably less than the U.S. population’s.
Note: See the supplemental document for findings that add somewhat differing information to this conclusion. See the methodology section at the end of the report for information on how motivations were categorized.
page 9
Table 8. Former Vegetarians/Vegans’ Animal Product Consumption Given Presence of Health Motivations
Food(daily servings)
Former vegetarians/vegans who were motivated by health
(n = 643)
Former vegetarians/vegans who were not motivated by
health(n = 465)
Significance (t-test)
Chicken 0.33 0.33
Turkey 0.17 0.16
Pork 0.13 0.15
Beef 0.19 0.23 *
Fish 0.17 0.13 *
Seafood 0.10 0.09
Other meats (duck, lamb, rabbit, deer, goat, etc.)
0.03 0.03
Total meat 1.12 1.13
Eggs 0.40 0.39
Dairy 0.92 0.94
*p < .05 **p < .01 ***p < .001

Single and Multiple Motivations of Current and Former Vegetarians/Vegans
Table 9. Single and Multiple Motivations of Current and Former Vegetarians/Vegans
Motivations Former vegetarians/vegans
(n =1,161)
Current vegetarians/vegans
(n =219)
Total(n =1,380)
Health only 15% 5% 13%
Social influence (from friends, family, significant other, etc.) only 4% 0% 3%
Taste preferences only 3% 1% 3%
Religious/spiritual beliefs only 2% 1% 2%
Animal protection only 1% 3% 1%
Cost only 2% 1% 1%
Feelings of disgust about meat/animal products only 1% 1% 1%
Wanting to follow a food trend only 0.3% 0% 0.3%
Concern for the environment only 0.1% 1% 0.1%
Social justice or world hunger only 0% 0% 0%
Animal protection and health only 1% 1% 1%
Health and animal protection (and at least one other) 17% 45% 21%
Animal protection (and at least one other) but not health 8% 20% 10%
Health (and at least one other) but not animal protection 25% 19% 24%
A small proportion (25%) of current and former vegetarians/vegans cite just one motivation for consuming the diet. Of those that were singly-motivated, health was the most frequently mentioned reason among both groups. These findings suggest that the majority of those who do eat, or have eaten, a vegetarian/vegan diet have multiple reasons for doing so. The overwhelming majority of motivations go beyond health and animal protection—only about a sixth of current and former vegetarians/vegans said they were motivated solely by one or both of these reasons.
Note: See the methodology section at the end of the report for information on how motivations were categorized.
Photo: Jo-Anne McArthur/We Animalspage 10

page 11
Table 10. Health and Animal Protection Motivations of Current and Former Vegetarians/Vegans
Motivations Former vegetarians/vegans
(n =1,161)
Current vegetarians/vegans
(n =219)
% Lapsed of those reporting this
motivation
Total % of current & former vegetarians/vegans
reporting these motivations
Health only 175 10 95% 13%
Health (and at least one other) but not animal protection
290 42 87% 24%
Animal protection only 14 6 70% 1%
Animal protection (and at least one other) but not health
95 43 69% 10%
Based on previous findings from this study (Asher et al., 2014a), we know that 84% of vegetarians/vegans abandon their diet. When we look at trends in lapsing based on motivations for eating the diet we see further patterns appear. Individuals who are only motivated by health or are motivated by health (and at least one other motivation) but not animal protection are very likely to lapse (95% and 87% respectively). In contrast, people who are only motivated by animal protection or are motivated by animal protection (and at least one other motivation) but not health are less likely to lapse (70% and 69% respectively). While the health motivations are associated with a greater degree of lapsing, it is also of note that more people reported these health motivations, suggesting that even if this messaging leads to more lapses, health-related messages may still be helpful in encouraging more individuals to start the diet. Research is needed to determine whether having animal protection or health leanings caused the observed differences in lapsing.
Note: One limitation to this analysis is that motivations are known to change over time, which makes it difficult to compare individuals who are no longer on the diet with those who are still eating this way. A further limitation is the very small sample sizes (particularly for the animal protection only sample), and so the data should be interpreted with a great deal of caution. See the methodology section at the end of the report for information on how motivations were categorized.

Reported Motivations and Difficulties of Former Vegetarians/Vegans by Gender and Age
page 12
A few motivations show differences when we consider gender and age. Female former vegetarians/vegans are more likely to have been motivated to follow the diet by taste preferences, animal protection, feelings of disgust about meat/animal products, and concern for the environment than their male counterparts. When examining by age, there were notable differences for several of the motivations, with a general trend of a greater proportion of younger individuals citing motivations around animal protection, disgust, the environment, social justice or world hunger, and religious/spiritual beliefs. These findings suggest there are differences relating to age and gender when it comes to the motivations former vegetarians/vegans had for eating the diet. Research is needed to determine if age and gender play a causative role in this regard.
Note: See the methodology section at the end of the report for information on how motivations were categorized.Photo: Jo-Anne McArthur/We Animals
Table 11. Reported Motivations of Former Vegetarians/Vegans by Gender and Age
Motivations Former vegetarians/vegans
Male (n = 337)
Female (n = 764)
Significance (chi-squared
test)
16–24 years
(n = 62)
25–44 years
(n = 427)
45–64 years
(n = 422)
65+ years
(n = 193)
Significance (chi-squared
test)
Health 55% 60% 58% 59% 59% 54%
Taste preferences 22% 35% *** 34% 32% 31% 29%
Animal protection 18% 31% *** 34% 35% 25% 11% ***
Feelings of disgust about meat/animal products
15% 32% *** 40% 34% 23% 15% ***
Concern for the environment 17% 25% ** 29% 28% 21% 10% ***
Cost 14% 17% 18% 15% 17% 13%
Social influence (from friends, family, significant other, etc.)
18% 14% 24% 17% 14% 12%
Social justice or world hunger 10% 12% 16% 12% 13% 5% **
Religious/spiritual beliefs 10% 10% 10% 13% 9% 6% *
Wanting to follow a food trend 8% 8% 10% 8% 7% 6%
*p < .05 **p < .01 ***p < .001

Of the most notable difficulties that former vegetarian/vegans identified, a few show differences when we look at gender and age. A larger proportion of female former vegetarians/vegans noted having insufficient interaction with other vegetarians/vegans, while a larger proportion of males did not see the diet as part of their identity and were tempted by beef or pork. For age, there was a general trend of a greater proportion of younger individuals citing being bored with their food options and craving poultry and beef or pork, while a greater proportion of older individuals reported disliking that their diet made them stick out from the crowd. These findings suggest that former vegetarians/vegans of different ages and genders experienced difficulties with their diets in different ways. Research is needed to determine if age and gender play a causative role in this regard.
Note: See the methodology section at the end of the report for information on how difficulties were categorized. page 13
Table 12. Reported Difficulties of Former Vegetarians/Vegans by Gender and Age
Key difficulties Former vegetarians/vegans
Male (n = 337)
Female (n = 764)
Significance (chi-squared test)
16–24 years (n = 62)
25–44 years (n = 427)
45–64 years (n = 422)
65+ years (n = 193)
Significance (chi-squared test)
I was not (am not) actively involved in a vegetarian/vegan group or organization (potluck, online community, etc.)
83% 85% 85% 83% 85% 84%
I disliked (dislike) that my vegetarian/vegan diet made (makes) me stick out from the crowd
65% 62% 47% 59% 65% 72% ***
I did not (do not) see vegetarianism/veganism as part of my identity
63% 56% * 56% 56% 58% 64%
I had (have) insufficient interaction with other vegetarians/vegans
42% 52% ** 55% 50% 47% 51%
I began (have begun) to feel it is too difficult to be “pure” with my vegetarian/vegan diet
43% 43% 48% 43% 42% 46%
I was (am) bored with my food options 39% 38% 44% 44% 36% 29% **
I craved/was tempted (crave/am tempted) by poultry (chicken, turkey, etc.)
41% 35% 52% 41% 34% 31% **
I craved/was tempted (crave/am tempted) by beef or pork
43% 32% *** 39% 41% 32% 28% **
I craved/was tempted (crave/am tempted) by fish/seafood
35% 31% 29% 33% 33% 34%
*p < .05 **p < .01 ***p < .001

Length of Adherence and its Association with Former Vegetarians/Vegans’ Motivations and Difficulties
Table 13. Length of Adherence and its Association with Former Vegetarians/Vegans’ Motivations
Motivations Former vegetarians/vegans who adhered
to the diet for less than a year(n = 594)
Former vegetarians/vegans who adhered to the diet for a year
or more(n = 438)
Significance (chi-squared
test)
Feelings of disgust about meat/animal products 18% 42% ***
Animal protection 20% 40% ***
Taste preferences 25% 40% ***
Concern for the environment 17% 33% ***
Social justice or world hunger 9% 16% ***
Health 56% 64% *
Wanting to follow a food trend 6% 10% *
Cost 16% 17%
Social influence (from friends, family, significant other, etc.)
14% 17%
Religious/spiritual beliefs 10% 11%
*p < .05 **p < .01 ***p < .001
Photo: Jo-Anne McArthur/We Animalspage 14
A greater proportion of lapsed vegetarians/vegans who adhered to their diet for a year or more reported alignment with seven of the 10 motivations tested, compared to their counterparts who followed the diet for less than a year. The only motivations that did not show a significant difference were cost, social influence, and religious/spiritual beliefs. Research is needed to determine whether these associations suggest a causal link to diet duration.
Note: 92 Don’t Know responses on length of adherence were removed from the sample. See the methodology section at the end of the report for information on how motivations were categorized.

Table 14. Length of Adherence and its Association with Former Vegetarians/Vegans’ Difficulties
Key difficulties Former vegetarians/vegans adhered to the
diet for less than a year(n = 594)
Former vegetarians/vegans adhered to the
diet for a year or more
(n = 438)
Significance (chi-squared
test)
I was not (am not) actively involved in a vegetarian/vegan group or organization (potluck, online community, etc.)
86% 82%
I disliked (dislike) that my vegetarian/vegan diet made (makes) me stick out from the crowd
68% 55% ***
I did not (do not) see vegetarianism/veganism as part of my identity 72% 38% ***
I had (have) insufficient interaction with other vegetarians/vegans 54% 43% ***
I began (have begun) to feel it is too difficult to be “pure” with my vegetarian/vegan diet
52% 36% ***
I was (am) bored with my food options 45% 32% ***
I craved/was tempted (crave/am tempted) by poultry (chicken, turkey, etc.) 44% 31% ***
I craved/was tempted (crave/am tempted) by beef or pork 44% 27% ***
I craved/was tempted (crave/am tempted) by fish/seafood 37% 30% *
*p < .05 **p < .01 ***p < .001
page 15
A greater proportion of lapsed vegetarians/vegans who adhered to their diet for less than a year reported alignment with 9 of the 10 key difficulties tested as compared to their counterparts who followed the diet for a year or more. The only difficulty that did not show a significant difference concerned not being actively involved in a vegetarian/vegan group or organization. Research is needed to determine whether the associations suggest a causal link to diet duration.
Note: 92 Don’t Know responses on length of adherence were removed from the sample. See the methodology section at the end of the report for information on how difficulties were categorized.
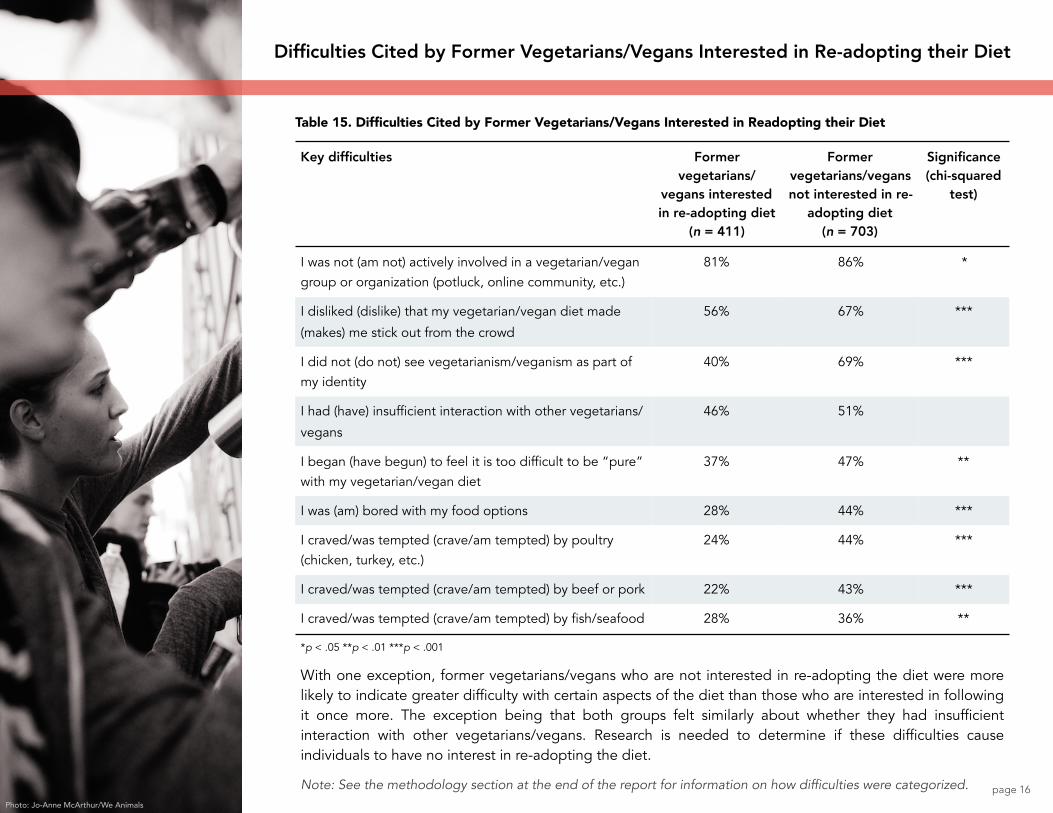
Difficulties Cited by Former Vegetarians/Vegans Interested in Re-adopting their Diet
Table 15. Difficulties Cited by Former Vegetarians/Vegans Interested in Readopting their Diet
Key difficulties Former vegetarians/
vegans interested in re-adopting diet
(n = 411)
Former vegetarians/vegans not interested in re-
adopting diet (n = 703)
Significance (chi-squared
test)
I was not (am not) actively involved in a vegetarian/vegan group or organization (potluck, online community, etc.)
81% 86% *
I disliked (dislike) that my vegetarian/vegan diet made
(makes) me stick out from the crowd
56% 67% ***
I did not (do not) see vegetarianism/veganism as part of my identity
40% 69% ***
I had (have) insufficient interaction with other vegetarians/
vegans
46% 51%
I began (have begun) to feel it is too difficult to be “pure” with my vegetarian/vegan diet
37% 47% **
I was (am) bored with my food options 28% 44% ***
I craved/was tempted (crave/am tempted) by poultry (chicken, turkey, etc.)
24% 44% ***
I craved/was tempted (crave/am tempted) by beef or pork 22% 43% ***
I craved/was tempted (crave/am tempted) by fish/seafood 28% 36% **
*p < .05 **p < .01 ***p < .001
Photo: Jo-Anne McArthur/We Animalspage 16
With one exception, former vegetarians/vegans who are not interested in re-adopting the diet were more likely to indicate greater difficulty with certain aspects of the diet than those who are interested in following it once more. The exception being that both groups felt similarly about whether they had insufficient interaction with other vegetarians/vegans. Research is needed to determine if these difficulties cause individuals to have no interest in re-adopting the diet.
Note: See the methodology section at the end of the report for information on how difficulties were categorized.

Differences Between Vegetarians and Vegans
Table 16. Type of Diet and its Association with Animal Product Consumption
Food(daily servings)
Former vegetarians(n = 987)
Former vegans(n = 121)
Significance (t-test)
Chicken 0.33 0.31
Turkey 0.17 0.18
Pork 0.14 0.17
Beef 0.21 0.22
Fish 0.15 0.21 *
Seafood 0.09 0.14
Other meats (duck, lamb, rabbit, deer, goat, etc.) 0.03 0.05
Total meat 1.10 1.30
Eggs 0.40 0.35
Dairy 0.97 0.61 ***
*p < .05 **p < .01 ***p < .001
Photo: Jo-Anne McArthur/We Animalspage 17
For the most part, former vegetarians and former vegans consume a similar quantity of the various types of animal products tested. The exceptions are that former vegetarians consume more servings of dairy than former vegans, while former vegans eat more fish than former vegetarians. There are some obvious reasons to theorize about why former vegans consume less dairy (though curiously not fewer eggs), but the reason why they eat more fish is less easily explained. These findings suggest that with the exception of dairy and fish, the type of diet one lapses from does not notably impact consumption as an omnivore. Research is needed into whether the differences in diet caused the observed associations.
Note: The small sample sizes in this table mean that the results should be interpreted with caution.

Table 17. Type of Diet and its Association with Motivations
Motivations Former vegetarians(n = 1,032)
Former vegans
(n = 129)
Significance (chi-squared
test)
Current vegetarians
(n = 166)
Current vegans(n = 53)
Significance (chi-squared test unless indicated)
Health 57% 64% 66% 79%
Taste preferences 32% 27% 53% 49%
Animal protection 27% 27% 70% 62%
Feelings of disgust about meat/animal products 26% 30% 61% 68%
Concern for the environment 22% 23% 58% 60%
Cost 17% 11% 18% 32% *
Social influence (From friends, family, significant other, etc.)
14% 23% * 7% 23% **
Social justice or world hunger 11% 15% 27% 36%
Religious/spiritual beliefs 9% 14% 19% 32%
Wanting to follow a food trend 7% 10% 4% 17% ** (Fisher’s exact test)
*p < .05 **p < .01 ***p < .001
page 18
Compared to current vegetarians, current vegans are more likely to report cost and wanting to follow a food trend as motivators for consuming the diet. Both current and former vegans are more likely than their vegetarian counterparts to identify social influence as a reason for following the diet. Outside of these differences, motivations for eating a vegetarian/vegan diet do not appear to differ much based on the specific diet being followed. Research is needed in to whether differences in reported motivations caused diet choices.
Note: The small sample sizes in this table mean that the results should be interpreted with caution. See the methodology section at the end of the report for information on how motivations were categorized.
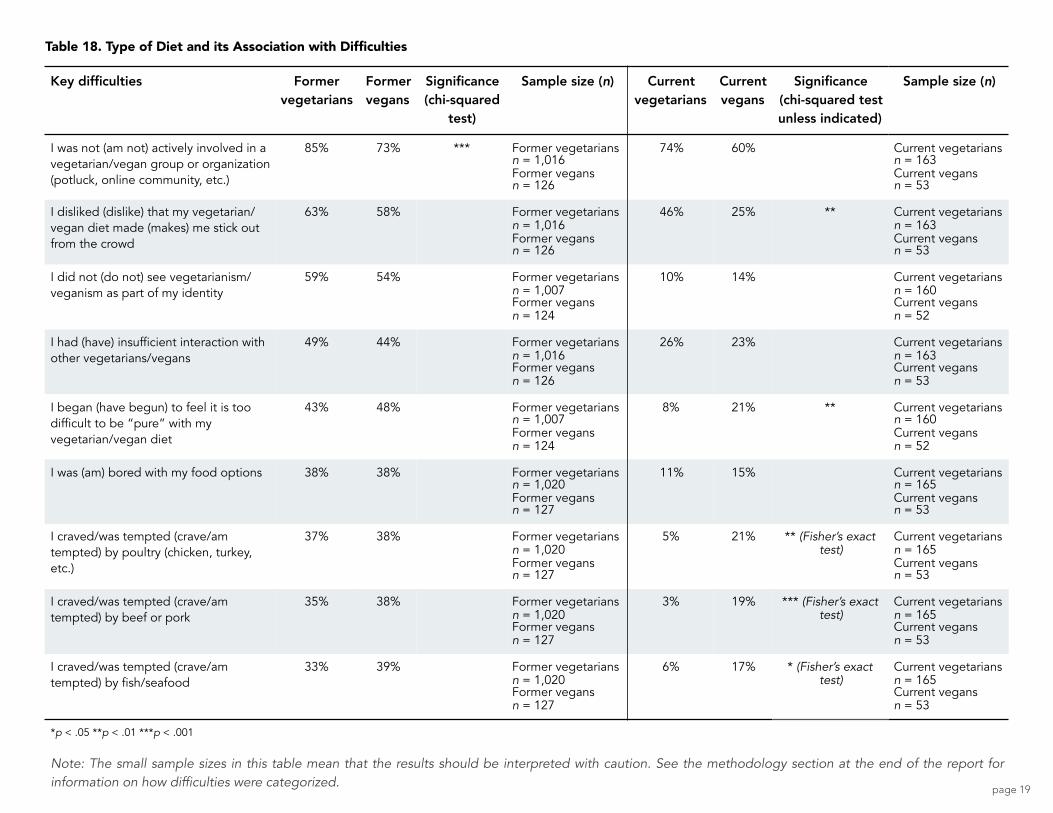
Table 18. Type of Diet and its Association with Difficulties
Key difficulties Former vegetarians
Former vegans
Significance (chi-squared
test)
Sample size (n) Current vegetarians
Current vegans
Significance (chi-squared test unless indicated)
Sample size (n)
I was not (am not) actively involved in a vegetarian/vegan group or organization (potluck, online community, etc.)
85% 73% *** Former vegetariansn = 1,016Former vegansn = 126
74% 60% Current vegetariansn = 163Current vegansn = 53
I disliked (dislike) that my vegetarian/vegan diet made (makes) me stick out from the crowd
63% 58% Former vegetariansn = 1,016Former vegansn = 126
46% 25% ** Current vegetariansn = 163Current vegansn = 53
I did not (do not) see vegetarianism/veganism as part of my identity
59% 54% Former vegetariansn = 1,007Former vegansn = 124
10% 14% Current vegetariansn = 160Current vegansn = 52
I had (have) insufficient interaction with other vegetarians/vegans
49% 44% Former vegetariansn = 1,016Former vegansn = 126
26% 23% Current vegetariansn = 163Current vegansn = 53
I began (have begun) to feel it is too difficult to be “pure” with my vegetarian/vegan diet
43% 48% Former vegetariansn = 1,007Former vegansn = 124
8% 21% ** Current vegetariansn = 160Current vegansn = 52
I was (am) bored with my food options 38% 38% Former vegetariansn = 1,020Former vegansn = 127
11% 15% Current vegetariansn = 165Current vegansn = 53
I craved/was tempted (crave/am tempted) by poultry (chicken, turkey, etc.)
37% 38% Former vegetariansn = 1,020Former vegansn = 127
5% 21% ** (Fisher’s exact test)
Current vegetariansn = 165Current vegansn = 53
I craved/was tempted (crave/am tempted) by beef or pork
35% 38% Former vegetariansn = 1,020Former vegansn = 127
3% 19% *** (Fisher’s exact test)
Current vegetariansn = 165Current vegansn = 53
I craved/was tempted (crave/am tempted) by fish/seafood
33% 39% Former vegetariansn = 1,020Former vegansn = 127
6% 17% * (Fisher’s exact test)
Current vegetariansn = 165Current vegansn = 53
*p < .05 **p < .01 ***p < .001
page 19
Note: The small sample sizes in this table mean that the results should be interpreted with caution. See the methodology section at the end of the report for information on how difficulties were categorized.

page 20
As Table 18 shows, the difficulties expressed by former vegetarians do not differ substantially from those of former vegans. The one exception is that, compared to former vegans, former vegetarians are more likely to report that they were not actively involved in a vegetarian/vegan group or organization.
There were more differences between current vegetarians and vegans on these matters. Current vegetarians were more likely to indicate that they dislike that their diet makes them stick out from the crowd. In contrast, current vegans were more likely than their vegetarian counterparts to report that they crave/are tempted by poultry, beef or pork, and fish/seafood, and that they have begun to feel it is too difficult to be “pure” with their diet. It is possible that vegans experience greater cravings than vegetarians because of their more limited diet, however this research cannot confirm this. Interestingly, the same pattern was not observed among former vegetarians and former vegans. The fact that current vegans were more likely than current vegetarians to note difficulty maintaining purity seems plausible in that vegans have more foods to avoid, notably “hidden” ingredients. However, as before, this pattern was not observed among former vegetarians and former vegans. Research is needed into whether the differences in diet caused the observed associations.
Note: The sample sizes for Table 16, 17, and 18 get perilously small at times and so should be interpreted with caution. Nonetheless, we felt it was important to publish these numbers because the difference between vegetarians and vegans is an understudied but important area. Likewise, the question of whether there were differences between these two groups was a typical request we received from researchers and advocates following the release of the first report. Given this, we wanted to offer some insight on the topic. We are doing so, however, with the understanding that the results suggest (without being definitive) that vegetarians and vegans have many similar experiences, though there are also some important differences. Our hope is that these findings will offer tentative insights for advocates and open the door for additional research on the topic.

We asked survey participants to answer the question, “How much did the
following motivate you to eat a vegetarian/vegan diet?” for the list of 10
motivations below, using a 5-point scale where 1 represented “not at all”
and 5 represented “very much.”
- Animal protection
- Concern for the environment
- Cost
- Health
- Religious/spiritual beliefs
- Social influence (from friends, family, significant other, etc.)
- Social justice or world hunger
- Taste preferences
- Wanting to follow a food trend
- Feelings of disgust about meat
As is common when collapsing 5-point scales, the 4s and 5s were used to
indicate the presence of a motivation. As a result, when participants are
pinpointed as having one motivation, this does not preclude them having
other motivations as well. Indeed, the majority of survey participants do
have more than one motivation. Note there is the possibility that former
vegetarians/vegans may have been impacted by social desirability bias in
reporting their motivations retrospectively.
MotivationsWe asked survey participants to answer upwards
of 40 questions to uncover potential difficulties
they had with their vegetarian/vegan diet, which
were grouped under six overarching pillars:
inconvenience, taste, social, motivations, health,
and other. They were asked to rate each
statement on a 5-point scale: 1 – strongly
disagree, 2 – disagree, 3 – neither agree nor
disagree, 4 – agree, and 5 – strongly agree. As
is common when collapsing 5-point scales, the
4s and 5s were used to indicate the presence of
a difficulty.
The nine most noteworthy difficulties that were
highlighted in the initial findings document
(Asher et al., 2014a), are revisited in this report
to uncover further patterns of note. For a
complete list of the difficulties see Asher et al.,
2014b. Note there is the possibility that former
vegetarians/vegans may have been impacted by
social desirability bias in reporting their
difficulties retrospectively.
Methodology for Motivations and Difficulties
Difficulties
page 21

Asher, K., Green, C. Gutbrod, H., Jewell, M., Hale, G., & Bastian, B. (2014a). Study of current and former vegetarians and vegans: Initial findings. Retrieved from https://faunalytics.org/wp-content/uploads/2015/06/Faunalytics_Current-Former-Vegetarians_Full-Report.pdf
Asher, K., Green, C. Gutbrod, H., Jewell, M., Hale, G., & Bastian, B. (2014b). Study of current and former vegetarians and vegans: Companion to the initial findings. Retrieved from https://faunalytics.org/wp-content/uploads/2015/06/Faunalytics_Current-Former-Vegetarians_Tables-Methodology.pdf
Doidge, J. C., & Segal, L. (2012). Most Australians do not meet recommendations for dairy consumption: Findings of a new technique to analyse nutrition surveys. Australian and New Zealand Journal of Public Health, 36(3), 236–240.
Pollard, T. M., Steptoe, A., & Wardle, J. (1998). Motives underlying healthy eating: Using the Food Choice Questionnaire to explain variation in dietary intake. Journal of Biosocial Science, 30(2), 165–179.
Salvini, S., Hunter, D. J., Sampson, L., Stampfer, M. J., Colditz, G. A, Rosner, B., & Willett, W. C. (1989). Food-based validation of a dietary questionnaire: The effects of week-to-week variation in food consumption. International Journal of Epidemiology, 18(4), 858–867.
References
page 22