fatigue paper1
TRANSCRIPT

8/3/2019 Fatigue Paper1
http://slidepdf.com/reader/full/fatigue-paper1 1/14
European Journal of Scientific ResearchISSN 1450-216X Vol.30 No.3 (2009), pp.437-450
© EuroJournals Publishing, Inc. 2009
http://www.eurojournals.com/ejsr.htm
Fatigue Life Prediction of Lower Suspension Arm Using
Strain-Life Approach
M. M. Rahman
Faculty of Mechanical Engineering, Universiti Malaysia Pahang
Tun Abdul Razak Highway, 26300 Gambang, Kuantan, Pahang, MalaysiaE-mail: [email protected]
Tel: +6095492207; Fax: +6095492244
K. Kadirgama
Faculty of Mechanical Engineering, Universiti Malaysia Pahang
Tun Abdul Razak Highway, 26300 Gambang, Kuantan, Pahang, Malaysia
E-mail: [email protected]
M. M. Noor
Faculty of Mechanical Engineering, Universiti Malaysia Pahang
Tun Abdul Razak Highway, 26300 Gambang, Kuantan, Pahang, MalaysiaE-mail: [email protected]
M. R. M. Rejab
Faculty of Mechanical Engineering, Universiti Malaysia Pahang
Tun Abdul Razak Highway, 26300 Gambang, Kuantan, Pahang, MalaysiaE-mail: [email protected]
S. A. Kesulai
Faculty of Mechanical Engineering, Universiti Malaysia Pahang Tun Abdul Razak Highway, 26300 Gambang, Kuantan, Pahang, Malaysia
Abstract
This paper presents the fatigue life behaviour of lower suspension arm using strain-
life approach. The main objectives of this study are to predict the fatigue life and identifythe critical location and to select the suitable materials for the suspension arm. Aluminum
alloys are selected as a suspension arm materials. The fatigue life predicted utilizing thefinite element based fatigue analysis code. The structural model of the suspension arm wasutilizing the Solid works. The finite element model and analysis were performed utilizing
the finite element analysis code. In addition, the fatigue life was predicted using the strain-
life approach subjected to variable amplitude loading. The three types of variable amplitude
are considered in this study. TET10 mesh and maximum principal stress were considered inthe linear static stress analysis and the critical location was considered at node (6017).
From the fatigue analysis, Smith-Watson-Topper mean stress correction was conservative
method when subjected to SAETRN loading, while Coffin-Manson model is applicablewhen subjected to SAESUS and SAEBRKT loading. From the material optimization, 7075-
T6 aluminum alloy is suitable material of the suspension arm.

8/3/2019 Fatigue Paper1
http://slidepdf.com/reader/full/fatigue-paper1 2/14
Fatigue Life Prediction of Lower Suspension Arm Using Strain-Life Approach 438
Keywords: Lower Suspension arm, finite element analysis, variable amplitude loading,strain-life method, Aluminum alloy
1. Introduction
In automotive industry, aluminum (Al) alloy has limited usage due to their higher cost and lessdeveloped manufacturing process compared to steels. However, Al alloy has the advantage of lower
weight and therefore has been used increasingly in car industry for the last 30 years, mainly as engine
block, engine parts, brake components, steering components and suspension arms where significant
weight can be achieved [1]. The increasing use of Al is due to the safety, environmental andperformance benefits that aluminum offers, as well as the improved fuel consumption because of light
weight. Suspension components, along with wheel rims and brake components are un-sprung masses,
which make weight reduction important for ride quality and response as well as for reducing the totalvehicle weight. Every automotive suspension has two goals, passenger comfort and vehicle control.
Comfort is provided by isolating the vehicle's passengers from road disturbances like bumps or
potholes. Control is achieved by keeping the car body from rolling and pitching excessively, and
maintaining good contact between the tire and the road. One of the important structural limitations of an aluminum alloy is its fatigue properties. This study is aimed at the automotive industry, morespecifically a wrought aluminum suspension system, where safety is of great concern. Most of the time
to failure consists of crack initiation and a conservative approach is to denote the component as failed
when a crack has initiated [2]. This simplification allows designers to use linear elastic stress resultsobtained from multibody dynamic FE (finite element) simulations for fatigue life analysis. The
suspension arm is subjected to cyclic loading and it is consequently exposed to fatigue damage. In the
suspension arm, uncertainty is related to loads expected given to the car component due to individual
driving styles and road conditions. Therefore, the prediction of fatigue life is less accurate even undercontrolled laboratory conditions. Hence the numerical simulation is implemented because of cheap and
easy to perform as well as provide insight to the mechanism [3]. Rahman et al. [3] were studied about
finite element based durability assessment in a two- stroke free piston linear engine component usingvariable amplitude loading. Authors discussed the finite element analysis to predict the fatigue life and
identify the critical locations of the component. The effect of mean stress on the fatigue life also
investigated. The linear static finite element analysis was performed using MSC.NASTRAN. Theresult was capable of showing the contour plots of the fatigue life histogram and damage histogram at
the most critical location. Kyrre [1] was investigated the fatigue assessment of aluminum suspension
arm. Although the methods can be used for all structural alloys, author focuses on aluminum alloys in
automotive structures. The author concluded that the dynamic finite element analysis was verycomputationally intensive. The model must therefore be simple, possibly confined to separate sections
of the vehicle. The authors also applied the Smith-Watson-Topper (SWT) parameter and Morrow mean
stress correction and found that stress-life was better correlation at high fatigue life, but the strain-life
method must be used if plastic overloads are observed.Conle and Mousseau [4] used the vehicle simulation and finite element result to generate the
fatigue life contours for the chassis component using automotive proving ground load history resultcombine with the computational techniques. They concluded that the combination of the dynamics
modeling, finite element analysis is the practical techniques for the fatigue design of the automotive
component. Kim et al. [5] was studied a method for simulating vehicles dynamic loads, but they adddurability. Nadot and Denier [6] have been studied fatigue phenomena for nodular cast iron automotive
suspension arms. The authors found that the major parameter influencing fatigue failure of casting
components are casting defects. The high cycle fatigue behaviour is controlled mainly by surface
defects such as dross defects and oxides while the low cycle fatigue is governed by multiple cracksinitiated independently from casting defects. Svensson et al. [7] was conducted the fatigue life
8/3/2019 Fatigue Paper1
http://slidepdf.com/reader/full/fatigue-paper1 3/14
439 M. M. Rahman, K. Kadirgama, M. M. Noor, M. R. M. Rejab and S. A. Kesulai
prediction based on variable amplitude tests-specific applications. Three engineering components have
been tested with both constant amplitude loading and different load spectra and the results are analyzed
by means of a new evaluation method. The method relies on the Palmgren-Miner hypothesis, but offersthe opportunity to approve the hypothesis validity by narrowing the domain of its application in
accordance with a specific situation. In the first case automotive spot weld components are tested with
two different synthetic spectra and the result is extrapolated to new service spectra. In the second case,the fatigue properties of a rock drill component are analyzed both by constant amplitude tests and by
spectrum tests and the two reference test sets are compared. In the third case, butt welded mild steel isanalyzed with respect to different load level crossing properties and different irregularity factors.
Nolting et al. (2008) was investigated the effect of variable amplitude loading on the fatigue life
and failure mode of adhesively bonded double strap joints made from clad and bare 2024-T3
aluminum. The authors concluded that the fatigue life of a variable amplitude loading spectra can becalculated with reasonable accuracy using an effective stress range vs. life fatigue curve. Molent et al.
[8] was evaluated the spectrum fatigue crack growth using variable amplitude data. This paper
summarizes a recent semi-empirical model that appears to be capable of producing more accurate
fatigue life predictions using flight load spectra based on realistic in-service usage. The new modeldescribed here provides an alternative means for the interpretation of full-scale and coupon fatigue test
data, and can also be used to make reliable life predictions for a range of situations. This is a very
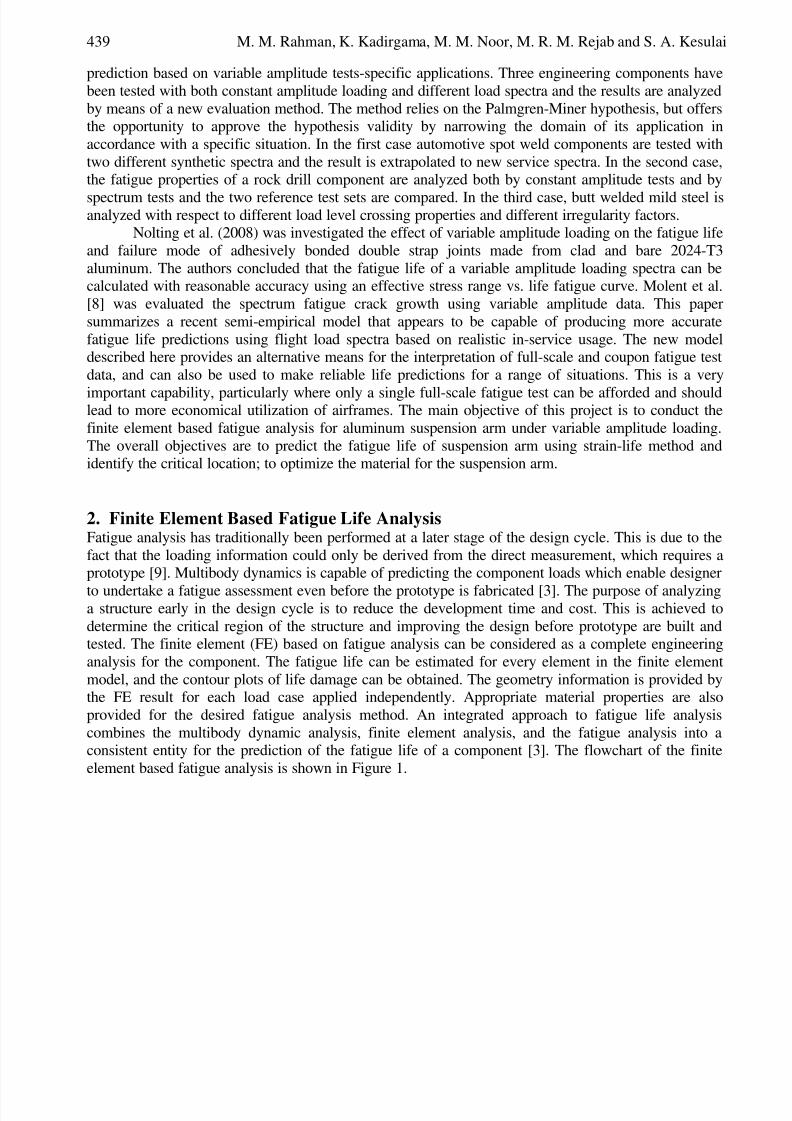
important capability, particularly where only a single full-scale fatigue test can be afforded and shouldlead to more economical utilization of airframes. The main objective of this project is to conduct the
finite element based fatigue analysis for aluminum suspension arm under variable amplitude loading.
The overall objectives are to predict the fatigue life of suspension arm using strain-life method andidentify the critical location; to optimize the material for the suspension arm.
2. Finite Element Based Fatigue Life AnalysisFatigue analysis has traditionally been performed at a later stage of the design cycle. This is due to the
fact that the loading information could only be derived from the direct measurement, which requires aprototype [9]. Multibody dynamics is capable of predicting the component loads which enable designer
to undertake a fatigue assessment even before the prototype is fabricated [3]. The purpose of analyzinga structure early in the design cycle is to reduce the development time and cost. This is achieved to
determine the critical region of the structure and improving the design before prototype are built andtested. The finite element (FE) based on fatigue analysis can be considered as a complete engineering
analysis for the component. The fatigue life can be estimated for every element in the finite element
model, and the contour plots of life damage can be obtained. The geometry information is provided bythe FE result for each load case applied independently. Appropriate material properties are also
provided for the desired fatigue analysis method. An integrated approach to fatigue life analysis
combines the multibody dynamic analysis, finite element analysis, and the fatigue analysis into aconsistent entity for the prediction of the fatigue life of a component [3]. The flowchart of the finite
element based fatigue analysis is shown in Figure 1.

8/3/2019 Fatigue Paper1
http://slidepdf.com/reader/full/fatigue-paper1 4/14
Fatigue Life Prediction of Lower Suspension Arm Using Strain-Life Approach 440
Figure 1: The finite element based fatigue analysis
Cyclic Material
Properties
Component load
HistoriesFatigueAnalysis
Computer AidedDesign
FE ModelB.C andLoads
FE Analysis
Optimization
Fatigue life
Stress /
strain results
Fatigue
Life Ok?
No
NoYes
3. Strain-Life MethodFatigue analyses can be performed using either one of the three basic methodologies including thestress-life approach, strain-life approach, and crack growth approach. The stress-life method was first
applied over a hundred years ago and considers nominal elastic stresses and how they are related to
life. This approach to the fatigue analysis of components works well for situations in which only elasticstresses and strains are present. However, most components may appear to have nominally cyclic
elastic stresses but stress concentrations present in the component may result in local cyclic plastic
deformation. Under these conditions, the local strain-life method uses the local strains as the governing
fatigue parameter. The strain-life approach can be used proactively for a component during earlydesign stages. The local strain-life approach is preferred if the loading history is irregular and where
the mean stress and the load sequence effects are thought to be of importance. The strain-life approach
involves the techniques for converting the loading history, geometry and materials properties(monotonic and cyclic) input into a fatigue life prediction. The operations involved in the prediction
process must be performed sequentially. First, the stress and strain at the critical region are estimatedand then the rainflow cycle counting method [10] is used to reduce the load-time history. The next step
is to use the finite element method to convert the reduced load-time history into a strain-time historyand also to calculate the stress and strain in the highly stressed area. Then, the crack initiation methodsare employed to predict the fatigue life. The simple linear hypothesis proposed by Palmgren [11] and
Miner [12] is used to accumulate the fatigue damage. Finally, the damage values for all cycles are
summed until a critical damage sum (failure criteria) is reached.The fatigue resistance of metals can be characterized by a strain-life curve. These curves are
derived from the polished laboratory specimens tested under completely reversed strain control. The
relationship between the total strain amplitude (2
ε Δ ) and the reversals to failure (2N f ) can be
expressed in Eq. (1) [13-14]. The Coffin-Manson total strain-life is mathematically defined as in Eq.(1).

8/3/2019 Fatigue Paper1
http://slidepdf.com/reader/full/fatigue-paper1 5/14
441 M. M. Rahman, K. Kadirgama, M. M. Noor, M. R. M. Rejab and S. A. Kesulai
( ) ( )c
f f
b
f
f N N
E 22
2ε
σ ε ′+
′=
Δ(1)
where N f is the fatigue life; f σ ′ is the fatigue strength coefficient; E is the modulus of elasticity; b is
the fatigue strength exponent; f ε ′ is the fatigue ductility coefficient; and c is the fatigue ductility
exponent.In designing for the durability, the presence of nonzero mean stress normal stress can influence
fatigue behaviour of materials due to a tensile or compressive normal mean stress. In conjunction withthe local strain-life approach, many models have proposed to quantify the effect of mean stresses onfatigue behaviour. The commonly used models in the ground vehicle industry are those by Morrow
[15] and by Smith, Watson, and Topper [16]. These two models are described in the following
sections. Morrow [15] has proposed the following relationship when a mean stress is expressed in Eq.
(2).
( ) ( ) c
f f
b
f
m f
a N N E
22 ε
σ σ
ε ′+−′
= (2)
The Eq. (2) implies that the mean normal stress taken into account by modifying the elastic part
of the strain-life curve by the mean stress ( mσ ).
Smith, Watson, and Topper [16] proposed another mean stress model which is called Smith-Watson-Topper (SWT) mean stress correction. It is mathematically defined in Eq. (3).
( ) ( ) ( ) cb
f f f
b
f f a N E N E +
′′+′= 2222
max ε σ σ ε σ (3)
where maxσ is the maximum stress, and aε is the strain amplitude.
4. Material InformationMaterial model and material properties play an important role in the result of the FE method. The
material properties are one of the major inputs which is the definition of how a material behaves under
the cyclic loading conditions. The cyclic material properties are used to calculate the elastic-plastic
stress-strain response and the rate at which fatigue damage accumulate due to each fatigue cycle. Thematerials parameters required depend on the analysis methodology being used. The mechanical
properties of 6082-T6 aluminum alloy are shown in Table 1.
Table 1: Mechanical properties of aluminum alloy 6082-T6
Properties Aliminium alloy 6082-T6
Monotonic Properties
Tensile strength,σ UTS (MPa) 330
Yield strength,σ YS (MPa) 307
Young’s modulus, E (GPa) 70
Elongation, εr (%) 9
Cyclic and Fatigue PropertiesFatigue strength exponent, b -0.07
Fatigue strength coefficient, σ΄ f (MPa) 486.8
Fatigue ductility exponent, c -0.593
Fatigue ductility coefficient, ε΄ f 0.209
4. Loading InformationLoading is another major input to the finite element based fatigue analysis. Loading information can be
obtained using a number of different methods. Several types of variable amplitude loading history were
selected from the SAE profiles. It is important to emphasize that these sequences are not indented torepresent standard loading spectrum in the same way that Carlos or Falstaf was performed. However,
8/3/2019 Fatigue Paper1
http://slidepdf.com/reader/full/fatigue-paper1 6/14
Fatigue Life Prediction of Lower Suspension Arm Using Strain-Life Approach 442
they do contain many features which are typical of the automotive industries applications and therefore
are useful in the evaluation of the life estimation methods. The component was loaded with three
random time histories corresponding to typical histories for transmission, suspension and bracketcomponents at different load levels. The first load history has a predominantly tensile (positive) mean
which reflects sudden changes in mean that is referred to as the transmission history. The second load
history has a predominantly compressive (negative) mean that is referred as suspension history. Thethird load history representing a vibration with nearly zero mean loads which is referred as the bracket
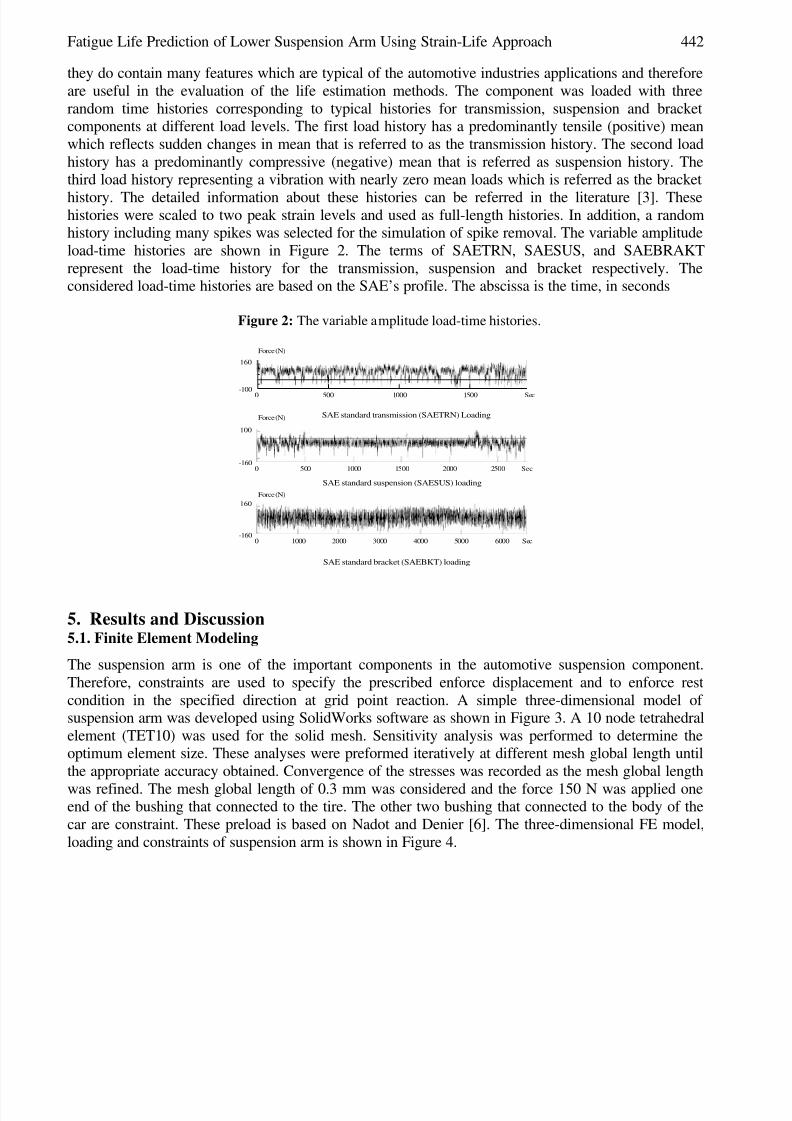
history. The detailed information about these histories can be referred in the literature [3]. Thesehistories were scaled to two peak strain levels and used as full-length histories. In addition, a randomhistory including many spikes was selected for the simulation of spike removal. The variable amplitude
load-time histories are shown in Figure 2. The terms of SAETRN, SAESUS, and SAEBRAKT
represent the load-time history for the transmission, suspension and bracket respectively. Theconsidered load-time histories are based on the SAE’s profile. The abscissa is the time, in seconds
Figure 2: The variable amplitude load-time histories.
0 500 1000 1500-100
160 Force (N)
Sec
SAE standard transmission (SAETRN) Loading
0 500 1000 1500 2000 2500-160
100 Force (N)
SAE standard suspension (SAESUS) loading
Sec
0 1000 2000 3000 4000 5000 6000-160
160 Force (N)
SAE standard bracket (SAEBKT) loading
Sec
5. Results and Discussion5.1. Finite Element Modeling
The suspension arm is one of the important components in the automotive suspension component.
Therefore, constraints are used to specify the prescribed enforce displacement and to enforce rest
condition in the specified direction at grid point reaction. A simple three-dimensional model of suspension arm was developed using SolidWorks software as shown in Figure 3. A 10 node tetrahedral
element (TET10) was used for the solid mesh. Sensitivity analysis was performed to determine theoptimum element size. These analyses were preformed iteratively at different mesh global length until
the appropriate accuracy obtained. Convergence of the stresses was recorded as the mesh global length
was refined. The mesh global length of 0.3 mm was considered and the force 150 N was applied oneend of the bushing that connected to the tire. The other two bushing that connected to the body of the
car are constraint. These preload is based on Nadot and Denier [6]. The three-dimensional FE model,
loading and constraints of suspension arm is shown in Figure 4.

8/3/2019 Fatigue Paper1
http://slidepdf.com/reader/full/fatigue-paper1 7/14
443 M. M. Rahman, K. Kadirgama, M. M. Noor, M. R. M. Rejab and S. A. Kesulai
Figure 3: Structural model and overall dimensions of suspension arm
Figure 4: Three-dimensional FE model, loading and constraints.
5.2. Influence of Mesh Type
Mesh study was performed on the FE model to refine the mesh for the accuracy of the calculated resultdepends on the competitive cost (CPU time). During the analysis, the specific variable and the mesh
convergence was monitored and evaluated. The mesh convergence is based on the geometry, modeltopology and analysis objectives. For this analysis, the auto tetrahedral meshing approach is employedfor the meshing of the solid region geometry. Tetrahedral meshing produce high quality meshing for
boundary representation most of solids model imported from CAD systems. The tetrahedral elements
(TET10) and tetrahedral elements (TET4) are used for the initial analysis based on the loading
conditions (Figure 4). The finite element model using TET4 and TET10 type of elements as shown inFigure 5 and von Mises stress contour is shown in Figure 6 for TET4 and TET10 elements. Analysis
shown that TET10 mesh predicted higher von Mises stress than the TET4 mesh (Figure 6) various
mesh global length. Then, the comparison was made between these two elements based on von Mises,Tresca, maximum principal stresses and displacement are tabulated in Table 2 and 3 for TET 10 and
TET4 respectively. According to the results from Table 2 and 3, it can be seen that the TET10 are able

8/3/2019 Fatigue Paper1
http://slidepdf.com/reader/full/fatigue-paper1 8/14
Fatigue Life Prediction of Lower Suspension Arm Using Strain-Life Approach 444
to capture the higher stresses compared to TET4 for the same mesh global length. Thus, TET10 is used
for overall analysis. Variation of maximum principal stresses and displacement against the global mesh
length are shown in Figure 7 and 8 respectively. It can be seen that the TET10 gives the higher stressand displacement throughout the global mesh length.
Figure 5: (a) TET4, 5559 elements and 1445 nodes; (b) TET10, 5576 elements and 9431 nodes
(a) (b)
Table 2: Variation of stresses at critical location for TET10 mesh.
Mesh Size
(mm)
Total Nodes Total
Elements
von Mises
(MPa)
Tresca (MPa) max principal
stress (MPa)
Displacement
(mm)
0.3 9394 5549 386 394 397 0.054
0.8 7174 4182 374 381 392 0.056
1 6376 3710 363 373 379 0.056
1.3 4861 2761 334 345 363 0.047
1.5 4548 2548 282 289 290 0.039
2 1991 995 197 203 217 0.032
Table 3: Variation of stresses at critical location for TET4 mesh.
Mesh Size
(mm)
Total nodes Total
Elements
von Mises
(MPa)
Tresca (MPa) max principal
stress (MPa)
Displacement
(mm)
0.3 1444 5546 69 72 75 0.013
0.8 1111 4169 60 62 60 0.012
1 987 3693 59 63 58 0.012
1.3 767 2742 50 53 52 0.010
1.5 719 2517 46 49 46 0.009
2 336 969 27 29 29 0.006

8/3/2019 Fatigue Paper1
http://slidepdf.com/reader/full/fatigue-paper1 9/14
445 M. M. Rahman, K. Kadirgama, M. M. Noor, M. R. M. Rejab and S. A. Kesulai
Figure 6: von Mises stresses contours (a) for TET4; (b) for TET10
von Mises stress (MPa)
(a) for TET 4
von Mises stress (MPa)
(b) for TET 10
Figure 7: Variation of maximum principal stress for different element types

8/3/2019 Fatigue Paper1
http://slidepdf.com/reader/full/fatigue-paper1 10/14
Fatigue Life Prediction of Lower Suspension Arm Using Strain-Life Approach 446
Figure 8: Variation of maximum displacement for different element type
5.3. Identification of Mesh Convergence
The convergence of the stress was considered as the main criteria to select the mesh type. The finiteelement mesh was generated using the TET10 for various mesh global length. Figure 9 shows thepredicted results of stresses at the critical location of the suspension arm. It can be seen that the smaller
the mesh size capture the higher predicted stresses. It is concluded from the figure that the maximum
principal stresses is suitable for fatigue analysis. It can seen that mesh size of 0.3 mm (5549 elements)
has obtained the maximum stresses, which is almost flatter in nature. The mesh size smaller than 0.3mm is not implemented due the limitation of computational time (CPU time) and storage capacity of
the computer. Hence, the maximum principal stress based on TET10 at 0.3 mm mesh size is used in the
fatigue life analysis since the stress is higher compared to Von Mises and Tresca principal stress.
Figure 9: Stresses versus mesh size at critical location for TET10 to check mesh convergence.
5.4. Linear Static Stress Analysis
The linear static stress analysis was performed utilizing MSC.NASTRAN to determine the stress and
strain results from finite element model. The material models utilized of linear elastic and isotropic
material. The choice of the linear elastic material model is compulsory. Model loading consists of theapplied mechanical load which is modeled as the load control and displacement control. The fillet of

8/3/2019 Fatigue Paper1
http://slidepdf.com/reader/full/fatigue-paper1 11/14
447 M. M. Rahman, K. Kadirgama, M. M. Noor, M. R. M. Rejab and S. A. Kesulai
the bushing is found to experience the largest stresses. The result of the maximum principal stresses is
used for the fatigue life analysis. The maximum principal stresses distributions of the suspension arm
for the linear static stress analysis is shown in Figure 10 for 6082-T6 aluminum alloy. From the results,the maximum principal stresses of 397 MPa was obtained at node 6017.
Figure 10: Maximum principal stresses contour plotted for 6082-T6 aluminum alloy with SAETRN loading.
Maximum principal stress 397 MPa
at critical location is 6017 node.
Maximum principal stress (MPa)
5.5. Fatigue Analysis
The fatigue life of the suspension arm is initially predicted using 6082-T6 aluminum alloy with
SAETRN loading using the strain-life method. This analysis is focused on the critical location at node6017. The fatigue life is expressed in second for the variable amplitude loading. This analysis was
performed to determine the fatigue life based on various variable amplitude loading time histories suchas SAERTN (positive mean loading), SAESUS (negative mean loading) and SAEBKT (bracket meanloading) as given in Table 4.
Table 4: Fatigue life at critical location of node (1067) for various loading histories for 6082-T6.
Loading conditions Fatigue life (seconds) × 104
Coffin-Manson Morrow SWT
SAETRN 6.8 1.6 1.4
SAESUS 16.21 6.8 9.0
SAEBKT 0.14 2.4 2.7
From Table 4, the fatigue life of the suspension at the critical location of node (1067) forvarious loading histories is different. The SAESUS loading histories gives the higher life compared to
SAETRN and SAEBRKT loading histories. The distribution of fatigue life in term of log of life (sec)
contour plotted for 6082-T6 aluminum alloy with SAETRN, loading histories are showed in Figure 11.

8/3/2019 Fatigue Paper1
http://slidepdf.com/reader/full/fatigue-paper1 12/14
Fatigue Life Prediction of Lower Suspension Arm Using Strain-Life Approach 448
Figure 11: Predicted life contours plotted in term of log of life for 6082-T6 aluminum alloy with SAETRN
loading.
Log of life (sec)
Minimum predicted fatigue
life is 100.883
sec at node 6017.
5.6. Material Optimization
The material optimization was done to determine the suitable material for the suspension arm. The
comparison was made in a series of aluminum alloy such as 2000, 3000, 50000, 6000 and 7000 seriesaluminum alloys. The effect of mean stress such as Morrow and Smith-Watson Topper (SWT) are
considered in this study. The implementation of optimizations is to find out which is the better methodto improve the fatigue life of the suspension especially at the critical location. The results of the
material optimization based on various loading histories are shown in Table 5. It can seen from Table 5
that, 7075-T6 aluminum alloy has the higher life compared to other materials based on SAETRNloading histories at the critical location of node (6017). It is obviously seen that Table 5, SWT method
is more conservative method compared to Morrow and no mean stress correction method for SAETRN
loading conditions while Coffin-Manson model is more conservative in SAESUS and SAEBKT
loading histories. Referring to Table 5, less life is predicted using the variable amplitude loading of SAEBKT compared to SAETRN and SAESUS time histories. Thus it can be said that the minimum
predicted fatigue life at the critical location at node (1067) of the suspension is strongly related to
variable amplitude loading. The acquired results show that, 7075-T6 gives higher fatigue life for thesuspension arm.

8/3/2019 Fatigue Paper1
http://slidepdf.com/reader/full/fatigue-paper1 13/14
449 M. M. Rahman, K. Kadirgama, M. M. Noor, M. R. M. Rejab and S. A. Kesulai
Table 5: Comparison between the different materials for various loading time histories.
Predicted fatigue life at critical location (seconds) × 104
SAETRN SAESUS SAEBKT
Loading cond.
Materials
(Al Alloys) C o f f i n -
M a n s o n
M o r r o w
S W T
C o f f i n -
M a n s o n
M o r r o w
S W T
C o f f i n -
M a n s o n
M o r r o w
S W T
2014-T6 24 22 17 98 108 100.2 3.4 3.9 3.72024-T6 23 20 17 99 125 105.2 5.3 5.7 5.5
3004-H36 4.1 3.6 2.4 13.1 14.4 13.9 ** ** **
5456-H116 4.6 1.8 1.2 17 21.3 19.2 ** ** **
6061-T6 27 18 14 45 49.4 47.1 1.2 1.87 1.7
6062-T6 6.8 1.6 1.4 13.21 17.8 15.9 2.1 2.9 2.7
7075-T6 71 56 47 514 613 568 24.3 45.5 29.2
** Broken
ConclusionA strain-life approach based on finite element of the fatigue life prediction of the suspension arm is
presented. From the analysis conducted, several conclusions can be drawn as follows.(i) Prediction of the fatigue life is focused on critical location of node 6017.
(ii) SWT mean stress correction is conservative method when subjected to SAETRN loading
histories while Coffin-Manson model is applicable in SAESUS and SAEBKT loading histories.(iii) No design modification is made on structural model of the suspension arm
(iv) 7075-T6 is suitable material compared to others material in the optimization.
For further research, the experimental works under controlled laboratory conditions should bedone to determine the validation of the result from the software analysis. Besides, the dimension of the
structural model of the suspension arm should be modified to get the significant result during the
experiment. 7075-T6 aluminum alloy should be considered as the suitable material for the fabricationof the suspension arm.
AcknowledgementThe authors would like to thank Faculty of Mechanical Engineering, Universiti Malaysia Pahang for
provided laboratory facilities and financial support.

8/3/2019 Fatigue Paper1
http://slidepdf.com/reader/full/fatigue-paper1 14/14
Fatigue Life Prediction of Lower Suspension Arm Using Strain-Life Approach 450
References[1] Kyrre, S.A. 2006. Fatigue life prediction of an alluminium alloy automotive component using
finite element analysis of surface topography. PhD Thesis Dissertation. Norwegian Universityof Science and Technology Department of Structural Engineering.
[2] Kyrre, S.A., Skallerud, B., Tveiten, W.T. and Holme, B. 2005. Fatigue life prediction of
machined components using finite element analysis of surface topography, International
Journal of Fatigue. 27: 1590- 1596
[3] Rahman, M.M., Ariffin,A.K., Abdullah, S. and Jamaludin, N. 2007. Finite element baseddurability assessment of a free piston linear engine component. SDHM, 3 (1): 1-13
[4] Conle, F.A and Mousseau, C.W. 1991. Using vehicle dynamic simulation and finite element
result to generate fatigue life contours for chassis component. International Journal of Fatigue
13 (3): 195 - 205.[5] Kim, H.S, Yim, H.J and Kim, C.M. 2002. Computational durability prediction of body structure
in prototype vehicles. International Journal of Automotive Technology 3 (4): 129-136
[6] Nadot, Y. and Denier, V. 2003. Fatigue failure of suspension arm: experimental analysis andmultiaxial criterion. International journal of Fatigue, 11 (4): 485 – 499.
[7] Svensson, T., Johannessona, P. and Mare´a, J.D. 2005. Fatigue life prediction based on variable
amplitude tests—specific applications. International Journal of Fatigue, 27: 966–973.
[8] Molent, L., McDonald, M., Barter, S. and Jones, J. 2007. Evaluation of spectrum fatigue crack growth using variable amplitude data. International Journal of Fatigue, 30 (1): 119-137
[9] Stephens, R.I, Fatemi, A., Stephens, R.R. & Fuchs, H.O. 2000. Metal fatigue in engineering.
New York: John Wiley & Sons, Inc.[10] Matsuishi, M. and Endo, T. 1968. Fatigue of metals subjected to varying stress. Presented to
JSME, Fukuoko, Japan.
[11] Palmgren, A., 1924. Durability of ball bearings. ZVDI, 68(14): 339-341.M.[12] Miner, A., 1945. Cumulative damage in fatigue. Journal of Applied Mechanics. 12: 159-164.
[13] Morrow, J. 1968. Fatigue Design Handbook: Advances in Engineering. Warendale, PA: SAE,
21-29[14] Smith, K.N., Watson, P. and Topper, T.H. 1970. A stress-strain functions for the fatigue on
materials. Journal of Materials. 5 (4): 767-78.[15] Coffin, L.F. 1954. A study of the effects of cyclic thermal stresses on a ductile metal.
Transactions of American Society for Testing and Materials 76: 931-950.[16] Manson, S.S. 1953. Behavior of materials under conditions of thermal stress. Heat Transfer
Symposium, pp. 9-75.