fatigue during muscular exercise
DESCRIPTION
Fatigue During Muscular Exercise. Brooks Chapter 33. Muscular Fatigue. Inability to maintain a given exercise intensity. Several causes for fatigue. Fatigue is task specific. Can have impairment within the active muscle. peripheral fatigue Fatigue can also be due to central factors. - PowerPoint PPT PresentationTRANSCRIPT
1
Fatigue During Muscular Exercise
Brooks Chapter 33
2
Muscular Fatigue
• Inability to maintain a given exercise intensity.
• Several causes for fatigue.
• Fatigue is task specific.
• Can have impairment within the active muscle.– peripheral fatigue
• Fatigue can also be due to central factors.– psychological– environmental (heat)
3
Muscular Fatigue
• Depends on the training and activity status of the individual.
• Can be due to depletion of key metabolites in the muscle.
• Can be due to accumulation of metabolites.
• Identifying the cause of fatigue is not simple.

4
Identifying Fatigue• The inability to maintain a given exercise
intensity.
• An athlete is rarely completely fatigued.– they adopt a lower power output
• Often fatigue can be related to a specific cause or site. ( glycogen, Ca2+)
• The causes of fatigue can also be general and involve several factors (dehydration).
5
• Compartmentalization in physiological organization make it difficult to identify the site of fatigue.– eg. ATP depleted at myosin head, but adequate
elsewhere?
• The effect of exercise at an absolute, or relative, exercise intensity will be more severe on an untrained individual.

6
• Heat and humidity will affect endurance performance. sweat, heat gain, dehydration, electrolyte shift– redistribution of CO in the heat– uncouple oxidation and phos in mitochondria
• less ATP with same VO2
– irritant to CNS, affect psychological perception of exercise
– fatigue is cumulative over time• previous day dehydration will influence current performance
– glycogen depletion endurance performance
7
Metabolite Depletion
ATP and CP • the immediate source of ATP is CP • CP in muscle is limited• when CP is depleted, muscle ATP is • must match use with restoration• otherwise you can not maintain exercise• the greater the work load, the greater the CP
depletion• CP depletion leads to muscle fatigue

8
• CP levels decline in two phases: drop rapidly, then slowly (Fig 33, 1a).– both severity of the first drop and extent of the final
drop are related to work intensity
• Fatigue in maximal cycling coincides with CP depletion. – tension developed related to CP level, therefore CP
related to fatigue
9
ATP• ATP is well maintained up to maximum effort.
– due to compartmentalization– down regulation by muscle cells for protection– muscle cell shuts off contraction, with ATP
depletion, in favor of maintaining ion gradients– free energy of ATP declines 14% in physiological
pH range • also depends on ATP/ADP ratio• consequence: less energy available for work with
given VO2 flux• fatigue also influences ATP binding in X-bridge
cycle

10
Glycogen• Glycogen depletion in skeletal muscle is associated
with fatigue.
• With moderate activity glycogen is depleted uniformly from different fiber types.
• With low resistance activity there is selective recruitment and depletion of glycogen from slow twitch (type I) fibers.
• With high resistance type II fibers are depleted.
• Thus glycogen can be depleted from specific fibers.

11
Blood Glucose• During short intense exercise bouts, blood
glucose above pre-ex levels as the CNS stimulates hepatic glycogenolysis.
• During prolonged exercise glucose production may be limited to gluconeogenesis because of hepatic glycogen depletion.
• Thus glucose production may fall below that required by working muscle and other essential tissues.

12
Lactic Acid Accumulation• During short term high intensity exercise
– lactic acid production exceeds removal– strong organic acid: pH – it is the H+ rather than the lactate ion that pH
• H+ accumulation within muscle– inhibit PFK and slow glycolysis– displace Ca2+ from troponin (inhibit contraction)– main stimulate pain receptors

13
• H+ in blood – reacts in the brain and causes pain, nausea– inhibits combination of O2 with Hb in the lung– reduces hormone sensitive lipase in adipose tissue
• limits release of FFA
• It is still uncertain if pH stops exercise.
14
Phosphates• Phosphagen depletion during exercise results in
phosphate (Pi, or HPO42-) accumulation.
• Phosphate behaves like H+ and inhibits glycolysis (PFK) and interferes with Ca2+ binding.
• Phosphate and H+ produce hydrogen phosphate which is a very harmful metabolite that accumulates in working muscle.
15
Calcium Ion
There are several reasons why Ca2+ may be involved in muscle fatigue:
• Ca2+ from the SR during EC may be taken up by mito– interferes with mitochondrial function
• reduced ability of SR to release Ca2+ during twitches– less forceful contraction
• actin-myosin sensitivity to Ca2+ is reduced – less forceful contraction
• Ca2+ re-uptake by SR is slowed– prolongs contraction, slows relaxation

16
O2 Depletion and Muscle Mitochondrial Density
• The depletion of O2 stores, or inadequate O2 delivery to muscle, can result in fatigue.– impaired circulation– high altitude– strenuous exercise
• Adequate O2 supply is essential to support maximal aerobic work.

17
• Inadequate O2 supply or utilization can be represented by: CP levels lactate production– both
• Thus inadequate O2 can result in at least 2 fatigue causing effects.
18
• Skeletal muscles contain a greater mito respiratory capacity than can be supplied by the circulation.
mito density in response to endurance exercise will provide benefits other than VO2. capacity to oxidize fatty acids as a fuel– minimize mito damage during exercise
• free radical accumulation• more mitos, reduced effect of free radicals

19
Disturbances to Homeostasis
• The continuation of exercise depends on the integrated functioning of many systems.
• Any factor that upsets this integrated function can cause fatigue.
• Some important factors that maintain homeostasis include: ions (K+, Na+, Ca2+), blood glucose, FFA, plasma volume, pH, core temp, hormone levels.

20
Central and Neuromuscular Fatigue
• In the linkage between afferent inputs and the performance of a task, several sites require adequate functioning.
• A decrement at any site will performance (fatigue).
• Therefore it is possible to have muscular fatigue when the muscle itself is not impaired.

21
• It is very difficult to obtain data on CNS function during exercise.
• The relationship between central and peripheral functions should not be overlooked.
• Physiological signals can lead to psychological inhibition.– eg. painful inputs affect willingness to
continue activity

22
Setchenov Phenomenon
• The exhausted muscle of one limb recovers faster if the opposite limb is exercised moderately during recovery.– repeated by other researchers– not due to muscle blood flow– it is attributed to afferent input having a
facilitatory effect on the brain’s reticular formation and motor centers.
23
Psychological Fatigue• We have a very limited understanding of how
afferent input during exercise (pain, breathing, nausea, motivation) can influence the physiology of the CNS.
• Through training or intrinsic mechanisms, some athletes learn to minimize the influence of distressing afferents and approach performance limits of the musculature.
• Some athletes (altitude) will slow down to reduce discomforting inputs to a tolerable level.
• Training at high intensities allows athletes to select a proper race intensity.
24
Heart as a Site of Fatigue• No direct evidence that exercise is limited
by fatigue of the heart muscle.
• Well oxygenated during exercise.
• Heart gets first choice at CO.• Can use lactate or FFA as fuel.
• During severe dehydration– major fluid and electrolyte shift– K+, Na+, Ca2+can affect e-c coupling
• cardiac arrhythmia is possible

25
VO2max and Endurance• Relationship between max O2 consumption and
upper limit for aerobic metabolism.1. VO2max limited by O2 transport – CO and arterial content of O2
2. VO2max limited by the respiratory capacity of contracting muscles.
• Currently we can conclude that VO2max is a parameter set by maximal O2 transport, while endurance is also determined by muscle respiratory capacity.
26
Muscle Mass• Muscle mass influences VO2max.
• Once a critical mass of muscle is utilization VO2 is independent of muscle mass.– VO2 when cycling with 1 leg is < than with 2– 2 x VO2 of 1 leg is much greater than 2 legs– VO2max when cycling and arm cranking is not greater
than just cycling alone.
• VO2max as active muscle mass to a point beyond which O2 delivery is inadequate to supply working muscle.
27
Muscle Mitochondria• Correlation observed between VO2max and mito
activity - 0.8.
• Mito and VO2max with training and detraining– muscle mito 30%, VO2 19%– VO2 persistent longer during detraining than muscle
respiratory capacity– illustrates independence of these factors
• The maximal ability of muscle mito to consume O2 is several times the ability to supply O2.– hence, VO2max is limited by arterial O2 transport
28
Arterial O2 Transport
• Arterial O2 transport (TaO2) is equal to the product of cardiac output (Q) and arterial O2 content(CaO2).
TaO2 = Q(CaO2)
• Attempts to raise arterial O2 content by breathing O2 conc or blood doping raise VO2max.
29
VO2max and Performance
• Maximal capacities of cardiac output, arterial O2 transport, VO2max and physical performance are all interrelated.
• Despite these correlations, VO2max is a poor predictor of performance among elite athletes.
• This is due to the importance of peripheral, as opposed to central, factors in determining endurance.

30
Catastrophy Theory
• Physiological processes are highly controlled and often redundant in function.
• Successes and failures in integrated functions involve multiple cells, tissues, organs, and systems.
• Catastrophy theory: the failure of one enzyme system, cell, tissue organ or system places a burden on related systems, such that they may fail simultaneously.
31
Future of Fatigue• Technology is making available new devices
that will further investigation of fatigue.
• NMR– nuclear magnetic resonance spectroscopy– radio freq signal emitted by a particular
atomic species– determine concentrations of: ATP, CP, Pi,
water, fat, metabolites without breaking the skin

32
PET• Positron emission tomography.• Great potential for studying regional
blood flow and metabolism.
NIRS• Near infrared spectroscopy.• Noninvasively and continuously monitor
the state of oxygenation of iron containing compounds (myoglobin).
33
Fatigue and Physical Training To date there is no formal training theory
that quantitatively and accurately prescribes the pattern, duration and intensity of exercise to elicit a specific physiological adaptation.
Without accurate quantification of a training dose, the results from training studies to date remain qualitative and argumentative.

34
A training model developed by Banister et al. (1975) uses a unit of measure called a training impulse (TRIMP) to accurately quantify a training dose.
• This training theory proposes that a precisely measured quantity of training above that currently practiced will improve physical, physiological, and biochemical indices of adaptation and growth.
35
An individual’s daily training is quantified by calculating a training impulse [w(t)], which represents the integrated effect of duration (D) and intensity (Y) of exercise.
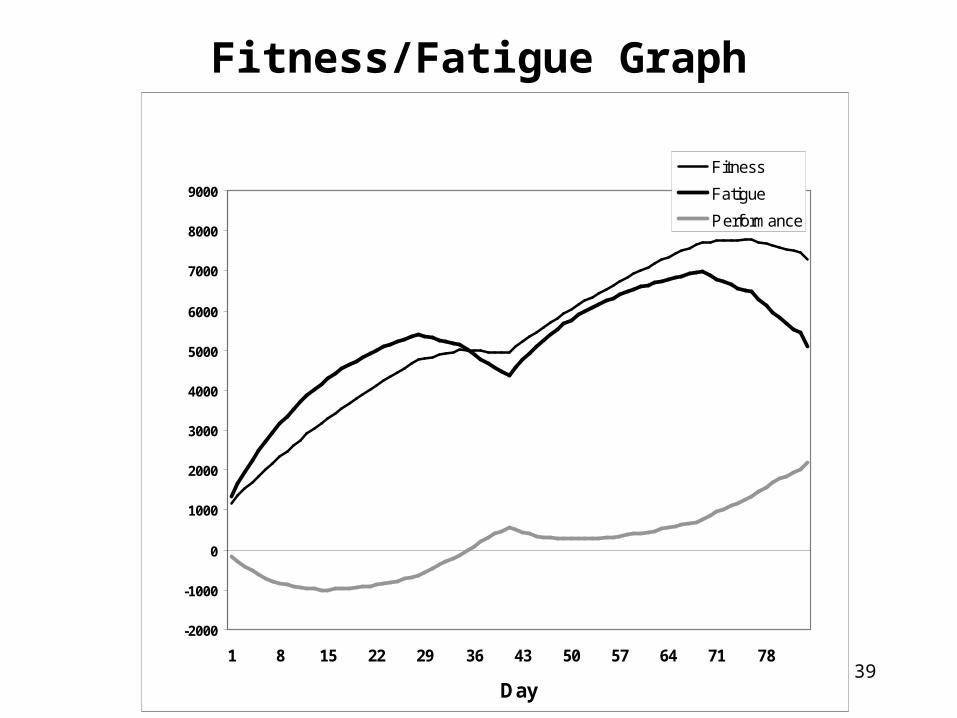
Exercise performance may be predicted by transforming a daily TRIMP score [w(t)] into separate daily scores of a hypothesized fitness [g(t)] and fatigue [h(t)].
36
The time course of the difference between fitness and fatigue represents the time course of predicted physical performance p(t), due to the training. Thus fitness and fatigue grow and decay exponentially throughout a period of training.
During a taper period fatigue decays much faster than fitness, and the predicted performance increases.
37
An effective training format is one that has an “on” stimulus of 28 days, in which the exercise has the proper intensity and duration to induce a positive exponential growth response in physiological and biochemical variables.
A 7 – 14 day taper at the end of the 28 day training program, will then allow fatigue to decay faster than fitness.
The end of the taper period provides a time when there is a maximal separation between fitness and fatigue, and performance reaches a peak.

38
12 Week Training Program
Week 1 2 3 4 5 6 7 8 9 10 11 12
TRIM
PS
4 Weeks of Training (T1)
4 Weeks of Training (T2)
Taper
Taper
75% T1
50% T1
75% T2
50% T2
39
Fitness/Fatigue Graph
-2000
-1000
0
1000
2000
3000
4000
5000
6000
7000
8000
9000
1 8 15 22 29 36 43 50 57 64 71 78
Day
Fitness
Fatigue
Performance