fatal occupational injuries in selected agricultural industries 2005 – 2012 (midwest region)...
TRANSCRIPT

FATAL OCCUPATIONAL INJURIES IN SELECTED AGRICULTURAL INDUSTRIES
2005 – 2012 (Midwest Region)January 2015
POPULATION
• Data are from the Census of Fatal Occupational Injuries
• 2005 – 2012 (1,858 fatalities)• Midwest region: Illinois, Indiana, Iowa,
Kansas, Michigan, Minnesota, Missouri, Nebraska, North Dakota, Ohio, South Dakota, and Wisconsin
• Ag industries included: Crop production, Animal production, and Support activities for crop/animal production

Agriculture-Related Occupational Fatalities in Twelve Midwestern States By Year
2005 2006 2007 2008 2009 2010 2011 20120
50
100
150
200
250
300272
214 224248
237257
208 198
# F
ata
liti
es
SOURCE: Fatal occupational injury data were generated by the Great Plains Center for Agricultural Health with restricted access to BLS CFOI microdata (2005-2012), Midwest Region

Agriculture-Related Occupational Fatalities in Twelve Midwestern States By Year(Rates per 100,000 farm operators)
2005 2006 2007 2008 2009 2010 2011 20120
5
10
15
20
25 23.36
18.3819.24
21.30 20.3522.07
17.86 17.00
Rate
per
10
0,0
00
farm
op
era
tors
SOURCE: Fatal occupational injury data were generated by the Great Plains Center for Agricultural Health with restricted access to BLS CFOI microdata (2005-2012), Midwest Region
Rates obtained from the U.S. Department of Agriculture, National Agricultural Statistics Service (Quick Stats), 2007 Census of Agriculture
272 214 224 248 237 257 208 198

Agriculture-Related Occupational Fatalities in Twelve Midwestern States By Age
< 16 16-24 25-44 45-64 65+0
100
200
300
400
500
600
700
800
900
55104
260
673
766
Years
# F
ata
liti
es
SOURCE: Fatal occupational injury data were generated by the Great Plains Center for Agricultural Health with restricted access to BLS CFOI microdata (2005-2012), Midwest Region

Agriculture-Related Occupational Fatalities in Twelve Midwestern States By Age (Rates per 100,000 farm operators)
< 25 25-44 45-64 65+0
100200300400500600700800900
1,000883.43
111.68 112.72
257.89
Years
Rate
per
10
0,0
00
farm
op
era
tors
SOURCE: Fatal occupational injury data were generated by the Great Plains Center for Agricultural Health with restricted access to BLS CFOI microdata (2005-2012), Midwest Region
159 260 673 766

Agriculture-Related Occupational Fatalities in Twelve Midwestern States By Gender
103; 6%
1755; 94%
Fe-malesMales
SOURCE: Fatal occupational injury data were generated by the Great Plains Center for Agricultural Health with restricted access to BLS CFOI microdata (2005-2012), Midwest Region
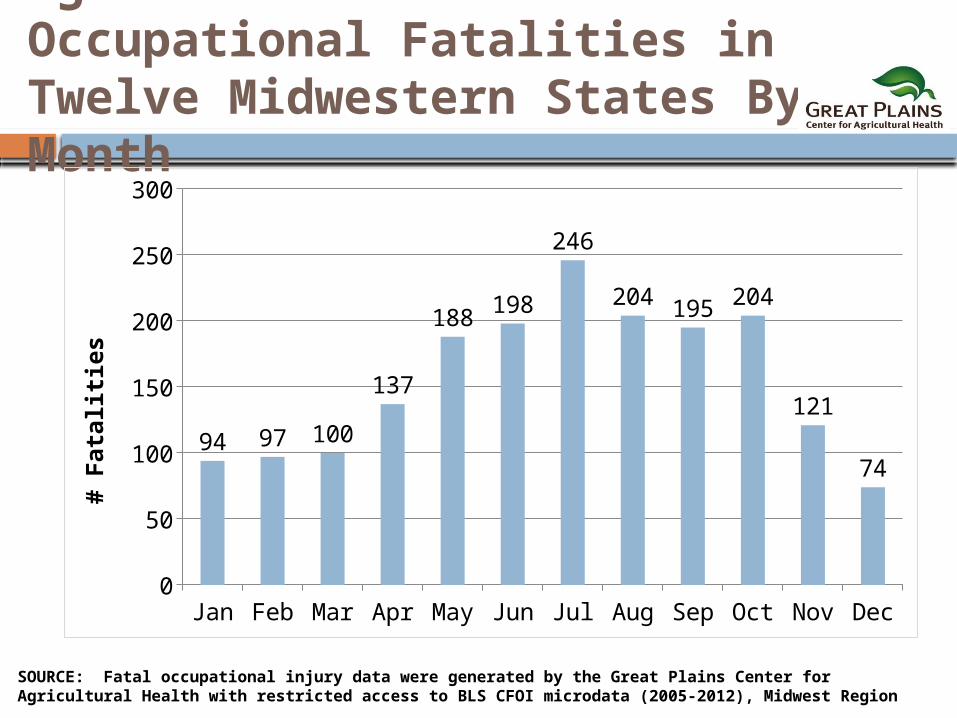
Agriculture-Related Occupational Fatalities in Twelve Midwestern States By Month
Jan Feb Mar Apr May Jun Jul Aug Sep Oct Nov Dec0
50
100
150
200
250
300
94 97 100
137
188 198
246
204 195 204
121
74# F
ata
liti
es
SOURCE: Fatal occupational injury data were generated by the Great Plains Center for Agricultural Health with restricted access to BLS CFOI microdata (2005-2012), Midwest Region
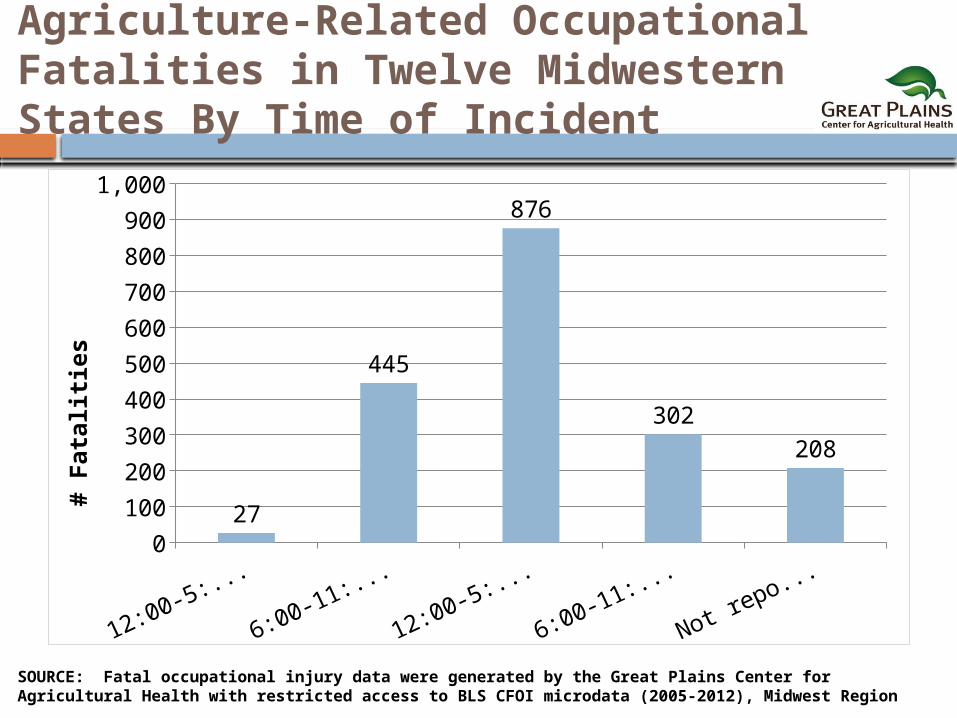
Agriculture-Related Occupational Fatalities in Twelve Midwestern States By Time of Incident
12:00-5:...
6:00-11:...
12:00-5:...
6:00-11:...
Not repo...
0
100
200
300
400
500
600
700
800
900
1,000
27
445
876
302208
# F
ata
liti
es
SOURCE: Fatal occupational injury data were generated by the Great Plains Center for Agricultural Health with restricted access to BLS CFOI microdata (2005-2012), Midwest Region

Agriculture-Related Occupational Fatalities in Twelve Midwestern States By Location of Incident
Industrial place/Premise
Home
Other place
Street/Highway
Farm
0 200 400 600 800 1,000 1,200 1,400 1,600
18
23
50
285
1482
# Fatalities
SOURCE: Fatal occupational injury data were generated by the Great Plains Center for Agricultural Health with restricted access to BLS CFOI microdata (2005-2012), Midwest Region
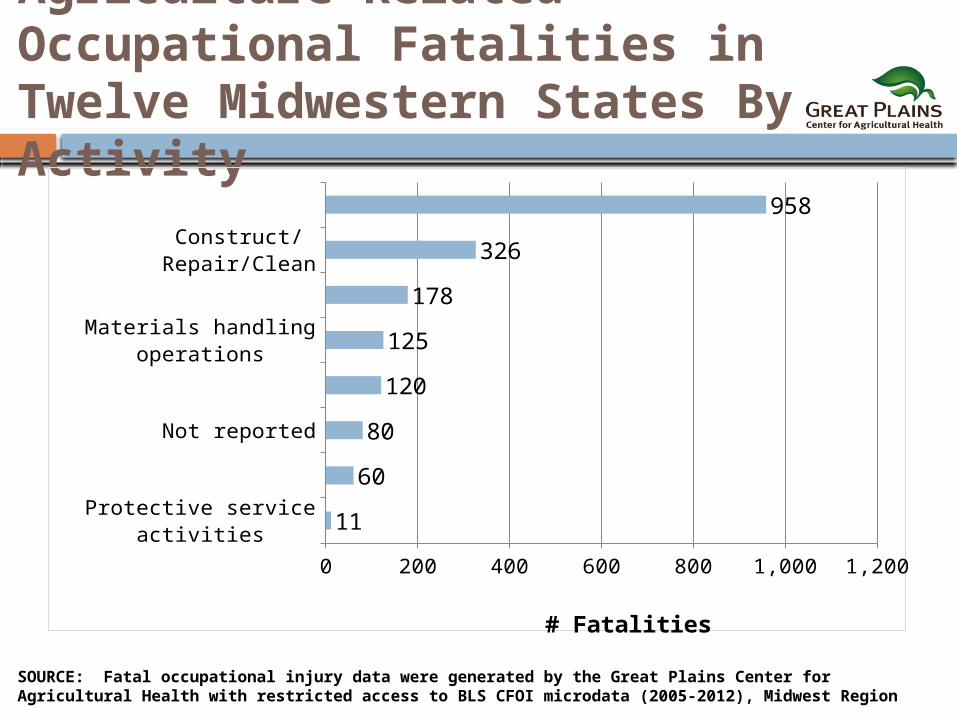
Agriculture-Related Occupational Fatalities in Twelve Midwestern States By Activity
Protective service activities
Physical activities (NEC)
Not reported
Other
Materials handling operations
Tools/Machinery
Construct/Repair/Clean
Vehicle/Transportation operations
0 200 400 600 800 1,000 1,200
11
60
80
120
125
178
326
958
# Fatalities
SOURCE: Fatal occupational injury data were generated by the Great Plains Center for Agricultural Health with restricted access to BLS CFOI microdata (2005-2012), Midwest Region

Agriculture-Related Occupational Fatalities in Twelve Midwestern States By Age and Activity
< 16
16-24
25-44
45-64
65+
0 50 100 150 200 250 300 350 400 450
5
13
27
33
7
12
21
43
42
32
53
125
330
418
7
14
49
47
9
37
62
66
17
43
130
134
29
22
Vehicle/Transportation operations Construct/Repair/Clean*Tools/Machinery* Other*Materials handling operations Not reported*
# Fatalities
SOURCE: Fatal occupational injury data were generated by the Great Plains Center for Agricultural Health with restricted access to BLS CFOI microdata (2005-2012), Midwest Region P=0.06
4
* No data or data that do not meet BLS publication criteria

Agriculture-Related Occupational Fatalities in Twelve Midwestern States By Primary Source of Injury
Tools/Instruments/Equipment
Containers/Furniture/Fixtures
Other sources
Persons/Plants/Animals/Minerals
Vehicles
0 200 400 600 800 1,000 1,200
18
33
44
50
71
109
212
287
1031
# Fatalities
SOURCE: Fatal occupational injury data were generated by the Great Plains Center for Agricultural Health with restricted access to BLS CFOI microdata (2005-2012), Midwest Region

Agriculture-Related Occupational Fatalities in Twelve Midwestern States By Secondary Source* of Injury
Chemicals/Chem. Products
Tools/Instruments/Equipment
Other secondary sources
Parts/Materials
Machinery
Containers/Furniture/Fixtures
Structures/Surfaces
Persons/Plants/Animals/Minerals
Vehicles
0 50 100 150 200 250
7
35
75
76
92
99
124
130
204
# Fatalities
SOURCE: Fatal occupational injury data were generated by the Great Plains Center for Agricultural Health with restricted access to BLS CFOI microdata (2005-2012), Midwest Region
* 1,016 deaths did not have a secondary source

Agriculture-Related Occupational Fatalities in Twelve Midwestern States By Cause of Injury
Fires/Explosions
Harmful substances/Environment exposures
Falls
Assaults/Violent activities
Contact with objects/equipment
Transportation-related
41
87
108
122
586
913
# Fatalities
SOURCE: Fatal occupational injury data were generated by the Great Plains Center for Agricultural Health with restricted access to BLS CFOI microdata (2005-2012), Midwest Region

Agriculture-Related Occupational Fatalities in Twelve Midwestern States By Age and Cause of Injury
< 16
16-24
25-44
45-64
65+
0 50 100 150 200 250 300 350 400
19
29
83
211
244
30
53
120
322
388
12
24
34
14
6
18
51
44
6
11
24
8
44
52
Transportation-related Contact with objects/equipmentAssaults/Violent activities* Falls*Harmful substances/environment exposures* Fires/Explosions*
# Fatalities
SOURCE: Fatal occupational injury data were generated by the Great Plains Center for Agricultural Health with restricted access to BLS CFOI microdata (2005-2012), Midwest Region P<0.000
1
* No data or data that do not meet BLS publication criteria

Agriculture-Related Occupational Fatalities in Twelve Midwestern States By Nature of Injury
Environmental effects
Burns
Open wounds
Bone/Nerve/Spinal cord injuries
Other injuries
Asphyxia
Intracranial injuries
Internal organ/Blood vessel
Multiple injuries
0 100 200 300 400 500 600
10
29
50
54
114
287
300
473
536
# Fatalities
SOURCE: Fatal occupational injury data were generated by the Great Plains Center for Agricultural Health with restricted access to BLS CFOI microdata (2005-2012), Midwest Region
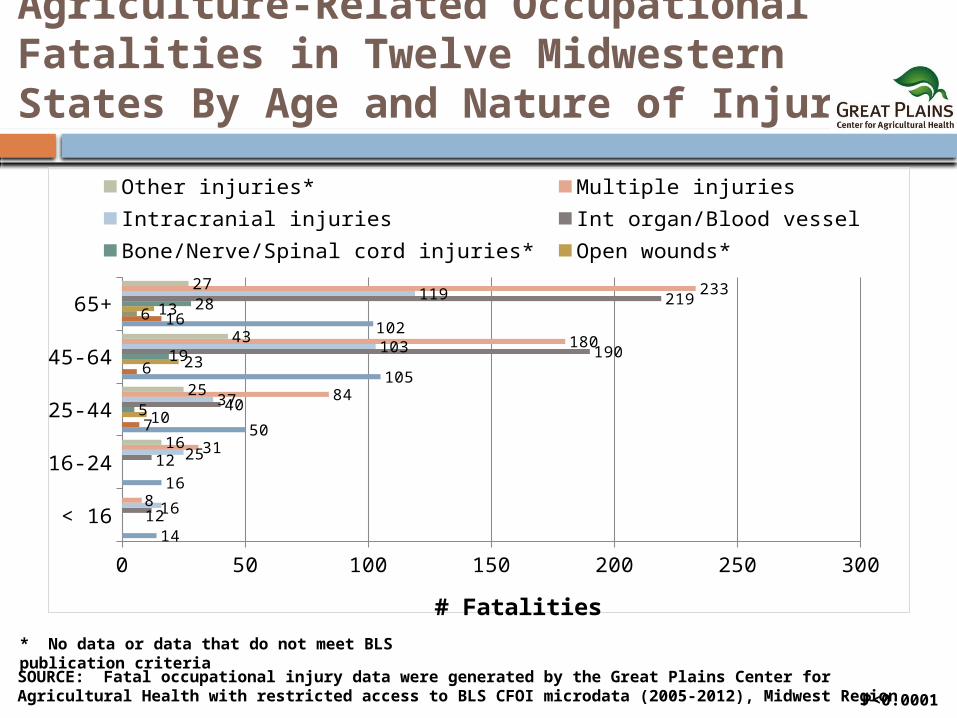
Agriculture-Related Occupational Fatalities in Twelve Midwestern States By Age and Nature of Injury
< 16
16-24
25-44
45-64
65+
0 50 100 150 200 250 30014
16
50
105
102
12
12
40
190
219
16
25
37
103
119
8
31
84
180
233
16
25
43
27
7
6
16
10
23
13
5
19
286
Other injuries* Multiple injuriesIntracranial injuries Int organ/Blood vesselBone/Nerve/Spinal cord injuries* Open wounds*Environ effects* Burns*
# Fatalities
SOURCE: Fatal occupational injury data were generated by the Great Plains Center for Agricultural Health with restricted access to BLS CFOI microdata (2005-2012), Midwest Region P<0.0001
* No data or data that do not meet BLS publication criteria

Agriculture-Related Occupational Fatalities in Twelve Midwestern States By Cause and Nature of Injury
Fires/Explosions
Harmful substances/environment exposures
Falls
Assaults/Violent activities
Contact with objects/equipment
Transportation-related
0 50 100 150 200 250 300 350 400
8
26
19
145
338
6
76
25
23
914
15
24
45
24
68
160
13
35
177
247
26
1815
160
106
Environ effects* Burns*Int organ/Blood ves.* Asphyxiation*Other injuries* Multiple injuries*Intracranial injuries* Bone/Nerve/Spinal cord injuries*
# Fatalities
SOURCE: Fatal occupational injury data were generated by the Great Plains Center for Agricultural Health with restricted access to BLS CFOI microdata (2005-2012), Midwest Region
* No data or data that do not meet BLS publication criteria
P <0.0001
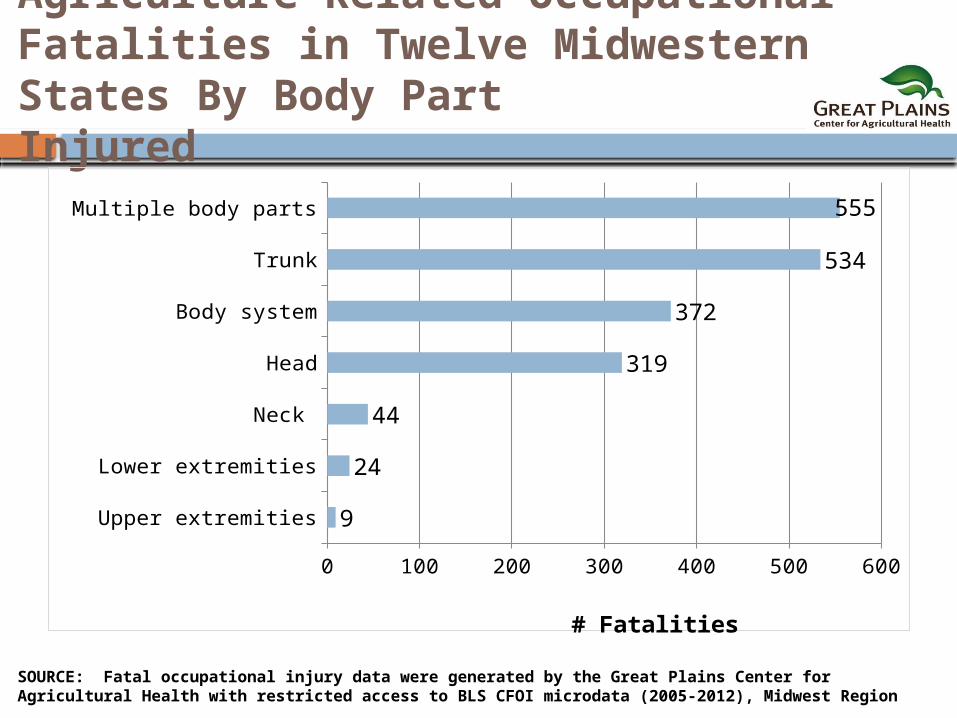
Agriculture-Related Occupational Fatalities in Twelve Midwestern States By Body Part Injured
Upper extremities
Lower extremities
Neck
Head
Body system
Trunk
Multiple body parts
0 100 200 300 400 500 600
9
24
44
319
372
534
555
# Fatalities
SOURCE: Fatal occupational injury data were generated by the Great Plains Center for Agricultural Health with restricted access to BLS CFOI microdata (2005-2012), Midwest Region

Agriculture-Related Occupational Fatalities in Twelve Midwestern States By # Days from Injury to Death
0 1 2 3-7 8-14 15+0
200
400
600
800
1,000
1,200
1,400
1,600
1,8001591
97 33 43 33 61
Days
# F
ata
liti
es
SOURCE: Fatal occupational injury data were generated by the Great Plains Center for Agricultural Health with restricted access to BLS CFOI microdata (2005-2012), Midwest Region

Agriculture-Related Occupational Fatalities in Twelve Midwestern States By # Days from Injury to Death and Age
< 25 25-44 45-64 65+0
100
200
300
400
500
600
700
800
900
140231
594 626
9
11
3245
5
818
6
1320
7
2119
36
0 1 2* 3-7* 8-14* 15+*
# F
ata
liti
es
SOURCE: Fatal occupational injury data were generated by the Great Plains Center for Agricultural Health with restricted access to BLS CFOI microdata (2005-2012), Midwest Region P=0.0
66
* No data or data that do not meet BLS publication criteria

DISCLAIMER
• This research was conducted with restricted access to Bureau of Labor Statistics (BLS) data.
• The views expressed here do not necessarily reflect the views of the BLS