fast-tracking “green” patent applications: an empirical ... · fast-tracking 'green'...
TRANSCRIPT
Fast-tracking “green” patent applications: an
empirical analysis
Antoine Dechezleprêtre
February 2013
Centre for Climate Change Economics and Policy Working Paper No. 127
Grantham Research Institute on Climate Change and the Environment
Working Paper No. 107
The Centre for Climate Change Economics and Policy (CCCEP) was established by the University of Leeds and the London School of Economics and Political Science in 2008 to advance public and private action on climate change through innovative, rigorous research. The Centre is funded by the UK Economic and Social Research Council and has five inter-linked research programmes:
1. Developing climate science and economics 2. Climate change governance for a new global deal 3. Adaptation to climate change and human development 4. Governments, markets and climate change mitigation 5. The Munich Re Programme - Evaluating the economics of climate risks and
opportunities in the insurance sector More information about the Centre for Climate Change Economics and Policy can be found at: http://www.cccep.ac.uk. The Grantham Research Institute on Climate Change a nd the Environment was established by the London School of Economics and Political Science in 2008 to bring together international expertise on economics, finance, geography, the environment, international development and political economy to create a world-leading centre for policy-relevant research and training in climate change and the environment. The Institute is funded by the Grantham Foundation for the Protection of the Environment and the Global Green Growth Institute, and has five research programmes:
1. Global response strategies 2. Green growth 3. Practical aspects of climate policy 4. Adaptation and development 5. Resource security
More information about the Grantham Research Institute on Climate Change and the Environment can be found at: http://www.lse.ac.uk/grantham. This working paper is intended to stimulate discussion within the research community and among users of research, and its content may have been submitted for publication in academic journals. It has been reviewed by at least one internal referee before publication. The views expressed in this paper represent those of the author(s) and do not necessarily represent those of the host institutions or funders.
Fast-tracking 'green' patent applications: An empirical analysis
Antoine Dechezleprêtre, Grantham Research Institute on Climate Change and the Environment, London School of Economics and Political Science
February 2013
Acknowledgements This work was financially supported by the International Centre for Trade and Sustainable Development (ICTSD). I am grateful to Carsten Fink (WIPO), Allison Mages (GE Corporate), Eric Lane (McKenna Long & Aldridge LLP), Ahmed Abddel Latif and Pedro Roffe (ICTSD) for very helpful comments on an earlier version of the paper. I wish to thank Hélène Dernis (OECD), Tony Clayton, Sean Dennehey, Rachelle Harris and Gill Price (UK IPO), Geoff Sadlier and Kim Hindle (IP Australia), Elias Collette and Rashid Nikzad (Canada IPO), Noa Amit (Israel Patent Office), Michael Bowman and Arleen Zank (Wayfinder Digital) for their invaluable help in collecting the data. Participants at the Green patents dialogue, Geneva, 22 November 2012 and at the Cleantech Patenting Strategies Conference, London, 5 February 2013, have all improved this work. Simone Pomari provided excellent research assistance.
Abstract This paper presents the first empirical analysis of programmes to fast-track ‘green’ patent applications in place in seven Intellectual Property offices around the world. We find that only a small share of green patent applications (between 1% and 20% depending on the patent office) request accelerated examination, suggesting that patent applicants have a strong incentive to keep their patent applications in the examination process for as long as possible. Fast-tracking programmes reduce the examination process by several years compared to patents going through normal examination procedure and have seemingly accelerated the diffusion of technological knowledge in green technologies. In addition, we find that applicants require accelerated examination for patents of relatively higher value and that fast-tracking programmes seem to be particularly appealing to start-up companies in the green technology sector that are currently raising capital but still generate small revenue.
1. Introduction In the past few years, promoting environmentally-friendly innovation has become a key priority for national and international environmental policy. "Green" innovation is envisioned by governments not only as an essential means to tackle environmental issues and promote sustainable development, but also as a potential driver of economic growth, especially in a time of economic downturn. Indeed, environment-related industries such as renewable energy generation are some of the few sectors of the economy that still experience significant growth. Against this background, a number of national intellectual property offices around the world have recently put in place measures to fast track ‘green’ patent applications. These include Australia, Canada, Israel, Japan, Korea, the UK, and the US1. More recently, the Brazilian National Institute of Industrial Property (INPI) and China's State Intellectual Property Office (SIPO) have launched similar programmes2. The common objective of these schemes is to allow patents covering "green" technologies to be examined as a matter of priority. As a consequence, the time needed to obtain a granted patent could be significantly reduced3, from several years to just a few months. There are several advantages to a reduced examination process. It allows patent applicants to start licensing their technologies sooner, thereby reducing the time to market for green technologies. Possessing a granted patent may also help start-up companies to raise private capital (Lane, 2012). For these reasons, green patents fast-track schemes have been expected to accelerate the diffusion of clean technologies4. However, an early grant may not always be in the interest of patent applicants, who may prefer to wait until the market for the technology develops before requesting a grant and incur the associated costs. Therefore, whether fast-tracking programmes are successful in practice needs to be examined in light of empirical evidence. With the earliest green patent fast track programme now in place for three years, it is possible to provide a first empirical analysis of the fast-tracking procedures. The purpose of this study is to provide such an analysis, based on data from Australia, Canada, Israel, Japan, Korea, the UK, and the US5. In order to analyse the characteristics of fast-tracked patents and of companies that resort to these programmes, data sets were assembled from the various patent offices and combined with the worldwide patent database PATSTAT and with the financial database ORBIS. The data analysis was complemented with interviews with patent attorneys and IP professionals. 1 In the US, the program was designed to be temporary and was closed after the 3,500th
application under the scheme was received.
2 The European Patent Office (EPO) does not have a fast-tracking programme for green patent
applications. However, the EPO has an accelerated examination procedure that is open to all
patent applications irrespective of the technology covered.
3 Note that accelerated procedures have not been specifically put in place for green patents. Such
procedures exist in various patent offices. See Tran (2012) for an overview of these procedures.
4 Many studies have documented a strong growth in the number of patent applications protecting
green technologies, suggesting that patents are considered as a useful means of protection
against imitation in this sector (see Dechezleprêtre et al. 2011).
5 We do not have comprehensive data for all patent offices. The highest quality data could be
obtained for the UK, Canada, Australia and the US. The most detailed results in the report are
based on data from the UK and the US patent office.
The objective of this paper is to provide an up-to-date picture of the green patent fast-track programmes landscape and to examine whether these programmes may help the diffusion of clean technologies. The study provides answers to the following questions: How many patents have been filed under the various fast-tracking schemes? What technologies have been mostly concerned? Do the programmes significantly reduce the time from filing to grant compared to regular examination procedures? What type of company is most likely to make use of the fast-tracking procedure? Do the programmes encourage the diffusion of clean technological knowledge? This paper is the first study to empirically analyze green patent fast-tracking procedures. To the best of our knowledge, no empirical analysis has been conducted so far, although some aggregate statistics have been made available by some patent offices. Lane (2012) and Patton (2012) offer an analysis of green patent fast-tracking programmes from a legal point of view. Three results stand out from our analysis. First, despite a low participation in the programmes which reflects the strong incentive for patent applicants to keep their patents in the examination process (hence not granted) for as long as possible, there is a clear demand for fast-tracking procedures, in particular from small but fast-growing start-up companies in the green technology sector. Secondly, fast-tracking programmes seem to keep up with their promises. The time period from application to grant is reduced by up to 75% for patents entering the accelerated procedure. Finally, the analysis of patent citation data shows that fast-tracking programmes have accelerated the diffusion of knowledge in green technologies during the first years following the publication of the patents. The paper is organized as follows. Section 2 provides a brief overview of the fast-tracking programmes currently in place. Section 3 presents some basic statistics about the number of patents that have requested accelerated examination so far and provides some explanation for the apparent limited participation in the programmes. Section 4 analyses the characteristics of the fast-tracked patents, including their technological distribution, time-to-grant and value. In Section 5, we examined the characteristics of fast-tracked patents' applicants. Section 6 offers some concluding remarks. 2. Overview of the fast track systems Green patents fast track schemes have been implemented in nine countries so far. This section briefly describes each of these schemes6.
2.1 UK IPO
The first green patent fast track scheme was put in place by the UK in May 2009, in the context of the run-up to the United Nations Framework Convention on Climate Change (UNFCCC) conference in Copenhagen, which was hoped to give birth to the successor of the Kyoto protocol. In order to have their patent considered for expedited examination, the applicant must submit a letter explaining why the invention is environmentally friendly. The IPO does not require evidence for this "environmentally-friendliness" but states it will reject clearly inappropriate inventions7. There is no formal process requirement on the patent and no additional 6 This section draws heavily on Lane (2012), Patton (2012) and Sterne, Kessler, Goldstein & Fox
(2012).
7 In the empirical analysis that follows, we show that almost all fast-tracked patent applications
actually cover green technologies.
fee is required. According to the UK IPO, patents can be expected to be granted in 9 months, compared to 2 to 3 years for the normal examination procedure8.
2.2 Australia's IPO
Australia’s green patent fast tracking program started in September 2009. As in the UK, there is no formal definition of what constitutes a green patent. Applicants must simply provide a statement that the technology has some environmental benefits. Examination of applications under the program is expected to begin within four to eight weeks after filing the request for expedited examination and no additional fee is required.
2.3 Korean IPO
In October 2009 the Korean Intellectual Property Office launched a "super-accelerated examination system for green technology". KIPO states that a first office action will be issued within one month of the request. Contrary to UK and Australia, only technologies which are funded or accredited by the Korean government, or which are mentioned in relevant government environmental laws, are eligible for expedited treatment under the super-accelerated examination system. Technologies for which all applicants can require accelerated examination include noise prevention, water quality, air pollution prevention, waste disposal, livestock waste management, recycling and sewage. Other green technologies, including renewable energy, carbon emissions reduction, energy-efficient transportation, and LEDs are eligible only if the invention has “received financial support or certification from the government”.9 In addition to this requirement, applicants must submit results of a prior art search along with a request for fast-track examination.10 These features limit participation in the Korean scheme.11
2.4 Japan Patent Office
Japan Patent Office (JPO) launched its programme to accelerate examination of "Green-technology related applications" in November 2009. The technologies must be of a kind "that has an energy-saving effect and contributes to CO2 reduction". Applicants must provide the patent office with “a short description that explains that the claimed invention has an advantage in reducing consumption, reducing CO2 and the like in a reasonable manner” and must conduct a prior art search and a comparison of the claimed invention to the closest prior art. This transfers part of the patent office's work on to the patent applicant. Under the program, applicants should receive a first office action in about two months.
2.5 USPTO
8 See UK IPO Fast grant guide, available on the IPO website.
9 For example, products developed with the help of the recent government programme "Low-
Carbon Green Growth Basic Act" are eligible for the super-accelerated examination.
10 Note however, that under KIPO's three-track patent examination system, applicants may still
require accelerated (but not "super-accelerated") examination for all other green patent
applications.
11 These strict conditions suggest that KIPO was concerned about the potentially high volume of
requests, a concern that might have been legitimate in 2009 but does not appear totally founded
today, as this study demonstrates (see section 3).
The United States Patent and Trademark Office (USPTO) launched a "Green Technology Pilot Program" in November 2009. The program was initially limited to applications falling under one of the U.S. Patent Classification (USPC) codes considered to cover “green technologies.” These USPC technology classes included alternative energy production; energy conservation; environmentally friendly farming; and environmental purification, protection, and remediation. However, after a few months the USPTO realized that the classification requirement was too restrictive and decided to replace it with a simple statement as to why the invention covers a “green technology”. These may include applications pertaining to environmental quality, energy conservation, renewable energy or greenhouse gas emissions reduction. In addition to these subject matter requirements, the USPTO also imposes some restrictions on the number of claims made in the patent12. Applications accepted into the Green Technology Pilot begin examination immediately instead of waiting for 2-3 years to start the examination process. The USPTO Green Technology Pilot Program closed in early 2012, after the 3,500th application was received under the scheme. However, other accelerated examination options applicable to all technologies are still available for green patents, including the Prioritized Examination Program (Track I), the Patent Prosecution Highway, the Accelerated Examination Program, and a Petition based on applicant’s age or health.
2.6 Israel patent office
Israel’s fast tracking program was launched in December 2009. Israel’s Patent Office allowed green patents to receive priority examination, a procedure usually available only when infringement is suspected. The subject matter requirement is very broad: to request accelerated examination, the applicant must simply provide an explanation as to why the invention helps advance environmental protection. The extra fees normally required for priority examination are not required for green patents. After qualifying under the program, these green patent applications shall be examined within three months.
2.7 Canada IPO
The Canadian Intellectual Property Office (CIPO) launched its fast track program for green patent applications in March 2011. To benefit from the programme, applicants should make a declaration stating that the invention could "help resolve or mitigate negative environmental impacts or help conserve the natural environment". No additional fee is required. Under the fast track program, the applicant shall receive a first office action within two months instead of about 2-3 years in the ordinary course.
2.8 Brazil IPO
Brazil was the first emerging economy to launch a green patent fast track programme. In April 2012 the National Institute of Industrial Property (INPI) launched a pilot program to accelerate green patent applications. The pilot program will be limited to the first 500 petitions granted. Eligible green technologies fall under the following 12 The application must have three or fewer independent claims, 20 or fewer total claims and no
multiple dependent claims. The application must also "claim a single invention directed to
environmental quality".
categories: alternative energy, transportation, energy conservation, waste management and agriculture.13 An additional fee of roughly USD 500 for "strategic priority examination" is required. The goal of the program is to reduce the period of examination of patent applications related to green technologies to less than two years. Average examination time in Brazil is five years and four months.
2.9 China's IPO
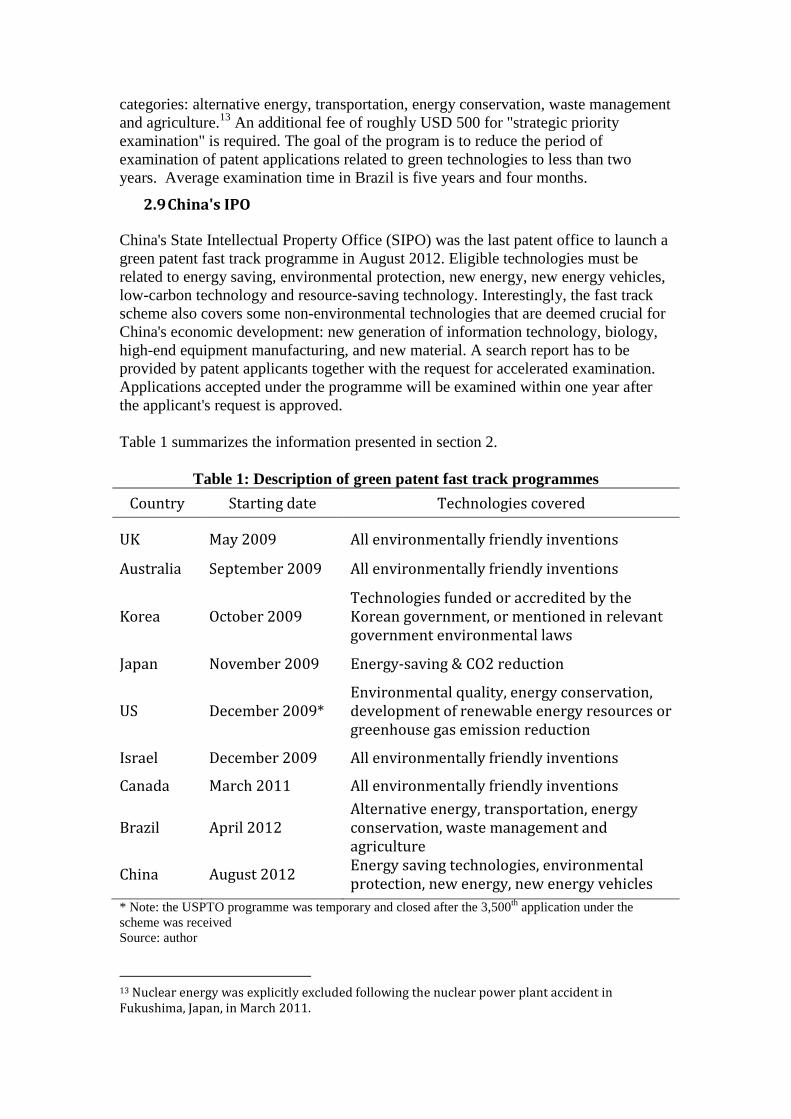
China's State Intellectual Property Office (SIPO) was the last patent office to launch a green patent fast track programme in August 2012. Eligible technologies must be related to energy saving, environmental protection, new energy, new energy vehicles, low-carbon technology and resource-saving technology. Interestingly, the fast track scheme also covers some non-environmental technologies that are deemed crucial for China's economic development: new generation of information technology, biology, high-end equipment manufacturing, and new material. A search report has to be provided by patent applicants together with the request for accelerated examination. Applications accepted under the programme will be examined within one year after the applicant's request is approved. Table 1 summarizes the information presented in section 2.
Table 1: Description of green patent fast track programmes
Country Starting date Technologies covered
UK May 2009 All environmentally friendly inventions
Australia September 2009 All environmentally friendly inventions
Korea October 2009
Technologies funded or accredited by the
Korean government, or mentioned in relevant
government environmental laws
Japan November 2009 Energy-saving & CO2 reduction
US December 2009*
Environmental quality, energy conservation,
development of renewable energy resources or
greenhouse gas emission reduction
Israel December 2009 All environmentally friendly inventions
Canada March 2011 All environmentally friendly inventions
Brazil April 2012
Alternative energy, transportation, energy
conservation, waste management and
agriculture
China August 2012 Energy saving technologies, environmental
protection, new energy, new energy vehicles
* Note: the USPTO programme was temporary and closed after the 3,500th application under the scheme was received Source: author
13 Nuclear energy was explicitly excluded following the nuclear power plant accident in
Fukushima, Japan, in March 2011.
3. How many patents have gone through the fast-tracking programmes?
3.1 Distribution of patents by patent office
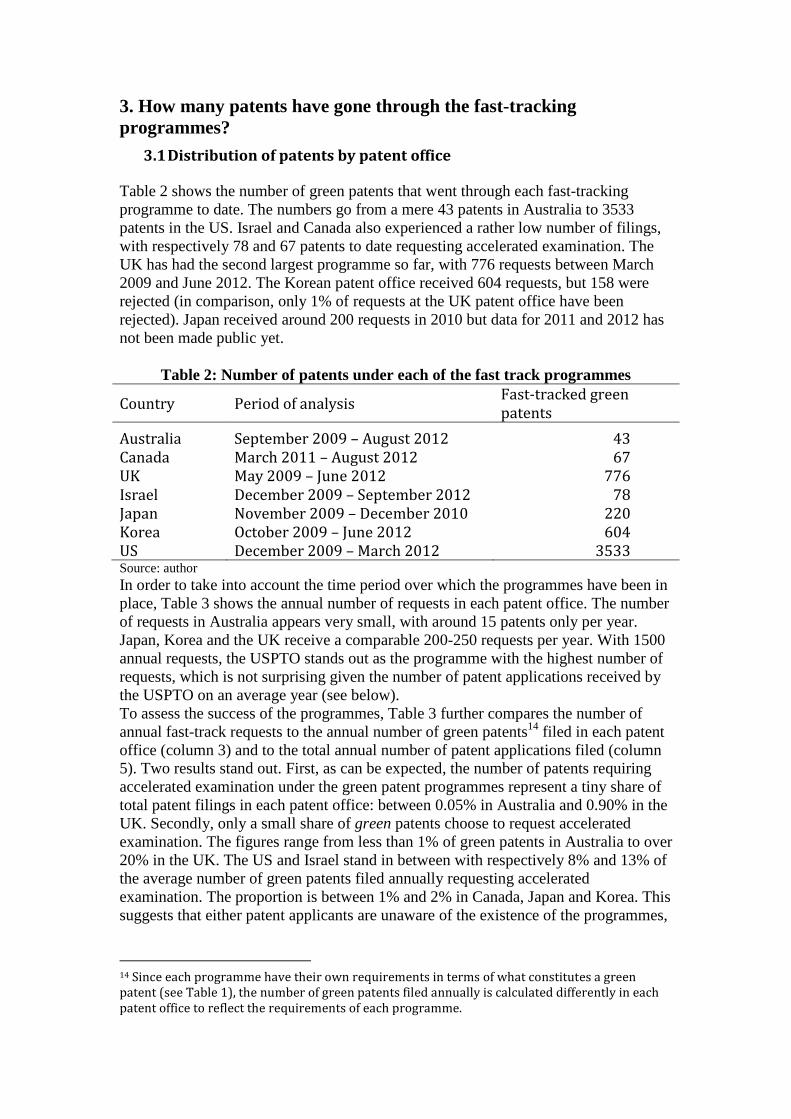
Table 2 shows the number of green patents that went through each fast-tracking programme to date. The numbers go from a mere 43 patents in Australia to 3533 patents in the US. Israel and Canada also experienced a rather low number of filings, with respectively 78 and 67 patents to date requesting accelerated examination. The UK has had the second largest programme so far, with 776 requests between March 2009 and June 2012. The Korean patent office received 604 requests, but 158 were rejected (in comparison, only 1% of requests at the UK patent office have been rejected). Japan received around 200 requests in 2010 but data for 2011 and 2012 has not been made public yet.
Table 2: Number of patents under each of the fast track programmes
Country Period of analysis Fast-tracked green
patents
Australia September 2009 – August 2012 43
Canada March 2011 – August 2012 67
UK May 2009 – June 2012 776
Israel December 2009 – September 2012 78
Japan November 2009 – December 2010 220
Korea October 2009 – June 2012 604
US December 2009 – March 2012 3533 Source: author In order to take into account the time period over which the programmes have been in place, Table 3 shows the annual number of requests in each patent office. The number of requests in Australia appears very small, with around 15 patents only per year. Japan, Korea and the UK receive a comparable 200-250 requests per year. With 1500 annual requests, the USPTO stands out as the programme with the highest number of requests, which is not surprising given the number of patent applications received by the USPTO on an average year (see below). To assess the success of the programmes, Table 3 further compares the number of annual fast-track requests to the annual number of green patents14 filed in each patent office (column 3) and to the total annual number of patent applications filed (column 5). Two results stand out. First, as can be expected, the number of patents requiring accelerated examination under the green patent programmes represent a tiny share of total patent filings in each patent office: between 0.05% in Australia and 0.90% in the UK. Secondly, only a small share of green patents choose to request accelerated examination. The figures range from less than 1% of green patents in Australia to over 20% in the UK. The US and Israel stand in between with respectively 8% and 13% of the average number of green patents filed annually requesting accelerated examination. The proportion is between 1% and 2% in Canada, Japan and Korea. This suggests that either patent applicants are unaware of the existence of the programmes,
14 Since each programme have their own requirements in terms of what constitutes a green
patent (see Table 1), the number of green patents filed annually is calculated differently in each
patent office to reflect the requirements of each programme.
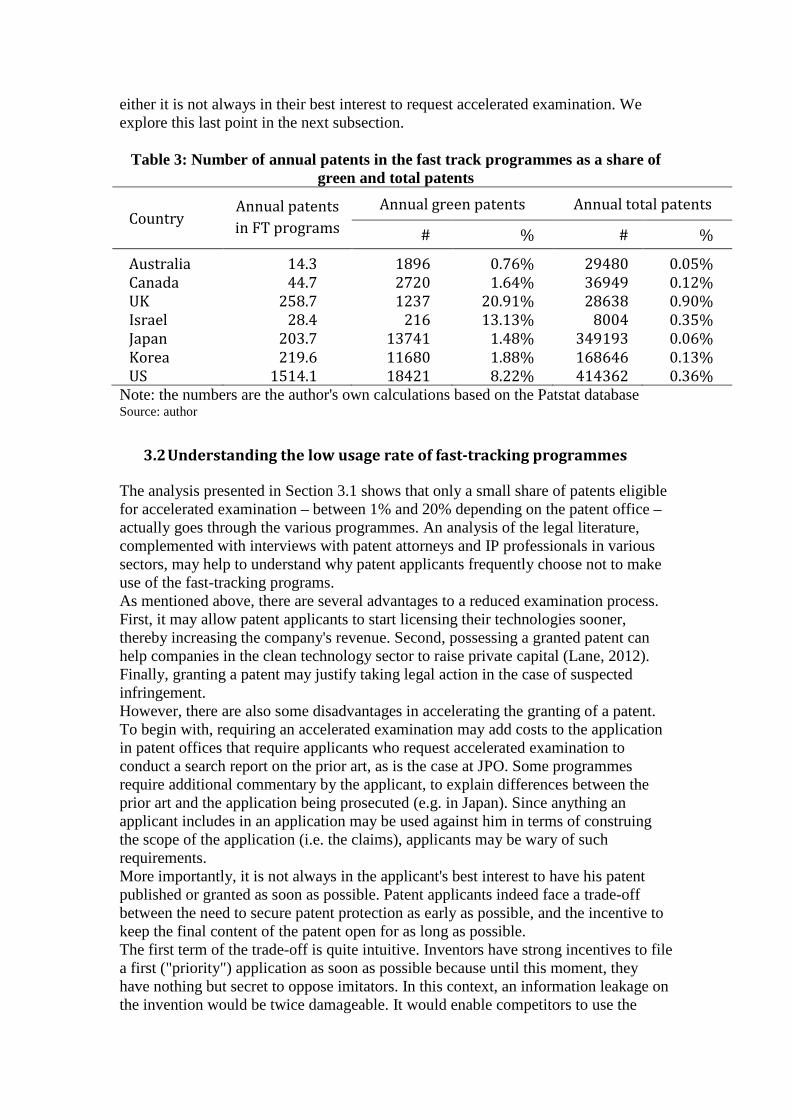
either it is not always in their best interest to request accelerated examination. We explore this last point in the next subsection.
Table 3: Number of annual patents in the fast track programmes as a share of green and total patents
Country Annual patents
in FT programs
Annual green patents Annual total patents
# % # %
Australia 14.3 1896 0.76% 29480 0.05%
Canada 44.7 2720 1.64% 36949 0.12%
UK 258.7 1237 20.91% 28638 0.90%
Israel 28.4 216 13.13% 8004 0.35%
Japan 203.7 13741 1.48% 349193 0.06%
Korea 219.6 11680 1.88% 168646 0.13%
US 1514.1 18421 8.22% 414362 0.36%
Note: the numbers are the author's own calculations based on the Patstat database Source: author
3.2 Understanding the low usage rate of fast-tracking programmes
The analysis presented in Section 3.1 shows that only a small share of patents eligible for accelerated examination – between 1% and 20% depending on the patent office – actually goes through the various programmes. An analysis of the legal literature, complemented with interviews with patent attorneys and IP professionals in various sectors, may help to understand why patent applicants frequently choose not to make use of the fast-tracking programs. As mentioned above, there are several advantages to a reduced examination process. First, it may allow patent applicants to start licensing their technologies sooner, thereby increasing the company's revenue. Second, possessing a granted patent can help companies in the clean technology sector to raise private capital (Lane, 2012). Finally, granting a patent may justify taking legal action in the case of suspected infringement. However, there are also some disadvantages in accelerating the granting of a patent. To begin with, requiring an accelerated examination may add costs to the application in patent offices that require applicants who request accelerated examination to conduct a search report on the prior art, as is the case at JPO. Some programmes require additional commentary by the applicant, to explain differences between the prior art and the application being prosecuted (e.g. in Japan). Since anything an applicant includes in an application may be used against him in terms of construing the scope of the application (i.e. the claims), applicants may be wary of such requirements. More importantly, it is not always in the applicant's best interest to have his patent published or granted as soon as possible. Patent applicants indeed face a trade-off between the need to secure patent protection as early as possible, and the incentive to keep the final content of the patent open for as long as possible. The first term of the trade-off is quite intuitive. Inventors have strong incentives to file a first ("priority") application as soon as possible because until this moment, they have nothing but secret to oppose imitators. In this context, an information leakage on the invention would be twice damageable. It would enable competitors to use the
invention legally, and may prevent the invention from being ever patented (since through the leakage it has become prior art15). Even if the secret is well kept, there is a risk under the first-to-file rule16 that the patent would be granted to another inventor that files an application first. Applying for a patent alleviates these risks, as it freezes relevant prior art at the date of application, and guarantees that the patent, once granted, can be opposed to any infringer. Although inventors may want to file a priority application as early as possible, they also have serious motives to delay as much as possible the moment when their patent will be granted:
(i) An important advantage of a long examination period is that it delays the
costs associated with the grant of the patent. It also gives patent
applicants time to determine whether it is worth requesting the grant
in the first place. Since a grant implies additional costs (renewal fees,
etc.), applicants first need to make sure that the patent will be
commercially viable before going any further with the grant process. A
long examination period thus has an important option value for the
applicant, which explains the success of mechanisms such as the
Patent Cooperation Treaty (PCT). One of the key benefits of filing a
patent under the PCT is that patent applicants then have thirty months
to decide whether they want to proceed towards the grant of one or
more national (or regional) patents.
(ii) Another major advantage of a delayed examination process is that it
leaves applicants with the possibility to adjust the patent application –
in particular the list of claims – during the examination process17.
Therefore, early grants can occur when the invention and its market
are not yet mature, which induces opportunity costs for the applicant.
Indeed, if granted too early, the design of the patent may not perfectly
match the final version of the invention, thus facilitating
circumvention. To avoid such discrepancies, applicants need to delay
the moment when the patent is granted with its definitive claims.
15 In some countries, a grace period may however allow for public disclosure of an invention (under certain conditions) without affecting the validity of a subsequent patent application up to a certain delay.
16 In a first-to-file system, the right to the grant of a patent for a given invention lies with the first
person to file a patent application for protection of that invention, regardless of the date of actual
invention. This rule is used in most countries except the United States, where the first-to-invent
rule still prevails.
17 Note however that an applicant must fully disclose their invention at the time of filing.
Patent offices worldwide offer some flexibility in this respect, through
the use of divisional applications; continuations and reissued patents
(see Dechezleprêtre and Ménière, 2010, for an analysis of these
mechanisms).
(iii) A potential issue may concern the early publication of the patent.
When a patent is published, it reveals important information on on-
going R&D to competitors. This should provide an incentive for
applicants to delay publication. Since patent applications must be
disclosed when granted, a very early grant that would happen before
the end of the 18 months’ time period after which patent applications
are normally published could increase the risk that competitors will
be able to quickly design a competing technology. Our interviews with
IP professionals however revealed that this is unlikely to be an issue in
practice.
The consequence of what precedes is that patent applicants have an interest in using fast-tracking programmes only under specific circumstances (suspicion of infringement, capital raising activity, securing commercial partnerships, among others). This explains why only a small percentage of eligible patents are found to be using this opportunity. Since once filed, what will be opposed to infringers will be the date of application and not the grant date, most applicants in fact have an incentive to wait until the examination is conducted under the regular procedure.
3.3 Are fast-tracked green patents crowding-out other patents?
A potential problem of fast-tracking programmes for green patent applications is that they may delay examination of patent applications in other technologies. An important consequence of the trade-off presented in Section 3.2 is that most patent applicants are actually happy to see the examination of their patent applications postponed. If, following Table 3, we assume that fast-tracking is appealing for at most 20% of patents in non-green technologies, this means that crowding-out is likely to be an issue for only 20% of patent applications delayed because of fast-tracking programmes. This represents only around 1,000 patents since 2009 worldwide, suggesting that crowding-out is unlikely to have been a significant issue so far.18 4. The characteristics of fast-tracked patents
4.1 Distribution by technology type
18 Crowding-out issues could be completely avoided if, as we argue in the conclusion of this
paper, accelerated examination was extended to non-green technologies.
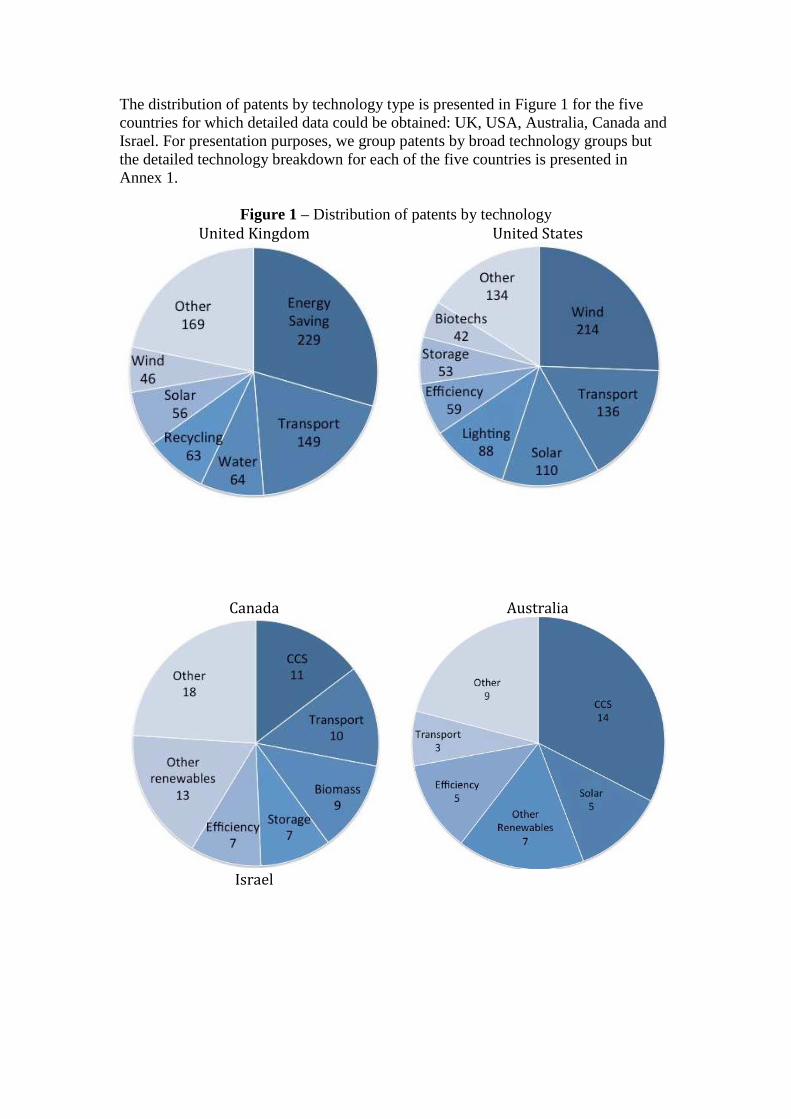
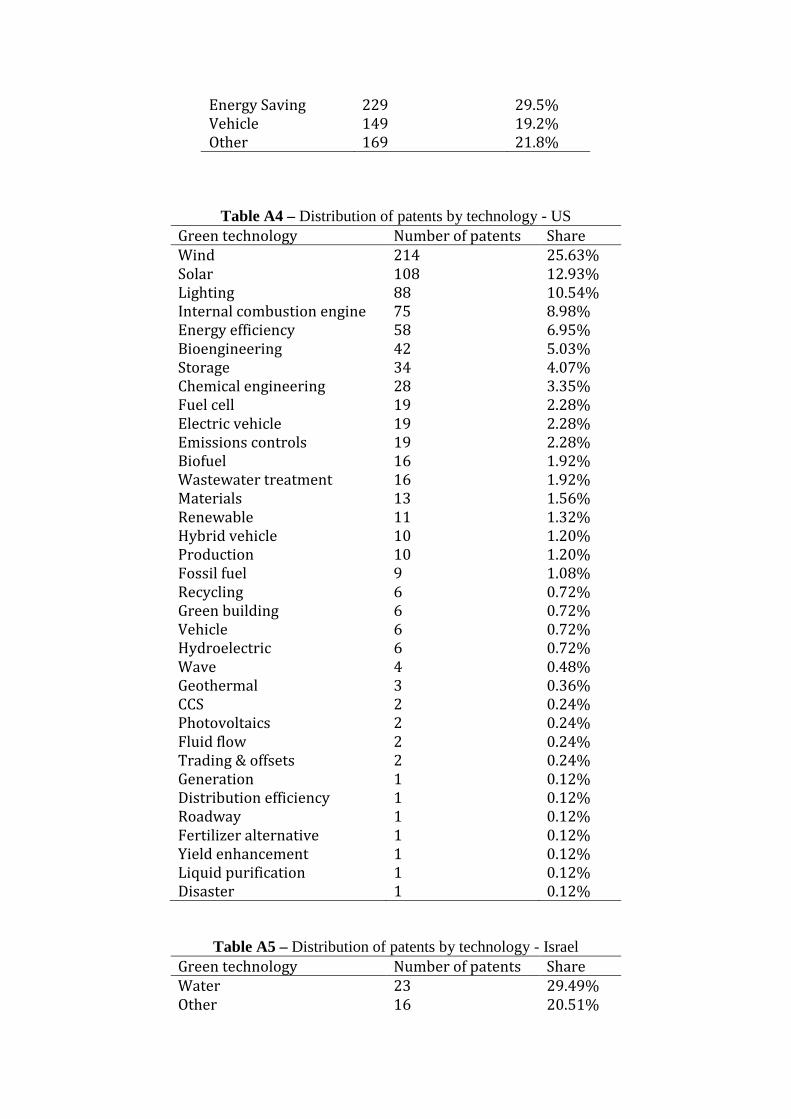
The distribution of patents by technology type is presented in Figure 1 for the five countries for which detailed data could be obtained: UK, USA, Australia, Canada and Israel. For presentation purposes, we group patents by broad technology groups but the detailed technology breakdown for each of the five countries is presented in Annex 1.
Figure 1 – Distribution of patents by technology United Kingdom United States
Canada
Australia
Israel
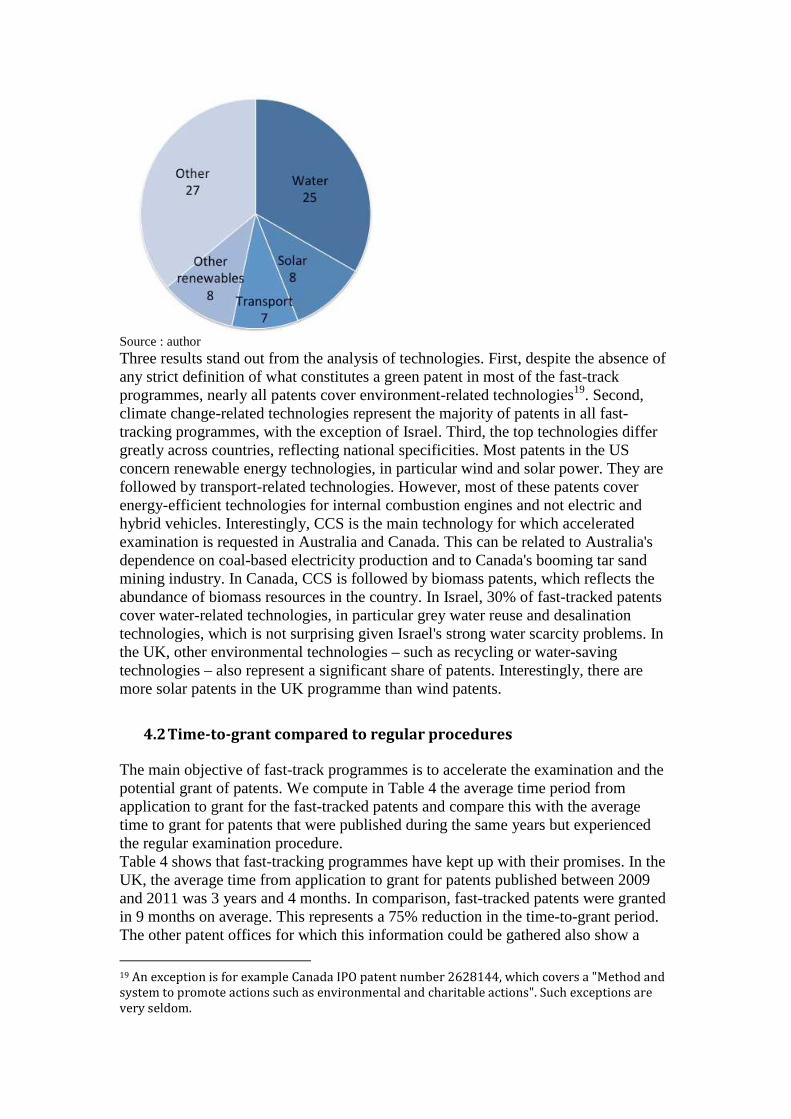
Source : author Three results stand out from the analysis of technologies. First, despite the absence of any strict definition of what constitutes a green patent in most of the fast-track programmes, nearly all patents cover environment-related technologies19. Second, climate change-related technologies represent the majority of patents in all fast-tracking programmes, with the exception of Israel. Third, the top technologies differ greatly across countries, reflecting national specificities. Most patents in the US concern renewable energy technologies, in particular wind and solar power. They are followed by transport-related technologies. However, most of these patents cover energy-efficient technologies for internal combustion engines and not electric and hybrid vehicles. Interestingly, CCS is the main technology for which accelerated examination is requested in Australia and Canada. This can be related to Australia's dependence on coal-based electricity production and to Canada's booming tar sand mining industry. In Canada, CCS is followed by biomass patents, which reflects the abundance of biomass resources in the country. In Israel, 30% of fast-tracked patents cover water-related technologies, in particular grey water reuse and desalination technologies, which is not surprising given Israel's strong water scarcity problems. In the UK, other environmental technologies – such as recycling or water-saving technologies – also represent a significant share of patents. Interestingly, there are more solar patents in the UK programme than wind patents.
4.2 Time-to-grant compared to regular procedures
The main objective of fast-track programmes is to accelerate the examination and the potential grant of patents. We compute in Table 4 the average time period from application to grant for the fast-tracked patents and compare this with the average time to grant for patents that were published during the same years but experienced the regular examination procedure. Table 4 shows that fast-tracking programmes have kept up with their promises. In the UK, the average time from application to grant for patents published between 2009 and 2011 was 3 years and 4 months. In comparison, fast-tracked patents were granted in 9 months on average. This represents a 75% reduction in the time-to-grant period. The other patent offices for which this information could be gathered also show a
19 An exception is for example Canada IPO patent number 2628144, which covers a "Method and
system to promote actions such as environmental and charitable actions". Such exceptions are
very seldom.
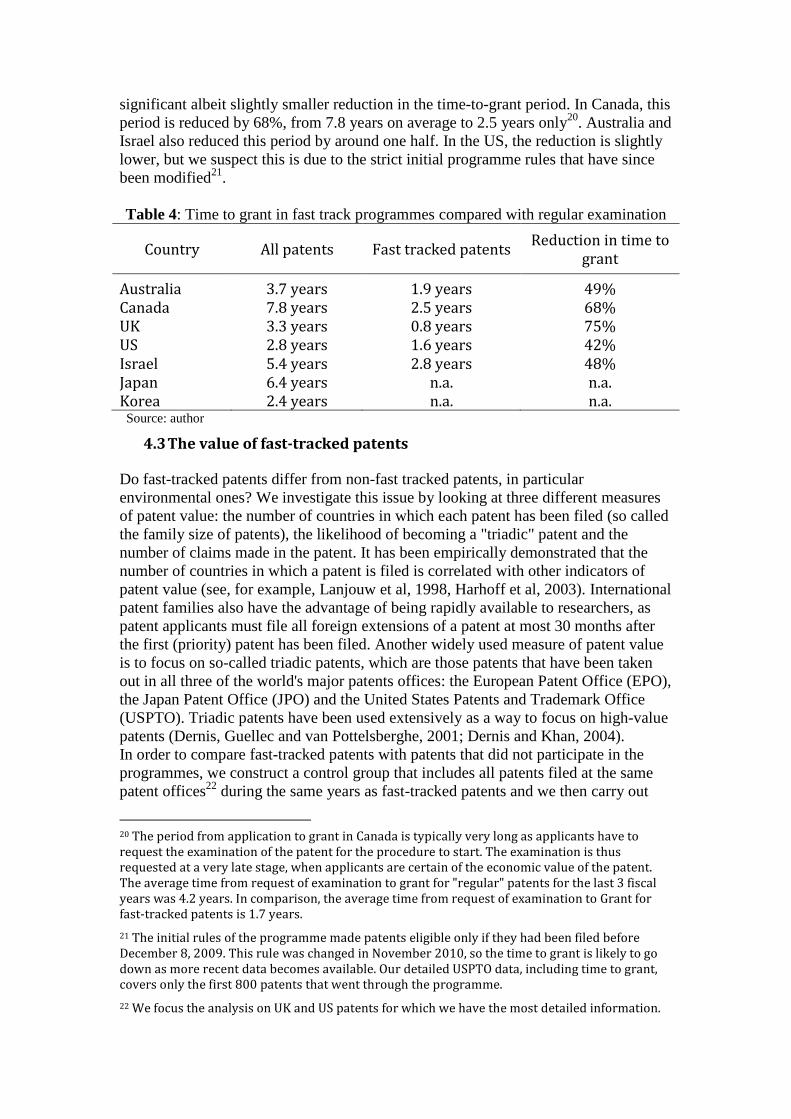
significant albeit slightly smaller reduction in the time-to-grant period. In Canada, this period is reduced by 68%, from 7.8 years on average to 2.5 years only20. Australia and Israel also reduced this period by around one half. In the US, the reduction is slightly lower, but we suspect this is due to the strict initial programme rules that have since been modified21. Table 4: Time to grant in fast track programmes compared with regular examination
Country All patents Fast tracked patents Reduction in time to
grant
Australia 3.7 years 1.9 years 49%
Canada 7.8 years 2.5 years 68%
UK 3.3 years 0.8 years 75%
US 2.8 years 1.6 years 42%
Israel 5.4 years 2.8 years 48%
Japan 6.4 years n.a. n.a.
Korea 2.4 years n.a. n.a. Source: author
4.3 The value of fast-tracked patents
Do fast-tracked patents differ from non-fast tracked patents, in particular environmental ones? We investigate this issue by looking at three different measures of patent value: the number of countries in which each patent has been filed (so called the family size of patents), the likelihood of becoming a "triadic" patent and the number of claims made in the patent. It has been empirically demonstrated that the number of countries in which a patent is filed is correlated with other indicators of patent value (see, for example, Lanjouw et al, 1998, Harhoff et al, 2003). International patent families also have the advantage of being rapidly available to researchers, as patent applicants must file all foreign extensions of a patent at most 30 months after the first (priority) patent has been filed. Another widely used measure of patent value is to focus on so-called triadic patents, which are those patents that have been taken out in all three of the world's major patents offices: the European Patent Office (EPO), the Japan Patent Office (JPO) and the United States Patents and Trademark Office (USPTO). Triadic patents have been used extensively as a way to focus on high-value patents (Dernis, Guellec and van Pottelsberghe, 2001; Dernis and Khan, 2004). In order to compare fast-tracked patents with patents that did not participate in the programmes, we construct a control group that includes all patents filed at the same patent offices22 during the same years as fast-tracked patents and we then carry out
20 The period from application to grant in Canada is typically very long as applicants have to
request the examination of the patent for the procedure to start. The examination is thus
requested at a very late stage, when applicants are certain of the economic value of the patent. The average time from request of examination to grant for "regular" patents for the last 3 fiscal
years was 4.2 years. In comparison, the average time from request of examination to Grant for
fast-tracked patents is 1.7 years.
21 The initial rules of the programme made patents eligible only if they had been filed before
December 8, 2009. This rule was changed in November 2010, so the time to grant is likely to go
down as more recent data becomes available. Our detailed USPTO data, including time to grant,
covers only the first 800 patents that went through the programme.
22 We focus the analysis on UK and US patents for which we have the most detailed information.
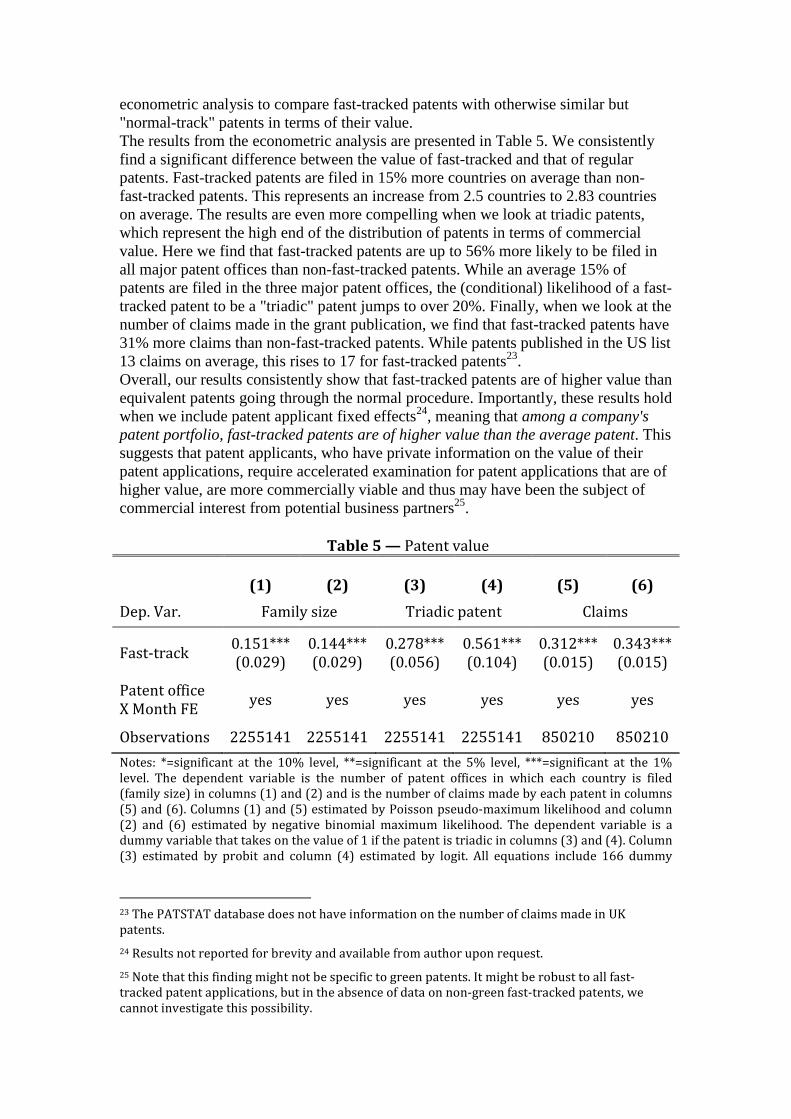
econometric analysis to compare fast-tracked patents with otherwise similar but "normal-track" patents in terms of their value. The results from the econometric analysis are presented in Table 5. We consistently find a significant difference between the value of fast-tracked and that of regular patents. Fast-tracked patents are filed in 15% more countries on average than non-fast-tracked patents. This represents an increase from 2.5 countries to 2.83 countries on average. The results are even more compelling when we look at triadic patents, which represent the high end of the distribution of patents in terms of commercial value. Here we find that fast-tracked patents are up to 56% more likely to be filed in all major patent offices than non-fast-tracked patents. While an average 15% of patents are filed in the three major patent offices, the (conditional) likelihood of a fast-tracked patent to be a "triadic" patent jumps to over 20%. Finally, when we look at the number of claims made in the grant publication, we find that fast-tracked patents have 31% more claims than non-fast-tracked patents. While patents published in the US list 13 claims on average, this rises to 17 for fast-tracked patents23. Overall, our results consistently show that fast-tracked patents are of higher value than equivalent patents going through the normal procedure. Importantly, these results hold when we include patent applicant fixed effects24, meaning that among a company's patent portfolio, fast-tracked patents are of higher value than the average patent. This suggests that patent applicants, who have private information on the value of their patent applications, require accelerated examination for patent applications that are of higher value, are more commercially viable and thus may have been the subject of commercial interest from potential business partners25.
Table 5 — Patent value
Notes: *=significant at the 10% level, **=significant at the 5% level, ***=significant at the 1%
level. The dependent variable is the number of patent offices in which each country is filed
(family size) in columns (1) and (2) and is the number of claims made by each patent in columns
(5) and (6). Columns (1) and (5) estimated by Poisson pseudo-maximum likelihood and column
(2) and (6) estimated by negative binomial maximum likelihood. The dependent variable is a
dummy variable that takes on the value of 1 if the patent is triadic in columns (3) and (4). Column
(3) estimated by probit and column (4) estimated by logit. All equations include 166 dummy
23 The PATSTAT database does not have information on the number of claims made in UK
patents.
24 Results not reported for brevity and available from author upon request.
25 Note that this finding might not be specific to green patents. It might be robust to all fast-
tracked patent applications, but in the absence of data on non-green fast-tracked patents, we
cannot investigate this possibility.
(1) (2) (3) (4) (5) (6)
Dep. Var. Family size Triadic patent Claims
Fast-track 0.151*** 0.144*** 0.278*** 0.561*** 0.312*** 0.343***
(0.029) (0.029) (0.056) (0.104) (0.015) (0.015)
Patent office
X Month FE yes yes yes yes yes yes
Observations 2255141 2255141 2255141 2255141 850210 850210
variables for each office - application month, a dummy variable for "green" patent according to
the EPO classification and a constant. Robust standard errors in parentheses.
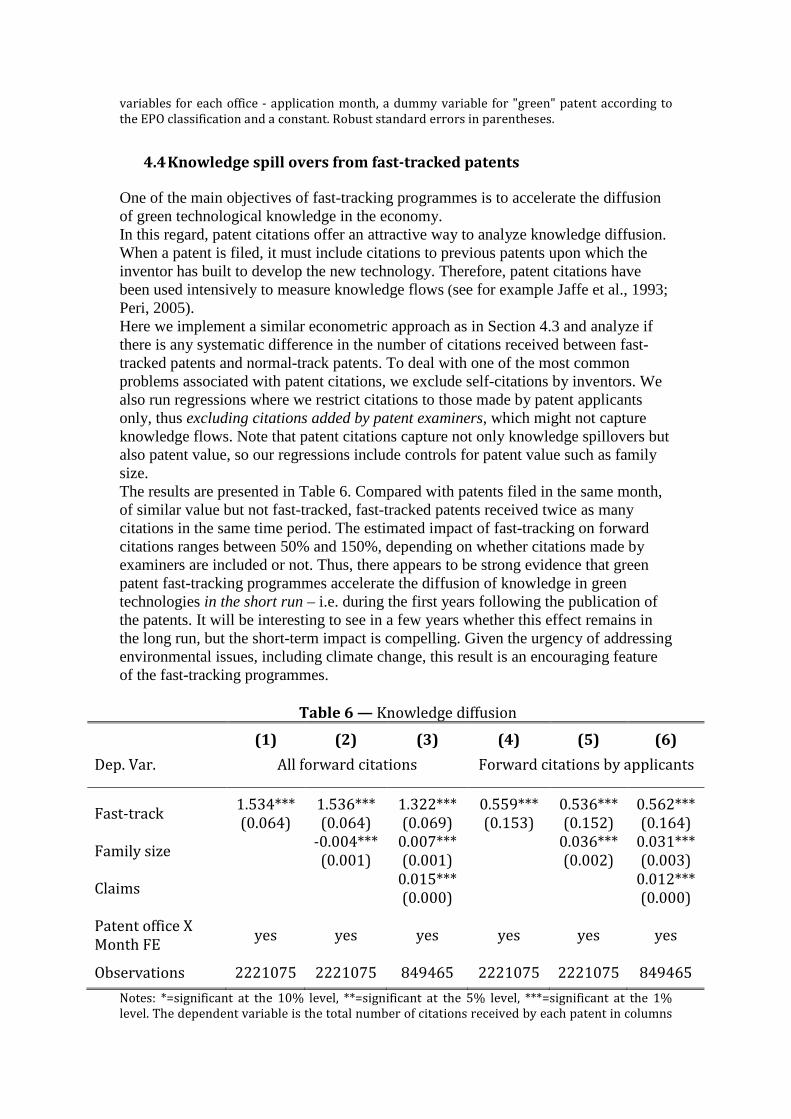
4.4 Knowledge spill overs from fast-tracked patents
One of the main objectives of fast-tracking programmes is to accelerate the diffusion of green technological knowledge in the economy. In this regard, patent citations offer an attractive way to analyze knowledge diffusion. When a patent is filed, it must include citations to previous patents upon which the inventor has built to develop the new technology. Therefore, patent citations have been used intensively to measure knowledge flows (see for example Jaffe et al., 1993; Peri, 2005). Here we implement a similar econometric approach as in Section 4.3 and analyze if there is any systematic difference in the number of citations received between fast-tracked patents and normal-track patents. To deal with one of the most common problems associated with patent citations, we exclude self-citations by inventors. We also run regressions where we restrict citations to those made by patent applicants only, thus excluding citations added by patent examiners, which might not capture knowledge flows. Note that patent citations capture not only knowledge spillovers but also patent value, so our regressions include controls for patent value such as family size. The results are presented in Table 6. Compared with patents filed in the same month, of similar value but not fast-tracked, fast-tracked patents received twice as many citations in the same time period. The estimated impact of fast-tracking on forward citations ranges between 50% and 150%, depending on whether citations made by examiners are included or not. Thus, there appears to be strong evidence that green patent fast-tracking programmes accelerate the diffusion of knowledge in green technologies in the short run – i.e. during the first years following the publication of the patents. It will be interesting to see in a few years whether this effect remains in the long run, but the short-term impact is compelling. Given the urgency of addressing environmental issues, including climate change, this result is an encouraging feature of the fast-tracking programmes.
Table 6 — Knowledge diffusion
(1) (2) (3) (4) (5) (6)
Dep. Var. All forward citations Forward citations by applicants
Fast-track 1.534*** 1.536*** 1.322*** 0.559*** 0.536*** 0.562***
(0.064) (0.064) (0.069) (0.153) (0.152) (0.164)
Family size -0.004*** 0.007*** 0.036*** 0.031***
(0.001) (0.001) (0.002) (0.003)
Claims 0.015*** 0.012***
(0.000) (0.000)
Patent office X
Month FE yes yes yes yes yes yes
Observations 2221075 2221075 849465 2221075 2221075 849465
Notes: *=significant at the 10% level, **=significant at the 5% level, ***=significant at the 1%
level. The dependent variable is the total number of citations received by each patent in columns
(1) to (3) and the number of citations received by each patent and made by applicants only in
columns (4) to (6). All columns are estimated by Poisson pseudo-maximum likelihood. All
equations include 166 dummy variables for each office - application month, a dummy variable for
"green" patent according to the EPO classification and a constant. Robust standard errors in
parentheses.
5. An analysis of fast-tracking programmes users In this section, the characteristics of companies resorting to fast-tracking programmes are examined.
5.1 Nationality of applicants
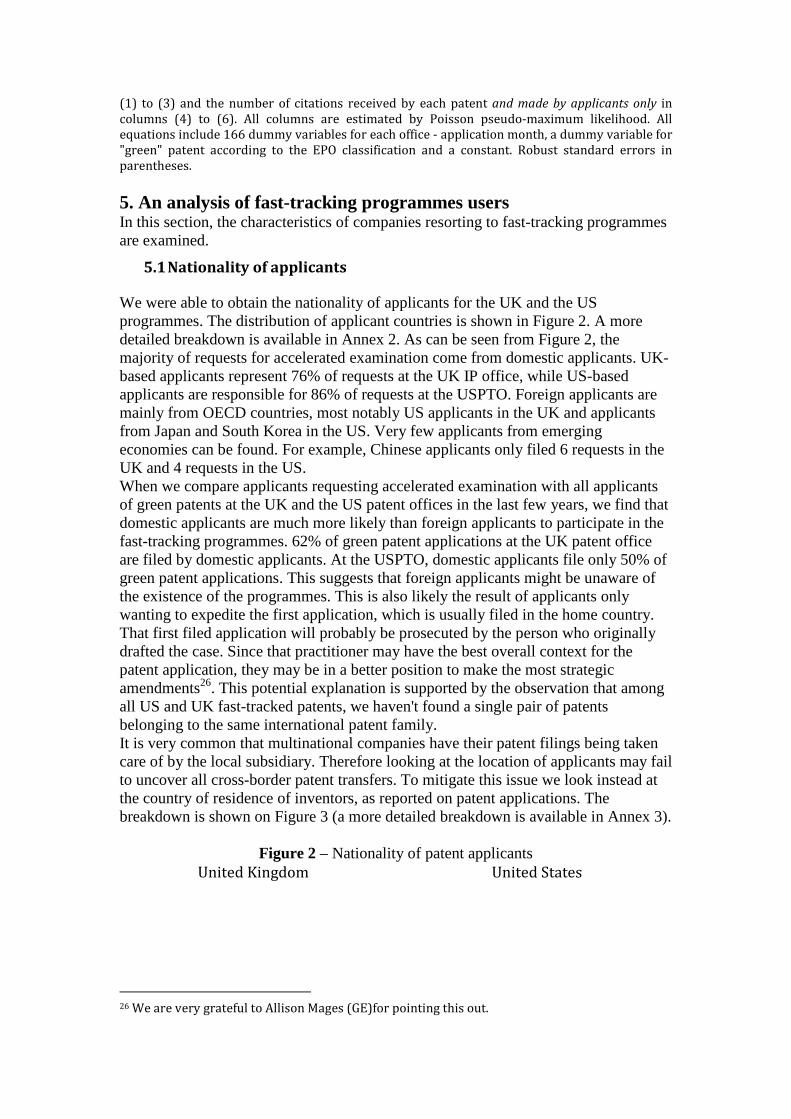
We were able to obtain the nationality of applicants for the UK and the US programmes. The distribution of applicant countries is shown in Figure 2. A more detailed breakdown is available in Annex 2. As can be seen from Figure 2, the majority of requests for accelerated examination come from domestic applicants. UK-based applicants represent 76% of requests at the UK IP office, while US-based applicants are responsible for 86% of requests at the USPTO. Foreign applicants are mainly from OECD countries, most notably US applicants in the UK and applicants from Japan and South Korea in the US. Very few applicants from emerging economies can be found. For example, Chinese applicants only filed 6 requests in the UK and 4 requests in the US. When we compare applicants requesting accelerated examination with all applicants of green patents at the UK and the US patent offices in the last few years, we find that domestic applicants are much more likely than foreign applicants to participate in the fast-tracking programmes. 62% of green patent applications at the UK patent office are filed by domestic applicants. At the USPTO, domestic applicants file only 50% of green patent applications. This suggests that foreign applicants might be unaware of the existence of the programmes. This is also likely the result of applicants only wanting to expedite the first application, which is usually filed in the home country. That first filed application will probably be prosecuted by the person who originally drafted the case. Since that practitioner may have the best overall context for the patent application, they may be in a better position to make the most strategic amendments26. This potential explanation is supported by the observation that among all US and UK fast-tracked patents, we haven't found a single pair of patents belonging to the same international patent family. It is very common that multinational companies have their patent filings being taken care of by the local subsidiary. Therefore looking at the location of applicants may fail to uncover all cross-border patent transfers. To mitigate this issue we look instead at the country of residence of inventors, as reported on patent applications. The breakdown is shown on Figure 3 (a more detailed breakdown is available in Annex 3).
Figure 2 – Nationality of patent applicants
United Kingdom United States
26 We are very grateful to Allison Mages (GE)for pointing this out.
UK
645
US
107
Other
OECD
70
Other
20
US
726
Other OECD
95
Other
15
Source: author
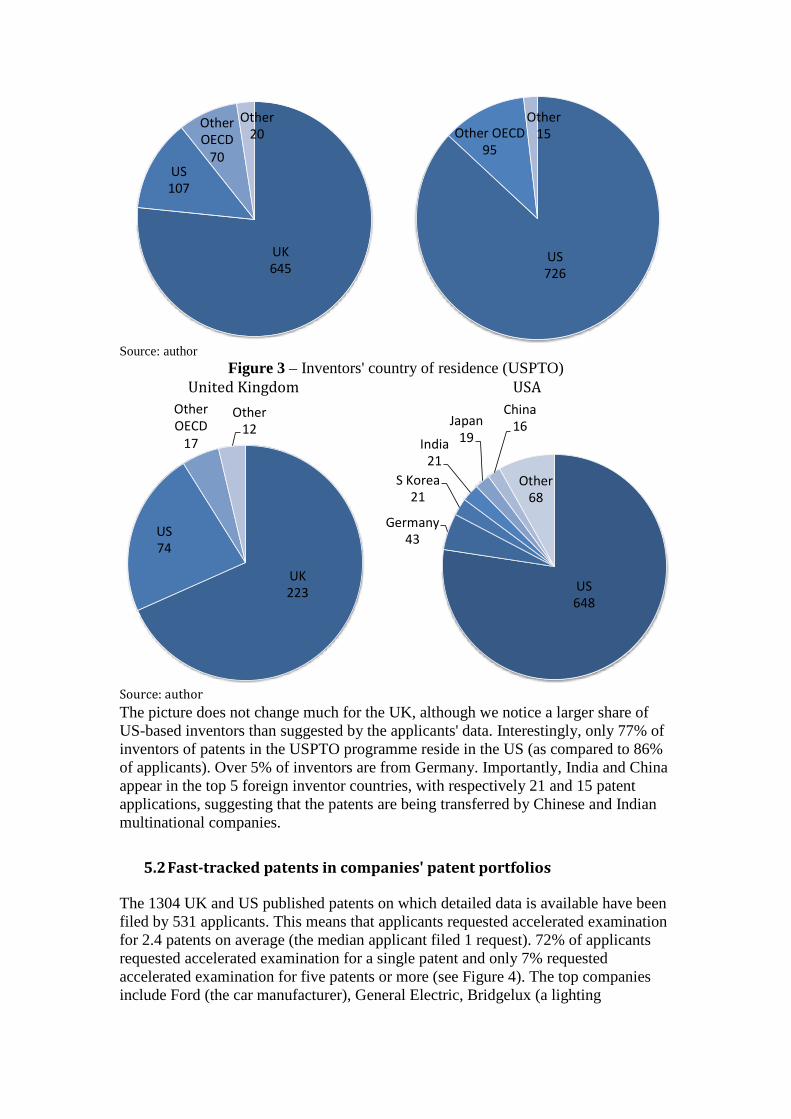
Figure 3 – Inventors' country of residence (USPTO) United Kingdom USA
UK
223
US
74
Other
OECD
17
Other
12
US
648
Germany
43
S Korea
21
India
21
Japan
19
China
16
Other
68
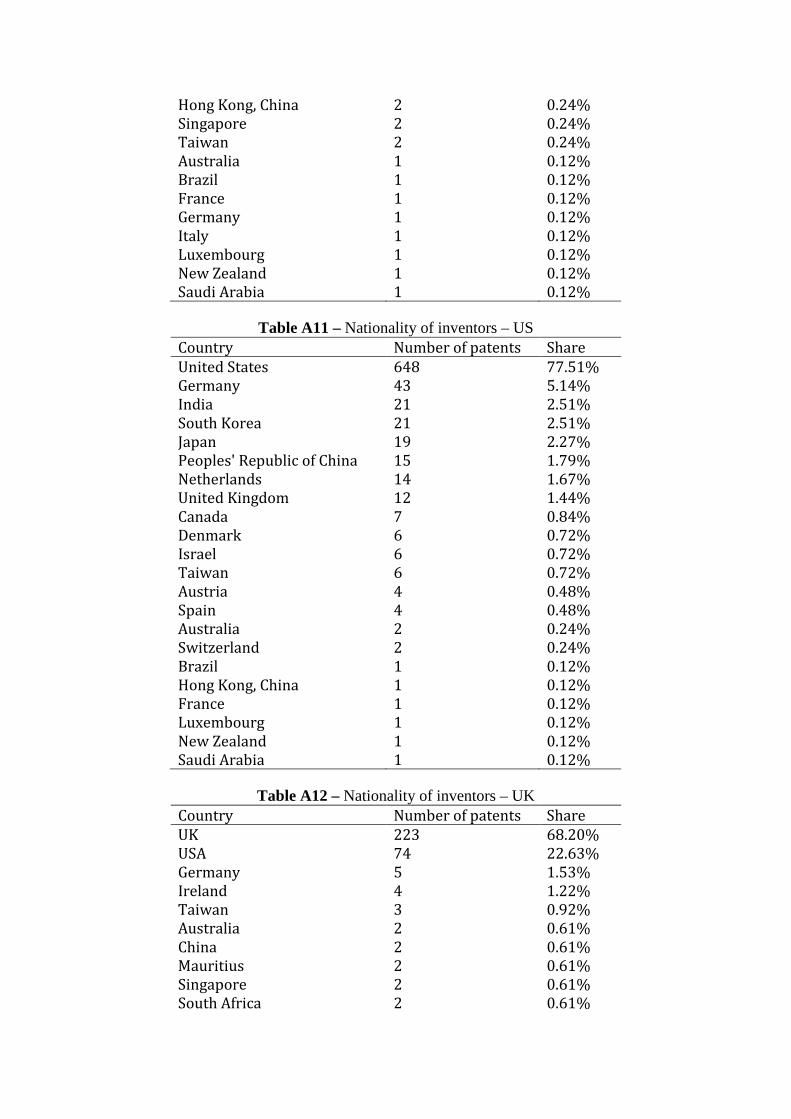
Source: author The picture does not change much for the UK, although we notice a larger share of US-based inventors than suggested by the applicants' data. Interestingly, only 77% of inventors of patents in the USPTO programme reside in the US (as compared to 86% of applicants). Over 5% of inventors are from Germany. Importantly, India and China appear in the top 5 foreign inventor countries, with respectively 21 and 15 patent applications, suggesting that the patents are being transferred by Chinese and Indian multinational companies.
5.2 Fast-tracked patents in companies' patent portfolios
The 1304 UK and US published patents on which detailed data is available have been filed by 531 applicants. This means that applicants requested accelerated examination for 2.4 patents on average (the median applicant filed 1 request). 72% of applicants requested accelerated examination for a single patent and only 7% requested accelerated examination for five patents or more (see Figure 4). The top companies include Ford (the car manufacturer), General Electric, Bridgelux (a lighting
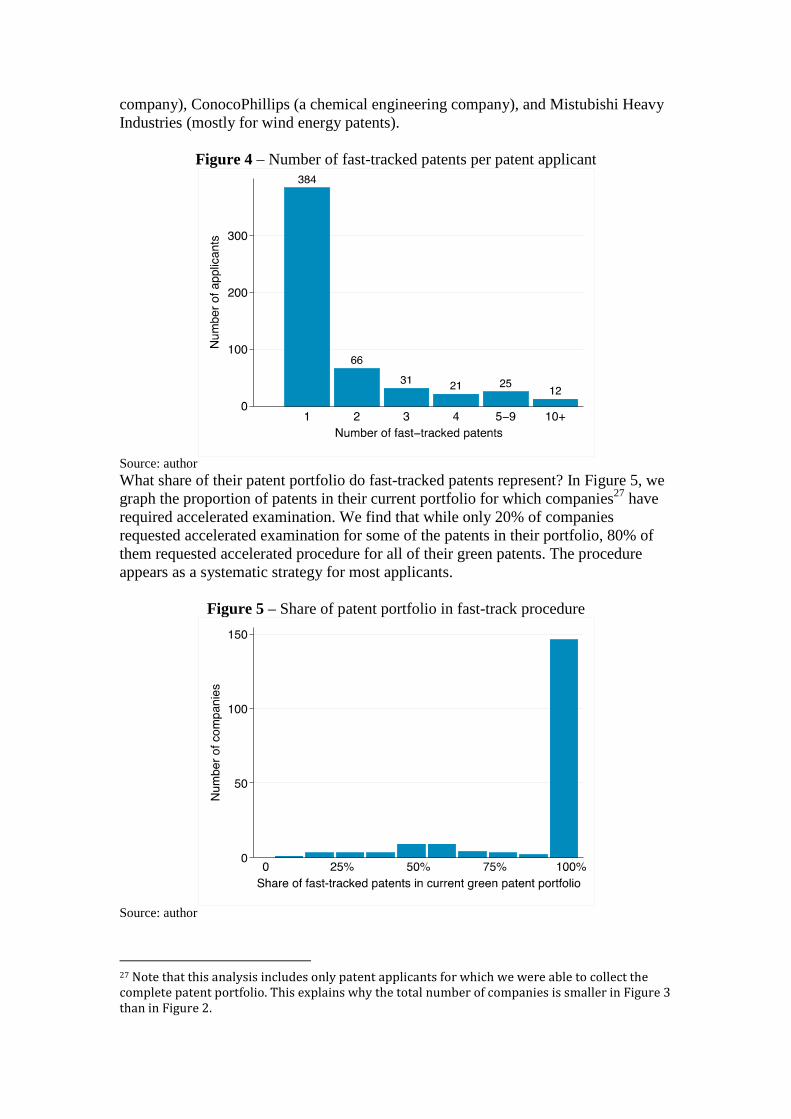
company), ConocoPhillips (a chemical engineering company), and Mistubishi Heavy Industries (mostly for wind energy patents).
Figure 4 – Number of fast-tracked patents per patent applicant
Source: author What share of their patent portfolio do fast-tracked patents represent? In Figure 5, we graph the proportion of patents in their current portfolio for which companies27 have required accelerated examination. We find that while only 20% of companies requested accelerated examination for some of the patents in their portfolio, 80% of them requested accelerated procedure for all of their green patents. The procedure appears as a systematic strategy for most applicants.
Figure 5 – Share of patent portfolio in fast-track procedure
Source: author
27 Note that this analysis includes only patent applicants for which we were able to collect the
complete patent portfolio. This explains why the total number of companies is smaller in Figure 3
than in Figure 2.
5.3 The specificities of fast-track programme users
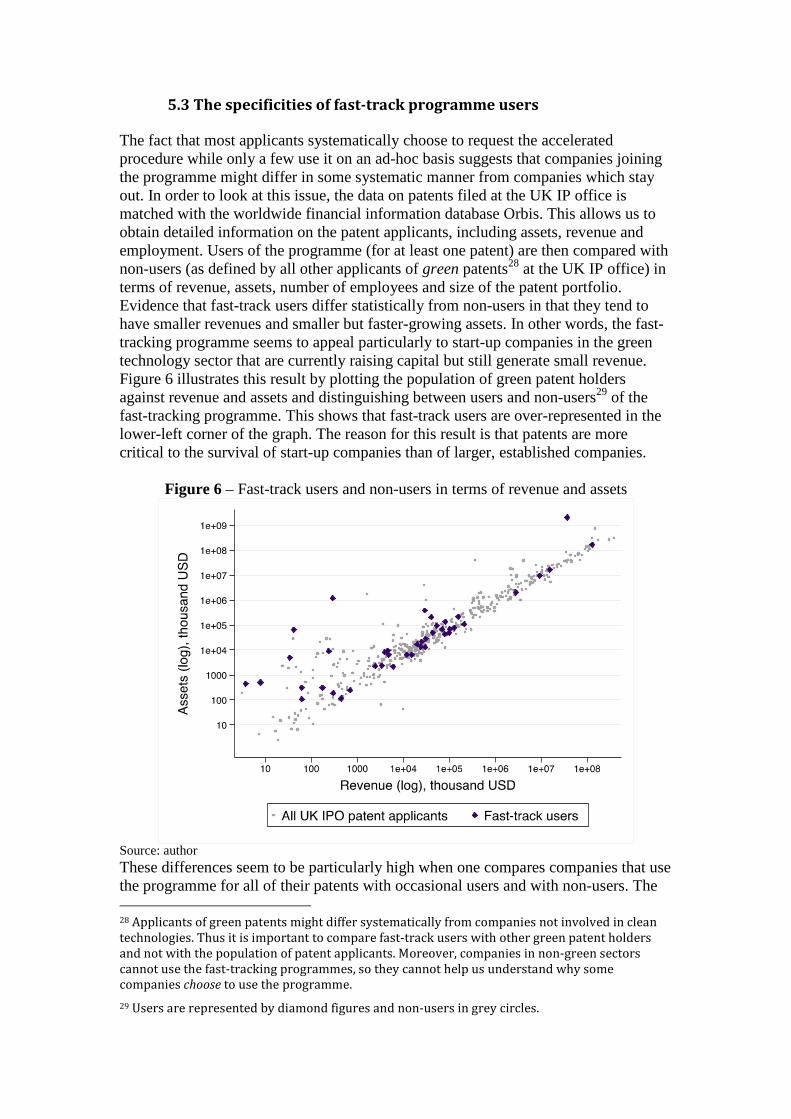
The fact that most applicants systematically choose to request the accelerated procedure while only a few use it on an ad-hoc basis suggests that companies joining the programme might differ in some systematic manner from companies which stay out. In order to look at this issue, the data on patents filed at the UK IP office is matched with the worldwide financial information database Orbis. This allows us to obtain detailed information on the patent applicants, including assets, revenue and employment. Users of the programme (for at least one patent) are then compared with non-users (as defined by all other applicants of green patents28 at the UK IP office) in terms of revenue, assets, number of employees and size of the patent portfolio. Evidence that fast-track users differ statistically from non-users in that they tend to have smaller revenues and smaller but faster-growing assets. In other words, the fast-tracking programme seems to appeal particularly to start-up companies in the green technology sector that are currently raising capital but still generate small revenue. Figure 6 illustrates this result by plotting the population of green patent holders against revenue and assets and distinguishing between users and non-users29 of the fast-tracking programme. This shows that fast-track users are over-represented in the lower-left corner of the graph. The reason for this result is that patents are more critical to the survival of start-up companies than of larger, established companies.
Figure 6 – Fast-track users and non-users in terms of revenue and assets
Source: author These differences seem to be particularly high when one compares companies that use the programme for all of their patents with occasional users and with non-users. The 28 Applicants of green patents might differ systematically from companies not involved in clean
technologies. Thus it is important to compare fast-track users with other green patent holders
and not with the population of patent applicants. Moreover, companies in non-green sectors
cannot use the fast-tracking programmes, so they cannot help us understand why some
companies choose to use the programme.
29 Users are represented by diamond figures and non-users in grey circles.
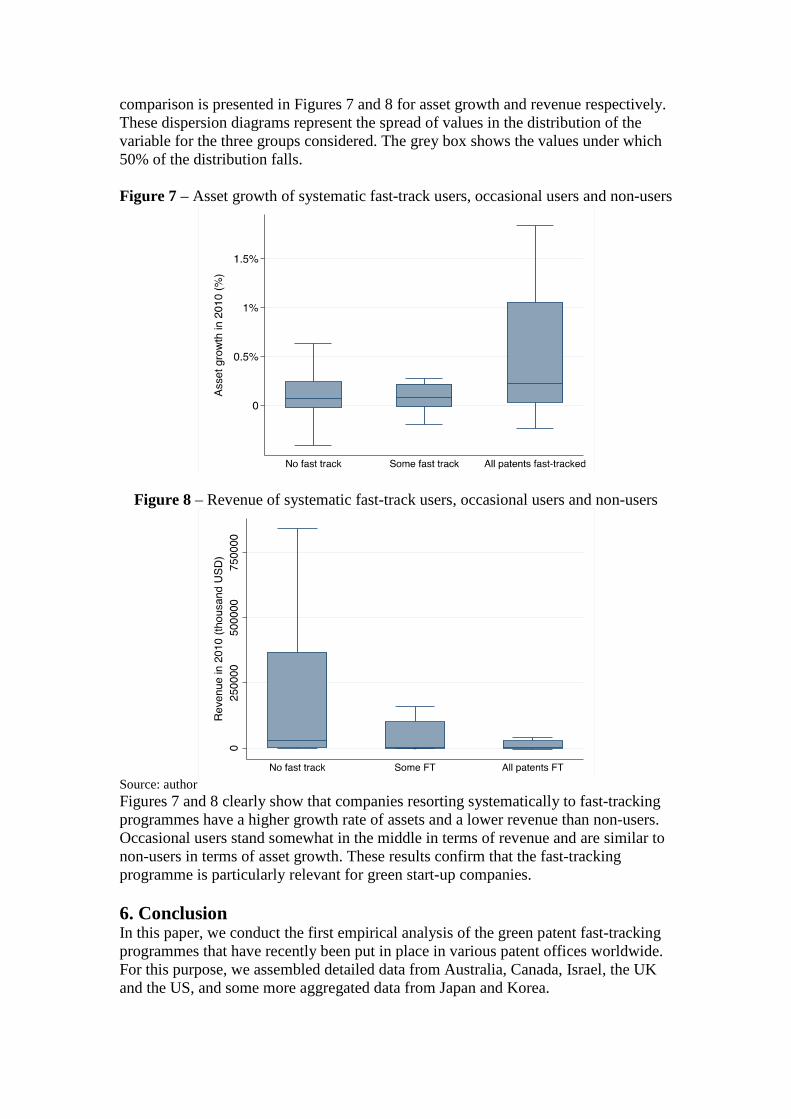
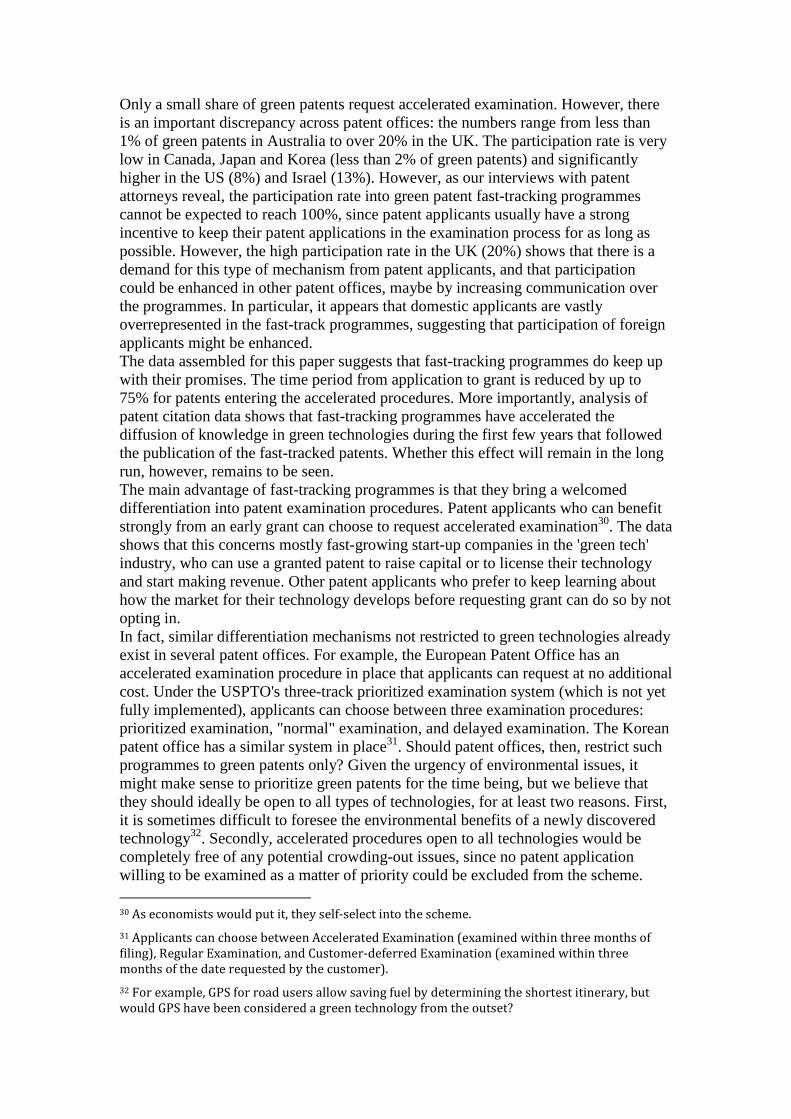
comparison is presented in Figures 7 and 8 for asset growth and revenue respectively. These dispersion diagrams represent the spread of values in the distribution of the variable for the three groups considered. The grey box shows the values under which 50% of the distribution falls. Figure 7 – Asset growth of systematic fast-track users, occasional users and non-users
Figure 8 – Revenue of systematic fast-track users, occasional users and non-users
Source: author Figures 7 and 8 clearly show that companies resorting systematically to fast-tracking programmes have a higher growth rate of assets and a lower revenue than non-users. Occasional users stand somewhat in the middle in terms of revenue and are similar to non-users in terms of asset growth. These results confirm that the fast-tracking programme is particularly relevant for green start-up companies. 6. Conclusion In this paper, we conduct the first empirical analysis of the green patent fast-tracking programmes that have recently been put in place in various patent offices worldwide. For this purpose, we assembled detailed data from Australia, Canada, Israel, the UK and the US, and some more aggregated data from Japan and Korea.
Only a small share of green patents request accelerated examination. However, there is an important discrepancy across patent offices: the numbers range from less than 1% of green patents in Australia to over 20% in the UK. The participation rate is very low in Canada, Japan and Korea (less than 2% of green patents) and significantly higher in the US (8%) and Israel (13%). However, as our interviews with patent attorneys reveal, the participation rate into green patent fast-tracking programmes cannot be expected to reach 100%, since patent applicants usually have a strong incentive to keep their patent applications in the examination process for as long as possible. However, the high participation rate in the UK (20%) shows that there is a demand for this type of mechanism from patent applicants, and that participation could be enhanced in other patent offices, maybe by increasing communication over the programmes. In particular, it appears that domestic applicants are vastly overrepresented in the fast-track programmes, suggesting that participation of foreign applicants might be enhanced. The data assembled for this paper suggests that fast-tracking programmes do keep up with their promises. The time period from application to grant is reduced by up to 75% for patents entering the accelerated procedures. More importantly, analysis of patent citation data shows that fast-tracking programmes have accelerated the diffusion of knowledge in green technologies during the first few years that followed the publication of the fast-tracked patents. Whether this effect will remain in the long run, however, remains to be seen. The main advantage of fast-tracking programmes is that they bring a welcomed differentiation into patent examination procedures. Patent applicants who can benefit strongly from an early grant can choose to request accelerated examination30. The data shows that this concerns mostly fast-growing start-up companies in the 'green tech' industry, who can use a granted patent to raise capital or to license their technology and start making revenue. Other patent applicants who prefer to keep learning about how the market for their technology develops before requesting grant can do so by not opting in. In fact, similar differentiation mechanisms not restricted to green technologies already exist in several patent offices. For example, the European Patent Office has an accelerated examination procedure in place that applicants can request at no additional cost. Under the USPTO's three-track prioritized examination system (which is not yet fully implemented), applicants can choose between three examination procedures: prioritized examination, "normal" examination, and delayed examination. The Korean patent office has a similar system in place31. Should patent offices, then, restrict such programmes to green patents only? Given the urgency of environmental issues, it might make sense to prioritize green patents for the time being, but we believe that they should ideally be open to all types of technologies, for at least two reasons. First, it is sometimes difficult to foresee the environmental benefits of a newly discovered technology32. Secondly, accelerated procedures open to all technologies would be completely free of any potential crowding-out issues, since no patent application willing to be examined as a matter of priority could be excluded from the scheme. 30 As economists would put it, they self-select into the scheme.
31 Applicants can choose between Accelerated Examination (examined within three months of
filing), Regular Examination, and Customer-deferred Examination (examined within three
months of the date requested by the customer).
32 For example, GPS for road users allow saving fuel by determining the shortest itinerary, but
would GPS have been considered a green technology from the outset?
One of the main limitations of this analysis is that we have not been able to assess to what extent fast-tracking programmes have accelerated the diffusion of green patented technologies, in particular through licensing. A survey of programme users could help answer this question, and refine our understanding of the advantages and drawbacks of accelerated examination. This is left for future research. References
Dechezleprêtre and Ménière, 2010. International patent families: from application strategies to statistical indicators. CERNA Working Paper
Dernis, H., Guellec, D., and van Pottelsberghe de la Potterie, B. (2001). Using patent counts for cross-country comparisons of technology output, pages 129–146.
Dernis, H. and Khan, M. (2004). Triadic Patent Families Methodology. OECD Science, Technology and Industry Working Papers 2004/2, OECD, Directorate for Science, Technology and Industry.
Harhoff, D., Scherer, F. M., and Vopel, K. (2003). Citations, family size, opposition and the value of patent rights. Research Policy, 32(8):1343–1363.
Jaffe, A., Tratjenberg, M., Henderson R., 1993. Geographic localization of knowledge spillovers as evidenced by patent citations. The Quarterly Journal of Economics 108(3), pp. 577-98.
Lane, 2012. Building the global green patent highway: a proposal for international harmonization of green technology fast track programs. Berkeley Technology Law Journal 27:3.
Lanjouw, J. O., Pakes, A., and Putnam, J. (1998). How to Count Patents and Value Intellectual Property:The Uses of Patent Renewal and Application Data. The Journal of Industrial Economics, 46(4).
Patton, 2012. When Patent Offices Become Captain Planet: Green Technology and Accelerated Patent Examination Programs In the United States and Abroad. Intellectual Property Brief 3, no. 3 (2012): 30-41.
Peri, G., 2005. Determinants of knowledge flows and their effect on innovation. Review of Economics and Statistics 87 (2), 308– 322.
Sterne, Kessler, Goldstein & Fox, 2012. New Global Initiatives to Accelerate Examination of Cleantech Patent Applications. August 2012.
Tran, 2012. Expediting innovation. Harvard Environmental Law Review, Vol. 36.
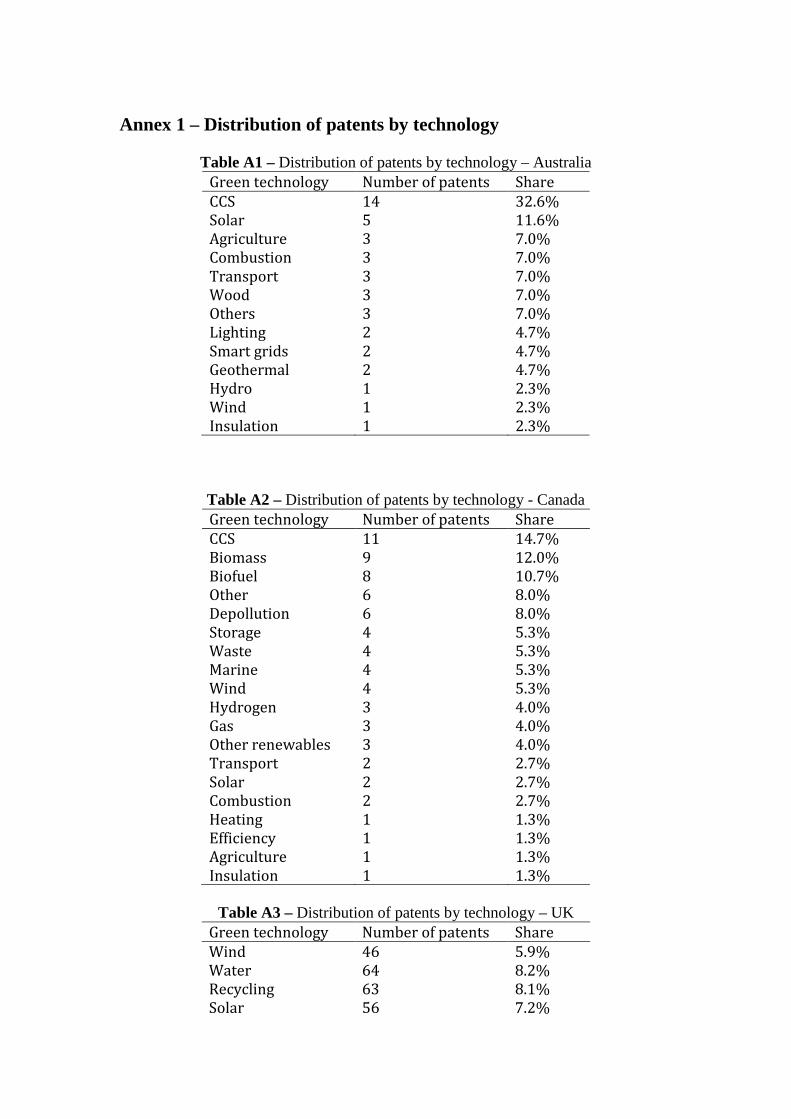
Annex 1 – Distribution of patents by technology
Table A1 – Distribution of patents by technology – Australia Green technology Number of patents Share
CCS 14 32.6%
Solar 5 11.6%
Agriculture 3 7.0%
Combustion 3 7.0%
Transport 3 7.0%
Wood 3 7.0%
Others 3 7.0%
Lighting 2 4.7%
Smart grids 2 4.7%
Geothermal 2 4.7%
Hydro 1 2.3%
Wind 1 2.3%
Insulation 1 2.3%
Table A2 – Distribution of patents by technology - Canada Green technology Number of patents Share
CCS 11 14.7%
Biomass 9 12.0%
Biofuel 8 10.7%
Other 6 8.0%
Depollution 6 8.0%
Storage 4 5.3%
Waste 4 5.3%
Marine 4 5.3%
Wind 4 5.3%
Hydrogen 3 4.0%
Gas 3 4.0%
Other renewables 3 4.0%
Transport 2 2.7%
Solar 2 2.7%
Combustion 2 2.7%
Heating 1 1.3%
Efficiency 1 1.3%
Agriculture 1 1.3%
Insulation 1 1.3%
Table A3 – Distribution of patents by technology – UK
Green technology Number of patents Share
Wind 46 5.9%
Water 64 8.2%
Recycling 63 8.1%
Solar 56 7.2%
Energy Saving 229 29.5%
Vehicle 149 19.2%
Other 169 21.8%
Table A4 – Distribution of patents by technology - US Green technology Number of patents Share
Wind 214 25.63%
Solar 108 12.93%
Lighting 88 10.54%
Internal combustion engine 75 8.98%
Energy efficiency 58 6.95%
Bioengineering 42 5.03%
Storage 34 4.07%
Chemical engineering 28 3.35%
Fuel cell 19 2.28%
Electric vehicle 19 2.28%
Emissions controls 19 2.28%
Biofuel 16 1.92%
Wastewater treatment 16 1.92%
Materials 13 1.56%
Renewable 11 1.32%
Hybrid vehicle 10 1.20%
Production 10 1.20%
Fossil fuel 9 1.08%
Recycling 6 0.72%
Green building 6 0.72%
Vehicle 6 0.72%
Hydroelectric 6 0.72%
Wave 4 0.48%
Geothermal 3 0.36%
CCS 2 0.24%
Photovoltaics 2 0.24%
Fluid flow 2 0.24%
Trading & offsets 2 0.24%
Generation 1 0.12%
Distribution efficiency 1 0.12%
Roadway 1 0.12%
Fertilizer alternative 1 0.12%
Yield enhancement 1 0.12%
Liquid purification 1 0.12%
Disaster 1 0.12%
Table A5 – Distribution of patents by technology - Israel Green technology Number of patents Share
Water 23 29.49%
Other 16 20.51%
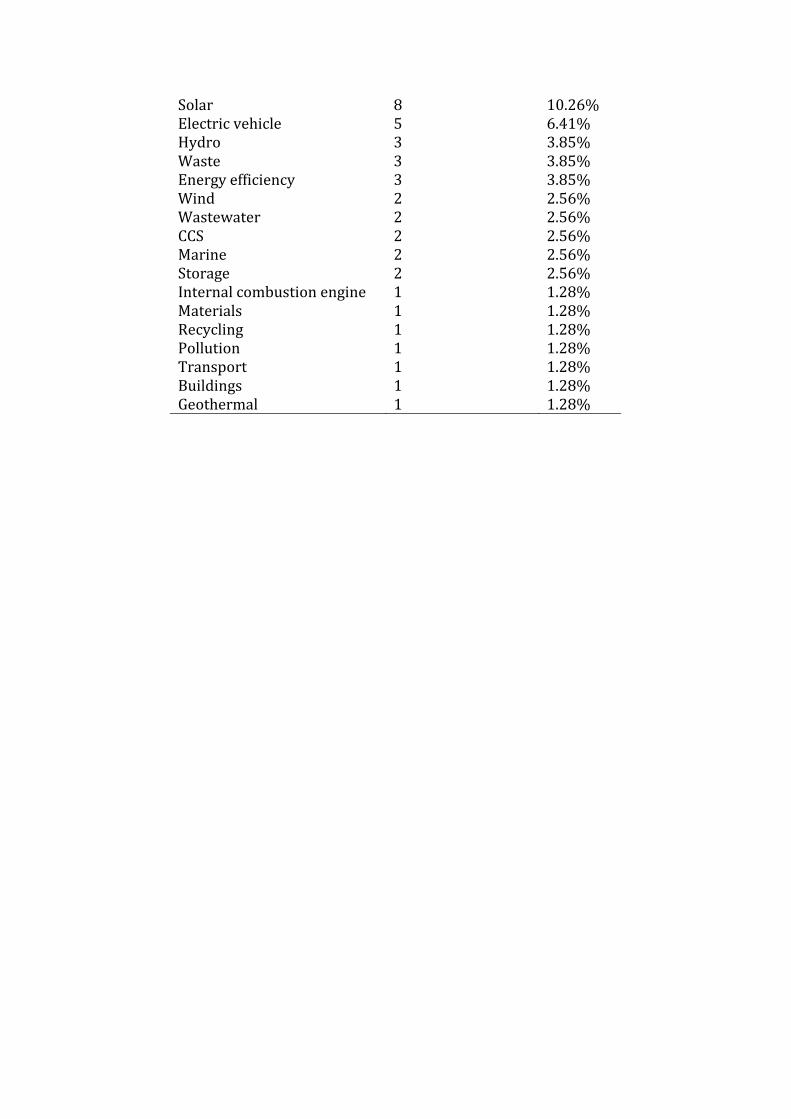
Solar 8 10.26%
Electric vehicle 5 6.41%
Hydro 3 3.85%
Waste 3 3.85%
Energy efficiency 3 3.85%
Wind 2 2.56%
Wastewater 2 2.56%
CCS 2 2.56%
Marine 2 2.56%
Storage 2 2.56%
Internal combustion engine 1 1.28%
Materials 1 1.28%
Recycling 1 1.28%
Pollution 1 1.28%
Transport 1 1.28%
Buildings 1 1.28%
Geothermal 1 1.28%
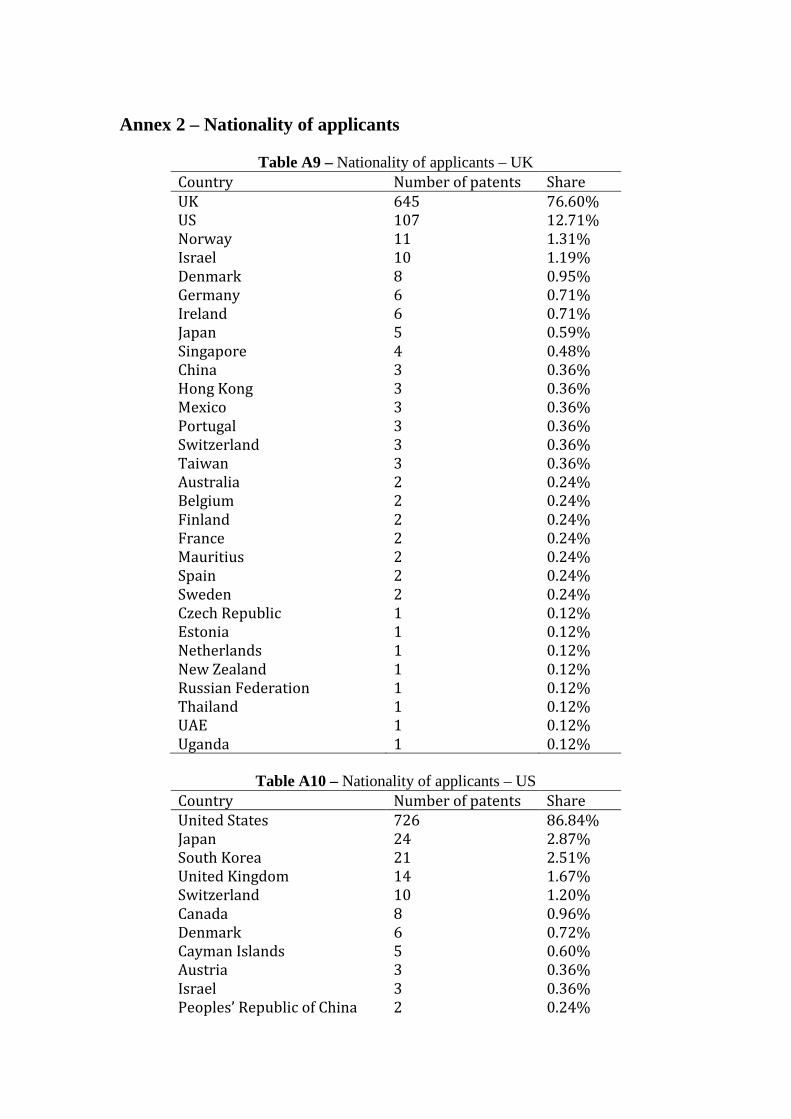
Annex 2 – Nationality of applicants
Table A9 – Nationality of applicants – UK Country Number of patents Share
UK 645 76.60%
US 107 12.71%
Norway 11 1.31%
Israel 10 1.19%
Denmark 8 0.95%
Germany 6 0.71%
Ireland 6 0.71%
Japan 5 0.59%
Singapore 4 0.48%
China 3 0.36%
Hong Kong 3 0.36%
Mexico 3 0.36%
Portugal 3 0.36%
Switzerland 3 0.36%
Taiwan 3 0.36%
Australia 2 0.24%
Belgium 2 0.24%
Finland 2 0.24%
France 2 0.24%
Mauritius 2 0.24%
Spain 2 0.24%
Sweden 2 0.24%
Czech Republic 1 0.12%
Estonia 1 0.12%
Netherlands 1 0.12%
New Zealand 1 0.12%
Russian Federation 1 0.12%
Thailand 1 0.12%
UAE 1 0.12%
Uganda 1 0.12%
Table A10 – Nationality of applicants – US
Country Number of patents Share
United States 726 86.84%
Japan 24 2.87%
South Korea 21 2.51%
United Kingdom 14 1.67%
Switzerland 10 1.20%
Canada 8 0.96%
Denmark 6 0.72%
Cayman Islands 5 0.60%
Austria 3 0.36%
Israel 3 0.36%
Peoples’ Republic of China 2 0.24%
Hong Kong, China 2 0.24%
Singapore 2 0.24%
Taiwan 2 0.24%
Australia 1 0.12%
Brazil 1 0.12%
France 1 0.12%
Germany 1 0.12%
Italy 1 0.12%
Luxembourg 1 0.12%
New Zealand 1 0.12%
Saudi Arabia 1 0.12%
Table A11 – Nationality of inventors – US Country Number of patents Share
United States 648 77.51%
Germany 43 5.14%
India 21 2.51%
South Korea 21 2.51%
Japan 19 2.27%
Peoples' Republic of China 15 1.79%
Netherlands 14 1.67%
United Kingdom 12 1.44%
Canada 7 0.84%
Denmark 6 0.72%
Israel 6 0.72%
Taiwan 6 0.72%
Austria 4 0.48%
Spain 4 0.48%
Australia 2 0.24%
Switzerland 2 0.24%
Brazil 1 0.12%
Hong Kong, China 1 0.12%
France 1 0.12%
Luxembourg 1 0.12%
New Zealand 1 0.12%
Saudi Arabia 1 0.12%
Table A12 – Nationality of inventors – UK Country Number of patents Share
UK 223 68.20%
USA 74 22.63%
Germany 5 1.53%
Ireland 4 1.22%
Taiwan 3 0.92%
Australia 2 0.61%
China 2 0.61%
Mauritius 2 0.61%
Singapore 2 0.61%
South Africa 2 0.61%
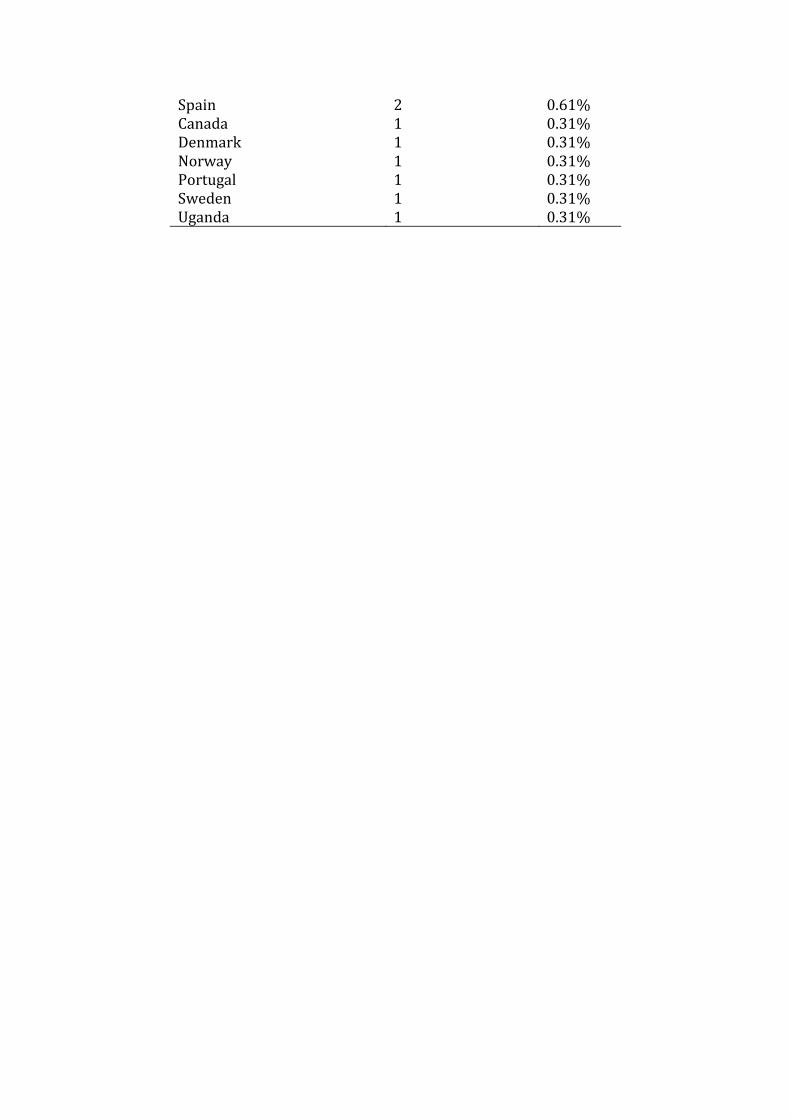
Spain 2 0.61%
Canada 1 0.31%
Denmark 1 0.31%
Norway 1 0.31%
Portugal 1 0.31%
Sweden 1 0.31%
Uganda 1 0.31%