availability technologies conservation and diffusion of...
TRANSCRIPT
Please cite this paper as:
Dechezleprêtre, A., I. Haščič and N. Johnstone (2015),“Invention and International Diffusion of Water Conservationand Availability Technologies: Evidence from Patent Data”,OECD Environment Working Papers, No. 82, OECDPublishing.http://dx.doi.org/10.1787/5js679fvllhg-en
OECD Environment Working PapersNo. 82
Invention and InternationalDiffusion of WaterConservation andAvailability Technologies
EVIDENCE FROM PATENT DATA
Antoine Dechezleprêtre, Ivan Haščič,Nick Johnstone
JEL Classification: O3, O31, O38, Q25, Q28, Q55

Unclassified ENV/WKP(2015)3 Organisation de Coopération et de Développement Économiques Organisation for Economic Co-operation and Development 10-Feb-2015 ___________________________________________________________________________________________
English - Or. English ENVIRONMENT DIRECTORATE
INVENTION AND INTERNATIONAL DIFFUSION OF WATER CONSERVATION AND AVAILABILITY TECHNOLOGIES: EVIDENCE FROM PATENT DATA - ENVIRONMENT WORKING PAPER No. 82
by Antoine Dechezleprêtre (1), Ivan Haščič (2) and Nick Johnstone (3)
OECD Working Papers should not be reported as representing the official views of the OECD or of its membercountries. The opinions expressed and arguments employed are those of the author(s). (1) Grantham Research Institute on Climate Change and the Environment, London School of Economics (2) OECD Environment Directorate (3) OECD Directorate for Science, Technology and Innovation Authorised for publication by Simon Upton, Director, Environment Directorate. Keywords: climate change adaptation; water scarcity; innovation; JEL classification: O3; O31; O38; Q25; Q28; Q55
OECD Environment working papers are available at www.oecd.org/env/workingpapers.htm
JT03370339
Complete document available on OLIS in its original format This document and any map included herein are without prejudice to the status of or sovereignty over any territory, to the delimitation of international frontiers and boundaries and to the name of any territory, city or area.
ENV
/WK
P(2015)3 U
nclassified
English - O
r. English

ENV/WKP(2015)3
2
OECD ENVIRONMENT WORKING PAPERS
OECD Working Papers should not be reported as representing the official views of the OECD or of its member countries. The opinions expressed and arguments employed are those of the author(s).
OECD Working Papers describe preliminary results or research in progress by the author(s) and are
published to stimulate discussion on a broad range of issues on which the OECD works.
This series is designed to make available to a wider readership selected studies on environmental issues prepared for use within the OECD. Authorship is usually collective, but principal author(s) are named. The papers are generally available only in their original language - English or French - with a
summary in the other.
Comments on Working Papers are welcomed, and may be sent to:
Environment Directorate, OECD, 2 rue André-Pascal, 75775 Paris Cedex 16, France
or by e-mail: [email protected]
--------------------------------------------------------------------------- OECD Environment Working Papers are published on
www.oecd.org/env/workingpapers.htm ---------------------------------------------------------------------------
This document and any map included herein are without prejudice to the status of or sovereignty over any territory, to the delimitation of international frontiers and boundaries and to the name of any territory, city or area. The statistical data for Israel are supplied by and under the responsibility of the relevant Israeli authorities. The use of such data by the OECD is without prejudice to the status of the Golan Heights, East Jerusalem and Israeli settlements in the West Bank under the terms of international law.
© OECD 2015 You can copy, download or print OECD content for your own use, and you can include excerpts from OECD publications, databases and multimedia products in your own documents, presentations, blogs, websites and teaching materials, provided that suitable acknowledgement of OECD as source and copyright owner is given. All requests for commercial use and translation rights should be submitted to [email protected].

ENV/WKP(2015)3
3
ABSTRACT
This paper identifies over 50 000 patents filed worldwide in various water-related adaptation technologies between 1990 and 2010, distinguishing between those related to water availability (supply) and water conservation (demand) technologies. The paper then analyses the innovation activity – including inventive activity by country and technology, international collaboration in technology development, and international diffusion of such water-related technologies. The results suggest that although innovation activity in water-related technologies has been increasing over the last two decades, this growth has been disproportionately concentrated on supply-side technologies. Moreover, most innovation worldwide occurs in countries with low or moderate vulnerability towards water scarcity. While this is a reflection of the fact that most developed economies do not face severe water stress, this result highlights the importance of international technology transfer and policies that facilitate broad diffusion of these technologies in water-stressed countries.
Keywords: climate change adaptation; water scarcity; innovation;
JEL classification: O3; O31; O38; Q25; Q28; Q55
RÉSUMÉ
Ce document identifie plus de 50 000 brevets déposés dans le monde entier entre 1990 et 2010 sur diverses technologies d’adaptation dans le domaine de l’eau, en distinguant entre les technologies concernant l’accès à l’eau (offre) et celles qui se rapportent à la conservation de l’eau (demande). Il analyse ensuite les activités d’innovation – en particulier les activités d’invention par pays et technologies, la collaboration internationale dans le développement des technologies et la diffusion internationale des technologies dans le domaine de l’eau. Bien que l’activité d’innovation dans le domaine des technologies hydriques ait augmenté pendant les deux dernières décennies, cette augmentation a porté de façon disproportionnée sur les technologies du côté de l’offre. Dans la majorité l’innovation a lieu dans des pays peu ou modérément vulnérables au risque de pénurie des ressources en eau. Cette situation, qui reflète certainement le fait que la plupart des pays les plus développés ne sont pas confrontés à un grave déficit hydrique, souligne l’importance des transferts internationaux de technologies et des politiques susceptibles de faciliter une large diffusion de ces technologies dans les pays déficitaires en eau.
Mots-clés : adaptation au changement climatique ; rareté de l’eau ; innovation.
Classification JEL : O3; O31; O38; Q25; Q28; Q55

ENV/WKP(2015)3
4
FOREWORD
This paper is a contribution to the OECD project on “Environmental Policy and Technological Innovation”. It has been authored by Antoine Dechezleprêtre (London School of Economics), Ivan Haščič (OECD Environment Directorate) and Nick Johnstone (OECD Directorate for Science, Technology and Innovation). A draft of this paper was reviewed by the Working Party on Climate, Investment and Development (WPCID) and benefited from comments received. The authors are grateful to Xavier Leflaive for helpful comments on an earlier version of this paper, and to Jenny Calder and Elvira Berrueta-Imaz for editorial assistance.

ENV/WKP(2015)3
5
EXECUTIVE SUMMARY
Improving access to safe drinking water and sanitation is a fundamental human need and is one of the Millennium Developments Goals. Yet, a significant share of the world's population still does not have access to piped water supply or a clean water source, and it is predicted that demand for water will increase sharply in the coming decades. Water availability will be further impacted by climate change, particularly in already water-stressed regions.
Addressing this problem requires improvements in water management across all sectors, including agriculture, manufacturing, power production and domestic supply. This will necessitate a massive deployment of water-related technologies, including drip irrigation, rainwater collection, greywater reuse and water-saving devices for domestic supply. The development and deployment of water conservation and water availability technologies is therefore a priority for development and climate change adaptation policies. Given that most of the already water-stressed regions are located in emerging economies and less developed countries (IPCC 2007), innovation and technology diffusion in those countries will be key to successful adaptation to decreasing water availability.
This paper identifies over 50 000 patents filed worldwide in various water-related adaptation technologies between 1990 and 2010, distinguishing between those related to water availability (supply) and water conservation (demand) technologies. The analysis covers a wide range of technologies that may either increase the supply of water (rainwater collection, groundwater collection, water storage, desalination…) or decrease water demand (water control in agriculture, water efficiency technologies in power production, domestic water recycling, efficient water distribution systems…). In this report, such technologies are referred to as water-related adaptation technologies. Although not all relevant technologies could be included due to data constraints, the analysis covers most of the technological adaptation options for water supply and demand identified by the 2007 IPCC report.
The paper analyses the innovation activity – including inventive activity by country and technology, international collaboration in technology development, and international diffusion of such water-related technologies. The following results stand out:
Although inventive activity in water-related technologies has been increasing over the last two decades, this growth has been disproportionately concentrated on supply-side technologies. This suggests that priority has so far been given to expanding water availability rather than reducing consumption by means of water-efficiency measures. Yet differences in underlying characteristics of water demand vs water supply management might also explain the contrasted performance regarding patenting of technological innovations. For example, reliance on technological solutions in achieving efficiency improvements, the importance of innovations originating in other sectors (e.g. ICT and smart water infrastructure), and differences in market structure and hence propensity to patent between supply-side and demand-side activities might too help explain the observed differences in patenting trends.
Over 70% of innovation worldwide happens in countries with low or moderate vulnerability towards water scarcity. With the exception of Australia, Spain and Israel, countries with severe water issues do not appear to specialize in water-related technologies. This is certainly a reflection of the fact that most developed economies, where most patenting takes place, do not face severe water stress; it also

ENV/WKP(2015)3
6
highlights the importance of international technology transfer and policies that facilitate broad diffusion of these technologies in water-stressed countries.
Interestingly, the most water-stressed countries are not always the countries where water technologies are most heavily patented. In terms of the absolute number of patent applications, Japan, Europe and the US are – not surprisingly – the three main markets for water-related technologies. However, relative to the overall volume of patenting and the global share of patents in the field, countries such as Australia, Morocco and Israel are significant markets for water technologies. The data reveals that some countries with abundant water resources, such as Switzerland or Norway, also appear as significant markets for water-related technologies. Further research is needed to understand to what extent pro-active water conservation policies, and other factors, might have played a role in encouraging the development and diffusion of water-saving technologies in these countries, or whether this is related to these countries acting as intermediaries for transferring the technologies.

ENV/WKP(2015)3
7
TABLE OF CONTENTS
ABSTRACT .................................................................................................................................................... 3
RÉSUMÉ ......................................................................................................................................................... 3
FOREWORD ................................................................................................................................................... 4
EXECUTIVE SUMMARY ............................................................................................................................. 5
TABLE OF CONTENTS ................................................................................................................................ 7
INVENTION AND INTERNATIONAL DIFFUSION OF WATER CONSERVATION AND AVAILABILITY TECHNOLOGIES: EVIDENCE FROM PATENT DATA ............................................... 9
1. Introduction .............................................................................................................................................. 9 2. Methodology .......................................................................................................................................... 11
2.1 Technological scope ......................................................................................................................... 11 2.2 Patent search strategies ..................................................................................................................... 12 2.3 Construction of patent statistics ....................................................................................................... 12
3. Inventive activity ................................................................................................................................... 13 3.1 Innovation by technological field ..................................................................................................... 13 3.2 Main inventor countries.................................................................................................................... 17
4. Technology markets ............................................................................................................................... 23 4.1 Patent filings by technological field ................................................................................................. 23 4.2 Main patent offices ........................................................................................................................... 26
5. International technology diffusion ......................................................................................................... 30 5.1. Cross-border patent transfers........................................................................................................... 30 5.2 International collaboration in technology development ................................................................... 34 5.3 International knowledge flows ......................................................................................................... 38
6. Conclusion ............................................................................................................................................. 40
REFERENCES .............................................................................................................................................. 41
ANNEX 1. PATENT CLASSIFICATION CODES ..................................................................................... 43
DEMAND-SIDE TECHNOLOGIES ........................................................................................................ 43 SUPPLY-SIDE TECHNOLOGIES ........................................................................................................... 44
ANNEX 2. TOP INVENTOR COUNTRIES ................................................................................................ 45
ANNEX 3. TOP INVENTOR COUNTRIES BY TECHNOLOGY (2000-2010) ........................................ 46
All technologies (PATSTAT) ................................................................................................................ 46 All water ................................................................................................................................................. 46 3.1 Demand-side water-related technologies ......................................................................................... 47 Control of watering ................................................................................................................................ 47 Crops ...................................................................................................................................................... 48 Drip irrigation ......................................................................................................................................... 48 Grey water .............................................................................................................................................. 49 Piping leakage ........................................................................................................................................ 49 Sanitation ................................................................................................................................................ 50

ENV/WKP(2015)3
8
Water efficiency domestic ...................................................................................................................... 50 Water efficiency power .......................................................................................................................... 51 3.2 Supply-side water-related technologies ............................................................................................ 52 Surface collection ................................................................................................................................... 52 Underground collection .......................................................................................................................... 53 Desalination ............................................................................................................................................ 53 Rainwater collection ............................................................................................................................... 54 Storage .................................................................................................................................................... 54
ANNEX 4. GROWTH OF INNOVATION BY INVENTOR COUNTRY .................................................. 55

ENV/WKP(2015)3
9
INVENTION AND INTERNATIONAL DIFFUSION OF WATER CONSERVATION AND AVAILABILITY TECHNOLOGIES: EVIDENCE FROM PATENT DATA
1. Introduction
Access to clean water is one of the most fundamental needs of human life. Indeed, one of the Millennium Developments Goals includes improved access to safe drinking water and sanitation1 (UNDP 2006). Yet, in 2010, about 14% of the world's population (884 million people) did not have access to piped water supply or a clean water source (UNICEF 2010). Moreover, water demand is predicted to increase by 55% by 2050 because of population and economic growth, and climate change is likely to affect freshwater supply through increased temperatures, sea level rise and precipitation variability (IPCC 2007). Climate change will impact water availability in many regions of the world, but this effect will be particularly severe in already water-stressed regions, such as the Mediterranean basin, western USA and Canada, southern Africa and north-eastern Brazil. As a result, it is predicted that by 2050 around 3.9 billion people (over 40% of the world's population) will be living in river basins under severe water stress (OECD 2012a).
Addressing this problem requires massive improvements in water management in all sectors, including agriculture, manufacturing, power production and domestic supply. This will necessitate a massive deployment of water-related technologies, including drip irrigation, drought-resistant crops, rainwater collection, greywater reuse and water-saving devices for domestic supply. The development and deployment of water conservation and availability technologies is therefore a priority for development and climate change adaptation policies. The developing world is particularly important in this respect, as most of the already water-stressed regions are located in emerging economies and less developed countries (IPCC 2007). For this reason, innovation and technology diffusion are essential for successful adaptation to decreasing water availability. The development and deployment of water conservation and availability technologies should therefore be a priority for public policies directed at economic development and climate change adaptation.
Against this background, the objective of this study is to provide an accurate and up-to-date description of innovation in such technologies and of their international diffusion at the global level. For the purpose of this chapter a new patent data set has been generated that includes over 50,000 unique patents filed worldwide in various water-related technologies between 1990 and 2010. The information available in patent data (such as patent office, date of application, location of inventors, patent citations…) is then used to analyse innovation activity – including international collaboration in technology development – and international diffusion in water-related technologies.
The analysis covers a wide range of technologies that may either increase the supply of water (rainwater collection, groundwater collection, water storage, desalination…) or decrease water demand (water control in agriculture, water efficiency technologies in power production, domestic water recycling, efficient water distribution systems…). For the remainder of this report such technologies are referred to as water-related adaptation technologies, distinguishing between those related to availability (supply) and conservation (demand). Although not all relevant technologies could be included due to obvious data constraints, the analysis covers most of the technological adaptation options for water supply and demand identified by the last IPCC report (see IPCC 2007).
1 Target 7C is to "halve, by 2015, the proportion of the population without sustainable access to safe drinking water
and basic sanitation".

ENV/WKP(2015)3
10
Three results stand out from our analysis:
• First, although innovation activity in water-related technologies has been increasing over the last two decades, this growth has been disproportionately concentrated on supply-side technologies. This suggests that priority has so far been given to expanding water availability rather than reducing consumption by means of water-efficiency measures. Yet differences in underlying characteristics of water demand vs water supply management might also explain the contrasted performance regarding patenting of technological innovations. For example, reliance on technological solutions in achieving efficiency improvements, the importance of innovations originating in other sectors (e.g. ICT and smart water infrastructure), and differences in market structure and hence propensity to patent between supply-side and demand-side activities might too help explain the observed differences in patenting trends.
• Second, over 70% of innovation worldwide happens in countries with low or moderate vulnerability towards water scarcity. With the exception of Australia, Spain and Israel, countries with severe water issues do not appear to specialize in water-related technologies. This is certainly a reflection of the fact that most developed economies, where most patenting takes place, do not face severe water stress; it also highlights the importance of international technology transfer and policies that facilitate broad diffusion of these technologies in water-stressed countries.
• Finally, the data reveals that some countries with large water resources, such as Switzerland or Norway, nevertheless appear as significant markets for water-related technologies. Further research is needed to understand to what extent pro-active water conservation policies, and other factors, might have played a role in encouraging the development and diffusion of water-saving technologies in these countries, or whether this is related to these countries acting as intermediaries for transferring the technologies.
Finally, the study is necessarily limited in scope. First, it focuses specifically on innovation responses directed at “water quantity”, and consequently some water-related technologies are not covered. For example, water treatment technologies or others directed at “water quality” issues are not covered here although such innovations also have a role to play in climate change adaptation efforts insofar they can augment the supply of water and limit the cost of treating water downstream. (For analyses of technological innovations directed at water quality see e.g. OECD 2011a.) Second, innovation in sectors that are not directly water-related might also contribute to improved water management and water efficiency (e.g. ICT, new materials). Nevertheless, such innovations are beyond the scope of the present study.
The study relates to two strands of the literature. First, it builds on the growing empirical literature that uses patent data to describe the geography of environmental innovation and explain its determinants (Dechezleprêtre et al., 2011; Haščič and Johnstone, 2011; Lanjouw and Mody, 1996; OECD, 2011a; Popp, 2006; Verdolini and Galeotti, 2011). Most of the recent literature has focused on climate change related technologies (see, for example, Popp, 2011). As regards water-related innovation specifically, to the best of our knowledge no empirical analysis has been carried out so far. However, some surveys and case studies have been conducted (Purohit and Kandpal, 2005; Partzsch, 2009; Krozer et al., 2010; EIO, 2011). In particular, the OECD has recently reviewed policies targeted at eco-innovation in a range of countries, with a particular focus on water-related innovation for Israel and South Africa (see OECD, 2011b and 2011c). This complements similar country profiles compiled by the European Commission under the Environment Technology Action Plan
Second, the paper relates to the vast literature on water management, surveyed in Convery, 2013 (see also OECD, 2003; Olmstead, 2010; OECD, 2010 and OECD, 2012b). While recognizing that technological change may mitigate water scarcity issues, this literature has mainly investigated the market-based policies

ENV/WKP(2015)3
11
that may induce a more sustainable consumption of water resources, for example the creation of water markets (Pigram, 1993).
The report is organized as follows. Section 2 discusses the methodology adopted to conduct the analysis. The technologies covered are presented and the relevant patents in the PATSTAT database are identified. Section 3 deals with innovation activity. Trends in water-related adaptation innovation worldwide are presented, and the main inventor countries are identified. Section 4 examines the main markets for water-related adaptation technologies. In section 5 data on international technology diffusion is presented. Section 6 concludes.
2. Methodology
2.1 Technological scope
Chapter 3 of the Second Working Group's contribution to the Fourth IPCC assessment report deals with "freshwater resources and their management". The authors identify a number of adaptation options in the face of the projected impacts of climate change on freshwater systems. These are categorized between supply-side options (that aim at increasing the supply of water in drought conditions) and demand-side options (whose objective is to reduce water consumption). In Table 1 we reproduce Table 3.5 from the IPCC report, which summarizes the main adaptation options.
Table 1. Some adaptation options for water supply and demand
Supply-side Demand-side • Prospecting and extraction of
groundwater
• Increasing storage capacity by building reservoirs and dams
• Desalination of sea water
• Expansion of rain-water storage
• Removal of invasive non-native vegetation from riparian areas
• Improvement of water-use efficiency by recycling water
• Reduction in water demand for irrigation by changing the cropping calendar, crop mix, irrigation method, and area planted
• Reduction in water demand for irrigation by importing agricultural products, i.e., virtual water
• Promotion of indigenous practices for sustainable water use
• Expanded use of water markets to reallocate water to highly valued uses
Source: IPCC, 2007
In this paper most of these adaptation options are covered. The literature has been used to identify technologies corresponding to these adaptation options. This has been complemented with information from interviews with experts and engineers working in the water sector.2 The list of technologies covered in this paper is shown in Table 2. Technological (thus patentable) adaptation innovations are the focus. This is why we do not, for example, cover water markets.
2 We are especially indebted to Professor Nigel Graham (Head, Environmental and Water Resource Engineering
Section, Department of Civil and Environmental Engineering, Imperial College London) for extremely helpful discussions.

ENV/WKP(2015)3
12
Table 2. Technologies covered in the study
Supply-side Demand-side Water collection
• Underground water collection
• Surface water collection
• Rainwater collection
Water storage
Desalination
Households
• Domestic water efficiency (self-closing valves, aeration of water)
• Sanitation (dual-flush toilets, dry toilets, closed-circuit toilets)
• Greywater use
Distribution
• Piping – reducing leakage & leakage monitoring
Manufacturing
• Water efficiency in power production
Agriculture
• Control of watering
• Drought-resistant crops
• Drip irrigation
2.2 Patent search strategies
To identify patent documents in these technologies, the International Patent Classification (IPC) and the European Patent Classification (ECLA) have been used. Previous work by the OECD has been used as the basis for the searches.3 Note that a few technologies could not be included because no IPC or ECLA patent classification code could be associated with them or the relevant codes were too broad to identify documents of specific relevance. This is the case for example of water-saving technologies for domestic appliances (washing machines and dishwashers). The list of patent codes used in this study is shown in Annex 1.4
2.3 Construction of patent statistics5
In order to measure inventive activity, counts of patent priorities by year of application (priority date) are constructed. The PATSTAT database includes the country of residence of the inventors of those technologies for which patent protection is sought (independent of the country in which the applications are actually filed). Counting only the priority applications ensures that inventions are not double-counted. This information is used to measure a country’s innovation performance.6
Importantly, a single invention may be patented in several countries. The set of patents related to the same invention is called a patent family, and applications filed in offices subsequent to the application filed
3 In particular: OECD Invention and Transfer of Environmental Technologies (Paris, 2011); and, OECD Energy and
Climate Policy: Bending the Technological Trajectory (Paris, 2012). 4 Note that since the searches were undertaken the ECLA scheme has been superseded by the Cooperative Patent
Classification (CPC) scheme. The ECLA symbols can be easily translated into the CPC using the available correspondence tables.
5 See "Methodological Issues in the Development of Indicators of Innovation and Transfer in Environmental Technologies" in OECD Invention and Transfer of Environmental Technologies (2011)
6 Patents with multiple inventors are counted fractionally. For example, if two inventor countries are involved in an invention, then each country is counted as one-half.

ENV/WKP(2015)3
13
at the first ("priority") office are referred to as duplicate applications.7 As a measure of technology diffusion, the count of the number of patent applications in recipient countries for technologies invented abroad is used (for example, the number of inventions developed in Germany and patented in China in 2005).
The advantages and limitations of patenting as a measure of innovation have been extensively discussed (see OECD, 2009, for a recent overview). For the purposes of this paper, the main advantage of using patents is that they are available at a highly disaggregated level in terms of technology types. It is possible to distinguish innovations in the water sector according to specific technologies, whereas R&D investment cannot be easily disaggregated.
An important limitation of patent data is that the value of patents is very heterogeneous. The authors of this paper have previously made the case that patents filed in at least two jurisdictions (so-called claimed priorities8) offer an attractive quality threshold to screen out low-value patents. In the following sections, this threshold is applied to present statistics on 'high-value' inventions together with statistics on 'all inventions'.
3. Inventive activity
3.1 Innovation by technological field
Between 1990 and 2010, over 28,000 inventions were patented worldwide in water-related adaptation technologies (see Table 3). This represents less than 0.2% of all inventions patented worldwide during this period of time. Of these inventions, around 8,500 can be considered of high value (i.e. claimed priorities). They represent 0.22% of all high-value inventions patented between 1990 and 2010, suggesting that water-related inventions are of slightly higher value than the average patented technology. However, this is entirely attributable to demand-side inventions. Water-related adaptation patents are about equally distributed among demand-side and supply-side technologies. Between 1990 and 2010, about 15,000 inventions were patented in demand-side technologies and over 13,000 in supply-side technologies.
Table 3. Inventions in water-related adaptation technologies
Category All inventions 'High-value' inventions
Number of inventions
Share of world's innovation
Number of inventions
Share of world's innovation
All water 28443 0.18% 8478 0.22%
Demand-side 15048 0.09% 5717 0.15%
Supply-side 13513 0.08% 2804 0.07%
7 The vast majority of families include only one country (often the home country of the inventor, particularly for large
countries). 8 When a patent is filed in several countries, the first patent is called the priority application, since the inventor can
take advantage of the filing date of the first application to claim priority from another application filed in the meantime in the other jurisdictions. Thus filing a second patent application abroad is called 'claiming priority'. Claiming priority is desirable because the earlier effective filing date reduces the number of prior art disclosures, increasing the likelihood of obtaining a patent.
ENV/WKP(2015)3
14
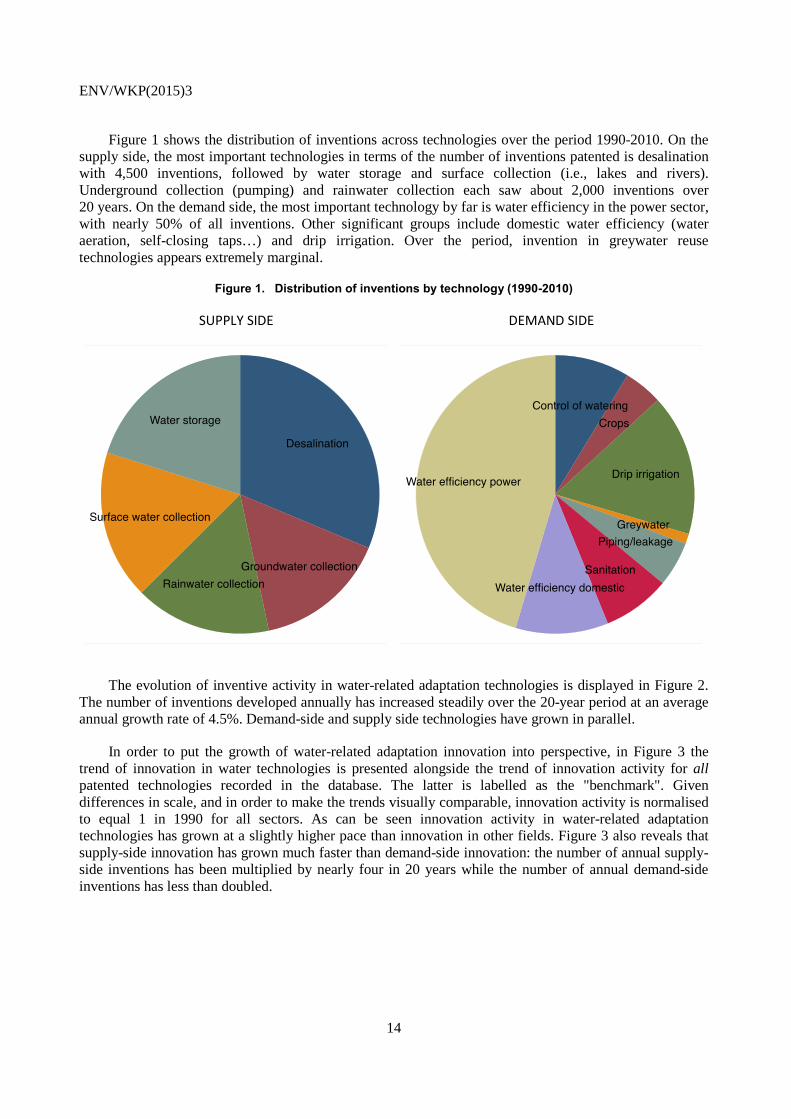
Figure 1 shows the distribution of inventions across technologies over the period 1990-2010. On the supply side, the most important technologies in terms of the number of inventions patented is desalination with 4,500 inventions, followed by water storage and surface collection (i.e., lakes and rivers). Underground collection (pumping) and rainwater collection each saw about 2,000 inventions over 20 years. On the demand side, the most important technology by far is water efficiency in the power sector, with nearly 50% of all inventions. Other significant groups include domestic water efficiency (water aeration, self-closing taps…) and drip irrigation. Over the period, invention in greywater reuse technologies appears extremely marginal.
Figure 1. Distribution of inventions by technology (1990-2010)
SUPPLY SIDE DEMAND SIDE
The evolution of inventive activity in water-related adaptation technologies is displayed in Figure 2.
The number of inventions developed annually has increased steadily over the 20-year period at an average annual growth rate of 4.5%. Demand-side and supply side technologies have grown in parallel.
In order to put the growth of water-related adaptation innovation into perspective, in Figure 3 the trend of innovation in water technologies is presented alongside the trend of innovation activity for all patented technologies recorded in the database. The latter is labelled as the "benchmark". Given differences in scale, and in order to make the trends visually comparable, innovation activity is normalised to equal 1 in 1990 for all sectors. As can be seen innovation activity in water-related adaptation technologies has grown at a slightly higher pace than innovation in other fields. Figure 3 also reveals that supply-side innovation has grown much faster than demand-side innovation: the number of annual supply-side inventions has been multiplied by nearly four in 20 years while the number of annual demand-side inventions has less than doubled.

ENV/WKP(2015)3
15
Figure 2. Inventive activity 1990-2010 (number of patented inventions)
Figure 3. Trend of inventive activity compared with benchmark
In Figures 4 and 5 data is presented on the trend in innovation activity for each technology individually. In order to make these comparable, innovation activity is normalized across groups by dividing annual invention counts by the average annual count for each technology.9 Two technologies stand out on the demand side. Drought-resistant crops experienced a very high growth at the end of the 1990s and the beginning of the 2000s, before flattening towards the end of the period. Invention of greywater reuse technologies has taken off only recently. Other technologies have grown at a small and
9 The reason we do not set inventive activity to equal 1 in 1990 is that the number of inventions developed in some
technologies in 1990 was close to 0, implying a very high growth rate.

ENV/WKP(2015)3
16
regular pace. On the supply side, the growth rate of innovation activity appears remarkably similar in the five technologies analysed (see Figure 5).
Figure 4. Trends by technology – Demand side
Figure 5. Trends by technology – Supply side

ENV/WKP(2015)3
17
3.2 Main inventor countries
Where does innovation take place? Figure 6 shows the top 25 inventor countries in terms of both high-value (i.e. those inventions that are patented in at least two countries) and total water-related inventions. Since the number of inventions varies greatly across technological fields, the numbers reflected in Figure 6 are calculated as the average share of inventions across the 13 technologies in our data set.
Figure 6. Top inventor countries in water-related adaptation technologies, 2000-2010
While the shares differ between the two measures, the only countries for which the rankings are very different are the main Asian inventor countries (China, Japan, Korea) for which there are a large number of ‘unclaimed’ (i.e. single office) priorities. Germany, the United Kingdom and the United States have relatively more claimed priorities. Figure 7 shows the relationship between invention of "claimed" and "unclaimed" (single office) inventions by inventor country. A country above the line has a relatively low ratio of high-value water-related adaptation inventions.
Innovation appears to be highly concentrated amongst a few countries, although this is less evidently the case for high-value patents (Figure 8). The top ten countries account for nearly 80 percent of all high-value inventions developed between 2000 and 2010. The United States, Germany and Japan are the three top inventor countries on average for water-related adaptation technologies. Four emerging economies (China, Brazil, India and South Africa) are among the world's top 25 countries, but no developing country figures in the list (see details in Annex 2).
Importantly, water-related innovation only marginally happens in countries with severe water stress issues. In Figure 8, we group countries according to how vulnerable the water supply is to climate change, using the Climate Vulnerability Index developed by DARA international10. Countries are grouped in five categories: low, moderate, high, severe and acute. We find that between 70-80% of innovation worldwide happens in countries with low or moderate vulnerability towards water scarcity. And while this is certainly 10 The data is available at http://daraint.org/climate-vulnerability-monitor/climate-vulnerability-monitor-2012/data/

ENV/WKP(2015)3
18
a reflection of the fact that most developed economies do not suffer severe water stress (although sub-national differences exist), this finding is still striking. It also highlights the importance of international technology transfer and policies that facilitate broad diffusion of these technologies in water-stressed countries.
Figure 7. Global shares of high-value and total water-efficiency inventions (2000-2010)
Figure 8. Water vulnerability and share of world's inventions in water-related technologies, 2000-2010
0%
5%
10%
15%
20%
25%
30%
0% 5% 10% 15% 20% 25% 30%
All
Inve
ntio
ns
High-value inventions
Japan
USA
China
Germany
United Kingdom
Korea

ENV/WKP(2015)3
19
Table 4 presents the top three technologies for the main OECD and BRIICS inventor countries. Although the United States, Germany and Japan are the main inventor countries in many technologies, some countries have strong positions in specific fields. For example, given their usual place in the hierarchy of worldwide innovation the cases of Australia (greywater, rainwater collection, water storage) and Israel (drip irrigation, control of watering, desalination) are striking. China is the third most innovative country in drought-resistant crops. Noticeably, Malaysia appears in the top 20 inventor countries for greywater use, as does Indonesia for surface water collection. The top 20 inventor countries in each technology are presented in Annex 3.
Table 4. Top three technologies for selected inventor countries
Country Category Share Global rank Australia Greywater 24.30% 1 Rainwater collection 22.03% 1 Water storage 10.58% 3 Brazil Greywater 1.87% 15 Rainwater collection 0.88% 18 Water storage 0.86% 18 Canada Piping/leakage 7.04% 6 Control of watering 4.41% 5 Surface water collection 4.08% 7 Switzerland Sanitation 4.21% 8 Drip irrigation 3.90% 7 Water efficiency power 3.60% 6 China Sanitation 7.76% 4 Crops 6.66% 3 Drip irrigation 5.85% 6 Germany Piping/leakage 22.07% 2 Surface water collection 19.97% 2 Water efficiency domestic 19.16% 2 Spain Greywater 7.48% 5 Crops 3.46% 7 Desalination 3.28% 9 France Greywater 11.21% 2 Water efficiency power 7.19% 5 Piping/leakage 7.04% 4 UK Rainwater collection 10.13% 4 Water efficiency power 8.64% 4 Greywater 7.48% 6 Israel Drip irrigation 10.92% 2 Control of watering 4.22% 6 Desalination 3.36% 8 India Crops 3.22% 9 Water efficiency power 0.93% 9 Water storage 0.86% 17 Italy Control of watering 7.10% 3 Water efficiency domestic 4.45% 7 Drip irrigation 3.12% 11 Japan Piping/leakage 26.29% 1 Water storage 17.48% 2 Desalination 15.86% 2 Korea Water storage 8.63% 5 Sanitation 7.37% 5 Drip irrigation 5.85% 5
ENV/WKP(2015)3
20
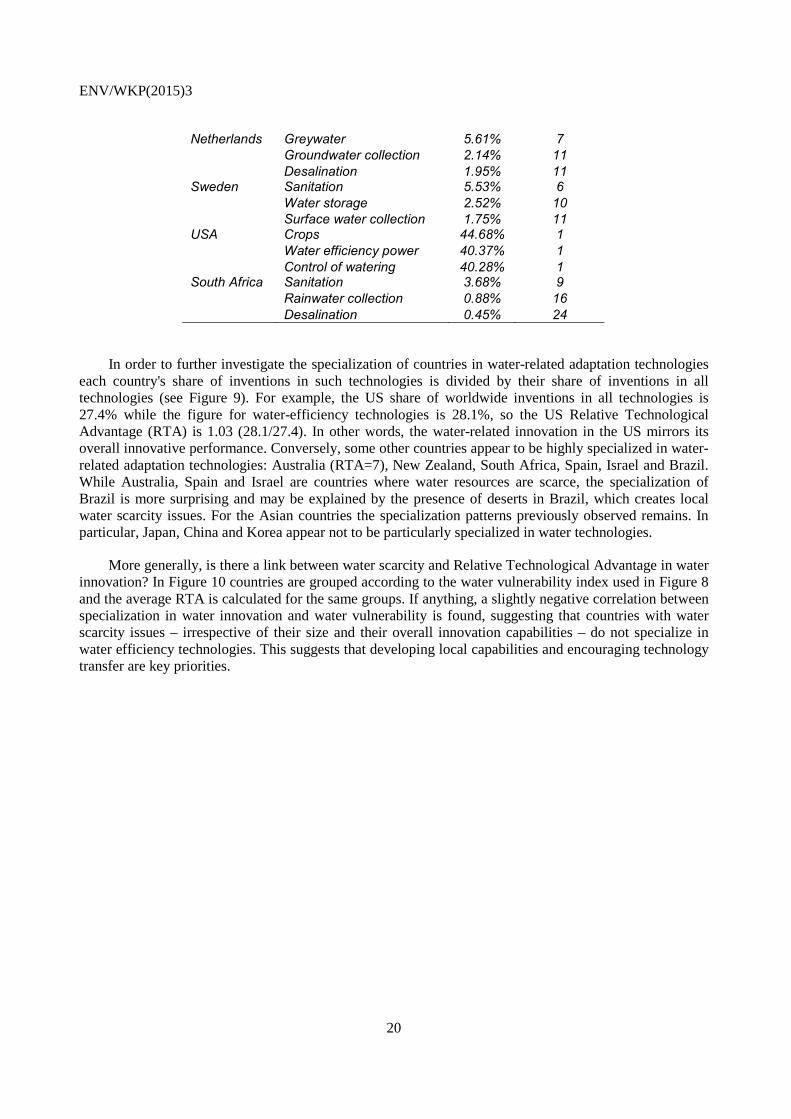
Netherlands Greywater 5.61% 7 Groundwater collection 2.14% 11 Desalination 1.95% 11 Sweden Sanitation 5.53% 6 Water storage 2.52% 10 Surface water collection 1.75% 11 USA Crops 44.68% 1 Water efficiency power 40.37% 1 Control of watering 40.28% 1 South Africa Sanitation 3.68% 9 Rainwater collection 0.88% 16 Desalination 0.45% 24
In order to further investigate the specialization of countries in water-related adaptation technologies each country's share of inventions in such technologies is divided by their share of inventions in all technologies (see Figure 9). For example, the US share of worldwide inventions in all technologies is 27.4% while the figure for water-efficiency technologies is 28.1%, so the US Relative Technological Advantage (RTA) is 1.03 (28.1/27.4). In other words, the water-related innovation in the US mirrors its overall innovative performance. Conversely, some other countries appear to be highly specialized in water-related adaptation technologies: Australia (RTA=7), New Zealand, South Africa, Spain, Israel and Brazil. While Australia, Spain and Israel are countries where water resources are scarce, the specialization of Brazil is more surprising and may be explained by the presence of deserts in Brazil, which creates local water scarcity issues. For the Asian countries the specialization patterns previously observed remains. In particular, Japan, China and Korea appear not to be particularly specialized in water technologies.
More generally, is there a link between water scarcity and Relative Technological Advantage in water innovation? In Figure 10 countries are grouped according to the water vulnerability index used in Figure 8 and the average RTA is calculated for the same groups. If anything, a slightly negative correlation between specialization in water innovation and water vulnerability is found, suggesting that countries with water scarcity issues – irrespective of their size and their overall innovation capabilities – do not specialize in water efficiency technologies. This suggests that developing local capabilities and encouraging technology transfer are key priorities.

ENV/WKP(2015)3
21
Figure 9. Relative Technological Advantage (2000-2010)
Figure 10. Relative Technological Advantage and water vulnerability
What has been the recent evolution of innovative activity at country level? Figure 11 shows the growth rate of innovation between the period 1990-2000 and 2000-2010 for the same 25 countries shown in Figures 6 and 8.11 Once again a distinction is drawn between high-value inventions and all inventions.
11 The exact numbers are available in Annex 4.
0 1 2 3 4 5 6 7Relative Technological Advantage 2000-2010
FinlandNorway
South AfricaIndia
BelgiumBrazil
DenmarkNew Zealand
AustriaChinese Taipei
SwedenNetherlandsSwitzerland
IsraelItaly
SpainChina
S KoreaCanadaFrance
UKAustralia
JapanGermany
USA
High-value inventions All (water-related) inventions

ENV/WKP(2015)3
22
Because innovation in all technologies has increased in most countries, the growth in water-related innovation could simply reflect a general increase in innovation activity. In order to control for this, the growth rate in water technologies is divided through by the growth rate in all technologies. Figure 11 thus effectively presents the growth rate in the Relative Technology Advantage.
The findings from Figure 11 are very interesting. For example, China's water innovation has increased twelvefold between the two time periods, but when compared with the general growth rate of innovation in China, it appears that China's contribution to the world's water-efficiency innovation activity has actually decreased by 34%. Brazil, South Africa and India stand out as having strongly increased their relative technological advantage during the last ten years in terms of patents, although in the cases of India and Brazil, this is only reflected in high-value patents.
Figure 11. Growth of water innovation by inventor country relative to growth in total innovation
-50% 0 +50% +100% +200%Relative growth rate of innovation
FinlandChinese Taipei
IsraelSwedenAustriaChina
S KoreaNorway
GermanyJapan
SwitzerlandUK
New ZealandUSAItaly
NetherlandsAustraliaCanada
SpainFrance
DenmarkBelgium
IndiaBrazil
South Africa
High-value inventions All (water-related) inventions

ENV/WKP(2015)3
23
4. Technology markets
In Section 3 the countries in which new inventions are developed was identified. In this section data is presented on where these inventions are protected through the local intellectual property system. Since protection is costly both in terms of financial costs and in terms of information revelation, this serves as a proxy for the existence (or at least expectation of the existence) of a market for the protected technologies.
4.1 Patent filings by technological field
The 28,443 inventions developed between 1990 and 2010 in water-related adaptation technologies have resulted in 53,230 individual patent applications (see Figure 12.) This means that each invention has been filed in 1.87 patent offices on average. This is slightly more than the average for non-water technologies (1.63), suggesting that water technologies might have wider application and/or be of higher value than the average technology.
However, significant variation is found between technologies in their average geographic extension. Technologies on the demand-side are filed in 2.16 countries on average, while technologies on the supply-side are only protected in 1.55 countries. Most storage patents are filed in a single country, while drought-resistant crops are protected in almost four patent offices. This reflects different patenting strategies: for example, drought-resistant crops patent applications are mainly filed by large companies, such as BASF, Monsanto and Bayer, who have access to global markets and can afford multiple filings (see also Agrawala et al., 2012).
Figure 12. Patent filings by technology and family size
Trends over time are presented in Figure 13. Over the period 1990-2010 water-related technologies have consistently been protected in more patent offices than the average technology, and the gap has been
0 0.5 1 1.5 2 2.5 3 3.5 4
Sanitation
Control of watering
Piping/leakage
Greywater
Water efficiency domestic
Water efficiency power
Crops
Demand
Drip irrigation
Storage
Rainwater collection
Surface collection
Underground collection
Desalination
Supply
All water
All technologies (benchmark)
Average Number of Offices Per Invention

ENV/WKP(2015)3
24
increasing during the 2000s. The average family size has grown from about 1.6 patent offices in 1990 to around 2 offices in 2008. This increase has concerned both demand-side and supply-side technologies.
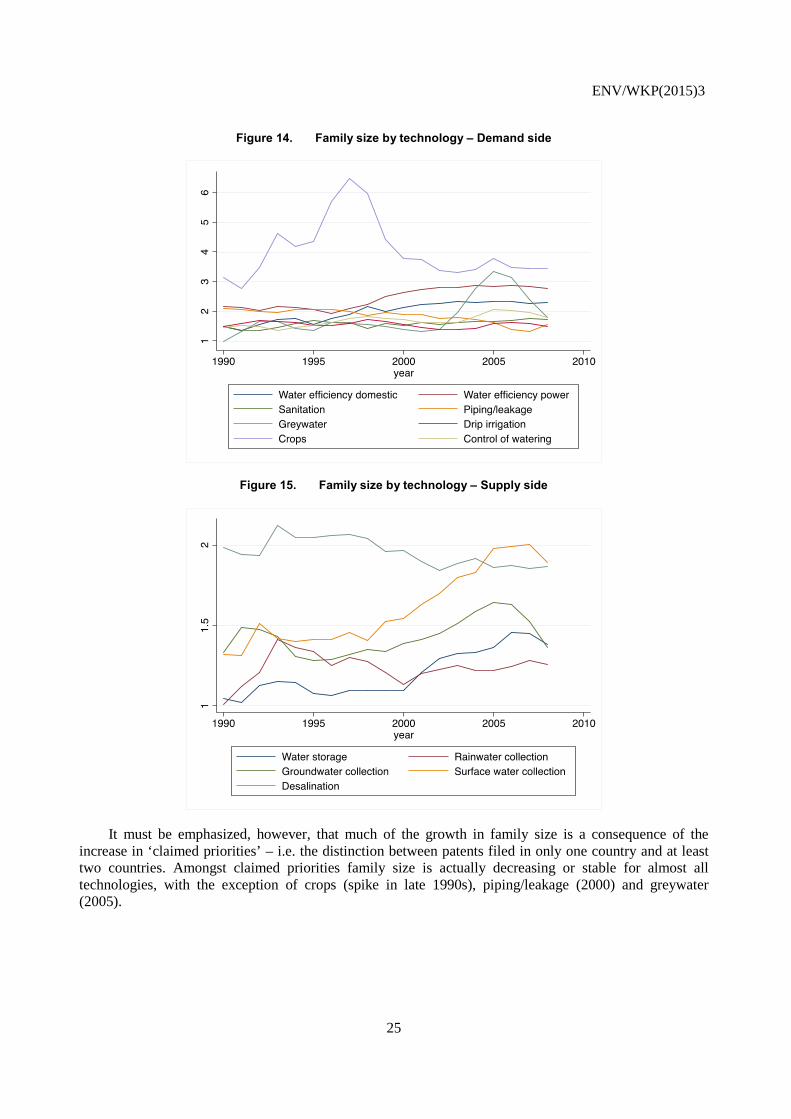
When looking at technologies individually (Figures 14 and 15), drought-resistant crops appear as a clear outlier. There was a peak in this field at the end of the 1990s when inventions were filed in up to 6 patent offices on average. Greywater use has also experienced a recent surge in geographical coverage, although to a lesser extent. The international extension of most other demand-side technologies has remained flat across time. As for supply side technologies, markets have recently expanded for surface water collection and underground collection. Interestingly, the market for desalination inventions appears remarkably stable across time, although innovative activity in this field is growing, particularly due to growth of patents filed only in China (see section 3).
Figure 13. Family size
ENV/WKP(2015)3
25
Figure 14. Family size by technology – Demand side
Figure 15. Family size by technology – Supply side
It must be emphasized, however, that much of the growth in family size is a consequence of the increase in ‘claimed priorities’ – i.e. the distinction between patents filed in only one country and at least two countries. Amongst claimed priorities family size is actually decreasing or stable for almost all technologies, with the exception of crops (spike in late 1990s), piping/leakage (2000) and greywater (2005).

ENV/WKP(2015)3
26
4.2 Main patent offices
Where have water technologies most commonly been patented? Figure 16 presents the number of patents filed between 2000 and 2010 in the major patent offices. Patents filed in Europe are aggregated into a single category. Not surprisingly, Japan, Europe and the US are the three main markets for water-related technologies. They are followed by China, Korea and Australia. Brazil and Mexico also belong to the top 10 patent offices.
Figure 17 decomposes the European Union. With Germany, UK and France as the top three inventors, the numbers broadly reflect the usual distribution of patents across European markets. However, Spain enjoys an unusually high position, suggesting this country is an important market for water-efficiency technologies in Europe.
Figure 16. Number of Patents Protected at Main IP Offices
Note: “EU” denotes patents filed either at the EPO (regional office) or at any national patent office in Europe.
Figure 17. Number of Patents Protected at National European Patent Offices

ENV/WKP(2015)3
27
How important is the market for water-related adaptation technologies in the country(ies) over which each patent office has jurisdiction? In Figure 18 a specialization index is presented. This is calculated as the ratio between the share of patents in each office and the global share of patents in the field, referred to as the Relative Propensity to Patent (RPP). A value greater than one indicates that a country is an important market for water technologies relative to other technologies. Interestingly, the most water-stressed countries are not always the countries where water technologies are most heavily patented. While Australia, Morocco and Israel are – unsurprisingly – significant markets for water technologies, so is Switzerland, Canada and Brazil, which have large water resources. This suggests that water conservation policies play a role in driving the diffusion of water-saving technologies. Disaggregating the data by technology, Switzerland receives a relatively high number of patents in surface water collection and energy efficiency in power production. Brazil and Canada are important recipient countries for drought-resistant crops, control of watering and domestic water efficiency. Many greywater patents have also been filed at the Canadian IP office.
Figure 18. Relative preponderance of water-related adaptation patents by office
In order to understand whether this specialization is caused by local innovators reacting to foreign demand, the specialization index is recalculated focusing only on those patents filed by foreign inventors. These patents, "transferred" by inventors to foreign offices, are more likely to be explained by the local market, rather than by locally-developed inventions which might first be patented locally but which are primarily driven by foreign market conditions. The patent "transfer" specialization index for water technologies is shown in Figure 19. Interestingly, the numbers change only slightly. Europe appears to be less specialized using this measure, suggesting that European inventors are developing many water technologies to serve foreign markets. However, we find that countries such as Canada, Brazil and Switzerland are still specialized in water technologies using this measure.
0 1 2 3 4RPP 2000-2010
Chinese TaipeiSingapore
JapanUSA
S KoreaChina
RussiaNorway
European Patent OfficeArgentina
IsraelSouth Africa
MexicoBrazil
CanadaIndia
New ZealandAustraliaMorocco
Switzerland

ENV/WKP(2015)3
28
Figure 19. Specialization in water patent "transfers" by office
Note: transfers are patents filed by foreign inventors
Do water-stressed regions receive particularly high volumes of water-related patents? In Figure 20
presents the relative propensity to patent across country groupings based on their water vulnerability index. No particular pattern emerges from this Figure suggesting that the diffusion of water-efficiency technologies is not particularly directed to countries exposed to water scarcity.
Figure 20. Relative preponderance of water-related patents and water vulnerability
What has been the recent evolution of patenting activity at the various IP offices? Table 5 presents the growth of patent applications between the period 1990-2000 and 2000-2010 for the same offices. The highest growth rates of patent applications can be found in fast-growing economies, including China,
0 2 4 6RPP 2000-2010
Chinese TaipeiJapan
SingaporeS Korea
USAHong Kong
ChinaArgentina
European Patent OfficeRussia
IsraelBrazil
NorwaySouth Africa
MexicoCanada
AustraliaNew Zealand
MoroccoSwitzerland

ENV/WKP(2015)3
29
Mexico and Korea. As this could reflect the general increase in patenting activity in these countries, in column (3) the growth rate in water technologies is divided through by the growth rate in all technologies at the same patent office. Korea stands out as the country in which the market for water-related technologies has grown the most during the last 10 years, both in absolute terms and relative to other technologies. South Africa, India, Mexico and Australia are other markets where water technologies represent an increasing share of patent filings.
What is more surprising, though, is that in countries with no particular water issues such as in Switzerland or Norway the market for water technologies also grew a lot. Several factors might be at play. For example, it may reflect the stringency of policies aimed at reducing water use, such as the Federal Law on the Protection of Water adopted by Switzerland in 1991, which resulted in a decrease in water use in Switzerland (including industrial, commerce and agricultural use) from over 500 litres per person per day in 1981 to around 350 litres today, despite the fact that the country has large water resources, with an estimated six percent of Europe’s total freshwater stock (but only 1% of the population). Yet other explanations are possible, especially given that Switzerland is the homeland of a number of industries active in the water sector (incl. food and beverage, pharmaceuticals and chemicals).
Table 5. Growth of water patents by patent office
Patent office Growth in water patents Relative growth in water
patents in comparison with all patents
Japan -2.98% -1.17%
Europe 224.57% -4.60%
USA 57.64% -18.03%
China 461.49% -7.32%
Korea 691.46% 183.34%
Australia 54.91% 45.29%
Canada 60.13% 43.49%
Russia -4.18% -23.74%
Brazil 23.18% 5.32%
Mexico 333.33% 40.97%
Israel -13.30% -27.02%
New Zealand 22.35% 42.95%
South Africa 26.19% 60.52%
Chinese Taipei 120.00% -20.33%
Argentina 307.69% 45.35%
Switzerland 137.25% 86.78%
Norway 18.37% 39.90%
Morocco -24.39% -49.96%
Singapore 58.82% -58.45%
India -48.94% 49.44%

ENV/WKP(2015)3
30
5. International technology diffusion
5.1. Cross-border patent transfers
International technology transfer represents significant options for climate change adaptation. Proxy data on international technology transfer, as reflected in cross-border patenting are now presented. This is defined as patent applications filed by an inventor residing in a country that is different from the one in which protection is sought (e.g., a patent filed in the United States by an inventor working in Germany12). Using patents to measure technology transfer has been used increasingly in recent years (Dechezleprêtre et al., 2011; Dechezleprêtre et al., 2012; Haščič and Johnstone 2011; Johnstone and Haščič 2011) following early works by Eaton and Kortum (1996, 1999) and Lanjouw and Mody (1996).13
The proportion of patents filed by inventors residing in a country which differs from the office of protection between 1990 and 2008 is shown in Figure 21.14 The data indicate that this proportion has been consistently higher for water-related adaptation technologies (except for the last two years of the sample) than for the average patented technology. However, there are important differences between supply-side and demand-side technologies. Demand-side technologies are significantly more likely to be transferred abroad than supply-side technologies. A possible explanation for this result is that supply-side technologies are more tailored to local conditions, restricting international market opportunities. Another explanation could be that demand-side and supply-side technologies target two separate markets, with different market structures, and this can explain the different performance regarding patenting (see e.g. OECD 2011d for a discussion of market structure vis-à-vis innovation activity). Typically, demand-side technologies target markets for buildings equipment and consumer products, and this may explain why such inventions tend to be patented in a larger number of countries (see also Section 4.1 above).
The data also show that the share of water-related patents filed abroad decreased recently, from around 50% in 2004 to 42% in 2008. This is in contrast with international technology transfers in general, which have remained stable over the same period. The reason for this finding is the recent increase in water-related innovation activity in countries that rarely seek protection for their inventions abroad (such as China).
What are the origins and destinations of these transfers? Table 6 presents the distribution of water-related technology flows between OECD countries, emerging economies15 and other countries from 2000 to 2010. Over these years, nearly 15,000 patented inventions sought protection abroad. Not surprisingly, technology is exchanged mostly between OECD countries (79 percent of all transfers), while transfers between developing countries are almost nonexistent (less than 1 percent of total transfers). Transfers from OECD countries to emerging economies are much more frequent than transfers from emerging economies to OECD countries.
12 We use information on the inventor’s country of residence, irrespective of his nationality, to determine where
inventions are developed. 13 For a methodological discussion see Annex A in OECD (2011) Invention and Transfer of Environmental
Technologies (Paris, OECD). 14 Note that in this case we use a cut-off data of 2008 since there is a lag of between 18 and 36 months in which
‘duplicate’ filings can be posted. 15 Emerging countries include Argentina, Brazil, China, Colombia, Egypt, Indonesia, India, Morocco, Malaysia, Peru,
Philippines, Pakistan, Thailand, Chinese Taipei and South Africa

ENV/WKP(2015)3
31
In order to put these numbers into perspective, Table 7 displays the share of patent transfers for all technologies. Comparing Tables 6 and 7, it can be seen that technology flows from OECD to emerging countries are significantly less frequent for water-related technologies than for other technologies.
Figure 21. Rate of foreign transfer of inventions
Table 6. International transfers of water-related adaptation technologies
Destination OECD Emerging Other Origin
OECD 11634 1731 375 (78.83%) (11.73%) (2.54%)
Emerging 593 35 19 (4.02%) (0.24%) (0.13%)
Other 269 57 48 (1.82%) (0.38%) (0.32%)
Table 7. International transfers of all patented technologies (benchmark)
Destination OECD Emerging Other Origin
OECD 75.37% 15.27% 2.54% Emerging 4.86% 0.47% 0.11% Other 0.98% 0.24% 0.17%
Tables 8 and 9 disaggregate the information further. The data is aggregated in terms of inventors from
two country groups (Europe and North America) and those from the other major players in water-related patenting activity: Australia, Brazil, China, India, Israel, Japan, Korea and South Africa. In Table 8 the rows sum to 100%, and as such the cells indicate the % of inventions from a given country (row heading) that are transferred to a given market (column heading). The final column measures the standard deviation, with a lower number indicating that the destination of a given country’s inventions is widely

ENV/WKP(2015)3
32
dispersed across different regions. On this basis South African-invented water inventions are diffused most widely. India (and “other”) are in the opposite situation.
In the second table just below (Table 9) the columns sum to 100% and thus the cells indicate the % of inventions in a given market (column heading) that come from a given country (row heading). On this basis the Chinese, Korean and North American markets draw upon the widest distribution of foreign-invented technologies, while Japan and Brazil (to a lesser extent) have a very narrow set of origin countries.

ENV/WKP(2015)3
33
Table 8. International patent transfers (% of inventions from a given country that are transferred to a given market)
Destination Australia Brazil China EU Israel Japan Korea North America
South Africa
other SD Origin Australia 2% 14% 27% 1% 5% 1% 46% 4% 19% 0.154 Brazil 11% 11% 36% 0% 7% 0% 32% 4% 0% 0.137 China 14% 1% 19% 0% 4% 5% 55% 2% 7% 0.174 EU 11% 2% 13% 1% 12% 3% 56% 1% 14% 0.172 India 7% 0% 5% 28% 0% 3% 2% 55% 0% 4% 0.179 Israel 7% 1% 6% 31% 2% 3% 50% 1% 8% 0.171 Japan 6% 1% 16% 27% 0% 9% 42% 0% 4% 0.143 Korea 9% 1% 16% 20% 1% 14% 39% 0% 2% 0.127 North America 15% 3% 13% 44% 1% 19% 3% 1% 9% 0.136 South Africa 28% 7% 11% 17% 0% 7% 4% 26% 28% 0.110 Other 6% 1% 6% 51% 0% 3% 1% 31% 0% 0.180
Table 9. International patent transfers – (% of inventions in a given market that come from a given country)
Destination Australia Brazil China EU Israel Japan Korea North America
South Africa
other Origin Australia 3% 4% 3% 5% 1% 1% 5% 14% 8% Brazil 0% 0% 0% 0% 0% 0% 0% 1% 0% China 3% 1% 1% 0% 1% 2% 3% 3% 2% EU 27% 30% 28% 35% 27% 20% 47% 36% 41% India 1% 0% 0% 1% 0% 0% 1% 2% 0% 1% Israel 2% 1% 1% 3% 0% 2% 5% 2% 3% Japan 9% 4% 19% 13% 3% 35% 20% 1% 7% Korea 2% 1% 3% 2% 3% 3% 3% 0% 1% North America 49% 54% 38% 54% 51% 62% 34% 40% 37% South Africa 1% 1% 0% 0% 0% 0% 1% 0% 1% other 7% 4% 6% 22% 4% 3% 5% 13% 3% Standard Deviation (SD)
0.158 0.178 0.134 0.169 0.180 0.202 0.140 0.145 0.154 0.156

ENV/WKP(2015)3
34
5.2 International collaboration in technology development
Since patent applications include information on the country of residence of all inventors having worked on the invention, patent data can be used to investigate cross-border collaboration in technology development (see Haščič et al. 2012 for an example of possible applications of this measure.) As shown in Figure 22, 10% of water-related patents have been developed by inventors from at least two different countries. This rate of international coinvention is identical for non-water technologies. However, we find important discrepancies between technologies. Over 14% of demand-side technologies are co-invented, compared to only 5% for supply-side technologies. Interestingly, more than half of inventions in drought-resistant crops involve international collaboration.
Figure 22. Share of internationally-coinvented patents by technology
Table 10 displays the share of internationally co-invented patents by inventor country for water-related adaptation technologies (column 2) and for all technologies (column 3). With the noticeable exception of the three main inventor countries, inventions in the field involve less coinvention than the average invention. Among emerging economies, Indian inventors coinvent nearly 75% of their water inventions with inventors from other countries. On the other hand, Brazil and China have a much lower rate of international coinvention.
0% 10% 20% 30% 40% 50% 60%
Sanitation
Piping/leakage
Water efficiency domestic
Drip irrigation
Control of watering
Greywater
Water efficiency power
Crops
Demand
Rainwater collection
Storage
Surface collection
Underground collection
Desalination
Supply
All water
All technologies (benchmark)

ENV/WKP(2015)3
35
Table 10. Share of international coinvention by inventor country (high-value inventions)
Country Water technologies All technologies (benchmark)
USA 19.40% 27.49%
Germany 25.89% 25.80%
Japan 6.66% 5.22%
Australia 9.45% 33.38%
UK 17.86% 44.97%
France 18.01% 32.90%
Canada 33.33% 56.24%
Korea 13.50% 11.02%
China 26.42% 45.16%
Spain 23.15% 36.49%
Italy 20.00% 26.97%
Israel 47.29% 53.31%
Switzerland 51.44% 70.58%
Netherlands 38.27% 74.53%
Sweden 22.22% 41.99%
Chinese Taipei 28.89% 32.69%
Austria 33.33% 46.26%
New Zealand 21.74% 40.43%
Denmark 32.43% 51.68%
Brazil 14.29% 39.58%
Belgium 73.02% 77.03%
India 73.68% 77.35%
South Africa 29.17% 34.26%
Norway 31.11% 43.35%
Finland 5.00% 36.34%
Which countries are most likely to collaborate with each other? Not surprisingly, as shown in Table 11, two out of three joint inventions in water technologies are developed by inventors from two or more OECD countries. One other result stands out. When comparing coinvention in water technologies with coinvention in other technologies, we find that inventors from OECD countries are significantly less likely to collaborate with inventors from emerging economies relative to the general rate of collaboration for all technologies. We also find than inventors from emerging economies are somewhat less likely to collaborate in the area of water innovation with inventors from other emerging economies relative to other fields.

ENV/WKP(2015)3
36
Table 11. International coinventions by country grouping
Collaborating countries Water technologies Other technologies (benchmark)
OECD-OECD 873 67.62% (73.24%)
Emerging-Emerging 6 4.20% (0.50%)
Other-Other 12 0.80% (1.01%)
OECD-Emerging 178 18.18% (14.93%)
OECD-Other 106 7.58% (8.89%)
Emerging -Other 17 1.63% (1.43%)
In Table 12 a closer examination of the major international collaboration relationships is presented. In particular high collaboration intensity (relatively to the benchmark) is observed between Germany and Switzerland, US and Israel, US and Turkey, US and Belgium, Germany and UK. Not surprisingly, the US has been involved in 17 of the 25 most productive technology development relationships between 2000 and 2010. Interestingly, however, US inventors collaborate not only with inventors from other rich countries, such as Canada, but also with inventors from developing countries, most notably India, with which our data indicates that 54 inventions were jointly developed, and Pakistan. Table 12 also reveals some interesting relationships, such as Turkey and Pakistan.

ENV/WKP(2015)3
37
Table 12. Major international technology development collaboration relationships
Country 1 Country 2 Number of water technology development collaborations
Switzerland Germany 79
Canada USA 76
Germany USA 71
India USA 54
Israel USA 53
UK USA 38
Japan USA 36
France USA 32
China USA 29
Turkey USA 25
Belgium USA 24
Germany UK 22
Switzerland USA 22
Spain USA 19
Korea USA 19
Italy USA 17
Netherlands USA 17
Belgium France 16
Russia USA 16
Belgium Germany 15
Germany France 14
Germany Netherlands 13
Switzerland France 13
Pakistan USA 12
Pakistan Turkey 12

ENV/WKP(2015)3
38
5.3 International knowledge flows
In order to analyse international knowledge flows, data related to patent citations is useful. Patent documents offer a paper trail of knowledge flows, as inventors are required to reference previous patents that have been used to develop the new technology described in the patent. It is therefore not surprising that patent data have been widely used in empirical studies of knowledge spillovers16 (see, for example, Jaffe, Fogarty and Bank, 1998; Trajtenberg, 1990; Cabellero and Jaffe, 1993; Jaffe and Trajtenberg, 1996 and 1998). Since we are mostly interested in international flows of knowledge we focus on cross-border citations – for example, a citation made by an inventor working in Germany to a patent developed in Japan.
The distribution of knowledge flows as evidenced by patent citations is even less evenly distributed than the distribution of technology flows. Over 93% of cross-border flows of knowledge in water technologies happen between OECD countries. The predominance of knowledge diffusion between developed countries is not specific to water technologies, however.17 Table 13 provides a summary of the geography of knowledge flows in water-related technologies when compared to knowledge flows in other technologies. Significantly more knowledge is flowing from OECD countries to less developed countries. Knowledge flows between less developed countries are also significantly larger, and perhaps even more interestingly, knowledge flows from less developed countries to OECD countries also seem to be particularly important, suggesting water efficiency is a domain where the North is learning from the South.
Table 13. International knowledge flows for water technologies compared to all technologies
Destination OECD Emerging Other Origin
OECD = - ++
Emerging - - =
Other + = ++
Focusing on knowledge flows arising from documents from inventors/authors in emerging economies we see interesting differences (Figure 23). For example, Brazilian and Indian documents are much more likely to be cited in North America than is the case for the other emerging economies. Chinese documents are much more likely to be cited in Europe. South African documents have a higher percentage of citations in Australia.
16 The limitations of patent data have been discussed at length in the literature and are now well understood (see
OECD 2009 for a review). Since not all inventions are patented (Trajtenberg, 2001), patent citations underestimate the actual extent of knowledge spillovers, but are considered as a good indicator of knowledge flows. An important issue is that some citations do not represent true knowledge flows, in particular self-citations (citations made to a patent by the same inventor) and citations added by the patent examiner. However, our data allows us to identify both self-citations and citations added by patent examiners, and to focus on citations that most probably correspond to true flows of knowledge.
17 This is also partly driven by patent citation data being mostly available from patent offices located in OECD countries.

ENV/WKP(2015)3
39
Figure 23. Share of internationally coinvented patents by technology

ENV/WKP(2015)3
40
6. Conclusion
In this paper the first descriptive analysis of innovation activity in water-related adaptation technologies is presented. Our analysis is based on a unique data set comprising over 50,000 patents filed in 83 patent offices between 1990 and 2010. The analysis covers technologies aimed at increasing the supply of water (e.g. desalination, water storage, pumping) and technologies whose objective is to reduce water consumption (domestic and industrial water efficiency, greywater use, drought-resistant crops, drip irrigation, etc). These represent most of the technological adaptation options identified in the last IPCC report (IPCC, 2007).
Innovation activity in water-related technologies has been growing steadily over the last two decades. However, this growth has mostly concerned innovation in supply-side technologies, suggesting that public policies have so far given priority to expanding water availability rather than reducing consumption by means of water-efficiency measures. Yet, differences in underlying characteristics of water demand versus water supply management (market structure, propensity to patent, reliance on technological solutions) might too help explain the observed differences in patenting trends. However, available simulations clearly indicate that the challenges posed by water scarcity in the face of a growing population and climate change cannot be solved solely by increasing water pumping and resorting to desalination, a highly energy-intensive technology.
More innovation on the demand-side is needed, and the results suggest that water conservation policies have not been able to strongly incentivize innovation thus far. However, some countries with large water resources, such as Switzerland or Norway, nevertheless appear as significant markets for water-efficiency technologies. Further research is needed to understand to what extent pro-active water conservation policies, and other factors, might have played a role in encouraging the development and diffusion of water-saving technologies in these countries.
Another important result from the study is the vast majority of innovation in water-related technologies is developed in countries with low or moderate vulnerability towards water scarcity. With the exception of Australia, Spain and Israel, countries with severe water issues do not appear to specialize in water-related technologies.

ENV/WKP(2015)3
41
REFERENCES
Agrawala, S., et al. (2012), “Adaptation and Innovation: An Analysis of Crop Biotechnology Patent Data”, OECD Environment Working Papers, No. 40, OECD Publishing, Paris. DOI: http://dx.doi.org/10.1787/5k9csvvntt8p-en.
Convery, F. (2013), “Reflections—Shaping Water Policy: What Does Economics Have to Offer?” Review of Environmental Economics and Policy, 7(1): 156–174. http://dx.doi.org/10.1093/reep/res017.
Dechezleprêtre, A., M. Glachant, I. Haščič, N. Johnstone, and Y. Ménière (2011), “Invention and transfer of climate change-mitigation technologies: A global analysis”, Review of Environmental Economics and Policy, 5(1): 109-130. http://dx.doi.org/10.1093/reep/req023.
Eco Innovation Observatory (EIO) (2011), “Water Innovation. How eco-innovation can contribute to the sustainability of Europe's water resources”, EIO Thematic Report. http://www.eco-innovation.eu/media/EIO_Thematic_Report_Water_May_2011.pdf.
Haščič, I., N. Johnstone and N. Kahrobaie (2012), “International Technology Agreements for Climate Change: Analysis Based on Coinvention Data”. OECD Environment Working Papers, No. 42, OECD Publishing, Paris. DOI: http://dx.doi.org/10.1787/5k9fgpw5tt9s-en.
Haščič, I. and N. Johnstone (2011), “The Clean Development Mechanism and international technology transfer: Empirical evidence on wind power”, Climate Policy, 2011, 11(6): 1303-1314. http://www.tandfonline.com/doi/abs/10.1080/14693062.2011.579311#.VIb_mPnF9u0.
Johnstone, N. and I. Haščič (2011), “Environmental policy design and the fragmentation of international markets for innovation”. In Ghosal, Vivek (editor) (2011), Reforming Rules and Regulations: Laws, Institutions and Implementation, Chapter 4, pp. 79-103, Cambridge, Mass.: MIT Press.
Krozer, Y., Hophmayer-Tokich, S., van Meerendonk, H., Tijsma S., Vos, E. (2010), “Innovations in the water chain – experiences in The Netherlands”, Journal of Cleaner Production, 18 (5):439–446. http://dx.doi.org/10.1016/j.jclepro.2009.11.013.
Lanjouw, J.O. and A. Mody (1996), “Innovation and the international diffusion of environmentally responsive technology”, Research Policy, 25(4):549-571. http://dx.doi.org/10.1016/0048-7333(95)00853-5.
OECD (2012a), Environmental Outlook to 2050: The Consequences of Inaction, OECD Publishing, Paris. DOI: http://dx.doi.org/10.1787/9789264122246-en.
OECD (2012b), Meeting the Water Reform Challenge, OECD Studies on Water, OECD Publishing, Paris. DOI: http://dx.doi.org/10.1787/9789264170001-en.
OECD (2012c), Energy and Climate Policy: Bending the Technological Trajectory, OECD Studies on Environmental Innovatio, OECD Publishing, Paris. DOI: http://dx.doi.org/10.1787/9789264174573-en.
OECD (2011a). Invention and Transfer of Environmental Technologies, OECD Studies on Environmental Innovation, OECD Publishing, Paris. DOI: http://dx.doi.org/10.1787/9789264115620-en.

ENV/WKP(2015)3
42
OECD (2011b), “Policies to Support Eco-innovation in Israel”, Free document, Environment Directorate, OECD. http://www.oecd.org/israel/48354947.pdf.
OECD (2011c), “Eco-innovation policies in South Africa”, Free document, Environment Directorate, OECD.
OECD (2011d), Better Policies to Support Eco-innovation, OECD Studies on Environmental Innovation, OECD Publishing, Paris. DOI: http://dx.doi.org/10.1787/9789264096684-en.
OECD (2010), Pricing Water Resources and Water Sanitation Services, OECD Studies on Water, OECD Publishing, Paris. DOI: http://dx.doi.org/10.1787/9789264083608-en.
OECD (2009), OECD Patent Statistics Manual, OECD Publishing, Paris. DOI: http://dx.doi.org/10.1787/9789264056442-en.
OECD (2003), Improving Water Management: Recent OECD Experience. OECD Publishing, Paris. DOI: http://dx.doi.org/10.1787/9789264099500-en.
Olmstead, S. M. (2010), “The economics of managing scarce water resources”, Review of Environmental Economics and Policy, 4(2):179–98. http://dx.doi.org/10.1093/reep/req004.
Partzsch, L. (2009), “Smart regulation for water innovation – the case of decentralized rainwater technology”, Journal of Cleaner Production, 17:985–991. http://dx.doi.org/10.1016/j.jclepro.2009.01.009.
Pigram, J. J. (1993), “Property rights and water markets in Australia: An evolutionary process toward institutional reform”, Water Resources Research, 29(4): 1313–19. http://dx.doi.org/10.1029/92WR02909.
Popp, D (2011), “International technology transfer, climate change, and the clean development mechanism”, Review of Environmental Economics and Policy, 5:131-152. http://dx.doi.org/10.1093/reep/req018.
Popp, D. (2006), “International innovation and diffusion of air pollution control technologies: The effects of NOX and SO2 regulation in the US, Japan, and Germany”, Journal of Environmental Economics and Management, 51:46-71. http://dx.doi.org/10.1016/j.jeem.2005.04.006.
Purohit, P. and Kandpal, T.C. (2005), “Renewable energy technologies for irrigation water pumping in India: projected levels of dissemination, energy delivery and investment requirements using available diffusion models”, Renewable and Sustainable Energy Reviews, 9: 592–607. http://dx.doi.org/10.1016/j.rser.2004.07.002.
UNICEF, 2010. Progress on Sanitation and Drinking-water: 2010 Update. WHO/UNICEF Joint Monitoring Programme for Water Supply and Sanitation.
Verdolini, E. and M. Galeotti (2011), “At home and abroad: An empirical analysis of innovation and diffusion in energy technologies”, Journal of Environmental Economics and Management 61:119-134. http://dx.doi.org/10.1016/j.jeem.2010.08.004.

ENV/WKP(2015)3
43
ANNEX 1. PATENT CLASSIFICATION CODES
DEMAND-SIDE TECHNOLOGIES
1-Water efficiency – domestic
Self-closing valves Self-closing valves, i.e. closing automatically after operation, in which the closing movement, either retarded or not, starts immediately after opening F16K21/06-12
Self-closing valves, i.e. closing automatically after operation, closing after a predetermined quantity of fluid has been delivered
F16K 21/16-20
Aeration of water Arrangement or mounting of devices, e.g. valves, for venting or aerating or draining F16L 55/07 Jet regulators with aerating means E03C 1/084 2- Sanitation
Dual-flush toilets Flushing devices discharging variable quantities of water E03D 3/12 Flushing cisterns discharging variable quantities of water E03D 3/14 Dry toilets Urinals without flushing A47K 11/12 Dry closets A47K 11/02 Waterless or low-flush urinals; Accessories therefor E03D13/00E Closed-circuit toilets Special constructions of flushing devices with recirculation of bowl-cleaning fluid E03D5/016 3- Piping – reducing leakage & leakage monitoring
Pipe-line systems / Protection or supervision of installations / Preventing, monitoring, or locating loss
F17D 5/02 and E03
Devices for covering leaks in pipes or hoses, e.g. hose-menders F16L 55/16 and E03
Investigating fluid tightness of structures, by detecting the presence of fluid at the leakage point
[G01M 3/08 or G01M 3/14 or G01M 3/18 or G01M 3/22 or G01M 3/28 ] and E03
4- Water efficiency in power production
Combustion heat from one cycle heating the fluid in another cycle F01K 23/08-10 Non-positive-displacement machines or engines, e.g. steam turbines / Preventing or minimising internal leakage of working fluid, e.g. between stages F01D 11
5- Drip irrigation
Watering arrangements located above the soil which make use of perforated pipe-lines or pipe-lines with dispensing fittings, e.g. for drip irrigation A01G 25/02
Watering arrangements making use of perforated pipe-lines located in the soil A01G 25/06 6- Control of watering
Control of watering A01G 25/16 Mutation or genetic engineering; DNA or RNA concerning genetic engineering, vectors, e.g. plasmids, or their isolation, preparation or purification; for drought, cold, salt resistance
C12N15/82C8B2
8- Greywater Greywater supply systems E03B 1/04B

ENV/WKP(2015)3
44
SUPPLY-SIDE TECHNOLOGIES
1- Underground water collection
Use of pumping plants or installations E03B 5 Methods or installations for obtaining or collecting drinking water or tap water from underground E03B 3/06-26
2- Surface water collection
Methods or installations for drawing-off water E03B 9 Methods or installations for obtaining or collecting drinking water or tap water from surface water E03B 3/04; 28-38
3- Rainwater water collection
Methods or installations for obtaining or collecting drinking water or tap water from rain-water E03B 3/02
Special vessels for collecting or storing rain-water for use in the household, e.g. water-butts E03B 3/03
4- Storage
Arrangements or adaptations of tanks for water supply E03B 11 5- Desalination
Desalination of sea water An EPO tag

ENV/WKP(2015)3
45
ANNEX 2. TOP INVENTOR COUNTRIES
Rank Country
High-value inventions All inventions
Share of world's inventions
RTA Share of world's
inventions RTA
1 USA 28.14% 1.03 16.96% 1.12 2 Germany 12.24% 1.02 7.07% 1.23 3 Japan 10.52% 0.43 24.45% 0.67 4 Australia 6.79% 7.11 5.20% 5.72 5 UK 5.81% 1.52 3.10% 1.23 6 France 5.05% 1.25 3.60% 1.97 7 Canada 3.60% 2.09 1.99% 2.12 8 Korea 3.52% 0.53 10.35% 0.90 9 China 3.10% 0.96 11.95% 0.97
10 Spain 2.29% 3.43 1.45% 4.06 11 Italy 2.11% 1.01 0.89% 0.69 12 Israel 2.10% 3.26 0.86% 2.38 13 Switzerland 1.96% 1.84 0.94% 2.15 14 Netherlands 1.49% 1.19 0.73% 1.32 15 Sweden 1.14% 0.93 0.43% 0.87 16 Chinese Taipei 0.97% 0.34 0.93% 0.37 17 Austria 0.87% 1.13 0.39% 1.24 18 New Zealand 0.62% 3.83 0.26% 2.85 19 Denmark 0.59% 1.34 0.26% 1.39 20 Brazil 0.56% 2.93 1.08% 2.48 21 Belgium 0.55% 1.16 0.41% 1.89 22 India 0.54% 1.01 0.45% 1.65 23 South Africa 0.52% 3.80 0.25% 1.75 24 Norway 0.50% 1.86 0.26% 1.88 25 Finland 0.41% 0.58 0.14% 0.43
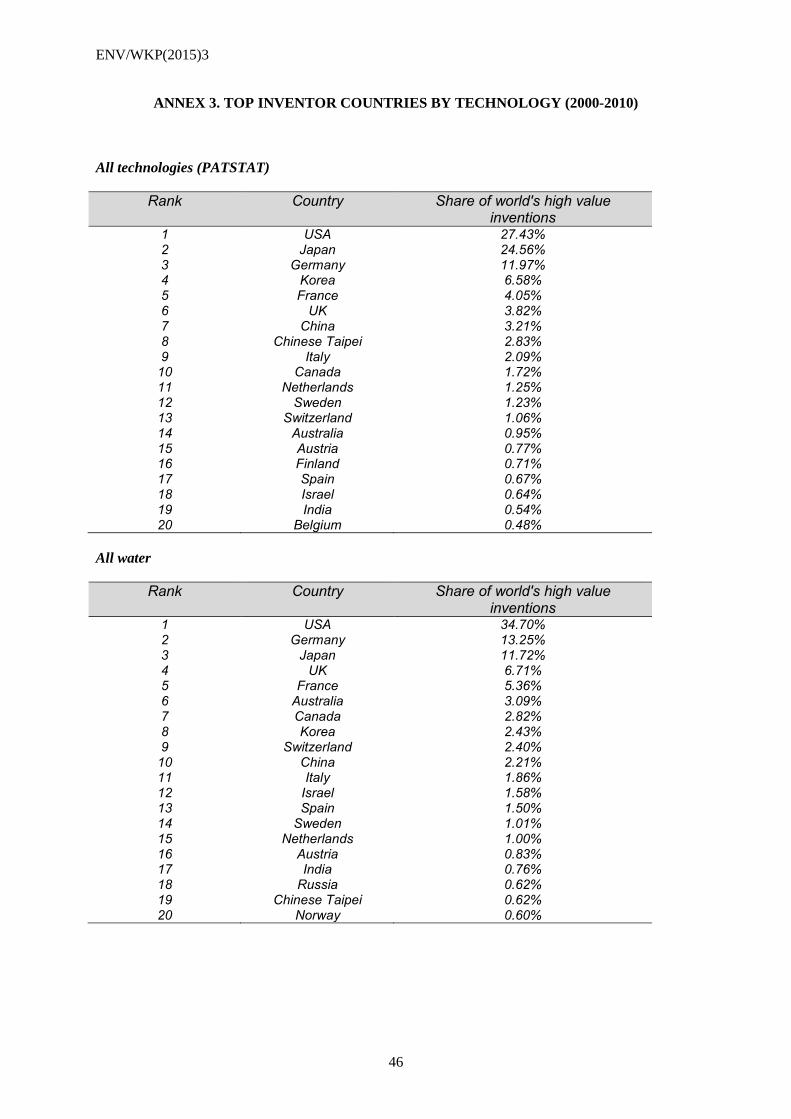
ENV/WKP(2015)3
46
ANNEX 3. TOP INVENTOR COUNTRIES BY TECHNOLOGY (2000-2010)
All technologies (PATSTAT)
Rank Country Share of world's high value inventions
1 USA 27.43% 2 Japan 24.56% 3 Germany 11.97% 4 Korea 6.58% 5 France 4.05% 6 UK 3.82% 7 China 3.21% 8 Chinese Taipei 2.83% 9 Italy 2.09% 10 Canada 1.72% 11 Netherlands 1.25% 12 Sweden 1.23% 13 Switzerland 1.06% 14 Australia 0.95% 15 Austria 0.77% 16 Finland 0.71% 17 Spain 0.67% 18 Israel 0.64% 19 India 0.54% 20 Belgium 0.48%
All water
Rank Country Share of world's high value inventions
1 USA 34.70% 2 Germany 13.25% 3 Japan 11.72% 4 UK 6.71% 5 France 5.36% 6 Australia 3.09% 7 Canada 2.82% 8 Korea 2.43% 9 Switzerland 2.40% 10 China 2.21% 11 Italy 1.86% 12 Israel 1.58% 13 Spain 1.50% 14 Sweden 1.01% 15 Netherlands 1.00% 16 Austria 0.83% 17 India 0.76% 18 Russia 0.62% 19 Chinese Taipei 0.62% 20 Norway 0.60%
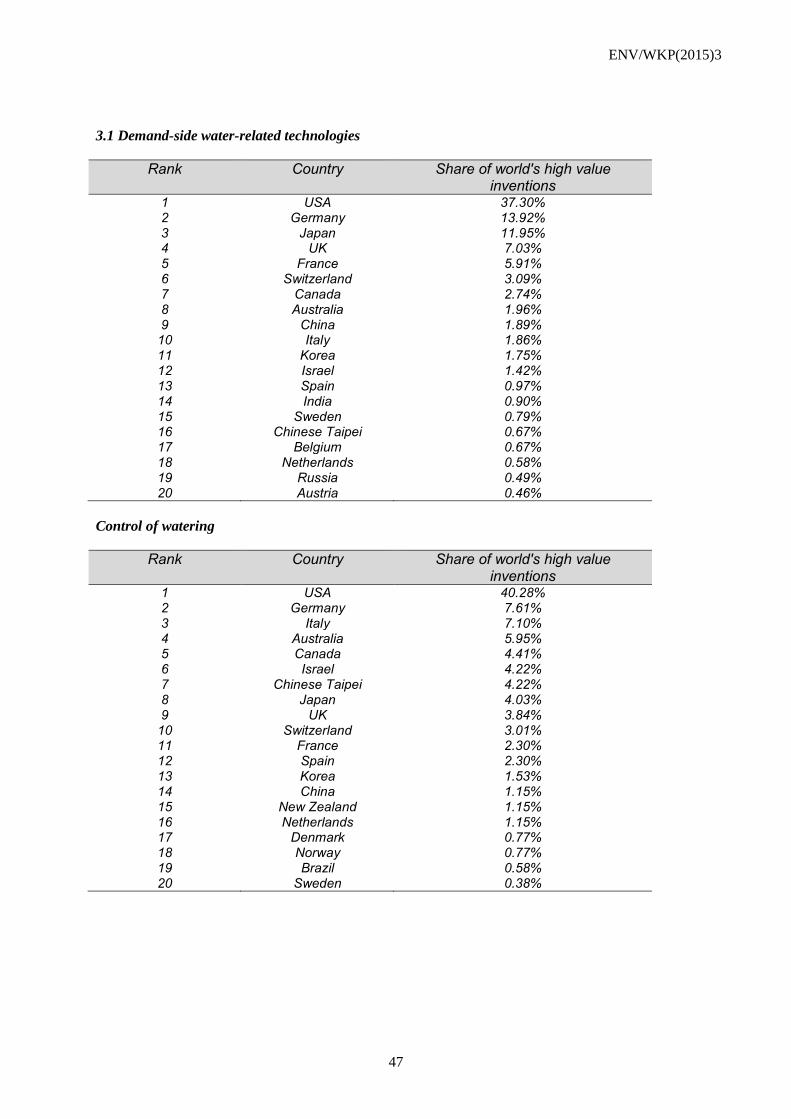
ENV/WKP(2015)3
47
3.1 Demand-side water-related technologies
Rank Country Share of world's high value inventions
1 USA 37.30% 2 Germany 13.92% 3 Japan 11.95% 4 UK 7.03% 5 France 5.91% 6 Switzerland 3.09% 7 Canada 2.74% 8 Australia 1.96% 9 China 1.89% 10 Italy 1.86% 11 Korea 1.75% 12 Israel 1.42% 13 Spain 0.97% 14 India 0.90% 15 Sweden 0.79% 16 Chinese Taipei 0.67% 17 Belgium 0.67% 18 Netherlands 0.58% 19 Russia 0.49% 20 Austria 0.46%
Control of watering
Rank Country Share of world's high value inventions
1 USA 40.28% 2 Germany 7.61% 3 Italy 7.10% 4 Australia 5.95% 5 Canada 4.41% 6 Israel 4.22% 7 Chinese Taipei 4.22% 8 Japan 4.03% 9 UK 3.84% 10 Switzerland 3.01% 11 France 2.30% 12 Spain 2.30% 13 Korea 1.53% 14 China 1.15% 15 New Zealand 1.15% 16 Netherlands 1.15% 17 Denmark 0.77% 18 Norway 0.77% 19 Brazil 0.58% 20 Sweden 0.38%

ENV/WKP(2015)3
48
Crops
Rank Country Share of world's high value inventions
1 USA 44.68% 2 Japan 9.01% 3 China 6.66% 4 Korea 4.50% 5 Germany 4.27% 6 Canada 3.81% 7 Spain 3.46% 8 Israel 3.24% 9 India 3.22% 10 France 2.83% 11 UK 2.59% 12 Belgium 2.47% 13 Australia 2.40% 14 Netherlands 1.24% 15 Italy 0.75% 16 Austria 0.71% 17 Switzerland 0.49% 18 Hungary 0.47% 19 Chinese Taipei 0.47% 20 Hong Kong 0.35%
Drip irrigation
Rank Country Share of world's high value inventions
1 USA 29.17% 2 Israel 10.92% 3 Japan 7.60% 4 Germany 7.41% 5 Korea 5.85% 6 China 5.85% 7 Switzerland 3.90% 8 Chinese Taipei 3.70% 9 Australia 3.51% 10 UK 3.12% 11 Italy 3.12% 12 Spain 2.73% 13 Canada 2.73% 14 France 1.75% 15 Greece 1.69% 16 Austria 1.17% 17 Sweden 0.78% 18 Mexico 0.78% 19 Brazil 0.58% 20 Belgium 0.39%

ENV/WKP(2015)3
49
Grey water
Rank Country Share of world's high value inventions
1 Australia 24.30% 2 France 11.21% 3 USA 9.35% 4 Germany 8.41% 5 Spain 7.48% 6 UK 7.48% 7 Netherlands 5.61% 8 Portugal 3.74% 9 Canada 3.74% 10 China 3.74% 11 Hungary 2.80% 12 Israel 1.87% 13 Switzerland 1.87% 14 Malaysia 1.87% 15 Brazil 1.87% 16 Saudi Arabia 0.93% 17 Japan 0.93% 18 Isle of Man 0.93% 19 Belgium 0.93% 20 Ireland 0.93%
Piping leakage
Rank Country Share of world's high value inventions
1 Japan 26.29% 2 Germany 22.07% 3 USA 20.03% 4 France 7.04% 5 UK 7.04% 6 Canada 7.04% 7 Korea 2.82% 8 Switzerland 0.94% 9 Finland 0.94% 10 Sweden 0.94% 11 China 0.94% 12 Austria 0.94% 13 Denmark 0.94% 14 Australia 0.94% 15 Greece 0.47% 16 Spain 0.31% 17 Belgium 0.31%

ENV/WKP(2015)3
50
Sanitation
Rank Country Share of world's high value inventions
1 USA 27.37% 2 Japan 8.95% 3 Germany 7.89% 4 China 7.76% 5 Korea 7.37% 6 Sweden 5.53% 7 UK 4.87% 8 Switzerland 4.21% 9 South Africa 3.68% 10 France 3.16% 11 Canada 2.24% 12 Australia 2.11% 13 Finland 1.58% 14 Spain 1.58% 15 Denmark 1.05% 16 Chile 1.05% 17 Netherlands 1.05% 18 Mexico 1.05% 19 Italy 1.05% 20 Norway 0.79%
Water efficiency domestic
Rank Country Share of world's high value inventions
1 USA 24.83% 2 Germany 19.16% 3 Japan 10.93% 4 UK 6.75% 5 France 6.48% 6 Australia 5.13% 7 Italy 4.45% 8 Canada 3.51% 9 Korea 3.24% 10 Switzerland 2.02% 11 Chinese Taipei 1.75% 12 Austria 1.35% 13 Netherlands 1.35% 14 China 1.21% 15 New Zealand 1.21% 16 Spain 0.81% 17 Denmark 0.54% 18 Israel 0.54% 19 Norway 0.54% 20 Portugal 0.40%

ENV/WKP(2015)3
51
Water efficiency power
Rank Country Share of world's high value inventions
1 USA 40.37% 2 Germany 16.35% 3 Japan 13.69% 4 UK 8.64% 5 France 7.19% 6 Switzerland 3.60% 7 Canada 2.13% 8 Italy 1.13% 9 India 0.93% 10 Russia 0.75% 11 Sweden 0.72% 12 Belgium 0.57% 13 Norway 0.48% 14 Australia 0.40% 15 China 0.38% 16 Finland 0.32% 17 Turkey 0.30% 18 Austria 0.26% 19 Korea 0.25% 20 Israel 0.24%

ENV/WKP(2015)3
52
3.2 Supply-side water-related technologies
Rank Country Share of world's high value inventions
1 USA 29.08% 2 Germany 11.95% 3 Japan 11.27% 4 UK 6.05% 5 Australia 5.57% 6 France 4.51% 7 Korea 3.77% 8 Canada 3.02% 9 China 2.84% 10 Spain 2.53% 11 Italy 1.85% 12 Israel 1.85% 13 Netherlands 1.84% 14 Austria 1.59% 15 Sweden 1.45% 16 Denmark 0.99% 17 Switzerland 0.99% 18 Norway 0.93% 19 Russia 0.85% 20 Singapore 0.77%
Surface collection
Rank Country Share of world's high value inventions
1 USA 29.98% 2 Germany 19.97% 3 UK 7.43% 4 Australia 4.52% 5 France 4.52% 6 Japan 4.23% 7 Canada 4.08% 8 Korea 3.50% 9 Austria 3.21% 10 Spain 2.48% 11 Sweden 1.75% 12 Netherlands 1.60% 13 China 1.55% 14 Russia 1.31% 15 Switzerland 1.17% 16 Israel 0.87% 17 Italy 0.73% 18 Indonesia 0.73% 19 Singapore 0.73% 20 New Zealand 0.58%
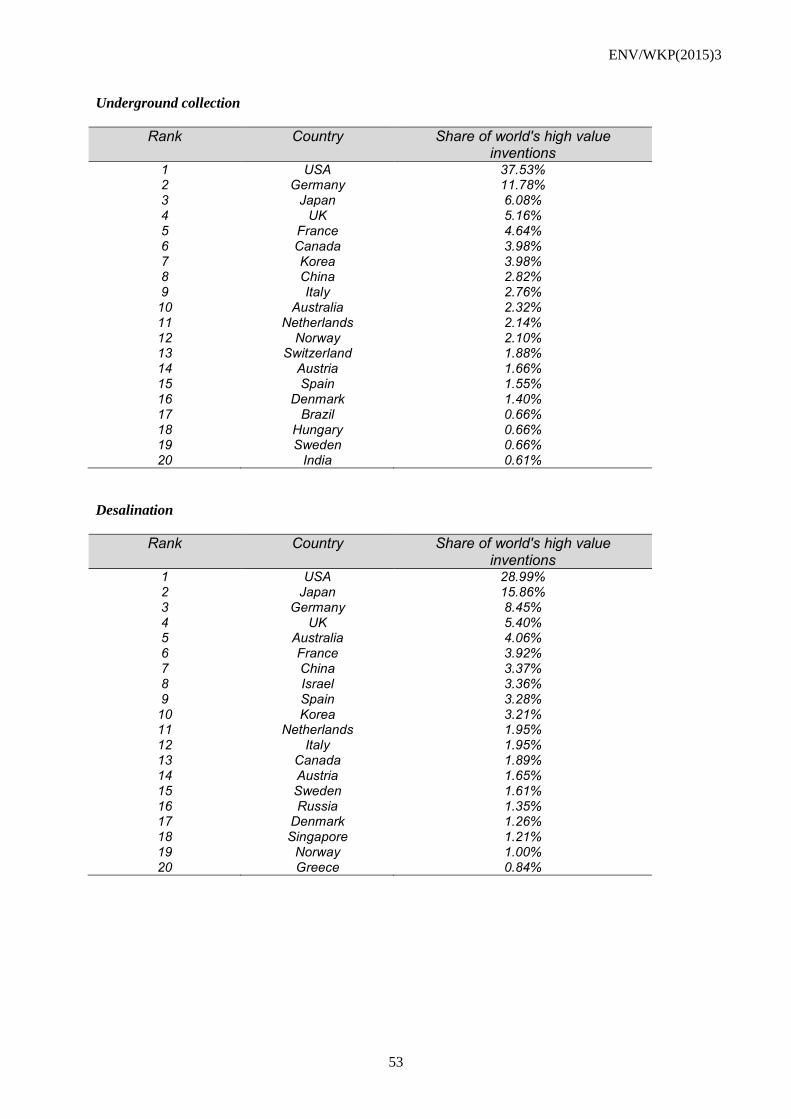
ENV/WKP(2015)3
53
Underground collection
Rank Country Share of world's high value inventions
1 USA 37.53% 2 Germany 11.78% 3 Japan 6.08% 4 UK 5.16% 5 France 4.64% 6 Canada 3.98% 7 Korea 3.98% 8 China 2.82% 9 Italy 2.76% 10 Australia 2.32% 11 Netherlands 2.14% 12 Norway 2.10% 13 Switzerland 1.88% 14 Austria 1.66% 15 Spain 1.55% 16 Denmark 1.40% 17 Brazil 0.66% 18 Hungary 0.66% 19 Sweden 0.66% 20 India 0.61%
Desalination
Rank Country Share of world's high value inventions
1 USA 28.99% 2 Japan 15.86% 3 Germany 8.45% 4 UK 5.40% 5 Australia 4.06% 6 France 3.92% 7 China 3.37% 8 Israel 3.36% 9 Spain 3.28% 10 Korea 3.21% 11 Netherlands 1.95% 12 Italy 1.95% 13 Canada 1.89% 14 Austria 1.65% 15 Sweden 1.61% 16 Russia 1.35% 17 Denmark 1.26% 18 Singapore 1.21% 19 Norway 1.00% 20 Greece 0.84%

ENV/WKP(2015)3
54
Rainwater collection
Rank Country Share of world's high value inventions
1 Australia 22.03% 2 Germany 16.08% 3 Japan 11.67% 4 UK 10.13% 5 USA 8.15% 6 France 6.61% 7 Canada 3.30% 8 China 3.08% 9 New Zealand 3.08% 10 Spain 2.20% 11 Netherlands 1.76% 12 Italy 1.76% 13 Finland 1.32% 14 Belgium 1.10% 15 Israel 0.88% 16 South Africa 0.88% 17 Malaysia 0.88% 18 Brazil 0.88% 19 Korea 0.88% 20 Switzerland 0.66%
Storage
Rank Country Share of world's high value inventions
1 USA 25.04% 2 Japan 17.48% 3 Australia 10.58% 4 Germany 9.64% 5 Korea 8.63% 6 France 4.03% 7 Canada 3.88% 8 UK 3.02% 9 Italy 2.59% 10 Sweden 2.52% 11 China 1.73% 12 Spain 1.51% 13 Switzerland 1.08% 14 New Zealand 1.08% 15 Denmark 1.01% 16 Netherlands 0.86% 17 India 0.86% 18 Brazil 0.86% 19 Mexico 0.65% 20 Chile 0.43%

ENV/WKP(2015)3
55
ANNEX 4. GROWTH OF INNOVATION BY INVENTOR COUNTRY
Country
High-value inventions All inventions
Growth of innovation
Relative growth compared to
innovation in all fields
Growth of innovation
Relative growth compared to
innovation in all fields
USA 164.00% 22.47% 94.98% -12.84% Germany 100.02% -7.30% 37.61% -20.74% Japan 124.23% -1.97% -4.77% -8.43% Australia 42.68% 38.30% 151.46% 143.51% UK 155.63% 13.96% 98.67% -6.83% France 180.05% 70.24% 97.40% 41.31% Canada 273.88% 50.19% 180.00% 2.58% Korea 542.50% -12.75% 1071.99% 241.05% China 1218.55% -34.25% 825.76% -10.80% Spain 170.24% 63.11% 60.14% 17.99% Italy 159.95% 29.97% 169.47% 106.62% Israel 41.97% -43.91% 35.79% -12.89% Switzerland 57.01% 8.11% 49.85% 23.88% Netherlands 118.46% 37.58% 107.16% -0.27% Sweden 16.14% -38.48% 31.66% -0.69% Chinese Taipei 419.32% -48.59% 269.59% -55.59% Austria 67.30% -36.99% 42.63% -40.77% New Zealand 139.22% 15.26% 128.28% 53.59% Denmark 218.26% 84.97% 101.48% 21.54% Brazil 494.87% 93.36% 31.21% -15.11% Belgium 258.33% 86.64% 78.58% 43.42% India 1770.00% 90.95% 106.43% -0.05% South Africa 144.00% 102.25% 185.29% 222.94% Norway 158.93% -11.14% 119.45% 56.13% Finland 4.50% -63.28% -18.89% -54.15%