family living expenses - living expenses ... •gives us more informationon our actual spending...
TRANSCRIPT
Family Living Expenses
Dr. Monte VandeveerDepartment of Ag Economics-Kansas State University
Monte Vandeveer joined the KSU Extension Farm Management team in February 2016 as the Southwest Area extension agricultural economist, based in Garden City. He grew up on a farm in south-central Kansas with wheat and cow-calf
operations. He received B.S. and M.S. degrees in agricultural economics from Kansas State University and a Ph.D. in ag economics from Purdue University. Besides working for K-State Research and Extension, he also has experience working
with the Economic Research Service, (USDA), the University of Nebraska-Lincoln’s Extension Service, and volunteer service in Vietnam. He has a special interest in risk management, particularly crop insurance.
Email: [email protected] Phone: 620-275-9164
Can we tighten our belts?Farm Household Income
and Family Living Expenses
Dr. Monte Vandeveer
KSU Extension Agricultural Economist
Agent Update, November 2016
2/14/17 1
Overview
• How have farm incomes and living expenses changed over the past several years?
• What categories of household spending might offer some promise for reduction?
• Some simple tools for managing family spending decisions
KS farm household income and expenses
• KFMA member records over 2004‐2015• ≈ 1,200members in 2015
• ≈ 400 kept detailed records for family living expenses
• Income: farm and non‐farm
• Expenses: 17 expense categories
• Caveat: no household is “average”
2/14/17 2
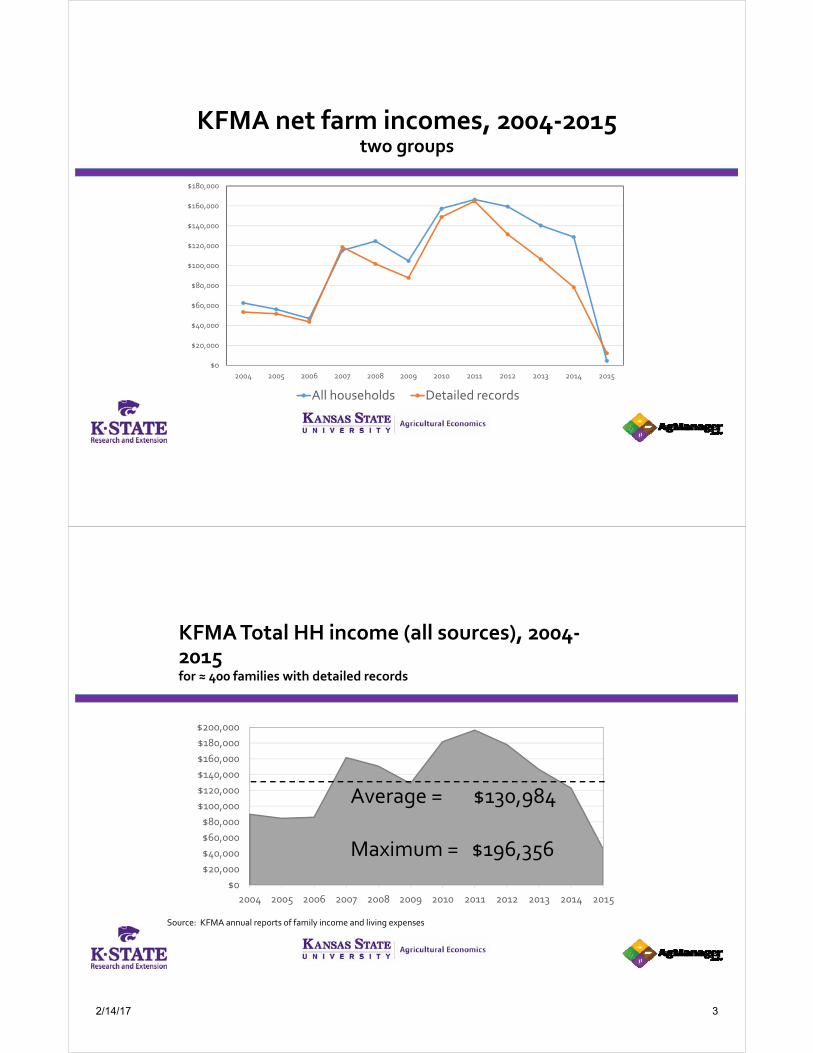
KFMA net farm incomes, 2004‐2015two groups
$0
$20,000
$40,000
$60,000
$80,000
$100,000
$120,000
$140,000
$160,000
$180,000
2004 2005 2006 2007 2008 2009 2010 2011 2012 2013 2014 2015
All households Detailed records
KFMA Total HH income (all sources), 2004‐2015for ≈ 400 families with detailed records
$0
$20,000
$40,000
$60,000
$80,000
$100,000
$120,000
$140,000
$160,000
$180,000
$200,000
2004 2005 2006 2007 2008 2009 2010 2011 2012 2013 2014 2015
Average = $130,984
Maximum = $196,356
Source: KFMA annual reports of family income and living expenses
2/14/17 3

Farm and non‐farm income
$0
$20,000
$40,000
$60,000
$80,000
$100,000
$120,000
$140,000
$160,000
$180,000
$200,000
2004 2005 2006 2007 2008 2009 2010 2011 2012 2013 2014 2015
Non‐farm Farm
Average = $39,405
Source: KFMA annual reports of family income and living expenses
Average = $91,579Max = $164,743Min = $12,165
Spending: family living expenses & taxes
$0
$20,000
$40,000
$60,000
$80,000
$100,000
$120,000
$140,000
$160,000
$180,000
$200,000
2004 2005 2006 2007 2008 2009 2010 2011 2012 2013 2014 2015
Family Living Taxes
Average = $58,638
77% difference
Source: KFMA annual reports of family income and living expenses
Average = $14,250
Max = $74,447Min = $41,985
2/14/17 4
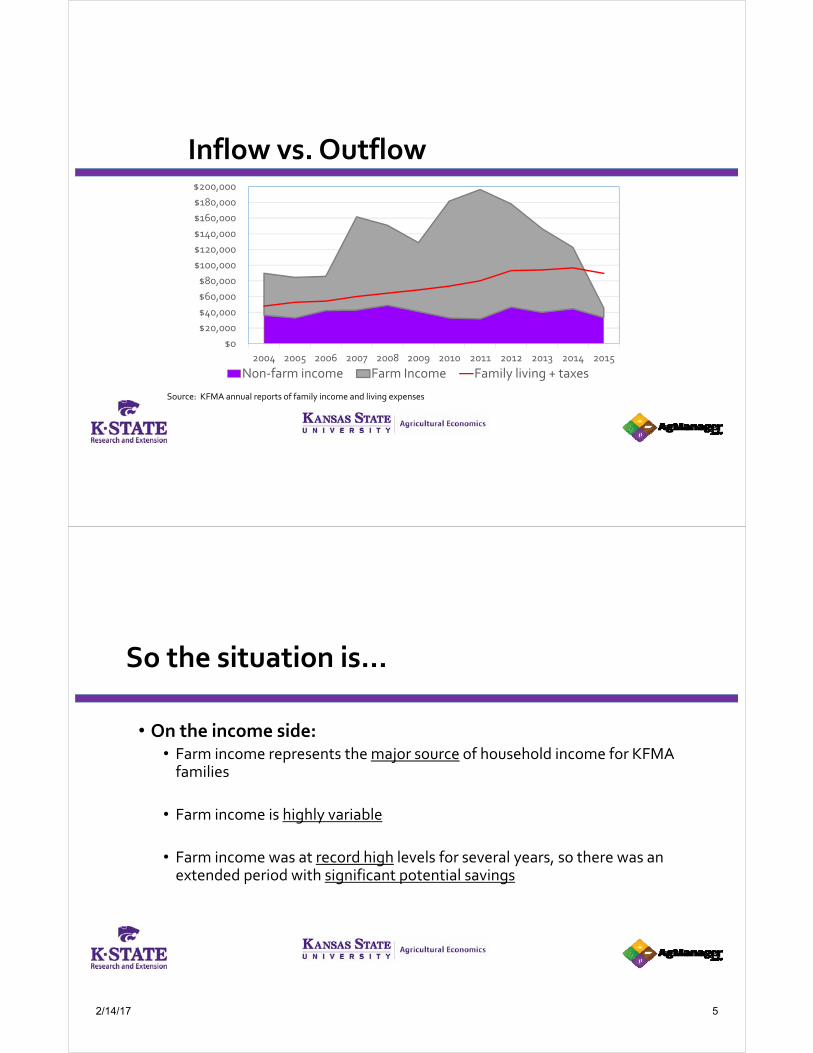
Inflow vs. Outflow
$0
$20,000
$40,000
$60,000
$80,000
$100,000
$120,000
$140,000
$160,000
$180,000
$200,000
2004 2005 2006 2007 2008 2009 2010 2011 2012 2013 2014 2015
Non‐farm income Farm Income Family living + taxes
Source: KFMA annual reports of family income and living expenses
So the situation is…
• On the income side:• Farm income represents the major source of household income for KFMA families
• Farm income is highly variable
• Farm income was at record high levels for several years, so there was an extended period with significant potential savings
2/14/17 5
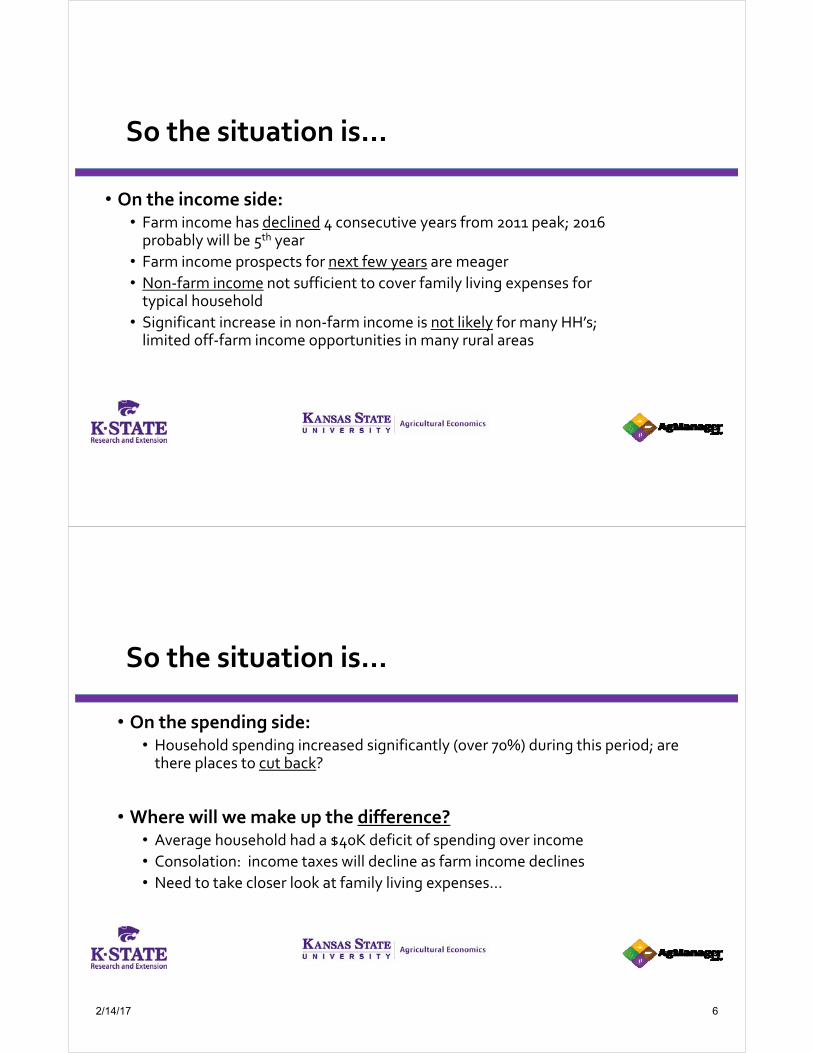
So the situation is…
• On the income side:• Farm income has declined 4 consecutive years from 2011 peak; 2016 probably will be 5th year
• Farm income prospects for next few years are meager
• Non‐farm income not sufficient to cover family living expenses for typical household
• Significant increase in non‐farm income is not likely for many HH’s; limited off‐farm income opportunities in many rural areas
So the situation is…
• On the spending side:• Household spending increased significantly (over 70%) during this period; are there places to cut back?
• Where will we make up the difference?• Average household had a $40K deficit of spending over income
• Consolation: income taxes will decline as farm income declines
• Need to take closer look at family living expenses…
2/14/17 6
KFMA family living expenses, 2004‐2015
$0
$10,000
$20,000
$30,000
$40,000
$50,000
$60,000
$70,000
$80,000
$90,000
$100,000
2004 2005 2006 2007 2008 2009 2010 2011 2012 2013 2014 2015
Non‐farm income
Average = $58,638
77% increase from 2004 to 2014Consumer Price Index increased 27.8% from Jan 2004 to Dec 2015
Source: KFMA annual reports of family income and living expenses
Max = $74,447
Min = $41,985
Family living expenses, by categoryAverage household: average expense, low, high, % difference over 2004‐2015
Expense Category Average Lowest Highest% difference, Low to High
Personal ‐ Recreation $ 8,994 $ 6,212 $ 11,535 85.7%
Household Operation $ 7,409 $ 5,131 $ 9,997 94.8%
Food Purchased $ 7,141 $ 5,751 $ 8,617 49.8%
Health Insurance $ 6,006 $ 4,153 $ 8,320 100.3%
Doctor ‐Other Medical $ 4,520 $ 4,147 $ 4,882 17.7%
Contributions $ 4,106 $ 2,492 $ 5,608 125.0%
House Upkeep & Repairs $ 3,809 $ 1,857 $ 6,490 249.5%
Gifts $ 2,986 $ 1,737 $ 4,680 169.4%
Life Insurance $ 2,985 $ 2,237 $ 3,816 70.6%
(versus overall family living increase of 77%)
Source: KFMA annual reports of family income and living expenses
2/14/17 7
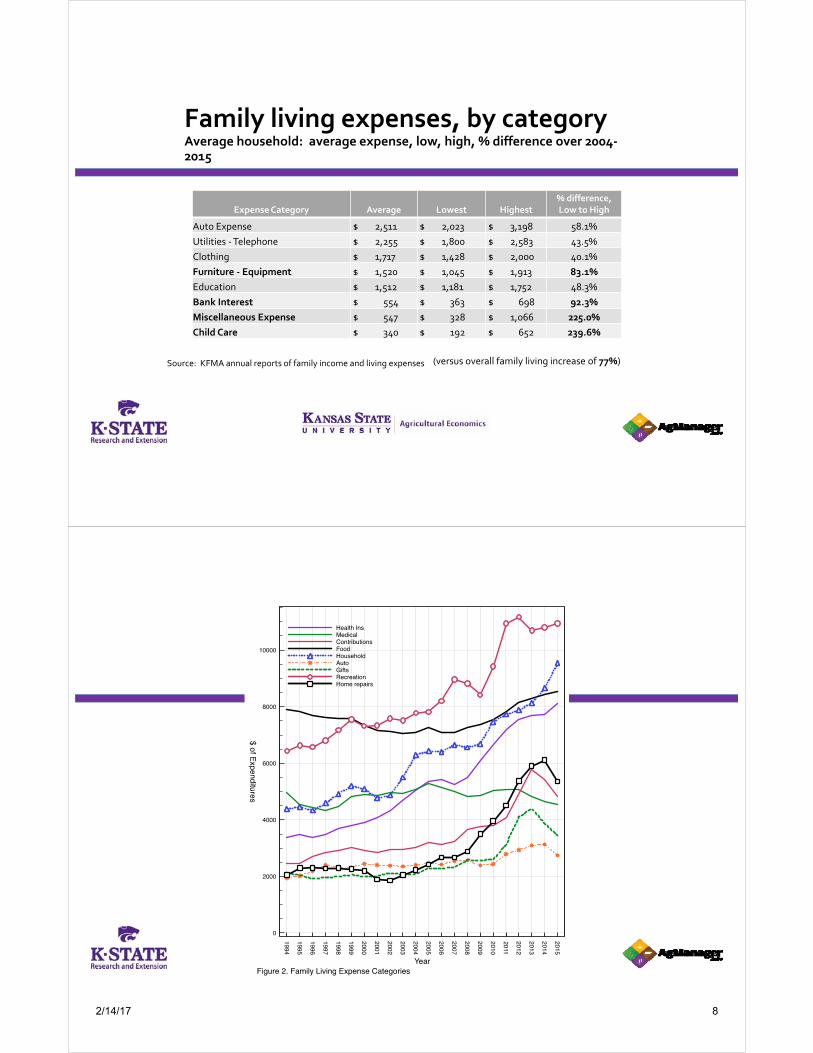
Family living expenses, by categoryAverage household: average expense, low, high, % difference over 2004‐2015
Expense Category Average Lowest Highest% difference, Low to High
Auto Expense $ 2,511 $ 2,023 $ 3,198 58.1%
Utilities ‐Telephone $ 2,255 $ 1,800 $ 2,583 43.5%
Clothing $ 1,717 $ 1,428 $ 2,000 40.1%
Furniture ‐ Equipment $ 1,520 $ 1,045 $ 1,913 83.1%
Education $ 1,512 $ 1,181 $ 1,752 48.3%
Bank Interest $ 554 $ 363 $ 698 92.3%
Miscellaneous Expense $ 547 $ 328 $ 1,066 225.0%
Child Care $ 340 $ 192 $ 652 239.6%
(versus overall family living increase of 77%)Source: KFMA annual reports of family income and living expenses
2/14/17 8
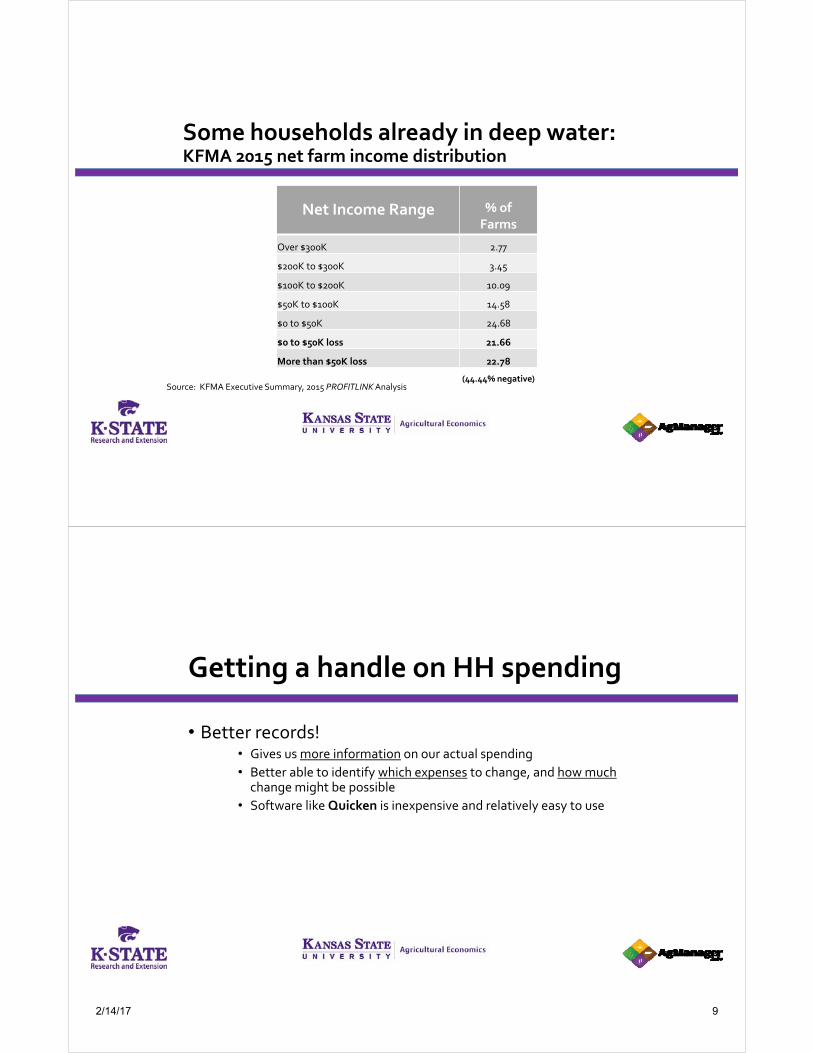
Some households already in deep water:KFMA 2015 net farm income distribution
Net Income Range % ofFarms
Over $300K 2.77
$200K to $300K 3.45
$100K to $200K 10.09
$50K to $100K 14.58
$0 to $50K 24.68
$0 to $50K loss 21.66
More than $50K loss 22.78
Source: KFMA Executive Summary, 2015 PROFITLINKAnalysis(44.44% negative)
Getting a handle on HH spending
• Better records!• Gives us more information on our actual spending
• Better able to identify which expenses to change, and how muchchange might be possible
• Software like Quicken is inexpensive and relatively easy to use
2/14/17 9
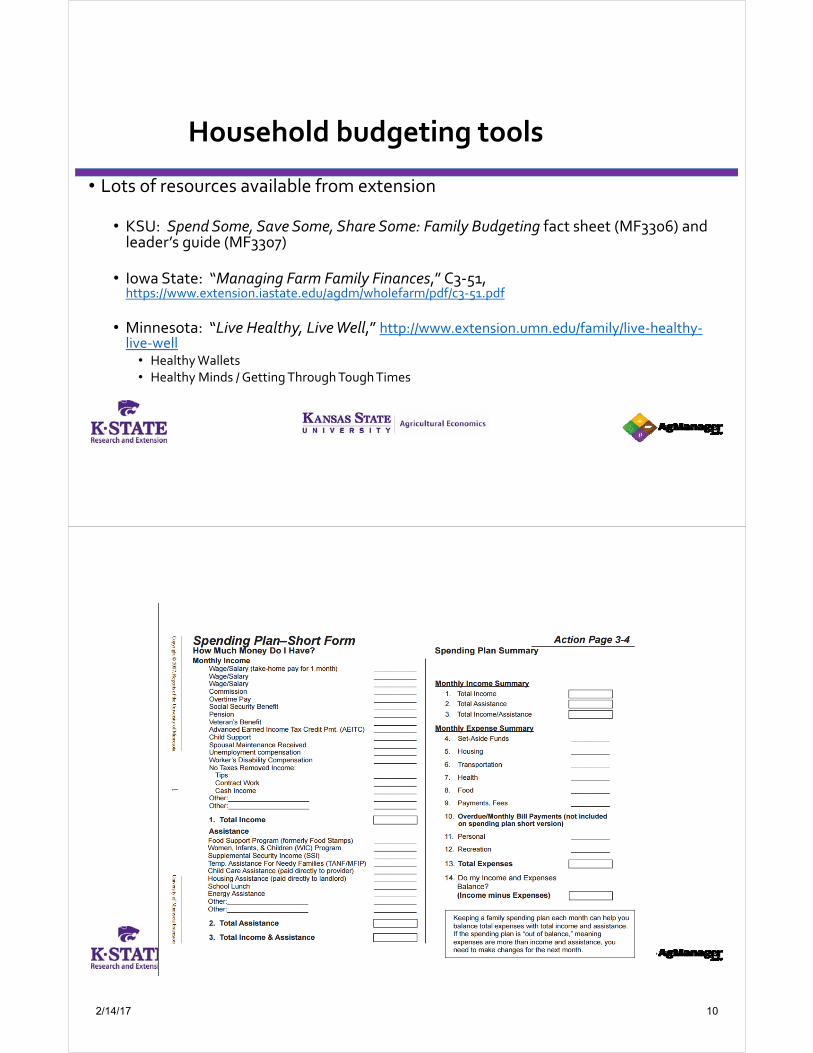
Household budgeting tools
• Lots of resources available from extension
• KSU: Spend Some, Save Some, Share Some: Family Budgeting fact sheet (MF3306) and leader’s guide (MF3307)
• Iowa State: “Managing Farm Family Finances,” C3‐51, https://www.extension.iastate.edu/agdm/wholefarm/pdf/c3‐51.pdf
• Minnesota: “Live Healthy, Live Well,” http://www.extension.umn.edu/family/live‐healthy‐live‐well
• Healthy Wallets• Healthy Minds / Getting Through Tough Times
2/14/17 10
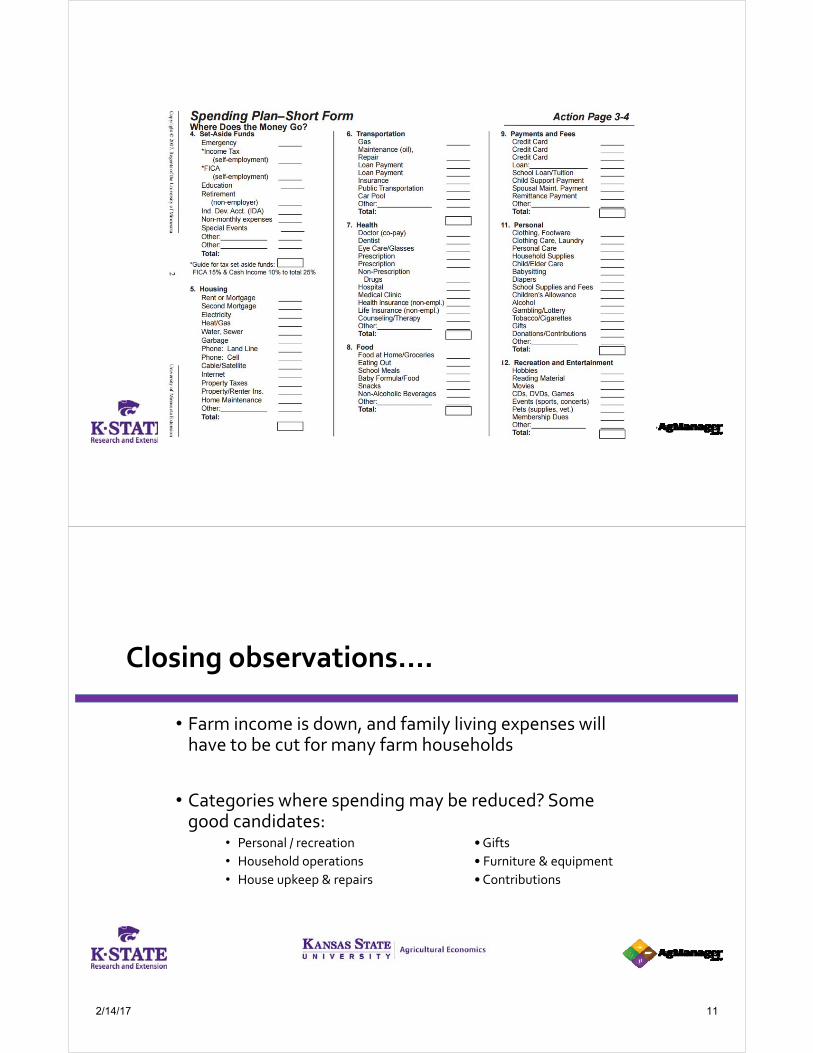
Closing observations….
• Farm income is down, and family living expenses will have to be cut for many farm households
• Categories where spending may be reduced? Some good candidates:
• Personal / recreation • Gifts
• Household operations • Furniture & equipment
• House upkeep & repairs • Contributions
2/14/17 11
Closing observations….
• Better records: where cuts are possible, how muchmight be saved
• Time for HH budget review; defer some spending
• Cutting household expenses will not be sufficient for some families
• Will have to draw upon savings or other resources to cover a share of family living expenses
Dr. Monte VandeveerKSU Extension Agricultural EconomistEmail: [email protected]: 620‐275‐91641
Questions?Comments?
Thank you!
K‐State Research and Extension is a statewide network of educators sharing unbiased, research‐based information and expertise on issues important to Kansas. K‐State Research and Extension is an equal opportunity provider and employer.
2/14/17 12