fall semes ter - university of jordaneacademic.ju.edu.jo/s.muhaissen/material/practical...
TRANSCRIPT

De
Pra
epartment of
actical P
UnivFacu
f Pharmaceu
harmace
Fa2
PrSuha
versity of Joulty of Pharmutics and Ph
eutical Te
ll Semes011 - 201
Prepared BA Al Muha
ordan macy harmaceutic
echnolog
ster 12
By: aissen
cal Technolo
gy I Man
ogy
nual

UINIVERSITY OF JORDAN FACULTY OF PHARMACY
DEPTARTMENT OF PHARMACEUTICS & PHARMACEUTICAL TECHNOLOGY Course Title: Practical Pharmaceutical Technology I Course Number: 1212332, one credit hour Practical Pharmaceutical Technology I Components Method: Pre-lab preparation (all students required to read the instructions for the relevant experiment prior to attending the lab - 30 minutes per lab). Laboratory time: 30 hours total (10*3 hours) Course description and aims: The series of practical classes provides advanced skills in the area of pharmaceutical technology and has particular emphasis on the methods, materials and testing procedures associated with the manufacture of pharmaceutical grade tablets. Experiments illustrate the flow properties of powders, mixing and milling of powders, wet and dry granulation methods, powder particle size analysis, tableting technology and dissolution of dosage forms. Recommended textbooks and reading: Pharmaceutics: The Science of Dosage Form design Pharmaceutical Dosage Forms: Tablets (1:3) (Leiberman and Lachman eds) British Pharmacopeia United States Pharmacopeia
Practical Pharmaceutical Technology I Manual
Learning content: Full details of the experimental procedures and background information are provided in the laboratory schedules. Students are expected to read these schedules prior to entering the laboratory. This will allow them to carry out the experiment quickly and efficiently, and to understand the experiment and the data analysis methods requested in the schedule. All practical sessions will be run by a member of academic staff, assisted by postgraduate Teaching Assistants and members of technical staff these will advise on experimental techniques and be available for consultation on any other aspect of the practical course. Students are encouraged to seek assistance at any time. Students are required to complete all the experiments in the schedule and to write laboratory reports to contribute to group reports for the individual experiment, as appropriate. Practical's run as-full day (three-hour) sessions. A series of supplementary questions form a part of the assessment of certain experiments to which students are expected to give brief but informative answers. Students should use the background information.

It is imperative that safe working procedures and practices are adhered to throughout. Safety glasses and laboratory coats must be worn at all times when in the laboratory. Students are required to complete group reports for certain experiments before they leave the practical session. Other group and individual reports should be handed in one week after the practical session. Reports handed in late without prior agreement or medical evidence will be subject to a penalty in accord with standard University practice. The report will subsequently be marked and appropriate constructive comments will be provided. The marked laboratory reports will be returned as soon as possible and normally for the next laboratory session or within two weeks from submission. Where extenuating circumstances (such as illness) have prevented attendance at the laboratory class or the submission of work on time the student should complete an Extenuating Report to the instructor. Students who fail to attend the class or fail to coursework without approved extenuating circumstances will be awarded a mark of zero for that component. For classes missed with good cause (i.e. with provision of acceptable evidence of extenuating circumstances) an average mark will be awarded. Students who are absent with or without good cause who have not undertaken at least 30% of the lab sessions (three out of ten sessions) will fail the module and must be re-assessed. Assessment: The module will be assessed by 8 written reports. For two practicals the practical report will include full details of the experimental procedure, results, discussion and answers to questions posed in the laboratory schedule. For the other practicals students will contribute to group reports, which should conform to guidelines which will be provided. An assessment of individual student's practical skills will be made on each practical day. At the end of each group report, you will be asked as a group to indicate the relative contribution to the practical work and to the write -up. Individual student marks for group work, will reflect the group assessment of individuals contributions. If you do not provide this assessment, then all members of the group will be given the same mark, which will then be moderated according to the results of the assessment of individual student's practical skills. Learning Outcomes/Skills:
Deductive reasoning Numerical Analysis Written/oral communication Information retrieval and analysis Practical application of theory Report writing
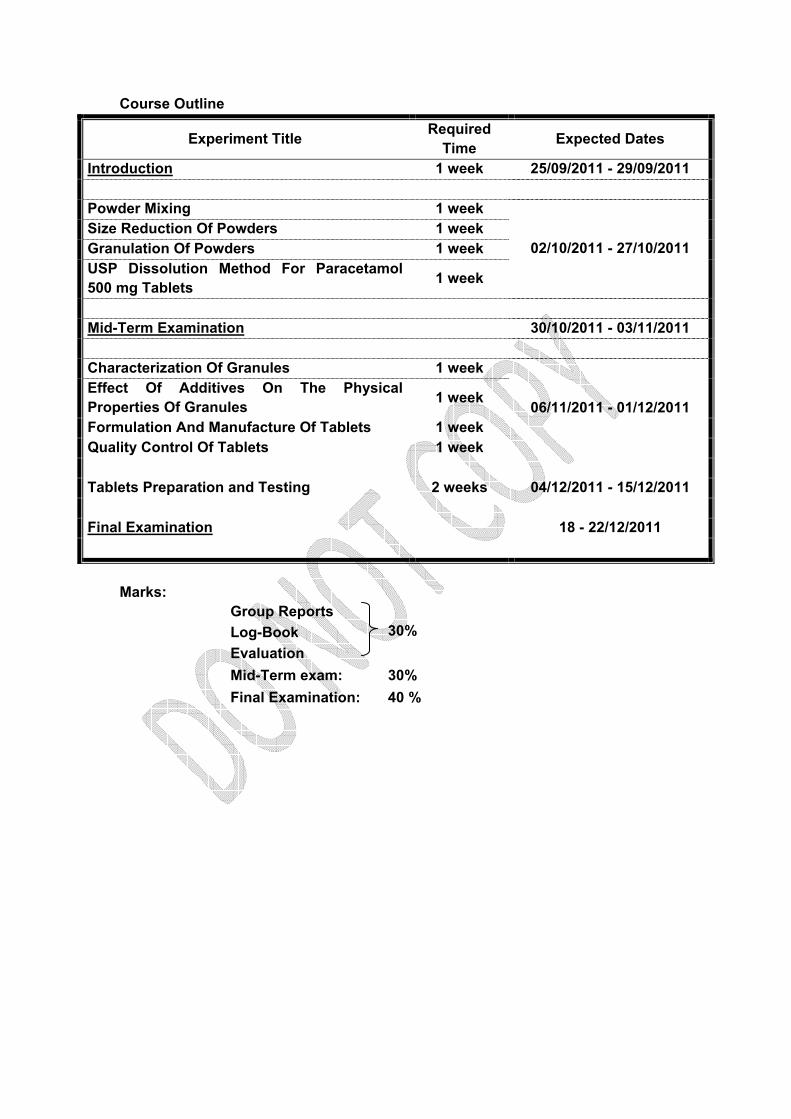
Course Outline
Experiment Title Required Time Expected Dates
Introduction 1 week 25/09/2011 - 29/09/2011 Powder Mixing 1 week
02/10/2011 - 27/10/2011 Size Reduction Of Powders 1 week Granulation Of Powders 1 week USP Dissolution Method For Paracetamol 500 mg Tablets 1 week
Mid-Term Examination 30/10/2011 - 03/11/2011 Characterization Of Granules 1 week
06/11/2011 - 01/12/2011 Effect Of Additives On The Physical Properties Of Granules 1 week
Formulation And Manufacture Of Tablets 1 week Quality Control Of Tablets 1 week Tablets Preparation and Testing 2 weeks 04/12/2011 - 15/12/2011 Final Examination 18 - 22/12/2011
Marks:
Group Reports 30% Log-Book
Evaluation Mid-Term exam: 30% Final Examination: 40 %

Group
Group
Group
Group
Pra
W
A Exp
B Exp
C Exp
D Exp
Departmen
actical P
Week 1
periment 1
periment 2
periment 3
periment 4
UnivFacu
t of Pharma
harmace
Cy
W
Exp
Exp
Exp
Exp
versity of Joulty of Pharmaceutical Sc
eutical Te
ycle ( 1
Week 2
periment 2
periment 1
periment 4
periment 3
ordan macy iences and
echnolog
1 )
Ex
Ex
Ex
Ex
Technology
gy I Man
Week 3
xperiment 3
xperiment 4
xperiment 1
xperiment 2
y
nual
3 E
4 E
1 E
2 E
Week 4
Experiment
Experiment
Experiment
Experiment
t 4
t 3
t 2
t 1

EXPERIMENT (1) POWDER MIXING (P.M.)
INTRODUCTION Aim of Mixing: The main aim of powder mixing in pharmaceutical practice is to achieve dose
uniformity in solid dosage form (tablets, capsules, and powders), particularly so
important in case of very potent drugs like Digoxin, Ethinyl estradiol.
- Parameters affecting Mixing:
1. Particle Parameter: like particle size, particle shape, size distribution,
particle density, Cohesive forces, Hygroscopic properties, Hardness.
2. Type of mixer: speed, batch volume and movement.
3. Segregation tendency of individual components based on density
difference.
- Mechanisms of Mixing: Diffusion, Convection, and Shearing.
- Efficiency of Powder Mixing using different mixers is affected by:
1. Presence of Blades
2. Filling Volume
3. Agitation Speed
Revolvo-Cube Mixer: - motor drive mixer
- The housing in the Cube Mixer is manufactured from stainless steel.
- Equipped with Baffles but not Blades
- Tumbling movement.
- Cube mixer is problematic due to the presence of corners, why?

EXPERIMENTAL: a. Materials: Lactose, Sodium Salicylate, b. Apparatus: Revolvo-Cube Mixer, UV/VIS Spectrophotometer.
c. Method:
NB: all equipment and tools should be cleaned prior to use. 1. Prepare 500gm of 5% w/w Na-Salicylate in Lactose (25 gm Na-Salicylate
(500gm*5 % w/w) with 475 gm Lactose (500gm -25gm)).
N.B.: Pass all powders before weighing using 1mm pore size sieve, why?
2. Place the powders in the mixing chamber of the Revolvo-Cube Mixer (place
powder of the largest quantity (lactose) first then Na-Salicylate)
3. Start mixing (operating speed = 25 rpm), commence mixing and timing
simultaneously.
4. Take 5 samples (200 mg = 0.200 gm each) at 5, 15, 30 & 45 minutes, (such that
5 samples at each time).
• Samples should be taken randomly from 5 different places of the powder
mixture → Random Spot Samples.
• The weights of samples should be close to each others (±10% → 0.200±0.02
gm) otherwise results will be affected, why? Explain.
5. Determine the content of Na-Salicylate in each sample at each time (all samples
will be analyzed at each time interval. Follow the analytical technique described
below:
a. Put each sample in 100 mL Volumetric Flask.
b. Add 10 - 15 mL of distilled water and mix until all powders are completely
dissolved.
c. Complete the volume by D.Water up to the 100 mL mark then mix well.

d. Measure the samples absorbance using UV/VIS spectrophotometer:
• Blank should be 0.20% w/v Lactose in D.Water (200 mg Lactose in 100 mL
V.Flask, dissolve lactose in 10 - 20 mL of D.Water, then complete up to the
100 mL mark using D.Water.
• λmax for absorbance measurement is 254 nm
NB:
Absorbance linear range is (0.200 - 1.200), solutions of absorbance out of
this range should be diluted.
6. Calibration Curve: a. Prepare 0.10gm% w/v of Na-Salicylate in D.Water ( place 100 mg Na-
Salicylate in 100 mL V.Flask, dissolve then complete volume up to the
100 mL mark with D.Water then mix well) → Standard Stock Solution
b. Withdraw 10, 20, 25 & 35 mL using volumetric pipettes from the
Standard Stock Solution and place each in a different 100 mL V.Flask
and complete the volume up to 100 mL mark with D.Water then mix well
→ Standard Solutions
c. Measure the standard solutions absorbances using D.Water as a blank,
and at λmax = 254 nm.
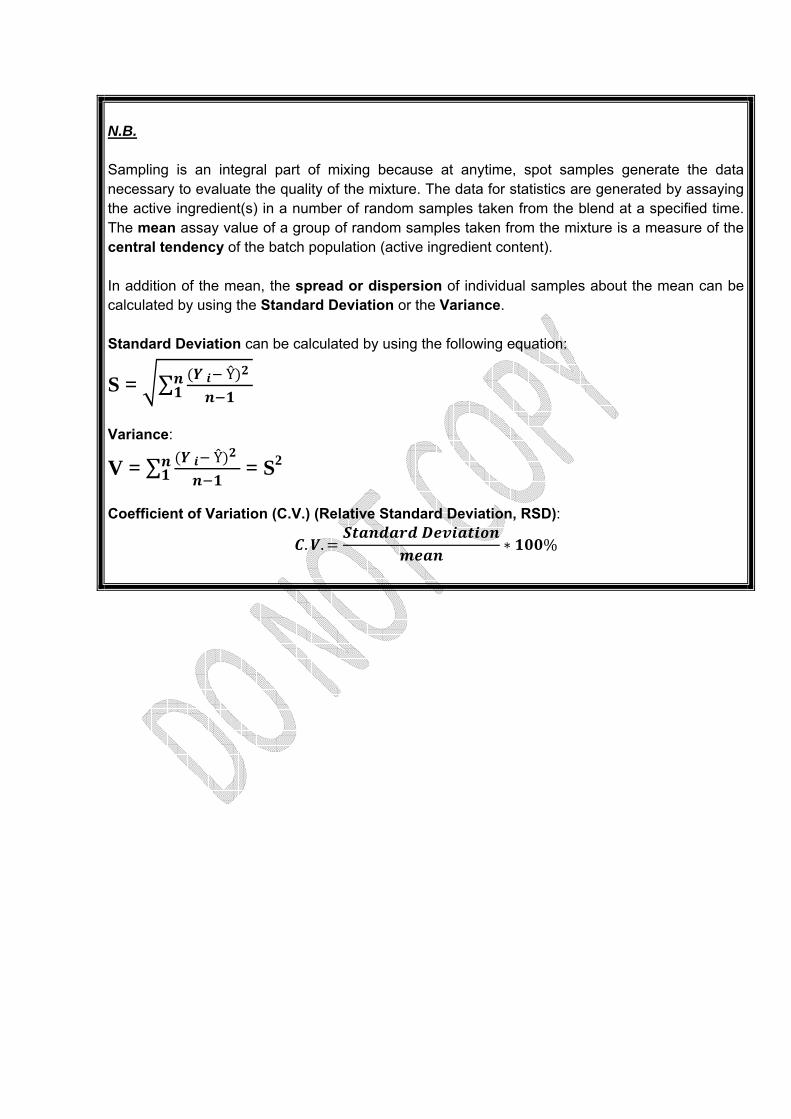
N.B. Sampling is an integral part of mixing because at anytime, spot samples generate the data necessary to evaluate the quality of the mixture. The data for statistics are generated by assaying the active ingredient(s) in a number of random samples taken from the blend at a specified time. The mean assay value of a group of random samples taken from the mixture is a measure of the central tendency of the batch population (active ingredient content). In addition of the mean, the spread or dispersion of individual samples about the mean can be calculated by using the Standard Deviation or the Variance. Standard Deviation can be calculated by using the following equation:
S = ∑ Ŷ Variance:
V = ∑ Ŷ = S2
Coefficient of Variation (C.V.) (Relative Standard Deviation, RSD):
. .
%
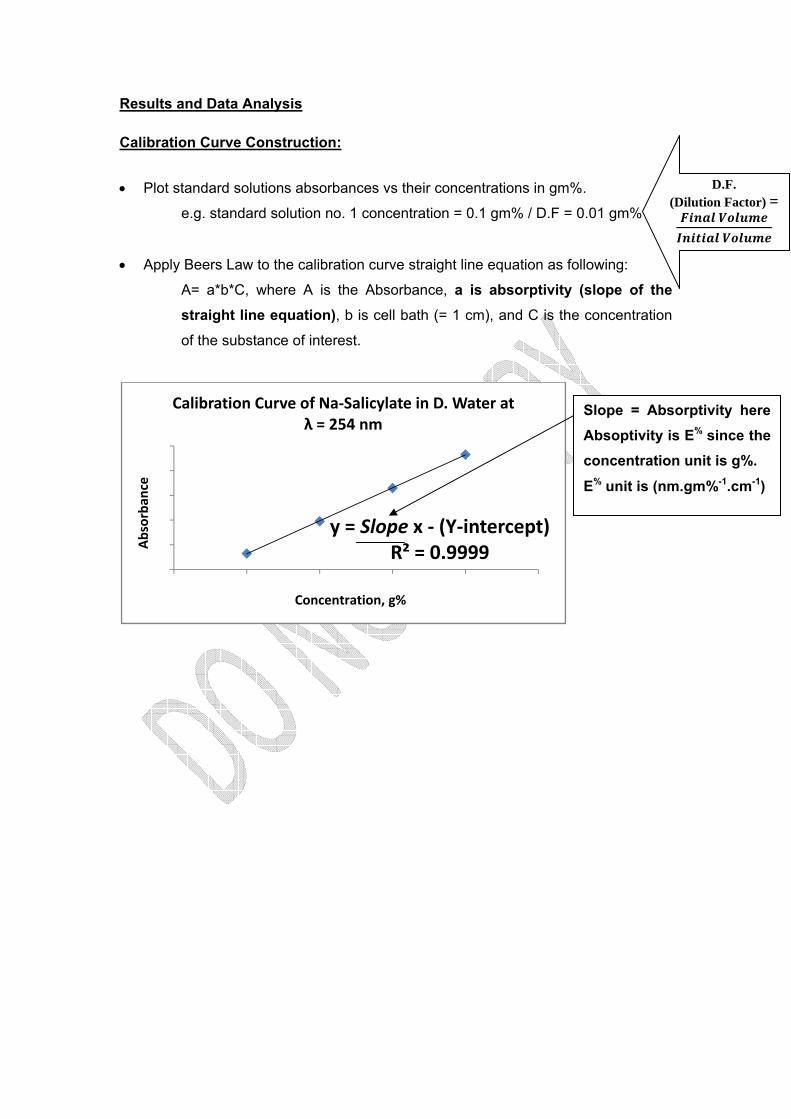
Results and Data Analysis Calibration Curve Construction:
• Plot standard solutions absorbances vs their concentrations in gm%.
e.g. standard solution no. 1 concentration = 0.1 gm% / D.F = 0.01 gm%
• Apply Beers Law to the calibration curve straight line equation as following:
A= a*b*C, where A is the Absorbance, a is absorptivity (slope of the straight line equation), b is cell bath (= 1 cm), and C is the concentration
of the substance of interest.
y = Slope x ‐ (Y‐intercept)R² = 0.9999A
bsorba
nce
Concentration, g%
Calibration Curve of Na‐Salicylate in D. Water at λ = 254 nm
D.F. (Dilution Factor) =
Slope = Absorptivity here Absoptivity is E% since the concentration unit is g%.
E% unit is (nm.gm%-1.cm-1)

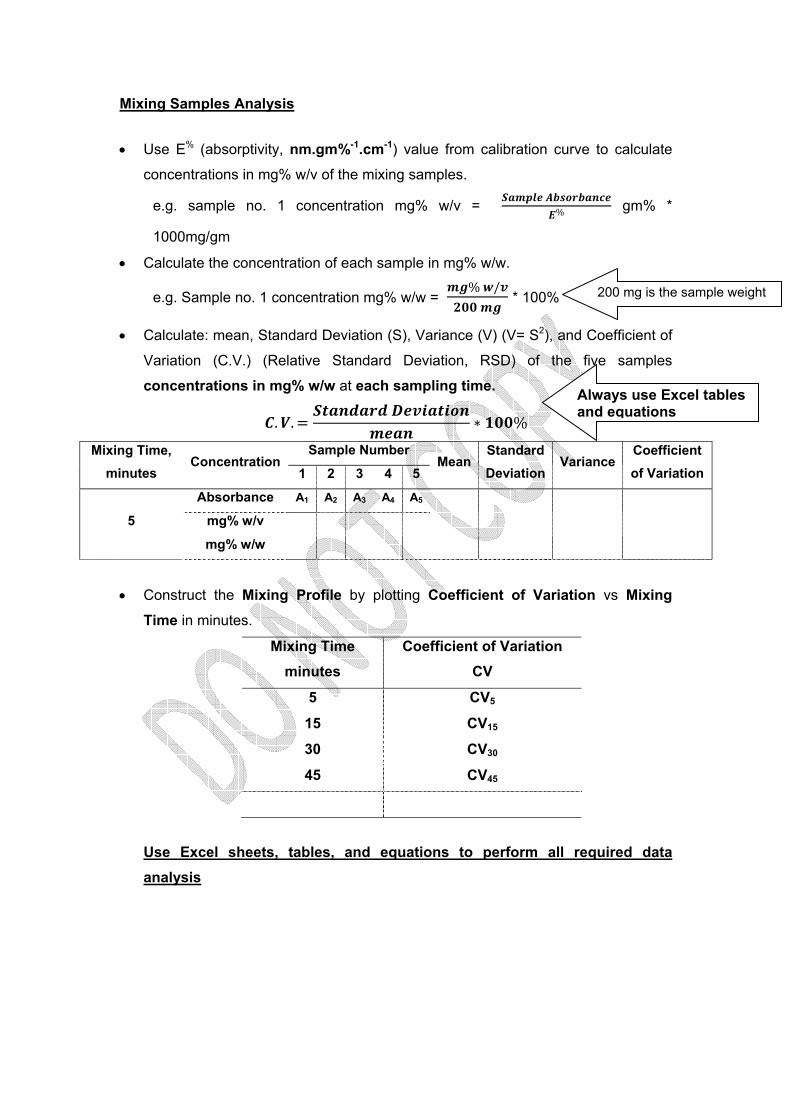
Mixing Samples Analysis
• Use E% (absorptivity, nm.gm%-1.cm-1) value from calibration curve to calculate
concentrations in mg% w/v of the mixing samples.
e.g. sample no. 1 concentration mg% w/v = % gm% *
1000mg/gm
• Calculate the concentration of each sample in mg% w/w.
e.g. Sample no. 1 concentration mg% w/w = % /
* 100%
• Calculate: mean, Standard Deviation (S), Variance (V) (V= S2), and Coefficient of
Variation (C.V.) (Relative Standard Deviation, RSD) of the five samples
concentrations in mg% w/w at each sampling time.
. .
%
Mixing Time, minutes
Concentration Sample Number
Mean Standard Deviation
Variance Coefficient of Variation 1 2 3 4 5
5
Absorbance A1 A2 A3 A4 A5
mg% w/v
mg% w/w
• Construct the Mixing Profile by plotting Coefficient of Variation vs Mixing Time in minutes.
Mixing Time minutes
Coefficient of Variation CV
5 CV5
15 CV15
30 CV30
45 CV45
Use Excel sheets, tables, and equations to perform all required data analysis
200 mg is the sample weight
Always use Excel tables and equations

Examples on Mixing Profiles:
• Compare and discuss your results.
Coeffecien
t of Variation
Mixing Time, minutes
Mixing Profile of Non‐Segregated Mixtures of Homogenous Particle Size
Plateau
0
20
40
60
80
100
120
0 10 20 30 40 50
Coeffecien
t of Variation
Mixing Time, minutes
Mixing Profile of Segregated Mixtures of Non‐Homogenous Particle Size
Optimum Mixing Time: the least time required to achieve the lowest coefficient of variation.
Optimum Mixing Time

EXPERIMENT (2) SIZE REDUCTION OF POWDERS (S.R.)
INTRODUCTION: The Size Reduction of powders is performed in many different industries, and is
often an essential step in the production of pharmaceutical dosage forms, particulate
raw materials, including drugs and formulation additives, may be milled to yield a
powder with particle size distribution necessary for both satisfactory manufacturing
processes and dosage forms with the desired properties.
It is established, for certain drugs, that changes in particle size distribution of specific
surface area may affect drug release characteristics and also influence drug
absorption. In other cases, changes in the specific surface area of powders, e.g.
Kaolin and Magnesium Trisilicate, may influence their adsorptive capacities. The
particle size of commonly used formulation additives may influence processes; such
as mixing, granulation, compaction, the suspension of particles in liquids and the
dispersion of particles in liquids, ointments, pasts, and suppository bases.
The choice of milling equipment will be dependent upon the powder properties, the
size distribution of the raw material and the size expected for the product, after
milling.
• Size Reduction also called (Comminution, Diminution, and Pulverization)
• Why do we perform size reduction? 1. To enhance the dissolution and bioavailability of drugs by increasing surface
area.
2. To improve the adsorptive capacities.
3. To improve processes such as mixing, granulation … ect by changing the surface
area of certain additives.
• Mechanisms of Size Reduction: 1. Attrition
2. Impaction
3. Shearing
4. Compression

Rotary Ball Mill
• Milling Chamber is a cylinder-like housing move in a horizontal rotater.
• The grinding medium (large and small spherical charges) causes size reduction
by two mechanisms:
1. Attrition: during the balls hitting with each other and balls hitting against the
wall of ball mill (mainly due to small spheres).
2. Impact: upon balls falling especially the large ones they grind the wall.
• The factors which affect the milling are: 1. Speed of rotation: should have an optimum speed, why?
Rate of milling is very important because each ball is exposed to two forces:
a. Gravitational Force b. Centrifugation Force
Depending on the rate of milling (velocity), one of the two forces is the
predominant, explain. At Critical Speed → Gravitational force <<< Centrifugation force
Critical Speed = 76.6 /
Optimum Speed = 60 - 85% of Critical Speed (to achieve efficient milling)
2. Filling volume of mill: the balls should only occupy two thirds (2/3) of the
chamber.
3. Milling time.
(d) is the diameter of ball mill milling chamber feet = 30 cm
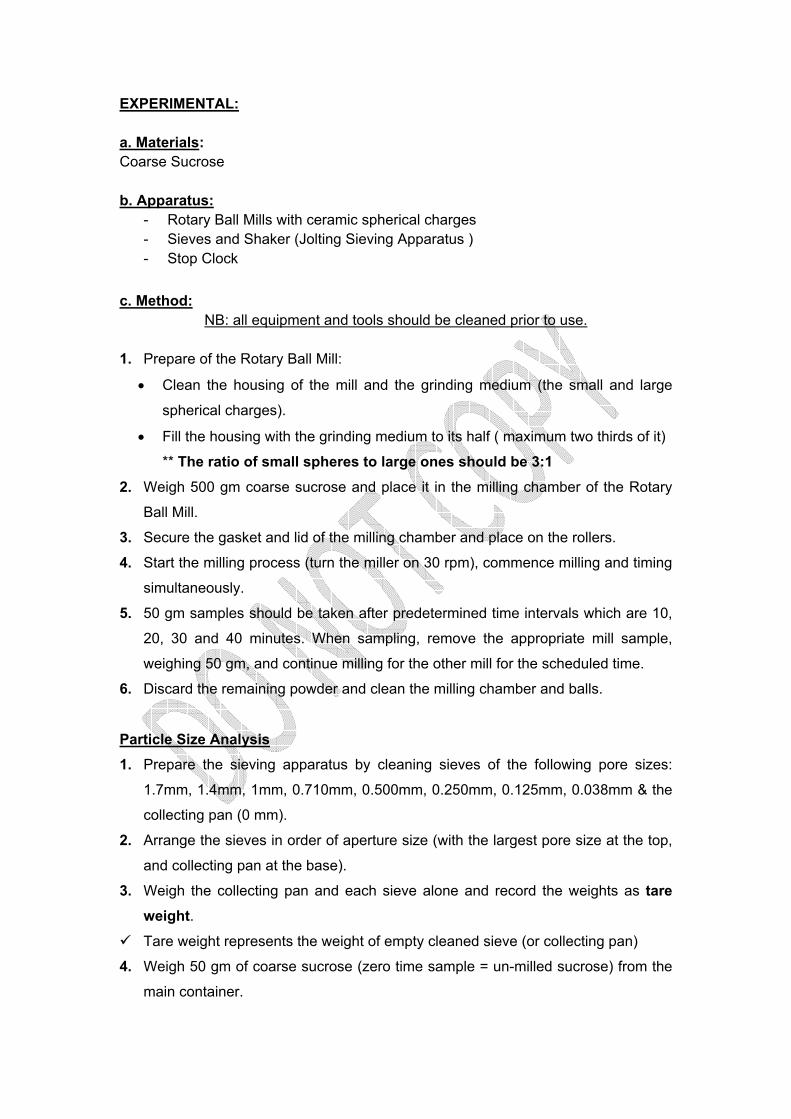
EXPERIMENTAL: a. Materials: Coarse Sucrose b. Apparatus:
- Rotary Ball Mills with ceramic spherical charges - Sieves and Shaker (Jolting Sieving Apparatus ) - Stop Clock
c. Method: NB: all equipment and tools should be cleaned prior to use.
1. Prepare of the Rotary Ball Mill:
• Clean the housing of the mill and the grinding medium (the small and large
spherical charges).
• Fill the housing with the grinding medium to its half ( maximum two thirds of it)
** The ratio of small spheres to large ones should be 3:1 2. Weigh 500 gm coarse sucrose and place it in the milling chamber of the Rotary
Ball Mill.
3. Secure the gasket and lid of the milling chamber and place on the rollers.
4. Start the milling process (turn the miller on 30 rpm), commence milling and timing
simultaneously.
5. 50 gm samples should be taken after predetermined time intervals which are 10,
20, 30 and 40 minutes. When sampling, remove the appropriate mill sample,
weighing 50 gm, and continue milling for the other mill for the scheduled time.
6. Discard the remaining powder and clean the milling chamber and balls.
Particle Size Analysis 1. Prepare the sieving apparatus by cleaning sieves of the following pore sizes:
1.7mm, 1.4mm, 1mm, 0.710mm, 0.500mm, 0.250mm, 0.125mm, 0.038mm & the
collecting pan (0 mm). 2. Arrange the sieves in order of aperture size (with the largest pore size at the top,
and collecting pan at the base). 3. Weigh the collecting pan and each sieve alone and record the weights as tare
weight. Tare weight represents the weight of empty cleaned sieve (or collecting pan)
4. Weigh 50 gm of coarse sucrose (zero time sample = un-milled sucrose) from the
main container.

5. Place this sample at the top sieve of those arranged according to their pore sizes,
and with the lid in position clamp the sieves to the sieves-shaker and agitate for
10 minutes. 6. After the time elapsed, stop the shaker and record the weight of the sieves and
collecting pan with the powder retained on each as gross weight. Gross weight represents the weight of the each sieve (or collecting pan) with the
powder retained. 7. Repeat the above steps (after cleaning the sieves and collecting pan) for samples
taken at 10, 20, 30 & 40 minutes.
NB:
• The cascading speed of 30 rpm measured by tachometer should be used.
• The sieves used are analytical tools, in order to maintain sieves of good
quality, they should be handled with care, and removal of powder from the
mesh should be done only by gentle brushing.
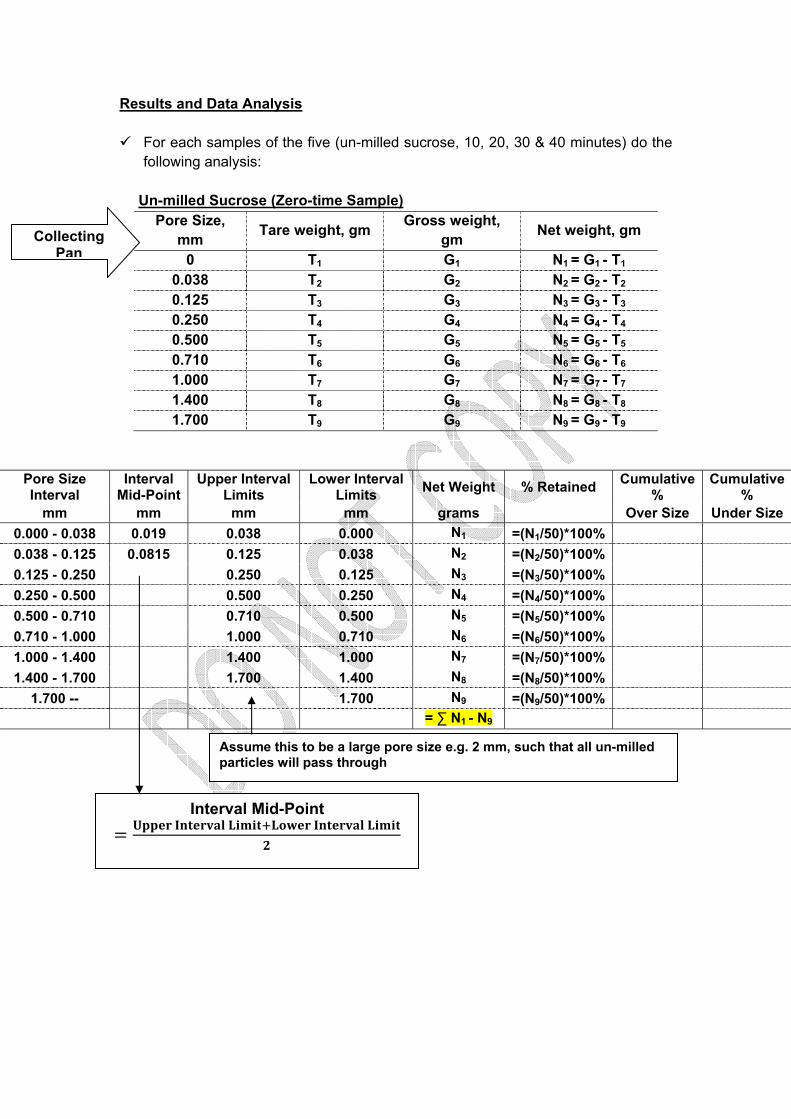
Results and Data Analysis
For each samples of the five (un-milled sucrose, 10, 20, 30 & 40 minutes) do the following analysis:
Un-milled Sucrose (Zero-time Sample)
Pore Size, mm Tare weight, gm Gross weight,
gm Net weight, gm
0 T1 G1 N1 = G1 - T1 0.038 T2 G2 N2 = G2 - T2 0.125 T3 G3 N3 = G3 - T3 0.250 T4 G4 N4 = G4 - T4 0.500 T5 G5 N5 = G5 - T5 0.710 T6 G6 N6 = G6 - T6 1.000 T7 G7 N7 = G7 - T7 1.400 T8 G8 N8 = G8 - T8 1.700 T9 G9 N9 = G9 - T9
Pore Size Interval
Interval Mid-Point
Upper Interval Limits
Lower Interval Limits Net Weight % Retained Cumulative
% Cumulative
% mm mm mm mm grams Over Size Under Size
0.000 - 0.038 0.019 0.038 0.000 N1 =(N1/50)*100% 0.038 - 0.125 0.0815 0.125 0.038 N2 =(N2/50)*100% 0.125 - 0.250 0.250 0.125 N3 =(N3/50)*100% 0.250 - 0.500 0.500 0.250 N4 =(N4/50)*100% 0.500 - 0.710 0.710 0.500 N5 =(N5/50)*100% 0.710 - 1.000 1.000 0.710 N6 =(N6/50)*100% 1.000 - 1.400 1.400 1.000 N7 =(N7/50)*100% 1.400 - 1.700 1.700 1.400 N8 =(N8/50)*100%
1.700 -- 1.700 N9 =(N9/50)*100% = ∑ N1 - N9
Collecting Pan
Assume this to be a large pore size e.g. 2 mm, such that all un-milled particles will pass through
Interval Mid-Point

Cumulative % Over Size is defined as the percentage of particles that have particle sizes lager than the interval lower limit.
Ex.1: Cumulative % Over Size for 1st interval =
∑ * 100% = 100%
Ex.2: Cumulative % Over Size for 2nd interval =
∑ * 100%
Ex.3: Cumulative % Over Size for 3rd interval =
∑ * 100%
Cumulative % Under Size is defined as the percentage of particles that have particle size smaller than the interval upper limit.
Ex.1: Cumulative % Under Size for 1st interval = ∑
* 100%
Ex.2: Cumulative % Under Size for 2nd interval =
∑ * 100%
Ex.3: Cumulative % Under Size for last interval =
∑ * 100% =
100%
Plot on the sample sheet: Cumulative % Over Size vs. Intervals Lower Limits, and Cumulative % Under Size vs. Intervals Upper Limits
0
50
100
Cumulative % Retaine
d
Pore Size, mm
Unmilled Sucrose Particle Size Analysis
Cumulative % Over Size
Cumulative % Under Size
Intersection Point of the two curves should have 50% as Y-Coordinate and represents the 50th percentile (which means above its X-Coordinate there is 50% of the particles and 50% are below it) then it represents the Median Particle Size.
Median Particle Size (in mm)
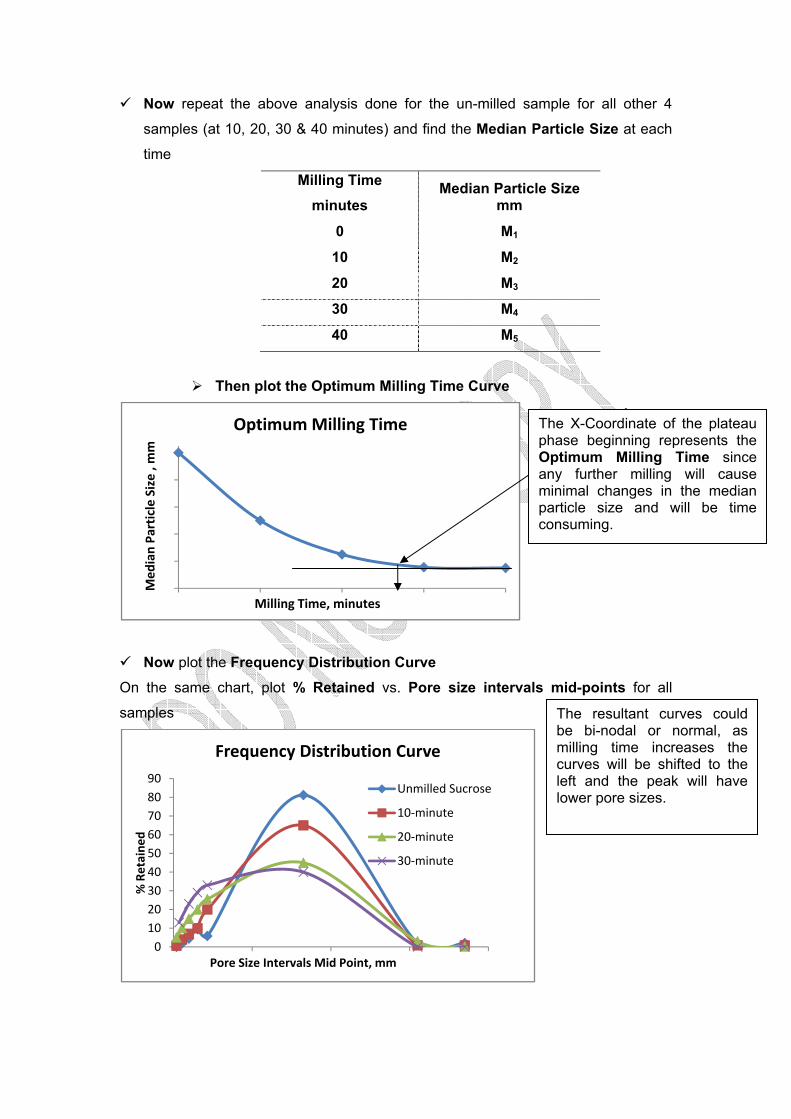
Now repeat the above analysis done for the un-milled sample for all other 4
samples (at 10, 20, 30 & 40 minutes) and find the Median Particle Size at each
time
Milling Time minutes
Median Particle Size mm
0 M1
10 M2
20 M3
30 M4
40 M5
Then plot the Optimum Milling Time Curve
Now plot the Frequency Distribution Curve
On the same chart, plot % Retained vs. Pore size intervals mid-points for all
samples
Med
ian Pa
rticle Size , m
m
Milling Time, minutes
Optimum Milling Time
0102030405060708090
% Retaine
d
Pore Size Intervals Mid Point, mm
Frequency Distribution Curve
Unmilled Sucrose
10‐minute
20‐minute
30‐minute
The X-Coordinate of the plateau phase beginning represents the Optimum Milling Time since any further milling will cause minimal changes in the median particle size and will be time consuming.
The resultant curves could be bi-nodal or normal, as milling time increases the curves will be shifted to the left and the peak will have lower pore sizes.
EXPERIMENT (3) GRANULATION OF POWDERS (GR)
INTRODUCTION: Granulation, the process for producing large aggregates from smaller particles, is
widely used in the pharmaceutical industry, especially in the manufacture of
compressed tablets. Granular materials have several advantages when compared
with fine powders:
1. Improved flow properties
2. Improved bonding properties
3. Increased densification, reduces the volume of bulk powders
4. Controlled size and shape
5. Segregation of incompatible components
6. Controlled porosity
7. Reduction of dust hazards
The production of granular materials can be achieved by dry or wet methods, the
later having more common usage in pharmaceutical systems.
The work, in this experiment, will be confined to an investigation of some of the
factors, which may influence the properties of granules when produced by a wet
process i.e. massing and screening. The granules will be stored for use in the
tableting experiment.
Granulation is also defined as the process of collecting particles together by creating
bonds between them. There are several different methods of granulation. The most
popular, which is used by over 70% of formulation in tablets manufacture is wet
granulation. Dry granulation is another method used to form granules.
Dry Granulation This process is used when the product needed to be granulated may be sensitive to
moisture and heat. Dry granulation can be conducted on a press using slugging
tooling or on a roller compactor commonly referred to as a chilsonator. Dry
granulation equipment offers a wide range of pressure and roll types to attain
densification. However, the process may require repeated compaction steps to attain
the proper granule end point.
Process times are often reduced and equipment requirements are streamlined;
therefore the cost is reduced. However, dry granulation often produces a higher
percentage of fine or non-compacted products, which could compromise the quality

or create yield problems for the tablet. It requires drugs or excipients with cohesive
properties.
Wet Granulation Wet granulation is a process of using a liquid binder or adhesive to the powder
mixture. The amount of liquid can be properly managed, and over wetting will cause
the granules to be too hard, and under wetting will cause them to be too soft and
friable. Aqueous solutions have the advantage of being safer to deal with than
solvents.
The problem that might appear during oven drying is when water moves from the
interior of the powder bed towards the hotter surface to evaporate; this creates
convection currents that, by mass flow, carry soluble drug or soluble dyes to the
surface. This leads to the formation of a depleted lower layer and enriched upper
layer. If proper mixing is not performed after such drying, dose non-uniformity and/or
mottling may result.

EXPERIMENTAL: a. Materials: Lactose, Starch Mucilage 7.5 gm% w/v, Sucrose Solution 50 gm% w/v. b. Apparatus:
- Erweka Kneader - Erweka Oscillating Granulator - Magnetic Hot Plate
c. Method:
NB: all equipment and tools should be cleaned prior to use.
1. Prepare the three binders to be evaluated:
a. Distilled Water
b. Sucrose Solution 50 gm% w/v: in a Erlenmeyer flask place 50 gm of coarse
sucrose, then add D.Water up to the 75-mL mark with continuous stirring, use
hot plate to accelerate the process, when sucrose completely dissolve,
complete the volume with D.Water up to the 100-mL mark, mix well then use.
c. Starch Mucilage 7.5 gm% (aqueous paste); disperse 7.5 gm of starch in up to
100 mL of D.Water in E.flask, then put the prepared dispersion on a magnetic
hot plate (use a magnetic bar inside the dispersion), continue warming the
dispersion with continuous stirring until a translucent paste is formed.
2. Pass enough large quantity of lactose through a 1.4 mm sieve to remove any
lumps or aggregates
3. Weigh 400 gm of the sieved lactose and transfer Erweka Kneader.
4. Start paste preparation by adding the binder (start with D.Water) portion-wise,
i.e. using a 10-mL measuring cylinder add several additions each of 3 mL of
D.Water every 30 second each time to different place, after each addition of
the binder cover the chamber and operate the kneader with medium velocity
for 30 seconds to 1 minute.
5. After the third addition and massing for 1 minute, turn the kneader off and test the
mixture for the end point, How?
The required end point is paste formation, which can be measured by taking
a mass from the mixture using your hand and squeezing it between the balm
and fingers, then hitting it with other hand index finger, if it remained coherent
and only broken from the peripheries then the end point is achieved, so return

the mass to the kneader and perform massing for extra 1 minute to ensure
homogeneity and get rid of any large agglomerate that might be formed.
If the squeezed mass break down completely, continue the addition of the
binder and check for end point using the above method after each addition till
end point is reached.
6. After achieving the end point, transfer the wet mass to an empty cleaned tray,
use spatula to completely remove the mixture from the kneader chamber.
7. Allow the paste to pass through the 1.6 mm sieve fitted to the Erweka Granulator
(oscillating granulator), collect the wet granules from the granulator in a pre-
weighed clean tray and spread to form a thin bed of granules.
8. Weigh the tray containing the wet granules, and record it as wet weight. 9. Dry the granules in preheated oven at 70 °C for 45 minutes.
10. After 45 minutes, remove the tray containing the dried granules from the oven
and record its weight as dry weight. 11. Pass the dry granules through 1.6 mm sieve fitted to the Erweka Granulator →
Re-granulation.
12. Put the granules in a appropriately labeled plastic bag (Granules A) and reserve
them in dry place closed place to be tested in Cycle 2.
13. Repeat steps 2 - 12 twice, first using Sucrose Solution 50 gm% w/v, and secondly
just enough Starch Mucilage 7.5 gm% w/v, (Granules B and Granules C),
respectively.
Results and Data Analysis Arrange your results and calculated numbers in table similar to the following: next
page
Evaluate the tested binders according to the following criteria:
1. % Yield per unit mass of the binder (the highest %Yield / 1 gm of the
binder is the best, Why?)
2. Granules Macroscopical Properties (shape, uniformity of shape,
size, uniformity of the size and size distribution, color, …)
Properties of granules due to the used binder.

Binder Type Granules End Point Tray Weight Wet Weight Dry Weight Practical Weight Theoretical Weight
% Yield % Yield per unit mass of Binder mL grams grams grams grams grams
Distilled Water A X T1 W1 D1 P1 = D1 - T1 %1
Sucrose Solution 50g% B Y T2 W2 D2 P2 = D2 - T2 %2
Starch Mucilage 7.5g% C Z T3 W3 D3 P3 = D3 - T3 %3
Theoretical Weight = Un-Granulated Powder Weight + Amount of used Binder
= Lactose (400 gm) + Amount of used Binder
For Granules A: Theoretical Wt = 400 gm + (X*Water Density) = 400 gm + (X*1 gm/mL)
For Granules B: Theoretical Wt = 400 gm + Sucrose Weight = 400 gm + (Y*50 gm/100mL)
For Granules C: Theoretical Wt = 400 gm + Starch Weight = 400 gm + (Z*7.5 gm/100mL)
% Yield =
*100%
% Yield per unit mass of binder = %
Example for Granules A: % Yield per unit mass of D.Water =
%/

EXPERIMENT (4) USP DISSOLUTION METHOD FOR PARACETAMOL 500 mg TABLETS
Acetaminophen: C8H9NO2
INTRODUCTION
The effectiveness of tablet or capsule dosage forms relies on the drug dissolving in
the fluid of GIT prior to Absorption into systemic circulation.
Tablet Dissolution is a standardized method for measuring the rate of drug release
from a dosage form. (Dissolution defined as the process by which a known amount of
drug substance goes into solution per unit of time under standardized conditions.)
The principle function of the dissolution test may be summarized as follows:
1. Optimization of therapeutic effectiveness during product development and
stability assessment.
2. Routine assessment of production quality to ensure uniformity between
production lots.
3. Assessment of "Bioequivalence", that is to say, production of the same
biological availability from discrete batches of products from one or different
manufacturers.
4. Prediction of "in-vivo" availability i.e. bioavailability (where applicable).
The rate at which a solid dissolves in a solvent was proposed by "Noyes and
Whitney" in 1897 and elaborated subsequently by other workers. The equation can
be written as:
A: surface area of exposed solid.
D: diffusion coefficient.
Cs: drug concentration in the diffusion layer (solubility of solid).
C: drug concentration in the bulk.
h: thickness of diffusion layer.
V: volume of the dissolution medium. it is in the equation to make unit of the
dissolution rate per unit volume.

During early phase of dissolution, Cs>>>C (sink condition) and Cs is set to equal
solubility in the dissolution medium (S), also A is considered constant thus the above
equation becomes:
, Where K is AD/ hV.
K is called the intrinsic dissolution rate constant. Hydrophilic drugs have high intrinsic
dissolution rate as they have high S, while hydrophobic drug has low intrinsic
dissolution rate.
* When K > 1, absorption process is not dissolution limited.
* When K < 1, absorption process is dissolution limited.
EXPERIMENTAL: a. Materials: Revanin® 500 mg tablets, Acetaminophen (Paracetamol) powder, Monobasic
Potassium Phosphate, Sodium Hydroxide
b. Apparatus:
- Dissolution Apparatus
- UV/VIS Spectrophotometer
- pH meter
c. Method: NB: all equipment and tools should be cleaned prior to use.
I. Dissolution Parameters:
Medium : Phosphate Buffer pH 5.8 Apparatus : Paddle Time : 30 minutes Volume : 900 mL RPM : 50 rpm Wavelength : at about 243 nm Temperature : 37 °C ± 0.5 °C Tolerance (Q) : 80%
II. Preparation of Phosphate Buffer pH 5.8 Solution: 1. Solution 1: Weigh accurately 20.42 grams of Monobasic Potassium Phosphate
(KH2PO4) and place it in 500 mL Volumetric Flask and adjust enough Double
Distilled Water to completely dissolve the powder then complete the volume up to
the 500 mL mark using D.D.Water.
2. Solution 2: Weigh accurately 0.43 grams Sodium Hydroxide (NaOH) and place it
in 250 mL Volumetric Flask and adjust enough Double Distilled Water to
completely dissolve the powder then complete the volume up to the 250 mL mark
using D.D.Water
3. Transfer solution 1 and solution 2 to 3-liter V.flask and complete the volume up
to the 3 liter mark with D.D.Water then mix well.
4. Adjust the pH of the solution to achieve pH = 5.8 ± 0.1, using Phosphoric acid (if
pH value where > 5.8) or NaOH solution (if pH value where < 5.8).
III. Procedure: 1. Turn the heater of the dissolution apparatus on and control the temperature to
achieve the specified value (37 °C).
2. Clean two vessels and in each of them place 900 mL of medium using
measuring cylinder.
3. Fix the paddles to be 25 ± 2 mm away from the bottom of vessel.
4. Start operating the paddles at 50 rpm rotational speed.
5. Place one Revanin® 500 mg tablet in each vessel (only two vessels will be
used) and immediately start timing.
NB: dissolution vessels should be covered to prevent evaporation of the dissolution medium and hence affecting the concentration.
6. After 30 minutes elapsed withdraw 5-mL sample from each vessel using a
volumetric pipette. Filter each sample to get rid of any un-dissolved particles
that may present in the sample) using filter paper (always discard the first
milliliter).
7. Dilute each sample, how? withdraw 1 mL using volumetric pipette from each
filtrate and place in a clean 50 mL volumetric flask then complete the volume up
to the 50 mL mark using the medium.
8. Read the absorbance of the diluted samples solutions at λ = 243 nm using the
medium (Phosphate Buffer pH = 5.8) as a blank.
IV. Preparation of Standard Solution:
Calibration Curve: a. Prepare 0.050gm% w/v of Acetaminophen in Phosphate Buffer pH 5.8
(place 50 mg Acetaminophen in 100 mL V.Flask, dissolve using few 10
mL of the solvent then complete volume up to the 100 mL mark with
Phosphate Buffer pH 5.8) → Standard Stock Solution
b. Withdraw 1, 2, 3 & 4 mL from the Standard Stock Solution and place
each in 50 mL V.Flask and complete the volume up to 50 mL mark with
Phosphate Buffer pH 5.8 → Standard Solutions
c. Measure the standard solutions absorbances using Phosphate Buffer pH
5.8 as a blank at λ = 243 nm.

Results and Data Analysis Calibration Curve Construction:
• Plot solutions absorbances vs their concentrations in gm%.
e.g. standard solution no. 1 concentration = 50 mg% / D.F = 1 mg
• Apply Beers Law to the calibration curve straight line equation as following:
A= a*b*C, where A is the Absorbance, a is absorptivity (slope of the straight line equation), b is cell bath (= 1 cm), and C is the concentration
of the substance of interest.
y = Slope x ‐ (Y‐intercept)R² = 0.9999
Absorba
nce
Concentration, mg%
Calibration Curve of 4‐Acetaminophenol in Phosphate Buffer pH=5.8 at λ = 254 nm
Slope = Absorptivity here Absoptivity is E% since the concentration unit is mg%. E% unit is (nm. mg%-1.cm-1)
D.F. (Dilution Factor)
=


Dissolution Samples Analysis
• Use E% (absorptivity) value from calibration curve to calculate concentrations in
mg% w/v of the mixing samples.
e.g. sample no. 1 concentration mg% w/v = % mg%
= % mg% * DF
• Calculate the total amount (in mg) dissolved in each vessel.
e.g. Vessel no. 1 amount (mg) = Vessel Concentration *
• Calculate the % Dissolved for each tablet using the following ratio:
%
%
• Discussion and interpretation of the data must be done according to the USP criteria
Diluted Sample Concentration
Vessel Concentration
D.F. (Dilution Factor)
=
Claimed amount is the labeled amount which is
equal to 500 mg
Acetaminophen Monograph
USP 30
Q = 80%

Pha
Departmen
armaceu
UnivFacu
t of Pharma
tical Tec
C
versity of Joulty of Pharmaceutical Sc
chnology
Cycle ( 2
ordan macy iences and
y Labora
)
Technology
tory Man
y
nual
EXPERIMENT (1) CHARACTERIZATION OF GRANULES (C.G)
INTRODUCTION:
The preparation of essentially all dosage forms involves the handling of solid
materials. Among all finished products, solid dosage forms are the most predominant
in terms of volume and value. The importance of solid-handling properties, especially
flow properties, cannot be overemphasized. The flow properties of solids have great
impact on the tableting and encapsulation processes since these dosage forms
manufacturing processes require flow of powder materials from a storage container
to filling station, such as tablets dies or capsule fillers. Weight uniformity of course is
dependent on the uniform and rapid flow of powders. The flow properties of solids
also have great influence on the mixing and de-mixing of powders that take place
before tableting or encapsulation.
There are some simple criteria that are useful to predict flow properties from
measurements made on static heap or bed of the powder and there are, listed below,
other tests may be included to characterize the granules.
1. Flow Rate 2. Angle of Repose 3. Bulk Density and Tapped Density 4. Moisture Content 5. Particle Size Analysis
Forces that can act between solid particles are: 1) Frictional Forces 2) Surface Tension Forces 3) Electrostatic Forces 4) Cohesive Forces 5) Mechanical Forces caused by interlocking of particles of irregular shape.
All of these forces can affect the flow properties of a solid. Surface-tension forces
between particles can be significant where capillary condensation can occur, and
small liquid bridges can be formed between particles if moisture content is high. On
the other hand, it should be taken into consideration that the usual presence of even
minute quantities of water is sufficient to minimize the effect of electrostatic forces.
With fine powders, the magnitude of friction and cohesive forces usually
predominate. For larger particles, such as granules, frictional forces normally
predominate over cohesive forces.
POWDER FLOW PROPERTIES
(1) Flow Rate: Flow Rate is defined as the amount of powders (in grams) allowed to flow/pass
through the funnel per time (in seconds) required to pass. Flow time is measured
using "Free Standing Cone and Fixed Funnel Method".
Types of granules according to their flow properties: freely flow-able granules,
granules need tapping to flow, Rat-hole pattern, and granules need tapping with rat-
holing pattern.
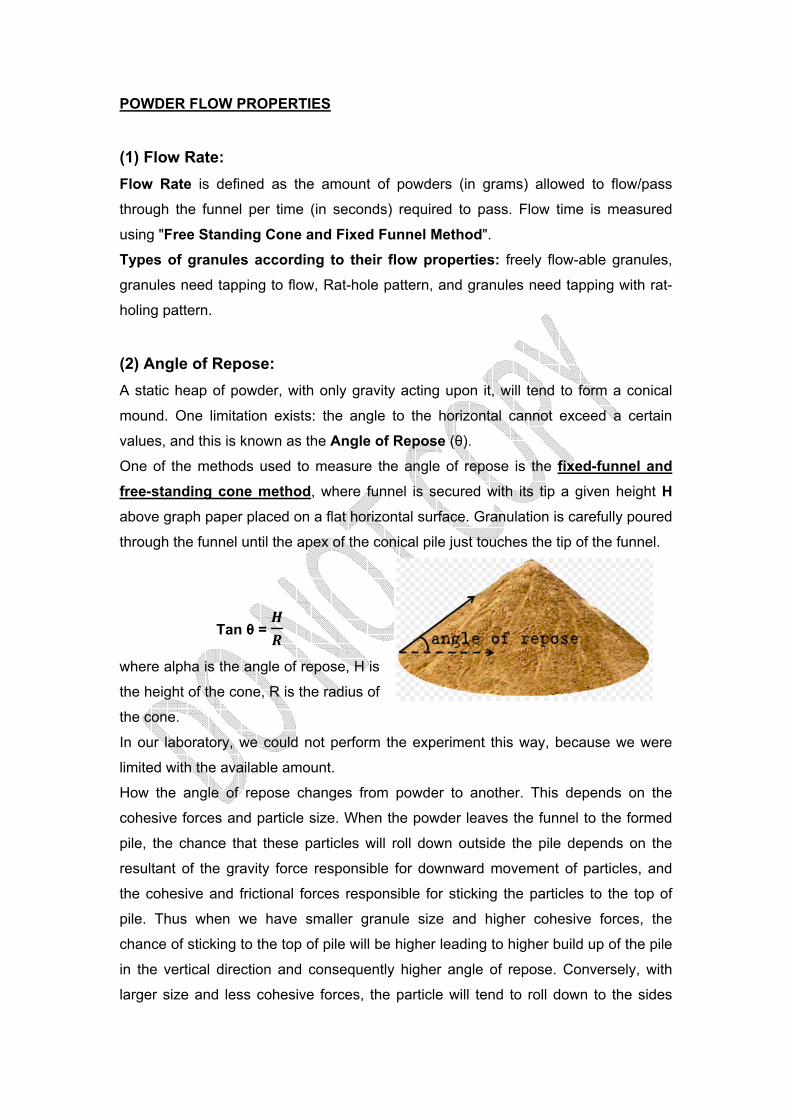
(2) Angle of Repose: A static heap of powder, with only gravity acting upon it, will tend to form a conical
mound. One limitation exists: the angle to the horizontal cannot exceed a certain
values, and this is known as the Angle of Repose (θ).
One of the methods used to measure the angle of repose is the fixed-funnel and free-standing cone method, where funnel is secured with its tip a given height H
above graph paper placed on a flat horizontal surface. Granulation is carefully poured
through the funnel until the apex of the conical pile just touches the tip of the funnel.
Tan θ =
where alpha is the angle of repose, H is
the height of the cone, R is the radius of
the cone.
In our laboratory, we could not perform the experiment this way, because we were
limited with the available amount.
How the angle of repose changes from powder to another. This depends on the
cohesive forces and particle size. When the powder leaves the funnel to the formed
pile, the chance that these particles will roll down outside the pile depends on the
resultant of the gravity force responsible for downward movement of particles, and
the cohesive and frictional forces responsible for sticking the particles to the top of
pile. Thus when we have smaller granule size and higher cohesive forces, the
chance of sticking to the top of pile will be higher leading to higher build up of the pile
in the vertical direction and consequently higher angle of repose. Conversely, with
larger size and less cohesive forces, the particle will tend to roll down to the sides

leading to spreading of the granules over wide area, which would lead to lower height
and wider diameter of the pile. Accordingly, the angle of repose will decrease. Values
for angle of repose ≤ 30° generally indicate a free-flowing material and angles ≥ 40°
suggest a poorly flowing material.
From the angle of repose and compressibility values, a reasonable indication of a
material's inherent flow properties should be possible. The important point is that one
can be misled if a judgment on flow-ability is based entirely on angle-of-repose
measurements. The angle of repose normally increases as particle size is reduced.
The angle of repose is inversely proportional to the size of the fine particles but is
directly proportional to their weight fraction.
If a Glidant is used, the angle of repose goes through a minimum and then increases
as Glidant concentration increases (why?)
When materials that take up moisture from the atmosphere are exposed to high
humidities, that material generally becomes more cohesive, and exhibit very poor
flow characteristics. As the storage humidity is increased, angle of repose increase. It
is noted that if particles become more irregular in shape, as a result the angle of
repose will be increased.
The angle of repose given in Table following may be used as a guide to flow.
Table : Angle of repose as an indication of powder flow properties
Angle of Repose (degrees) Type of Flow
< 20 Excellent
20 - 30 Good
30 - 34 Passable a
> 40 Very Poor a May be improved by Glidant, e.g. 0.2% Aerosil.
(2) Bulk and Tapped Density: The bulk and tapped density of pharmaceutical powders are often measured for
process ability. The tapped density is measured for two primary purposes: (i) the
tapped value is more reproducibly measured than the bulk value, and (ii) the "flow-
ability" of a powder is inferred from the ratio of these two measured densities.
The "tapped" density of pharmaceutical powder is determined using a tapped density
tester, which is set to tap the powder at a fixed impact force and frequency. The
methods for measurement in the U.S. pharmaceutical industry are specified in the
U.S. Pharmacopeia (USP). Tapped density by the USP method is determined by a
linear progression of the number of taps.

This is done by measuring the initial volume (Bulk Volume) of the sample and
recording its weight. From this data we can calculate the bulk density by:
Bulk Density = = grams per ml
and by measuring the volume after the system is allowed to tap until reaching a
constant volume (Tapped Volume) of the sample and by using these data we
calculate the tapped density by:
Tapped Density = = grams per ml
Pouring to the cylinder must not be directly into the cylinder. It has to be poured
through a funnel, which would allow for free flowing of individual particles, rather than
packed powder due to previous handling. After pouring, you may not have even
surface, which will make reading the volume difficult. For this, it is allowed or you to
make two taps by hand to make the surface even. Tapping should not produce
particle, or changes in particle size distribution of the tested material.
How the Bulk Density and Tapped Density change The most important factor that changes these densities is particle size distribution.
Suppose that we have two granules A and B. A has narrow particle size distribution
and B has wide particle size distribution. When A is poured and because of the
uniform particle size, the granules will arrange with same spaces that cannot be filled
with small particles, obviously because there are no fines to fill these spaces.
Accordingly, when this powder is tapped, small change in volume is expected, again
because there are no fine particles to move into the formed spaces upon pouring. On
the contrary, B upon pouring will have interspaces among the large particles than
between the small particles. The large spaces between the large particles will be
filled with the small particles upon tapping and consequently large reduction in the
volume is expected. The following figure illustrates this.
In Summary;
• If our granules have large uniform particle size distribution, then initially they will
have optimum arrangement, thus tapped volume will not markedly change.
• On the other hand, if our formula possesses lots of fines, the material can be
compressed to less volume by tapping.
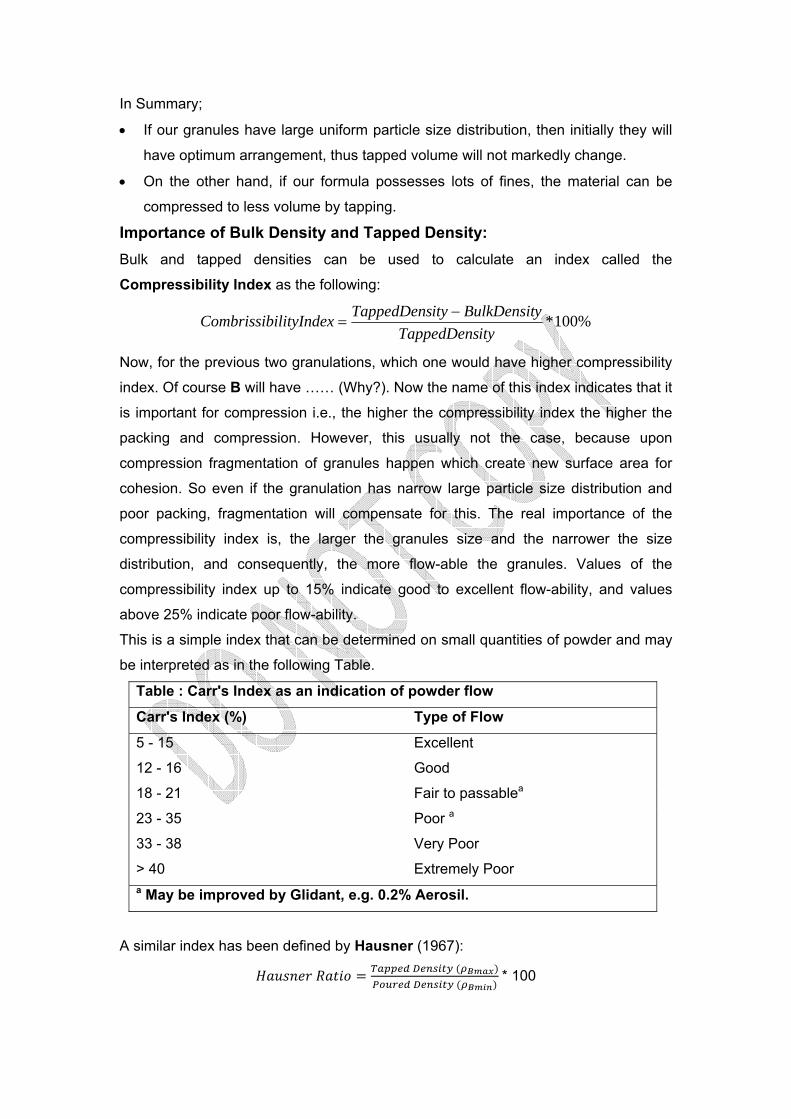
Importance of Bulk Density and Tapped Density: Bulk and tapped densities can be used to calculate an index called the
Compressibility Index as the following:
%100*ityTappedDens
yBulkDensitityTappedDensilityIndexCombrissib −=
Now, for the previous two granulations, which one would have higher compressibility
index. Of course B will have …… (Why?). Now the name of this index indicates that it
is important for compression i.e., the higher the compressibility index the higher the
packing and compression. However, this usually not the case, because upon
compression fragmentation of granules happen which create new surface area for
cohesion. So even if the granulation has narrow large particle size distribution and
poor packing, fragmentation will compensate for this. The real importance of the
compressibility index is, the larger the granules size and the narrower the size
distribution, and consequently, the more flow-able the granules. Values of the
compressibility index up to 15% indicate good to excellent flow-ability, and values
above 25% indicate poor flow-ability.
This is a simple index that can be determined on small quantities of powder and may
be interpreted as in the following Table.
Table : Carr's Index as an indication of powder flow
Carr's Index (%) Type of Flow
5 - 15 Excellent
12 - 16 Good
18 - 21 Fair to passablea
23 - 35 Poor a
33 - 38 Very Poor
> 40 Extremely Poor a May be improved by Glidant, e.g. 0.2% Aerosil.
A similar index has been defined by Hausner (1967):
* 100
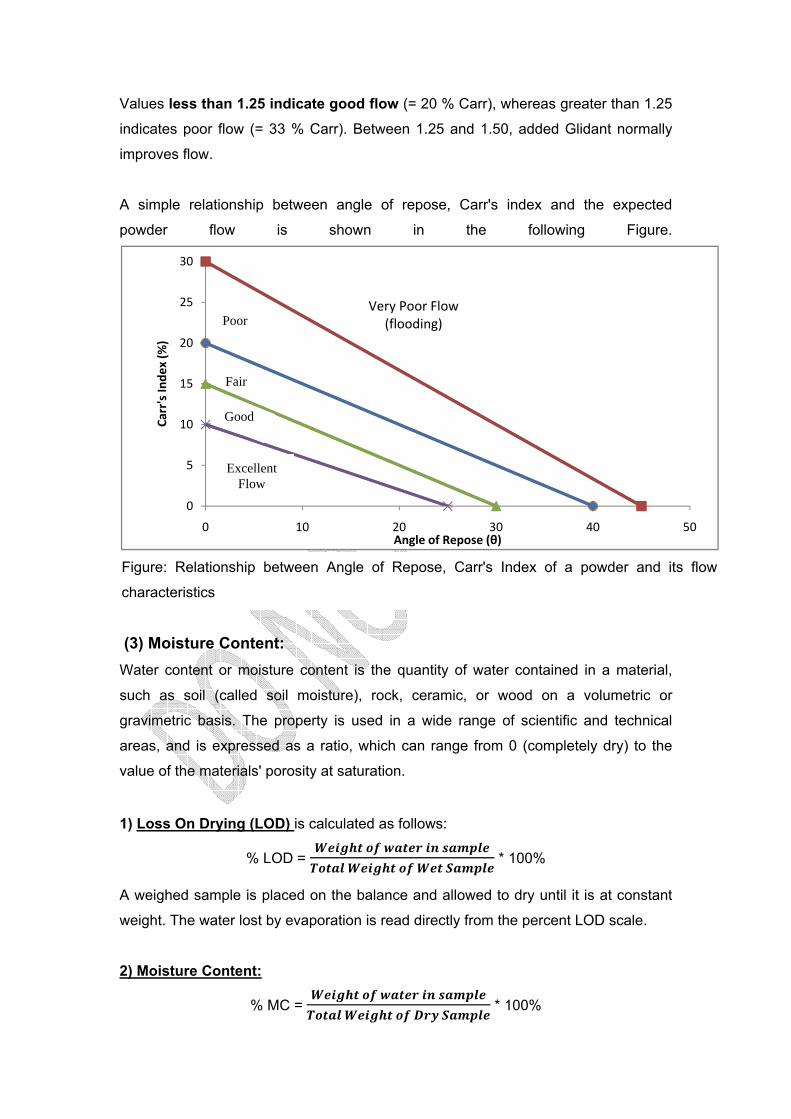
Values less than 1.25 indicate good flow (= 20 % Carr), whereas greater than 1.25
indicates poor flow (= 33 % Carr). Between 1.25 and 1.50, added Glidant normally
improves flow.
A simple relationship between angle of repose, Carr's index and the expected
powder flow is shown in the following Figure.
(3) Moisture Content: Water content or moisture content is the quantity of water contained in a material,
such as soil (called soil moisture), rock, ceramic, or wood on a volumetric or
gravimetric basis. The property is used in a wide range of scientific and technical
areas, and is expressed as a ratio, which can range from 0 (completely dry) to the
value of the materials' porosity at saturation.
1) Loss On Drying (LOD) is calculated as follows:
% LOD =
* 100%
A weighed sample is placed on the balance and allowed to dry until it is at constant
weight. The water lost by evaporation is read directly from the percent LOD scale.
2) Moisture Content:
% MC =
* 100%
0
5
10
15
20
25
30
0 10 20 30 40 50
Carr's In
dex (%
)
Angle of Repose (θ)
Very Poor Flow (flooding)
Figure: Relationship between Angle of Repose, Carr's Index of a powder and its flow
characteristics
Good
Fair
Poor
Excellent Flow
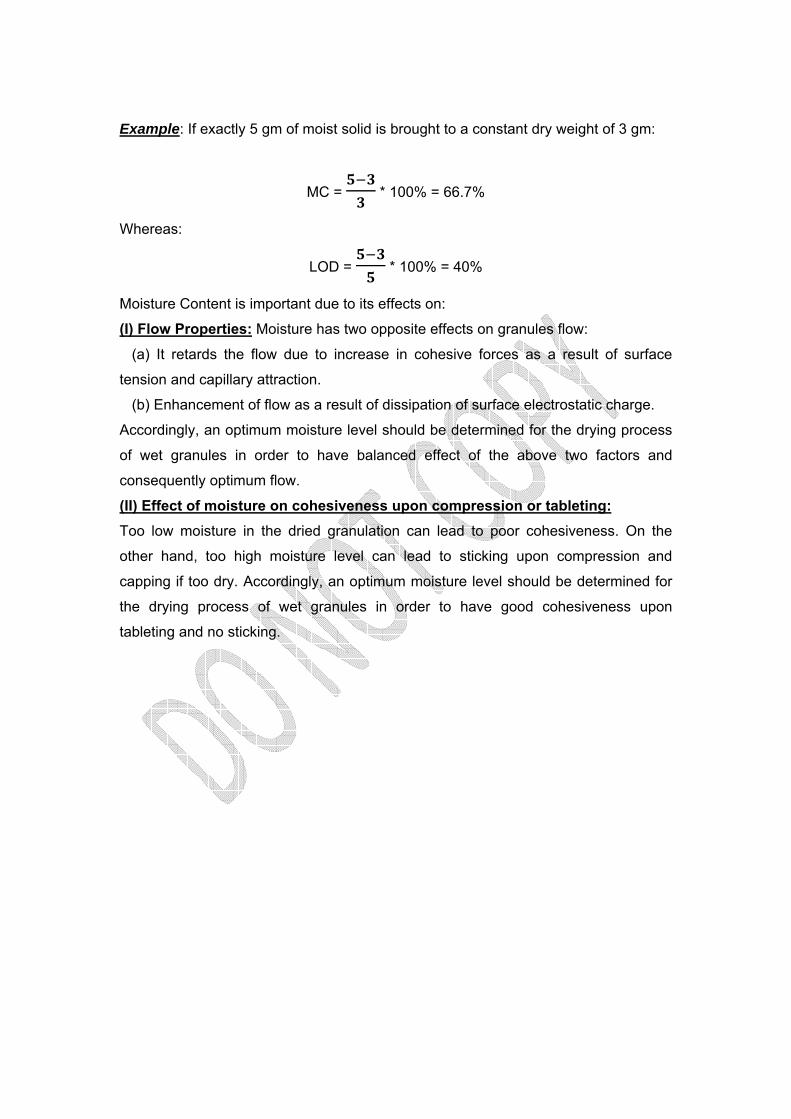
Example: If exactly 5 gm of moist solid is brought to a constant dry weight of 3 gm:
MC = * 100% = 66.7%
Whereas:
LOD = * 100% = 40%
Moisture Content is important due to its effects on:
(I) Flow Properties: Moisture has two opposite effects on granules flow:
(a) It retards the flow due to increase in cohesive forces as a result of surface
tension and capillary attraction.
(b) Enhancement of flow as a result of dissipation of surface electrostatic charge.
Accordingly, an optimum moisture level should be determined for the drying process
of wet granules in order to have balanced effect of the above two factors and
consequently optimum flow.
(II) Effect of moisture on cohesiveness upon compression or tableting: Too low moisture in the dried granulation can lead to poor cohesiveness. On the
other hand, too high moisture level can lead to sticking upon compression and
capping if too dry. Accordingly, an optimum moisture level should be determined for
the drying process of wet granules in order to have good cohesiveness upon
tableting and no sticking.
EXPERIMENTAL: a. Materials: Granules A, b, & C from Experimental Granulation (Experiment 3) (Cycle 1). b. Apparatus: Flow Rate Apparatus, Funnel, Bulk Density Apparatus, Jolting Sieving Apparatus, Moisture Content Determination Apparatus.
c. Method:
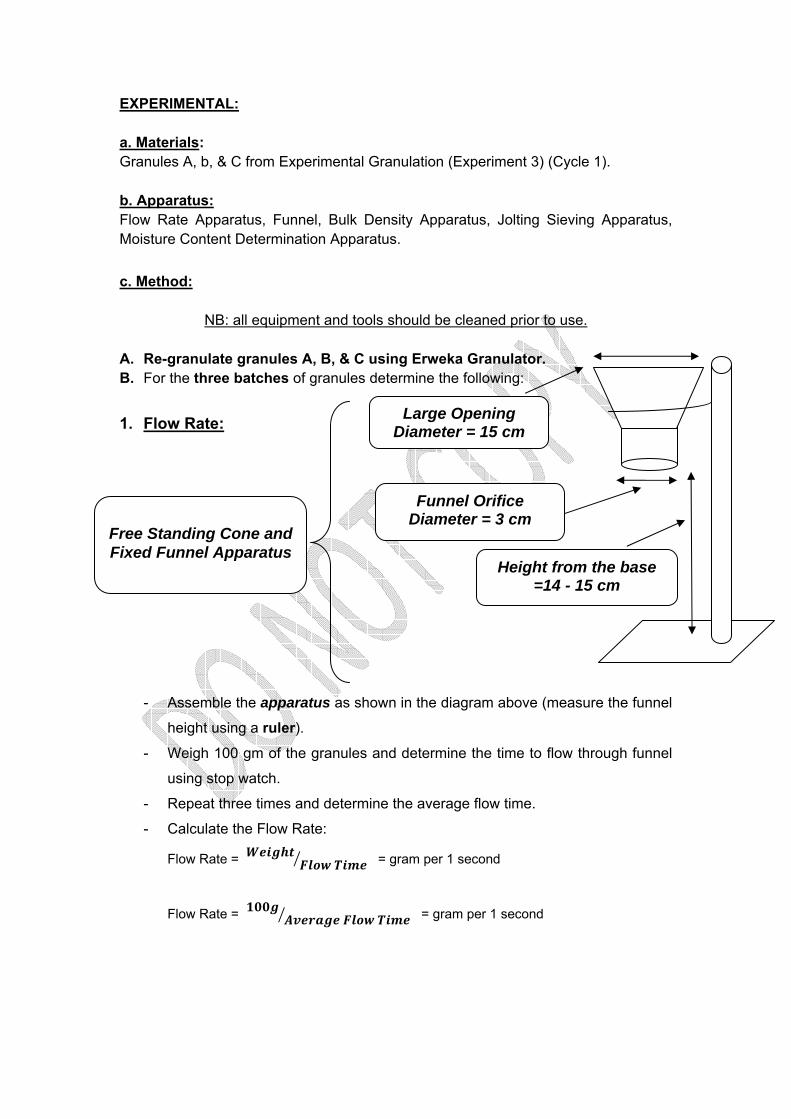
NB: all equipment and tools should be cleaned prior to use. A. Re-granulate granules A, B, & C using Erweka Granulator. B. For the three batches of granules determine the following:
1. Flow Rate:
- Assemble the apparatus as shown in the diagram above (measure the funnel
height using a ruler). - Weigh 100 gm of the granules and determine the time to flow through funnel
using stop watch.
- Repeat three times and determine the average flow time.
- Calculate the Flow Rate:
Flow Rate = = gram per 1 second
Flow Rate = = gram per 1 second
Large Opening Diameter = 15 cm
Funnel Orifice Diameter = 3 cm
Height from the base =14 - 15 cm
Free Standing Cone and Fixed Funnel Apparatus
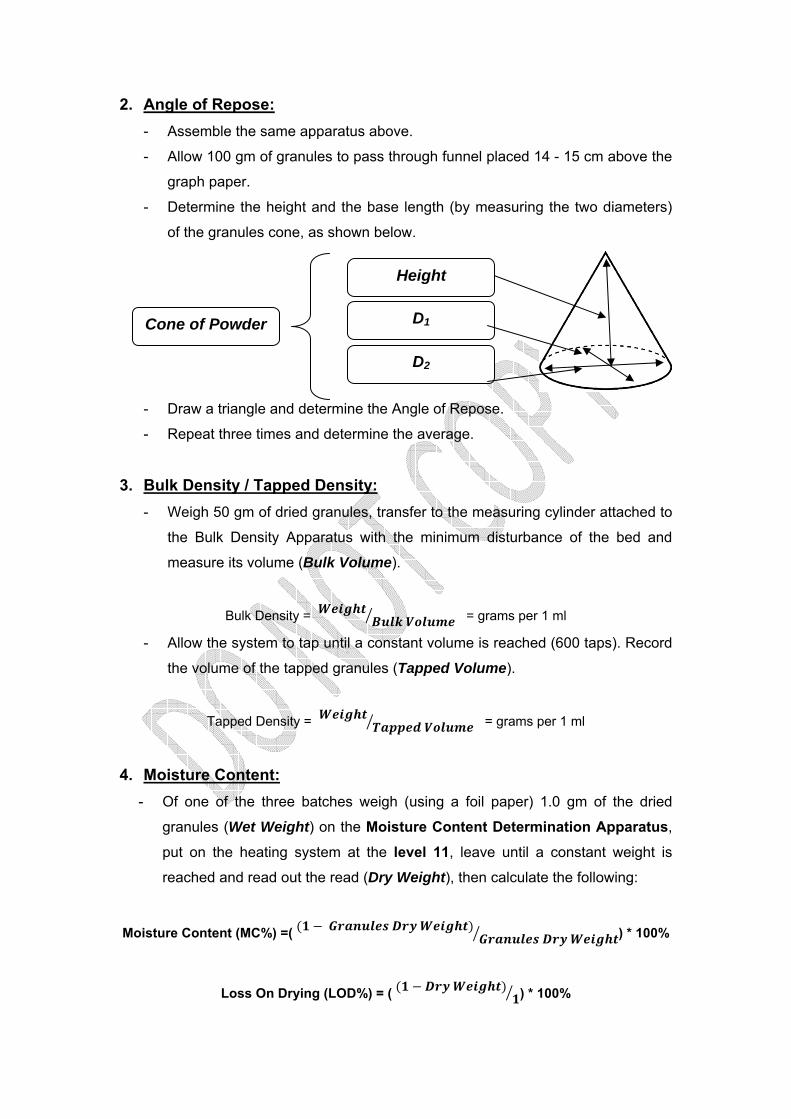
2. Angle of Repose: - Assemble the same apparatus above.
- Allow 100 gm of granules to pass through funnel placed 14 - 15 cm above the
graph paper.
- Determine the height and the base length (by measuring the two diameters)
of the granules cone, as shown below.
- Draw a triangle and determine the Angle of Repose.
- Repeat three times and determine the average.
3. Bulk Density / Tapped Density: - Weigh 50 gm of dried granules, transfer to the measuring cylinder attached to
the Bulk Density Apparatus with the minimum disturbance of the bed and
measure its volume (Bulk Volume).
Bulk Density = = grams per 1 ml
- Allow the system to tap until a constant volume is reached (600 taps). Record
the volume of the tapped granules (Tapped Volume).
Tapped Density = = grams per 1 ml
4. Moisture Content: - Of one of the three batches weigh (using a foil paper) 1.0 gm of the dried
granules (Wet Weight) on the Moisture Content Determination Apparatus,
put on the heating system at the level 11, leave until a constant weight is
reached and read out the read (Dry Weight), then calculate the following:
Moisture Content (MC%) =( ) * 100%
Loss On Drying (LOD%) = ( ) * 100%
Cone of Powder
D2
D1
Height

5. Particle Size Analysis: - Arrange the sieves on the Jolting Sieve Shaker on order of aperture size, with the
largest pore size in the top and the receiver at the bottom after recording their
tare weights.
- Sieves to be used are 1.4, 1.00, 0.500, 0.250, & 0.125 mm with collecting pan.
- Transfer 50 gm of the granules on top of the upper sieve; allow for 10 minutes
agitation and then stop sieving.
- Weigh the size fractions including any fine powder collected in the receiver
(gross weights).

Results and Data Analysis Flow Rate Analysis:
Granules Amount Tested Gm
Flow Time, Seconds Flow Rate gm/second Code Binder Trial 1 Trial 2 Trial 3 Average
A Distilled Water a1 a2 a3 a\
B Sucrose b1 b2 b3 b\
C Starch c1 c2 c3 c\
Bulk and Tapped Densities Analysis:
Granules Amount Tested
gm
Volume, mL Density, gm/mL Compressibility Index, % Code Binder Bulk Tapped Bulk Tapped
A Distilled Water 50 X Y B T
B Sucrose
C Starch
Sample Weight which is equal to 100 grams
Flow Rate =
gm/second Here;
Flow Rate =
gm/second
Example;
Granules A Flow Rate = \ gm/second
Bulk Density=
= gm/mL Here,
Bulk Density=
= B gm/mL
Tapped Density=
= gm/mL Here,
Bulk Density= = T gm/mL
Compressibility Index=
*100%
Here,
CI %= *100%

Angle of Repose Analysis:
granules Diameter, cm Radius cm
Height, cm Angle of Repose
Code Binder Trial 1 Trial 2 Trial 3 Average Diameter
Trial 1
Trial 2
Trial 3 Average Tan θ θ D1 D2 Average1 D1 D2 Average2 D1 D2 Average3
A D.Water
B Sucrose
C Starch
Lactose
Average = Average Diameter =
Radius =
Tan θ =
Average Height =
θ = θ

Moisture Content Analysis:
Granules Wet Weight, gm Dry Weight, gm MC % LOD %
Code Binder
A Distilled Water ≈ 1
B Sucrose ≈ 1
C Starch ≈ 1
Lactose ≈ 1
Particle Size Analysis:
Apply particle size analysis method used in (Cycle 1, Experiment 2) to find the median particle size for each of the prepared granules.
NB: Use the following sieves pore sizes:
DISCUSSION: Record your results and compare the findings between the three granules, justifying
the differences.
MC% =
* 100%
LOD% = * 100%

EXPERIMENT (2) EFFECT OF ADDITIVES ON THE PHYSICSL PROPERTIES OF
GRANULES (A.G)
INTRODUCTION:
There are many formulation additives and process variables involved in the
granulation step; and all of these can affect the characteristics of the granulation
produced. Therefore methods to measure certain granulation characteristics have
been developed to monitor granulation suitability for tableting.
1. Effect of Glidant:
A glidant (also known as Flow Promoter) is a substance that is added to a powder
to improve its flowability. A glidant will only work at a certain range of concentrations.
Above a certain concentration, the glidant will in fact function to inhibit flowability
(Which means that there's a critical concentration to be used if increasing powder's
flowability is intended with respect to the glidant and the powder properties). In tablet
manufacture, glidants are usually added just prior to compression.
Examples of glidants include magnesium stearate, Aerosil (colloidal silicon dioxide),
starch and talc.
Mechanism of Action: A Glidant's effect is due to a counter-action to factors
resulting in poor flowability of powders. For instance, correcting surface irregularity,
reducing interparticular friction and decreasing surface charge. The result is a
decrease in the angle of repose which is an indication of an enhanced powder's
flowability.
2. Effect of Lubricant:
A lubricant is a substance introduced to reduce friction between moving surfaces. It
may also have the function of transporting foreign particles and of distributing heat.
The property of reducing friction is known as lubricity. In pharmaceutical industry
lubricants are used to reduce powder-metal friction during compression (to prevent
sticking of granules with die and punches upon tableting process) which means
decrease adherence of particles to machines. In tablet manufacture, lubricants are

usually added just prior to compression (the lowest effective concentration and
minimal mixing time) and if not two unwanted effect will result:
a. Reducing the hardness of tablets by decreasing the bonding between
granules, resulting in brittle tablets.
b. Reducing dissolution rate: coating of granules especially with hydrophobic
lubricants.
For example, Mg-Stearate acts as lubricant only up to 1%, if added in more than 1%
→ hydrophobic layers will be formed at surfaces → retardation of disintegration and
dissolution.
3. Effect of Disintegrant:
Disintegrants assist the disruption of the tablet when in contact with gastro-intestinal
fluids.
Disintegrants expand and dissolve when wet, causing the tablet to break apart in the
digestive tract, releasing the active ingredients for absorption. Disintegrant types
include:
• Water uptake facilitators
• Tablet rupture promoters
They ensure that when the tablet is in contact with water, it rapidly breaks down into
smaller fragments, facilitating dissolution.
Examples of disintegrants include:
• Starch and other cellulose derivatives
• Crosslinked polymers: crosslinkedpolyvinylpyrrolidone (crospovidone),
crosslinked sodium carboxymethyl cellulose (croscarmellose sodium).
• The modified starchsodium starch glycolate...
NB.
Disintegrant will not affect flow until being added in high concentration, e.g. Starch is
used in ratios 5 - 10%

EXPERIMENTAL:
a. Materials: Granules A, b, & C from Experimental Granulation (Experiment 3) (Cycle 1), Talc,
Mg-Stearate
b. Apparatus: Flow Rate Apparatus, Funnel, Bulk Density Apparatus.
c. Method: NB: all equipment and tools should be cleaned prior to use.
Re-granulate granules B using Erweka Granulator.
1. Effect of Glidant: - Prepare the following mixtures of Talc in Granules B (total mixture weight is
100 grams).
Mixture (1): 0.50 % w/w Talc in Granules B:
In a plastic bag put 99.50 grams of Granules B and 0.50 gram Talc
then mix well and test the resulted mixture for:
a. Flow Rate
b. Angle of Repose
c. Bulk and Tapped Density
NB.
• Use the same procedure used in experiment 1 in this cycle.
• All powders should be reserved and collected carefully to be used in mixture (2) preparation
Mixture (2): 1.00 % w/w Talc in Granules B:
In a plastic bag put mixture (1) and 0.50 gram Talc then mix well and
test the resulted mixture for:
a. Flow Rate
b. Angle of Repose
c. Bulk and Tapped Density
NB.
• Use the same procedure used in experiment 1 in this cycle.

• All powders should be reserved and collected carefully to be used in mixture
(3) preparation
Mixture (3): 3.00 % w/w Talc in Granules B:
In a plastic bag put mixture (2) and 2.00 grams Talc then mix well
and test the resulted mixture for:
a. Flow Rate
b. Angle of Repose
c. Bulk and Tapped Density
NB.
• Use the same procedure used in experiment 1 in this cycle.
• All powders should be reserved and collected carefully to be used in mixture
(4) preparation
Mixture (4): 6.00 % w/w Talc in Granules B:
In a plastic bag put mixture (3) and 3.00 grams Talc then mix well
and test the resulted mixture for:
a. Flow Rate
b. Angle of Repose
c. Bulk and Tapped Density
NB.
• Use the same procedure used in experiment 1 in this cycle.
2. Effect of Lubricant: - Prepare the following mixtures of Mg-Stearate in Granules B (total mixture
weight is 100 grams).
Mixture (1): 0.25 % w/w Talc in Granules B:
In a plastic bag put 99.75 grams of granules B and 0.25 gram Mg-
Stearate then mix well and test the resulted mixture for:
a. Flow Rate
b. Angle of Repose
c. Bulk and Tapped Density
NB.
• Use the same procedure used in experiment 1 in this cycle.
• All powders should be reserved and collected carefully to be used in mixture
(2) preparation

Mixture (2): 0.50 % w/w Talc in Granules B:
In a plastic bag put mixture (1) and 0.25 gram Mg-Stearate then mix
well and test the resulted mixture for:
a. Flow Rate
b. Angle of Repose
c. Bulk and Tapped Density
NB.
• Use the same procedure used in experiment 1 in this cycle.
• All powders should be reserved and collected carefully to be used in mixture
(3) preparation
Mixture (3): 0.50 % w/w Talc in Granules B:
In a plastic bag put mixture (2) and 0.50 gram Mg-Stearate then mix
well and test the resulted mixture for:
a. Flow Rate
b. Angle of Repose
c. Bulk and Tapped Density
NB.
• Use the same procedure used in experiment 1 in this cycle.

Results and Data Analysis
Use the same equations and method used in experiment 1of this Cycle to find
out the flow properties measured.
A. Effect of Glidant:
1. Talc Effect on Flow Rate:
Talc % w/w Amount Tested
gm Flow Time, Seconds Flow Rate
gm/second Trial 1 Trial 2 Trial 3 Average
0.50
1.00
3.00
6.00
2. Talc Effect on Bulk and Tapped Densities:
Talc % w/w Amount Tested
Gm
Volume, mL Density, gm/mL Compressibility Index, % Bulk Tapped Bulk Tapped
0.50
1.00
3.00
6.00

3. Talc Effect on Flow Rate:
Talc % w/w Diameter, cm Radius
cm
Height, cm Angle of Repose
Trial 1 Trial 2 Trial 3 Average Diameter
Trial 1
Trial 2
Trial 3 Average Tan
θ θ D1 D2 Average1 D1 D2 Average2 D1 D2 Average3 0.50
1.00
3.00
6.00

B. Effect of Lubricant: 1. Mg-Stearate Effect on Flow Rate:
2. Mg-Stearate Effect on Bulk and Tapped Densities:
Talc % w/w Amount Tested
Gm
Volume, mL Density, gm/mL Compressibility Index, % Bulk Tapped Bulk Tapped
0.50
1.00
3.00
6.00
3. Mg-Stearate Effect on Angle of Repose:
Next Page
DISCUSSION:
1. Record your results and compare the findings between the different additive
concentrations.
2. Discuss your findings and propose a formula of good granules for tableting.
3. List other Glidants, Lubricants, and Disintegrants, and there useful
concentrations.
Mg-Stearate % w/w Amount Tested
Gm Flow Time, Seconds Flow Rate
gm/second Trial 1 Trial 2 Trial 3 Average
0.25
0.50
1.00

3. Mg-Stearate Effect on Flow Rate:
Mg-Stearate % w/w
Diameter, cm Radius cm
Height, cm Angle of Repose
Trial 1 Trial 2 Trial 3 Average Diameter
Trial 1
Trial 2
Trial 3 Average Tan
θ θ D1 D2 Average1 D1 D2 Average2 D1 D2 Average30.25
0.50
1.00

EXPERIMENT (3) QUALITY CONTROL OF TABLETS (Q.C.)
INTRODUCTION: The manufacturer must give his assurance that the final product is of suitable
quality. Several Quality Control Test are performed, each batch of tablets is
released, such tests may include: Weight Uniformity, Content Uniformity, Friability
Test, Disintegration, and Dissolution Test.
These tests categorized as following: A. Official Pharmacopial Tests:
1. Uniformity of Weight (BP).
2. Uniformity of Drug Content (BP & USP).
3. Disintegration Test (BP & USP).
4. Dissolution Rate (BP & USP).
B. Non-Official (Non-Pharmacopial) Tests:
1. Hardness (Crushing Strength).
2. Friability (become official in USP 1995).
3. Uniformity of Thickness.
1. Friability Test: It is another measure of tablet's strength and it is related to a tablet's ability to with
stand both shock and abrasion without crumbing during the handling of
manufacturing, packaging, shipment, and consumer use.
Instrument and Method: Instrument: Roche Friabilator.
Method: this device subjects a number of tablets (minimum weight = 6.5 gm) to the
compined effects of abrasion & shockey utilizing a plastic chamber which revolves at
25 rpm dropping the tablets a distance of 6 inch with each revolution. Normally, a
prewighed tablets sample is placed in the friabilator, which is then operated for 100
revolutions. The tablets then are dusted & reweighed. Conventional compressed
tablets that lose less than .5 to 1 5% in weight are generally acceptable. Some
chewable tablets & most effervescent tablets would have higher friability weight
losses, which accounts for the special stack packaging that may be required. When

capping is observed during friability testing; the tablet shouldn't be considered
acceptable, regardless of what the % weight loss result in.
Tablets friability may also influence by the moisture content of the tablets granulation
in the finished tablets. A low but acceptable moisture level frequently serves to act as
a binder. Very dry granulation that contain only fractional percentages of moisture will
often produce more friable tablets than will granules containing 2 to 4 % moisture.
2. Disintegration Time: For most tablets the first important steps in order to enter the solution is the
breakdown of the tablet in to smaller particles or granules, this process is known as
disintegration. The time that it takes a tablet to disintegrate is measured in a device
described in the Pharmacopeias.
Apparatus: The USP has long had a device to test disintegration. The device uses six glass
tubes, three in long open at the top & held against a 10-mesh screen at the bottom
end of the basket rack assembly. To test for disintegration time, one tablet is placed
in each test tube, and the basket rack is positioned in one-liter beaker of water, or
simulated gastric or intestinal fluid at 37± 2°C such that the tablet remain 2.5 cm
below the surface of the liquid on their upward movement and descent not closer
than 2.5 cm from the bottom of the beaker.
Perforated plastic disks may also be used in the test. These are placed on the top of
the tablets and impart an abrasive action to the tablets. The disks may or may not be
meaningful or impart more sensitivity to the test, but they are useful for tablets that
float.
The End Point: To be in compliance with USP standards, the tablets must disintegrate and all
particles pass through the 10-mesh screen in the time specified. if any residue
remains, it must have a soft mass with no palpably firm core.
Factors affect Disintegration Time: It has been established that one should not expect a correlation between
Disintegration & Dissolution. However, since the dissolution of a drug from the
fragmented tablet appears to partially or completely control the appearance of the
drug in the blood, disintegration is still used as a guide to the formulator in the
preparation of an optimum tablet formula and as in-process control test to ensure lot-
to-lot uniformity.
The formulator should be aware that the medium used, the temperature of the
medium, and the operator recording the results can have a significant effect on

disintegration time. In addition many factors involved with a tablet's formula and
method of manufacture can affect the disintegration such factors are: the nature of
the drug, the diluents used, the binder and its amount, the type and amount of
disintegrating agent, the type and amount of disintegrating agent, the type of amount
of lubricant, as well as the method of incorporation for all of these additives. The
compaction pressure used to make the tablets also influences the disintegration, in
general disintegration time's increase with an increase in pressure.
3. Thickness Uniformity: Tablets thickness should be controlled with 5% or less of a standard value. Any
variation in tablet thickness should not be apparent to the unaided eye to maintain
product acceptance by consumer as well as to facilitate packaging.
At constant compressive load, tablet thickness varies with changes in die fill and
tablet weight. Whereas, with a constant die fill, thickness varies in variation in
compressive load.
Three set of factors influence tablet thickness and tablet thickness control: 1. The physical properties of raw materials including crystal form and true bulk
density.
2. Control of upper and lower punch lengths, which should be standardized.
3. The granulation prosperities including bulk density, tapped density, particle size,
and particle size distribution.
4. Tablet Hardness: Tablet hardness is defined as the force required to break a tablet in a diametrical
compression test. A tablet requires a certain amount of strength or hardness to
withstand mechanical shocks of handling in its manufacturing, packaging, and
shipping. More recently, the relationship and importance of hardness as it may
influence disintegration and perhaps more significantly, drug dissolution rate, become
apparent.
Apparatus To perform this test, a tablet is placed between two anvils. Pressure is applied to the
anvils, and the crushing strength that just causes the tablet to break is recorded.
Hardness is thus sometimes termed "Tablets Crushing Strength".
Factors Affect Tablet Hardness:

The hardness of a tablet is a function of many things all working together. The three
factors that were noted in the tablet thickness may also produce variation in tablet
hardness.
Hardness is a function of the applied pressure and is therefore a function of those
factors which cause the force to vary. As additional pressure is applied to make a
tablet, the hardness values increase, this relationship olds up the maximum value
beyond which increases in pressure cause the tablet to laminate or cap, thus
destroying the integrity of the tablet.
Tablets generally are harder several hours after compression than they are
immediately after compression. Lubricant can affect the tablet hardness when used
in too high concentration or mixed for too long period. The lubricant will coat the
granules and interfere with tablet bonding.
Larger tablet require a greater force to cause fractures (harder) than small tablet.
An appropriate balance between a minimally acceptable tablet hardness to produce
an adequate friability value and a maximum acceptable tablet hardness to achieve
adequate tablet dissolution may be required.
5. Weight Variation: In manufacturing of tablet our aim is to produce tablet product that can be validated
as to its safety, efficacy, and reliability; so each tablet is designed to have certain
weight and to heck the uniformity of weight we fined in different pharmacopeias a
method for weight variation as follows:
Method: The test is run by weighing 20 tablets individually, calculating the average weight,
and comparing the individual tablet weights to the average (as a percent of the
average weight of the sample). The tablets meet the USP weight variation test if no
more than two tablets are outside the percentage limit and no tablet differs by more
than twice the percentage limit. The weight variation tolerance for uncoated tablets
differs depending on average tablet weight:
Average Weight of Tablets (mg)
Maximum Percentage Difference Allowed
130 or less 10
130 to 324 7.5
More than 324 5

The weight variation test is a satisfactory method of determining content uniformity of
tablets if
(1) The tablet is all-drug or essentially (90-95%) all-active ingredient, or
(2) The uniformity of drug distribution of the granulation or powder from which the
tablets are made is perfect.
The weight variation test is not sufficient to assure uniform potency of moderate to
low-dose drugs, in which excipients make up the bulk of the tablet weight.
Causes of Weight Variation: Causes weight variation can be separated into granulation problems and mechanical
problems. The actual weight of the tablet is determined by geometry of the die and
the position of the lower punch in the die as dictated by the weight adjustment cam. If
everything is working well mechanically, the weight can be caused to vary by poorly
flowing granules, which causes a spasmodic filling of the dies. The improper mixing
of the Glidant into the granulation can influence the weight variation by not allowing
for uniform flow. If the granule particle size is too great for the die size, the dies will
not be uniformly filled, causing weight variation. Granulation that have a wide particle
size distribution which is resulted when a granulation has been thoroughly mixed or
when the granulation has been stored in an area where vibrations were present to
cause segregation of particles. Can have a localized non-uniformity of density in the
granulation and with fixed geometry this will cause varying amounts of granulation to
fill the dies, causing weight variation. Also as the particle shape became more
angular, the weight variation increased.
Mechanical problems can cause weight variation with a good granulation. A set of
lower punches of non-uniform length will cause weight variation, as will lower
punches that are dirty enough to restrict their movement to their lowest point during
die fill. A cupped lower punch that gets filled in with a sticking granulation will cause
weight variation.

EXPERIMENTAL: a. Materials: tablets b. Apparatus: Disintegration Tester, Hardness Tester.
c. Method: NB: all equipment and tools should be cleaned prior to use.
1. Friability Test:
a. Place 6.5 grams of tested tablets (record this weight as tablets intial weight) in the drum of the Roche Friabilator and close it.
b. Operate the instrument for 4 minutes using 25 rpm as rotational
speed.
c. After the time elapsed remove the tablets and dust them using a
brush.
d. Examine the tablets for any sign of capping, breakage, or breakage.
e. Weigh the tablet and record the weight as tablets final weight. f. Calculate the Percentage Weight Loss using the following equation
Percentage Weight Loss =
* 100%
2. Hardness Test: a. Using the Hardness Tester, measure the hardness for 10 tablets.
b. Calculate the mean, standard deviation, and relative standard
deviation of the tested values.
3. Disintegration Test: a. In the six cylinders of the Disintegration Tester "Rigid Basket Rack
Assembly” place 6 of the tested tablets.
b. Use the disintegration medium specified by BP.
c. Start testing the tablets, commence disintegration with timing.
d. Record disintegration time in minutes and calculate the average
Disintegration Time.
e. Compare your results with the BP specification.
4. Weight Variation Test: a. Measure the weight of 20 tablets of the tested tablets, weight should
be measured in milligrams.

b. Calculate the Average Tablets Weight in grams.
c. For each tablet of the 20 tested tablets calculate the Maximum Percentage Difference Allowed.
Maximum Percentage Difference Allowed
=
* 100%
d. Interpretation of the results should be done according to table under
weight variation section above.
5. Thickness Variation Test: a. Measure the thickness of 10 tablets of the tested tablets using the
Caliber as directed by your instructor.
b. Calculate the mean, standard deviation, and relative standard
deviation of the tested values.

Arrange your results in the following tables and calculate the required values
using equations mentioned in the procedure section.
1. Friability Test:
Initial Weight (grams)
Final Weight (grams)
Observation (Yes or No)
Capping Lamination Breakage
2. Weight Variation Test:
Tablet Number Tablet weight gm
Maximum Percentage Difference Allowed
1 2 3 4 5 6 7 8 9
10 11 12 13 14 15 16 17 18 19 20
Average Tablet Weight, gm

3. Hardness Test:
Tablet Number Tablet Hardness kP
1 2 3 4 5 6 7 8 9
10 Average Tablet Hardness, kP
Standard Deviation
RSD
4. Thickness Variation Test:
Tablet Number Tablet Thickness mm
1 2 3 4 5 6 7 8 9
10 Average Tablet Thickness, mm

5. Disintegration Test:
Tablet Number Disintegration Time Seconds
1 2 3 4 5 6
Average Disintegration Time, Seconds
DISCUSSION:
Discuss your findings in accordance to Pharmacopoeial specifications.

Pha
Departmen
armaceu
TABLET
UnivFacu
t of Pharma
tical Tec
C
TS PREP
versity of Joulty of Pharmaceutical Sc
chnology
Cycle ( 3
PARATIO
ordan macy iences and
y Labora
)
ON AND T
Technology
tory Man
TESTING
y
nual
G

IntAfte
gran
tabl
you
form
man
hard
Ob
Diss
NB.
% Dissolved
roductioer you hav
nulation, siz
ets (hardne
gained f
mulation, a
nufacturing
dness, disin
bjective a. Prepa
diluen
b. Using
c. Cons
solution Pro
On the sam
0
20
40
60
80
100
120
0 1
TABLET
on ve been e
ze reductio
ess, weight
from the p
a procedu
you need
ntegration a
aration of f
nts.
g "Hydraulic
structing a "
ofile showin
me graph d
2 3
MultiP
EXTS PREP
exposed to
n and partic
variability e
previous tw
re to ma
d to test
and multipoi
four differe
c Press" to c
Multipoint D
g Percent D
raw the diss
4 5 6
Tim
Points Dis
XPERIMEPARATIO
o various
cle size an
etc.), In this
wo cycles
anufacture
the tablet
nt dissolutio
ent direct c
compress a
Dissolution P
Dissolved vs
solution cur
6 7 8
me, hours
ssolution
ENT ON AND T
pharmaceu
alysis), and
s cycle, you
in sugges
the formu
ts specifica
on).
ompression
at least three
Profile" four
s. Time:
rves for eac
9 10 1
n Profile
TESTING
utical opera
d to quality
u will apply
sting direc
ulation and
ations (we
n formulae
e tablets of
r the collect
ch formulatio
11 12 13
G
ations (mix
control tes
the knowle
ct compres
d after ta
ight variab
using diffe
f each formu
ted data.
on.
xing,
ts of
edge
ssion
ablet
bility,
erent
ula.

Functions of Excipients: Avicel: ……………………………………………………………………
Lactose: ………………………………………………………………….
Starch: ……………………………………………………………………
Mg-Stearate: ……………………………………………………………...
HPMC: ……………………………………………………………………
DCP (Di-Calcium Phosphate): ………………………………………….
Concepts • Immediate-Release: drug is released rapidly from the dosage form (Solution
(instantaneous release), Suspension, Disintegrating Tablets, etc.)
• Delayed Release: delay in the onset of drug release; e.g. enteric-coated tablets
(will be studied in "Practical Pharmaceutical Technology II")
• Sustained /Extended-Release: prolonged (slowed down) release from dosage
form.
Controlled-Release: special type of S.R. where release is zero-order.
0
10
20
30
40
50
60
70
80
90
100
0 1 2 3 4 5 6 7 8 9 10 11 12 13 14 15 16 17 18 19 20 21 22 23 24
% Dissolved
Time, hours
MultiPoints Dissolution Profile
Immediate
Delayed
Sustained
Controlled

EXPERIMENTAL: a. Materials: Paracetamol
Avicel 101:
Mg-Stearate:
Starch:
Lactose:
HydroxyPropylMethylCellulose (HPMC):
DiCalciumPhosphate (DCP):
b. Apparatus:
• Hydraulic Press Single Punch press machine, for research purposes mainly.
• Dissolution Apparatus. • Rotary Multi-Station Tableting Machine
c. Method:
• Targets: ‐ Batch Size = 10 grams ‐ Tablet Weight = 600 mg ‐ Drug Potency= 200 mg (Active Ingredient per tablet) ‐ Tablet Diameter = 12 mm ‐ Compression Force = 10 KN
• Sampling Methodology: ‐ Sample Volume: 5 mL ‐ Time Points: 15 minutes, 30 minutes, 45 minutes, 1 hour, 1.50 hour, 2 hours ‐ Method: with replacement of equal volume from fresh medium kept at the
same tempreture.
• Formula: General Formula
Ingredients % w/w Amount per tablet (per 600 mg)
Amount per Batch (per 10 gm)
Paracetamol 200 mg per tablet 200 mg 3.333 gm Starch 5% w/w 30 mg 0.500 gm Avicel 101 10% w/w 60 mg 1.000 gm Mg-Stearate 1% w/w 6 mg 0.100 gm Diluent q.s 100% 304 mg 5.067 gm

You are about to prepare the following four formulas:
Formula A
Paracetamol 200 mg per tablet Starch 5% w/w Avicel 101 10% w/w Mg-Stearate 1% w/w Lactose q.s 100%
Formula B
Paracetamol 200 mg per tablet Starch 5% w/w Avicel 101 10% w/w Mg-Stearate 1% w/w DCP q.s 100%
Formula C
Paracetamol 200 mg per tablet Starch 5% w/w Avicel 101 10% w/w Mg-Stearate 1% w/w HPMC q.s 100%
Formula D
Paracetamol 200 mg per tablet Starch 5% w/w Avicel 101 10% w/w Mg-Stearate 1% w/w Lactose : HPMC in 1:1 ratio
q.s 100%
Procedure:
NB: all equipment and tools should be cleaned prior to use. • Tablets Preparation:
1. Sieve all ingredients using 1.4 mm mesh.
2. Weigh the required amounts to prepare 10 grams mixture.
3. Mix all ingredients, except Mg-stearate, together in a plastic bag for three
minutes.
4. Add Mg-Stearate and mix for 30 seconds (maximum 1 minute), why?
5. Weigh 600 mg of the mixture prepared above (three weights each of 600 mg).
6. Compress the three tablets using hydraulic press (follow the instructions of
your instructor).

7. Reserve the prepared tablets for dissolution testing (next practical session).
• Tablets Testing (Dissolution Testing): 1. Weigh each tablet and record its weight.
2. Perform dissolution testing using the same procedure parameters in
experiment 4, cycle 1.
3. Use the sampling methodology described above.

Results and Data Analysis
• Use the following calibration curve to do find out the samples concentrations.
• Calculate % Dissolved for each sample as described in table next page.
• Construct a Multipoint Dissolution Profile as follow:
y = 565.00x + 0.0195R² = 0.9999
0
0.2
0.4
0.6
0.8
1
0 0.0005 0.001 0.0015 0.002
Absorba
nce
Concentration, gm%
Calibration Curve of 4‐Acetaminophenol in Phosphate Buffer pH=5.8 at λ = 243 nm
0102030405060708090100
0 0.5 1 1.5 2
% Dissolved
Sampling Time, hours
Paracetamol in Phosphate Buffer pH 5.8, 50 rpm, 37 °C(USP method)
Lactose Tablet
HPMC Tablet
DCP Tablet
Lactose:HPMC Tablet

Dissolution Samples Analysis
Sampling Time Absorbance
Dilution
Factor
Concentration, mg% w/v Amount Dissolved, mg Percentage
Dissolved minutes hours Diluted before dilution in 5 mL sample in 900 mL Total
0 0 0 0 0 0 0 0 0
15 0.25 Abs1 DF1 C1=A1/E% CV1=C1*DF1 as1=CV1*5mL/100 mL Am1=CV1*900mL/100mL T1=Am1
30 0.50 Abs2 DF2 C2=A2/E% CV2=C2*DF2 as2=CV2*5mL/100 mL Am2=CV2*900mL/100mL T2=Am2+as1
45 0.75 Abs3 DF3 C3=A3/E% CV3=C3*DF3 as3=CV3*5mL/100 mL Am3=CV3*900mL/100mL T3=Am3+as1+as1
60 1.00 Abs4 DF4 C4=A4/E% CV4=C4*DF4 as4=CV4*5mL/100 mL Am4=CV4*900mL/100mL T4=Am4+as1+as1+as3
90 1.50 Abs5 DF5 C5=A5/E% CV5=C5*DF5 as5=CV5*5mL/100 mL Am5=CV5*900mL/100mL T5=Am5+as1+as1+as3+as4
120 2.00 Abs6 DF6 C6=A6/E% CV6=C6*DF6 as6=CV6*5mL/100 mL Am6=CV6*900mL/100mL T6=Am6+as1+as1+as3+as4+as6
%Dissolved = ,
, * 100%
Here…..
%Dissolved = ,
, * 100%
Example at 1.5 hour:
%Dissolved1.5 = ,
* 100%
Active ingredient in the tested tablet (mg) = tablet weight * ratio of the active in the tablet
Here…… Active ingredient in the tested tablet
= tablet weight * mg

DISCUSSION: • Co-relate each profile to the components of different formulas.
• Compare the resulted dissolution profiles to each other.
• Comment on your results.