failure prediction modeling of power plant emission control systems
TRANSCRIPT

Students
Insiyah Aratsu Sean Irish
Dave Belanger Satyam Kaneria
John Bouikidis Brett McQuillan
Zachary Capps Lavesh Mohinani
Cari Hesser Jay Patel
IPRO 303
2009
IPRO 303
Adviser : Edmund Feldy
Sponsor: SmartSignal
Failure Prediction
Modeling of Power Plant
Emission Control Systems
Failure Prediction Modeling of Power Plant Emission Control Systems | IPRO 303 |
Table of Contents 2 of 34
Failure Prediction Modeling of Power Plant Emission Control Systems | IPRO 303 |
Table of Contents 2 of 34
Table of Contents
TABLE OF CONTENTS ............................................................................................................. 2
ADDENDA .............................................................................................................................. 3
TABLE OF FIGURES ................................................................................................................. 4
ABSTRACT ............................................................................................................................. 5
BACKGROUND ....................................................................................................................... 5
OBJECTIVES ........................................................................................................................... 6
METHODOLOGY .................................................................................................................... 6
TEAM STRUCTURE AND ASSIGNMENTS .................................................................................. 9
BUDGET .............................................................................................................................. 11
ETHICS ................................................................................................................................. 11
RESULTS .............................................................................................................................. 12
ELECTROSTATIC PRECIPITATORS (ESPS) ...................................................................................... 12
BAGHOUSES ........................................................................................................................ 17
SELECTIVE CATALYTIC REDUCERS (SCRS) ..................................................................................... 20
WET SCRUBBERS (FGD) ......................................................................................................... 24
OBSTACLES .......................................................................................................................... 29
RECOMMENDATIONS: ......................................................................................................... 30
REFERENCES: ....................................................................................................................... 31
RESOURCES: ........................................................................................................................ 33
ACKNOWLEDGEMENTS: ....................................................................................................... 34

Failure Prediction Modeling of Power Plant Emission Control Systems | IPRO 303 |
Addenda 3 of 34
Failure Prediction Modeling of Power Plant Emission Control Systems | IPRO 303 |
Addenda 3 of 34
Addenda The following are suggested resources and referenced to in this report that have been included. They are
excellent sources to seek for additional information.
Babcock Power_SCR_basic.pdf
A presentation outlining the operation of Selective Catalytic Reduction in Babcock Power Plants
Crawford Tour_Environmental.ppt
Midwest Generation’s presentation on the environmental control systems in their Crawford plant.
ESP_Failures_Table.pdf
A table from a ESP Operation and Maintenance class listing common failures and problems.
FGD Operation Manual.pdf
An EPA inspection manual for FGD systems.
Final_Presentation_Edited(4.30.09_9am).ppt
Our presentation to IPRO on our research and achievements.
Pleasant Prairie Power Plant.pdf
A pamphlets outlining the advancements of We Energies flagship power plant.
Practical Problems with Electrostatic Precipitators.pdf
A technical report from the Hammon Group on the common problems with the design and operation of
ESPs.
EPA IL State Sulfur Regulations.pdf
A report from the EPA on Illinois’s State regulations on Sulfur emissions.
Impact-of-FGD-Systems.pdf
A report from the Muscatine Board of Power and Water under the commission of the North American
Electric Reliability Council on the reliability of FGD systems.
Mercury Emission Control In Coal-Fired Plants.pdf
A report detailing the use of Wet Scrubbers for Mercury control.
Self-Cleaning Filters Unclog Wet Scrubbers.pdf
An article on equipment used in the maintenance of Wet Scrubbers.
FGD_Operating_Experience_in Existing Plants.pdf
An article reviewing the use of Wet Scrubbers treating a variety of pollutants.
Scott Patulski Interview Notes.pdf
Notes from an interview with a contact from We Energies.
SCR Cost Data.pdf
A report detailing cost analysis of Selective Catalytic Reduction systems.
Control and Instrumentation of FGD.pdf
A technical report on the controls and instrumentation of FGD systems.

Failure Prediction Modeling of Power Plant Emission Control Systems | IPRO 303 |
Table of Figures 4 of 34
Failure Prediction Modeling of Power Plant Emission Control Systems | IPRO 303 |
Table of Figures 4 of 34
Table of Figures
FIGURE 1: GANTT CHART ....................................................................................................... 8
FIGURE 2: TEAM STRUCTURE CHART ...................................................................................... 9
FIGURE 3: TEAM STRUCTURE FLOW DIAGRAM ..................................................................... 10
FIGURE 4: BUDGET............................................................................................................... 11
FIGURE 5: ETHICS PERSPECTIVES .......................................................................................... 11
FIGURE 6: ELECTROSTATIC PRECIPITATOR ............................................................................ 13
FIGURE 7: ESP FAILURE CHART ............................................................................................. 15
FIGURE 8: BAGHOUSE DIAGRAM.......................................................................................... 17
FIGURE 9: BAGHOUSE FAILURE CHART ................................................................................. 18
FIGURE 10: SELECTIVE CATALYTIC REDUCTION SCHEMATIC .................................................. 20
FIGURE 11: SCR FAILURE CHART ........................................................................................... 22
FIGURE 12: NOX REGULATION CHART .................................................................................. 23
FIGURE 13: WET SCRUBBER, FGD SPRAY TOWER .................................................................. 25
FIGURE 14: WET SCRUBBER FGD SCHEMATIC ....................................................................... 26
FIGURE 15: WET SCRUBBER FAILURE CHART ........................................................................ 28

Failure Prediction Modeling of Power Plant Emission Control Systems | IPRO 303 |
Abstract 5 of 34
Failure Prediction Modeling of Power Plant Emission Control Systems | IPRO 303 |
Abstract 5 of 34
Abstract IPRO 303, Spring 2009, was tasked with gathering information about the emission control systems of
coal fired power plants by their sponsor SmartSignal. SmartSignal is a company who uses software to do
predictive maintenance on a number of industries, from airlines to power generators. SmartSignal
wished to expand into the air emissions control systems of coal fired power plants. They asked the group
to research the major subsystems of air emissions control systems and the laws that go along with each
system. Having been assigned these tasks, the group broke up into different sub teams to accomplish the
goals. The following paper outlines the groups response to SmartSignal's request, included is the process
that was used to obtain results and the results obtained.
Background Sponsor Information: SmartSignal is a corporation that provides applications to increase equipment
performance by means of predictive analysis. SmartSignal’s solution analyzes information gathered from
equipment in power plants, monitors behavior of the plant as a whole, and identifies the risk of failures.
SmartSignal’s clients include a number of major power plants nationwide and worldwide. The company
is located in Lisle, Illinois.
Current User Problems: Power Plants need to meet regulations assigned by local governments by
reducing the expulsion of pollutants, and to detect failures of equipment that could potentially cost
millions of dollars.
Sources Used: The team proceeded with their research through online databases and books on power
plants and emission control. We used primary sources by visiting local power plants and interviewing
staff.
Other Attempts to Solve the Problem: SmartSignal currently offers their services to the generation side
of power plants. On the emission and the pollution control side of power generation most plants monitor
the final emissions and perform manual inspections of the control equipment.
Ethical Issues: SmartSignal operates in a competitive market and any classified or sensitive information
or documents obtained from the SmartSignal Company will be kept confidential and will not be disclosed
to anyone outside the project team. Also SmartSignal specifically asked that their involvement as a
sponsor NOT be disclosed outside the IIT community.
Business Cost: Failures on the emission control side of a power plant can have great societal and
business costs. If pollutants are released above the prescribed regulations the health of nearby
communities may be put in jeopardy. Crops and plant life may also suffer due to an excess of pollutants.
Globally, the pollutants may spread further and may have global warming effects. The direct business
costs to power plants can total in the millions. Pollution controls are often entire buildings themselves
and costs millions of dollars to build. When they malfunction the repairs and fines for breaking
regulations can cost the power plant as well. Additionally plants often will reduce production or shut
down in order to fix failures. This can lead to excessive costs to supply the needed power to their
customers or even lead to brown outs.

Failure Prediction Modeling of Power Plant Emission Control Systems | IPRO 303 |
Objectives 6 of 34
Failure Prediction Modeling of Power Plant Emission Control Systems | IPRO 303 |
Objectives 6 of 34
Implementation of the Solution: Our team researched these control systems for SmartSignal. From that
point we made recommendations on how SmartSignal may implement their product and present their
services to this sector of the market.
Similar Solutions Proposed: SmartSignal offers a unique and cutting-edge approach to predicting
failures. Historically power plants monitor control systems in house and utilize manual inspections to
predict failures in their control equipment. SmartSignal hopes to improve failure prediction on emission
control systems.
Objectives The main goal of IPRO 303 is to investigate how SmartSignal’s modeling technology can provide value
in detecting problems on environmental systems: The main objectives that SmartSignal would like for the
team to investigate are:
· What are the regulatory drivers – changes in laws/regulation occurring at various points in time?
Are the regulations fleet-wide or regionally specific? Can credits be traded? Etc.
· What types of systems are being deployed to remove what pollutants? Describe different sub-
types and configurations within a type of system, and how common they are.
· How much instrumentation is available on these systems, and what signals are measured
(temperature, pressure, chemistry analysis, etc.)? How much diversity is there in the levels of
available instrumentation?
· What are the failure and performance degradation problems that occur? How common are they?
What are the ramifications of these problems – outages, derates, having to burn more expensive
fuel or turn up the “peaking” generation units that are more expensive to run, etc.?
· How can the available instrumentation be used to remotely monitor and detect developing
problems?
SmartSignal would also like for us to compile a catalogue of information we find and the sources which
are helpful for future research. We will submit a report that covers the overall findings of the research
and provides any other supplemental information.
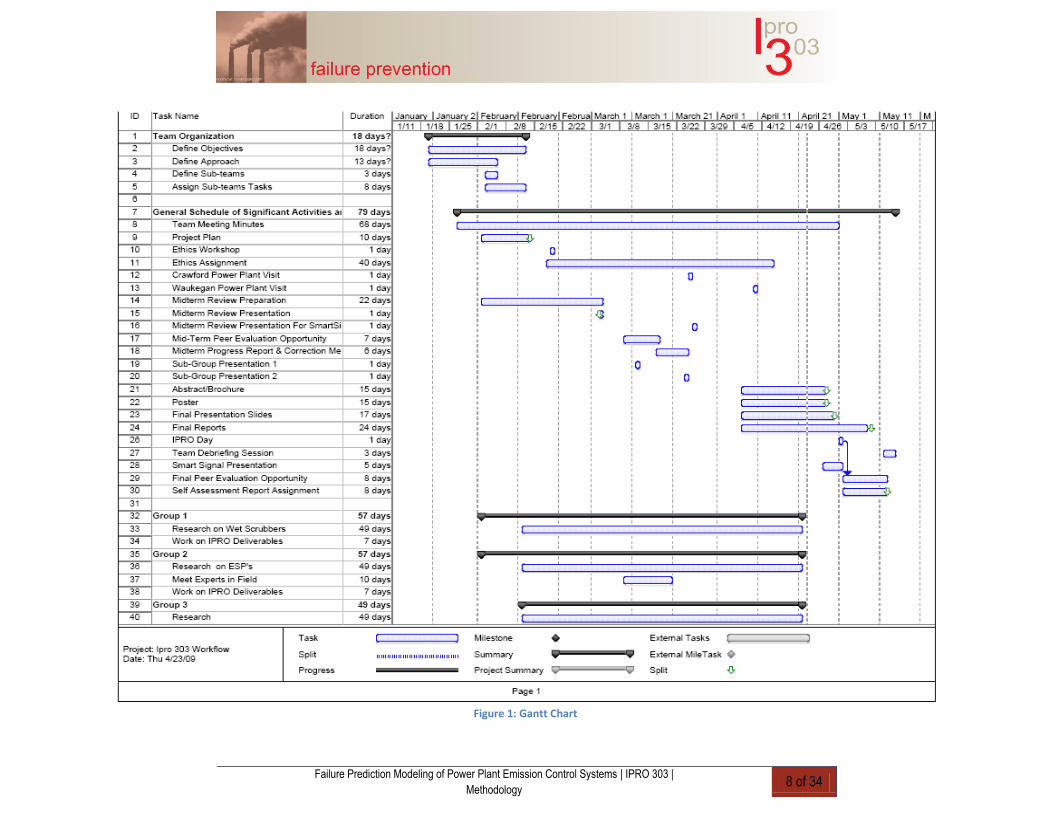
Methodology The methodology of the project was changed slightly from the beginning of the project. The main
reasons for these changes were to include more specific tasks, add additional tasks that the group
completed over the semester, and allow for a realistic work time for each task. The Gantt Chart provided
in section E below reflects these additions and modifications to the work breakdown structure. Of note is
the difference between the actual completion dates of tasks, and the original proposed completion dates.
At the beginning of the semester, it was the aim of the group to have all tasks completed two weeks
before the final due date so as to avoid rushing to complete tasks at the last possible time. A breakdown
of the stages of the group’s research is as follows:
A. Defining the problems: SmartSignal, our sponsor, provides software to aid in predicting equipment
failure on the generation side of power plants and wished to break into the emissions control side. It was
the wish of SmartSignal for the group to investigate the opportunities for SmartSignal modeling
technology to provide value in detecting problems on environmental systems. They provided us with five
specific topics to research:

Failure Prediction Modeling of Power Plant Emission Control Systems | IPRO 303 |
Methodology 7 of 34
Failure Prediction Modeling of Power Plant Emission Control Systems | IPRO 303 |
Methodology 7 of 34
· Emissions regulations for coal fired power plants
· Different emissions control systems
· Instrumentation available for the control systems and what it measures
· Common failures and degradations of the control systems
· Relate indications from instrumentation to specific failures of the control systems
B. Gathering research: SmartSignal wanted emphasis to be placed on the last three tasks, but first a
base knowledge of each system had to be acquired, thus the first stage of research involved finding:
· Which pollutant each control system regulates
· The regulation processes of each control system
· Different configurations of the emissions control systems
Once the group gained a basic knowledge of the systems, the final three tasks could become the focus of
the research.
C. Initial data compilation and feedback: The group’s research was compiled in a report which served
as both the midterm report and a team progress report. The sponsor was contacted to provide feedback as
to the direction the project had been going and where it was headed.
D. IPRO Day: As the project did not produce a working prototype, the results of the semester were
exhibited using tables and pictures. The project goals and conclusions were included in the final
presentations and exhibit.
E. Work Breakdown Structure: The Breakdown Structure of the work that was done by the group is
given in the Gantt Chart below:
Failure Prediction Modeling of Power Plant Emission Control Systems | IPRO 303 |
Methodology 8 of 34
Figure 1: Gantt Chart

Failure Prediction Modeling of Power Plant Emission Control Systems | IPRO 303 |
Team Structure and Assignments 9 of 34
Failure Prediction Modeling of Power Plant Emission Control Systems | IPRO 303 |
Team Structure and Assignments 9 of 34
Team Structure and Assignments As a team we addressed the issues of team structure and task assignment through a series of steps. At
first we operated with no formal leader or team structure and relied on a group consensus and then by a
vote as a last resort. Each team member put forth a data sheet detailing their expertise and skills. We
started assigning tasks through volunteering and consensus on which member was the most qualified to
complete the task. Insiyah Aratsu and Sean Irish, our two Architects, volunteered their design experience
to develop a team logo. Lavesh Mohinani and Jay Patel offered to provide a Gantt Chart for the group.
Satyam Kaneria and Jay Patel took charge of managing our iGroups files. Zachary Capps and John
Bouikidis began attempting to contact Power Plants to set up a tour. The rest of the team began to focus
on preliminary research and preparing the Project Plan. Next, we divided ourselves into three subgroups
to tackle research. Each subgroup was focused on a specific topic our sponsor had asked us to
investigate. These subgroups were Electrostatic Precipitators/Baghouses, Selective Catalytic Reducers
and Wet Scrubbers. This method provided a high quality of work, but low efficiency. By midterm we
had decided that a formal group leader should be chosen to direct the overall organization and provide a
vision for our final result. This decision would also increase the efficiency of our progress. Brett
McQuillan volunteered to be the overall leader and the decision was agreed upon by consensus. Subtasks
were then defined in greater detail and each subgroup chose a leader as well. A second third phase of our
organization was developed and is detailed in the table below. After a brief meeting with our sponsor, we
redoubled our research efforts to meet their needs.
Team Structure Chart
Phase I: Research Wet Scrubbers ESPs/Baghouses SCRs Insiyah Arastu *Zachary Capps Dave Belanger John Bouikidis Satyam Kaneria Cari Hesser
*Brett McQuillan Lavesh Mohinani *Sean Irish Jay Patel
Phase II: Extended Research Power Plant Contact Regulations Formatting
Insiyah Arastu Cari Hesser Insiyah Arastu Dave Belanger Satyam Kaneria Sean Irish John Bouikidis *Brett McQuillan *Lavesh Mohinani Zachary Capps Jay Patel
Phase III: Presentation Poster/Brochure Final Report Final Presentation Insiyah Arastu Zachary Capps Insiyah Arastu
*Sean Irish Cari Hesser Dave Belanger Jay Patel Satyam Kaneria Sean Irish
*Brett McQuillan *Lavesh Mohinani John Bouikidis
Figure 2: Team Structure Chart

Failure Prediction Modeling of Power Plant Emission Control Systems | IPRO 303 |
/ 10 of 34
IPRO 303Organization
Phase IResearch
Wet Scrubbers
InsiyahAratsu
JohnBouikidis
Brett McQuillan
JayPatel
ESPsBaghouses
Zachary Capps
Satyam Kaneria
Lavesh Mohinani
SCRs
Dave Belanger
CariHesser
SeanIrish
Phase IIExtended Research
Power Plant Contact
Insiyah Aratsu
Dave Belanger
JohnBouikidis
Zachary Capps
Regulation Research
CariHesser
Satyam Kaneria
Brett McQuillan
Formatting Team
Insiyah Aratsu
Sean Irish
Lavesh Mohinani
JayPatel
Phase IIIPresentation
PosterBrochure
InsiyahAratsu
SeanIrish
JayPatel
Final Report
JohnBouikidis
Zachary Capps
CariHesser
Satyam Kaneria
Brett McQuillan
Final Presentation
InsiyahAratsu
Dave Belanger
SeanIrish
Lavesh Mohinani
Figure 3: Team Structure Flow Diagram

Failure Prediction Modeling of Power Plant Emission Control Systems | IPRO 303 |
Budget 11 of 34
Failure Prediction Modeling of Power Plant Emission Control Systems | IPRO 303 |
Budget 11 of 34
Budget
Travel
Miscellaneous
IPRO Day
Estimated Expenses: $250.00 Location Driven $200.00 Reason $100.00 Reason
Actual Expenses: $31.90 Ed's travel to MG
Crawford $27.98
Einstein Bagels for
2 IPRO Meetings
$34.52
Ed's travel to MG Waukegan
$13.12 Chips and
Pop
$8.80
Insiyah's travel to MG Crawford
$55.86 Jimmy Johns
$63.18
John's travel to MG Waukegan
Sub-Totals: $138.40
$82.97
$0.00
Total: $221.37
Figure 4: Budget
*MG=Midwest Generation
Ethics In order to tackle the ethics issues we encountered, the group decided to split into 3 different groups and
was assigned to read an article on an ethical perspective. The perspectives were given to us by our
professor.
Those articles are hereby listed as: Seven Layers of Integrity by June Ferrill, Ethics, It's Good Business,
and Professional Engineering Code of Ethics (ASME Code)
The members of the groups are shown in the table below.
Professional Engineering Code of Ethics
Seven Layers of Integrity
Ethics, It's Good Business
Insiyah Arastu Cari Hesser Zachary Capps
David Belanger Brett McQuillan Sean Irish
John Bouikidis Lavesh Mohinani
Jay Patel
Satyam Kaneria
Figure 5: Ethics Perspectives
The first issue we were concerned with was not disclosing SmartSignal as our sponsor. While this IPRO
team did not sign a contract or make a formal agreement with SmartSignal to not disclose their name, we
were respectful of their request. Any question that was asked of an outside source was carefully
formulated so as not to reveal any sort of involvement with another company. When asked about why we

Failure Prediction Modeling of Power Plant Emission Control Systems | IPRO 303 |
Results 12 of 34
Failure Prediction Modeling of Power Plant Emission Control Systems | IPRO 303 |
Results 12 of 34
were interested in learning about power plant emission control systems, our group always responded that
this was a school project. While it may not have been entirely true, we still had an obligation to not
disclose SmartSignal's name. No outside contacts directly asked us if we had a sponsor.
The second issue was concerned with unequal contribution from individual team members. While our
team did stumble upon unequal contribution between members, we were able to take steps to iron out the
wrinkles and assign other tasks to members when it became necessary. Our group looked down upon
unequal contribution between members. Each member was assigned a task to do and was responsible for
the completion of their assigned tasks. The groups came to the consensus that: Members needed to
contribute equal work to maintain a good reputation within the group, team members should be honest
with the amount of work they do, and members should always give credit where credit is due.
The third issue dealt with how team members may be impacted by diversity within the team. This IPRO
team did not encounter any such an issues, as IIT is an incredibly diverse school, and its students deal
with diversity every day.
It is important to follow the code of ethic guides given by The Seven Layers of Integrity, Ethics, It’s
Good Business, and the ASME Code of Ethics. These guides provide a basic structure for creating a well
functioning team. They show the importance of honesty, loyalty, hard work, and equality within a group.
Results
Electrostatic Precipitators (ESPs)
The Electrostatic Precipitator team had primary objective of learning how the Electrostatic Precipitators
(ESPs) and Fabric collectors (Bag Houses) work and then go onto the details of their failure conditions
and the instrumentation available on them to detect and prevent it, which was the main aim from the
sponsor SmartSignal.
Electrostatic Precipitators, also commercially known as ESPs or Precipitators are industrial emission
control units. It is designed to trap dust particles from any particulate laden gas by electrically charging
this gas and passing this gas through charged metal plates that will collect the particles to its surface.
Precipitators are used in many industries such as Power/Electric, Chemical, Metals, and Paper.
Precipitators function by electrostatically charging the dust particles coming out from any industrial
process and then collecting these on metal plates with the help of high electric field created between these
plates so as to deposit particles on them. The figure 6 shows a commercial precipitator and there are six
processes that take place in a precipitator.
Ionization – This is the initial process of charging the dust particles from any process
Migration – Transporting the particles to the collecting surface
Collection – Precipitating the particles on to that surface
Charge Dissipation – Neutralizing the charged particles to facilitate its collection on the surface
Particle Dislodging - Removing the particles from the collecting surface to hopper (hopper is a
collecting area for particles).
Particle Removing – Putting the particles to its disposal area via a conveyor.

Failure Prediction Modeling of Power Plant Emission Control Systems | IPRO 303 |
Results 13 of 34
Failure Prediction Modeling of Power Plant Emission Control Systems | IPRO 303 |
Results 13 of 34
http://www.neundorfer.com/knowledge_base/electrostatic_precipitators.aspx#itp
Figure 6: Electrostatic Precipitator
Failure Prediction Modeling of Power Plant Emission Control Systems | IPRO 303 |
Results 14 of 34
Failure Prediction Modeling of Power Plant Emission Control Systems | IPRO 303 |
Results 14 of 34
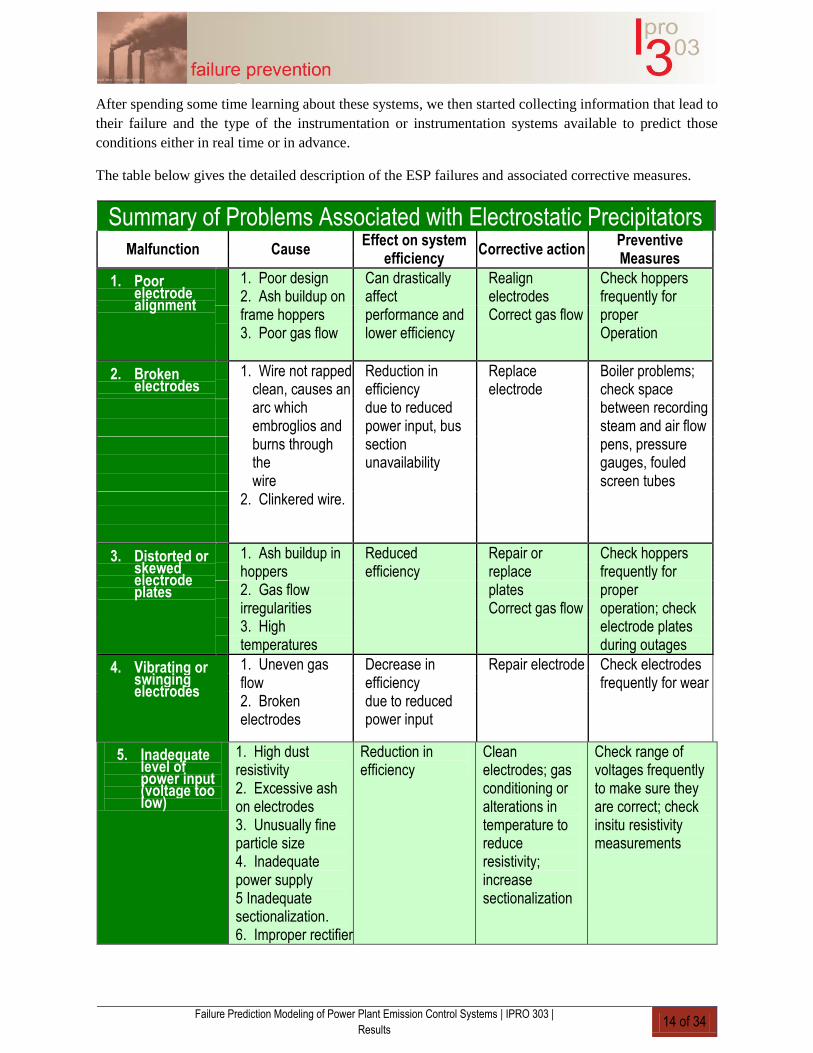
After spending some time learning about these systems, we then started collecting information that lead to
their failure and the type of the instrumentation or instrumentation systems available to predict those
conditions either in real time or in advance.
The table below gives the detailed description of the ESP failures and associated corrective measures.
Summary of Problems Associated with Electrostatic Precipitators
Malfunction Cause Effect on system
efficiency Corrective action
Preventive Measures
1. Poor electrode alignment
1. Poor design 2. Ash buildup on frame hoppers 3. Poor gas flow
Can drastically affect performance and lower efficiency
Realign electrodes Correct gas flow
Check hoppers frequently for proper Operation
2. Broken electrodes
1. Wire not rapped clean, causes an arc which embroglios and burns through the wire
2. Clinkered wire.
Reduction in efficiency due to reduced power input, bus section unavailability
Replace electrode
Boiler problems; check space between recording steam and air flow pens, pressure gauges, fouled screen tubes
3. Distorted or skewed electrode plates
1. Ash buildup in hoppers 2. Gas flow irregularities 3. High temperatures
Reduced efficiency
Repair or replace plates Correct gas flow
Check hoppers frequently for proper operation; check electrode plates during outages
4. Vibrating or swinging electrodes
1. Uneven gas flow 2. Broken electrodes
Decrease in efficiency due to reduced power input
Repair electrode Check electrodes frequently for wear
5. Inadequate level of power input (voltage too low)
1. High dust resistivity 2. Excessive ash on electrodes 3. Unusually fine particle size 4. Inadequate power supply 5 Inadequate sectionalization. 6. Improper rectifier
Reduction in efficiency
Clean electrodes; gas conditioning or alterations in temperature to reduce resistivity; increase sectionalization
Check range of voltages frequently to make sure they are correct; check insitu resistivity measurements

Failure Prediction Modeling of Power Plant Emission Control Systems | IPRO 303 |
Results 15 of 34
Failure Prediction Modeling of Power Plant Emission Control Systems | IPRO 303 |
Results 15 of 34
and control operation 7. Misalignment of electrodes
6. Back corona 1. Ash accumulated on electrodes causes excessive sparking requiring reduction in voltage charge
Reduction in efficiency
Same as above Same as above
7. Broken or cracked insulator or flower pot bushing leakage
1. Ash buildup during operation causes leakage to ground 2. Moisture gathered during shutdown or low-load operation
Reduction in efficiency
Clean or replace insulators and bushings
Check frequently; clean and dry as needed; check for adequate pressurization of top housing
8. Air leakage through hoppers
1. From dust conveyor
Lower efficiency; dust reentrained through electrostatic precipitator
Seal Leaks Identify early by increase in ash concentration at bottom of exit to ESP.
9. Air in Leakage through ESP Shell
1. Flange expansion
Same as above; also causes intense sparking
Seal leaks Check for large flue gas temperature drop across the ESP
10. Gas bypass around ESP Dead
passage above plates
Around high tension frame
1. Poor design; improper isolation of active portion of ESP
Only few percent drop in efficiency unless sever
Baffling to direct gas into active ESP Section
Identify early by measurement of gas flow in suspected areas
Figure 7: ESP Failure Chart

Failure Prediction Modeling of Power Plant Emission Control Systems | IPRO 303 |
Results 16 of 34
Failure Prediction Modeling of Power Plant Emission Control Systems | IPRO 303 |
Results 16 of 34
The failure conditions of the Baghouses included its gradual deterioration and its susceptibility to fire. A
baghouse is composed of fiber and is exposed to high temperature flue gas from the flue gas.
Additionally, cinders and embers from the boiler can cause fires within the Bag House.
After finding the failures of the different systems, we then looked into the instrumentation that was
available to monitor these systems in a real time manner. During our term, we had made a couple of
power plant visits which helped us in gathering information about instrumentation of the systems.
The electrostatic precipitators at Crawford Plant were monitored using Forry ESP products. The program
is remotely accessible to all computers on the network. The program allows user to
monitor
sparks/minute
arc/minute
primary/secondary voltage
The primary indicators on the machine give real-time values for
primary and secondary voltage
current sparks and
arcs per minute
kilowatts
firing angles
actual conditions versus programmed
current parameters versus transformer ratings
Forry Products include various alarms for when the Electrostatic Precipitator does not work as it is
supposed to. Some of the alarms include
back Corona alarm,
transformer temperature input alarm and
Selective Catalytic Reducers temperature input alarm
It also allows users to define violations on the system. These systems are also capable of graphically
displaying VI curves:
5 minutes to 24 hours kW trends
spark simulation
The rappers can also be controlled using Forry Rapper Control. The instrumentation on these
systems includes
on-time/repeat time
frequency
rapper direction and
rest time

Failure Prediction Modeling of Power Plant Emission Control Systems | IPRO 303 |
Results 17 of 34
Failure Prediction Modeling of Power Plant Emission Control Systems | IPRO 303 |
Results 17 of 34
Baghouses Baghouses are used to remove fly ash from the flue gas stream. Baghouses are primarily used in Europe
because the power plants in Europe have a huge pressure differential which is required to pass the gas
through the filters. In the states, they are only found at 10% of power plants. Baghouses have a series of
filters that filter the air. The three most common types of baghouses derive their name from how they
handle dust removal.
The first type of baghouse, shown on the right in Figure 8, is the mechanical shaker. In the mechanical
shaker, a mechanical motor is used to shake the sheets of fabric during dust removal. The air to cloth
ratio, which is the volumetric flow rate of the air divided by the cloth area, is between 2-4 to 1. This
baghouse has several different compartments which allows for it to divert air from the compartment being
cleaned to one that is not being cleaned
The instrumentation available for baghouses includes pressure gauges before and after the baghouse to
look at the pressure differential across the bag. There is also an instrument called "The Broken Bag
Detector" that can detect dust in the air. This instrument uses the triboelectric effect to detect dust
particles: the triboelectric effect is the surface charge interaction that occurs when two different materials
go past each other, for this case the two different materials are a probe that can detect voltage and the dust
particles themselves. The last bit of instrumentation that was found with baghouses looks at the opacity
of the exiting gas.
Figure 8: Baghouse Diagram

Failure Prediction Modeling of Power Plant Emission Control Systems | IPRO 303 |
Results 18 of 34
Failure Prediction Modeling of Power Plant Emission Control Systems | IPRO 303 |
Results 18 of 34
Symptom Cause Remedy
High Baghouse
pressure drop, LOW
Cubic feet per minute
Bag Cleaning
Mechanism not
adjusting properly
Increase cleaning frequency. Clean longer
duration
Not Capable of
Removing dust from
bags
Send sample of dust to manufacturer. Send
bag to lab for analysis for blinding. Dry
clean or replace bags
Excessive
Reentrainment of dust
Continuously empty hopper. Clean row of
bags randomly instead of sequentially
Incorrect pressure
reading
Clean out pressure taps Check hoses for
leaks. Check diaphragm in gauge
Low Baghouse
pressure drop, High
cubic feet per minute
Pressures will be less
with high temperature
gases or at high
altitudes
Reduce fan speed
Filter bag ruptured Check for visible emission from stock
Fan speed too high Check drives
Ambient air infiltrating
system
Check all doors and hatches. Check system
for leakage.
Low Baghouse
pressure drop, Low
cubic feet per minute
Induced draft fan
failure
Check fan rotation, drives and speed
Restrictions in duct
before or after
Check all dampers. Check fan damper.
Check for dust plugging ductwork. Review
duct design, (may be more restrictive flow
than expected). Increase Fan speed.
Figure 9: Baghouse Failure Chart
As part of the objectives the team was also responsible for stating the laws that govern allowed emission
levels.
Mercury and Mercury Regulations
Mercury is bonded to the carbon that is injected during carbon injection of the flue gas stream. This
newly formed compound migrates down to the electrostatic precipitators or baghouse and gets caught: it
gets caught because the compound is fly ash and ESPs and Baghouses remove fly ash into the
atmosphere.

Failure Prediction Modeling of Power Plant Emission Control Systems | IPRO 303 |
Results 19 of 34
Failure Prediction Modeling of Power Plant Emission Control Systems | IPRO 303 |
Results 19 of 34
Federal Laws
The Clean Air Mercury Rule (March 15, 2005) was a law by the EPA which mandated mercury emission
control on coal fire power plants. The EPA stated that power plants must use a MACT standard
(maximum achievable control technologies) which states that power plants have to use the maximum
achievable control technologies and that they are given a time table to implement these technologies .
This rule also stated that a cap and trade program on the amount of mercury content was to be setup.
Fourteen states, various environmental groups, and several Native American tribes challenged the CAMR
in 2005. They stated that cap and trade programs would cause hot spots of mercury also they argued that
CAMR went against the Clean Air Act by illegally removing coal and oil fire power plants from the list
of regulated emitters of mercury.
The states, environmental groups, and Native American Tribes won their lawsuit. The lawsuit was
appealed all the way up to the Supreme Court with help of the Bush Administration. The Obama
administration requested that the Bush administration's request for appeal be dropped and the Supreme
Court granted that request. The Clean Air Mercury Act is no longer effective.
State Laws
Connecticut became the first state to regulate mercury emissions from coal fire power plants by passing a
law in 2003 that said that coal fire power plants must reduce mercury emissions by 90% by July 1, 2008.
New Jersey passed a law on January 5, 2004 that coal fire power plants must also reduce mercury
emissions by 90% and that they have until 2007 to do it.
Massachusetts' Department of Environmental Protection in June 2004 put out a regulation that states that
four of the states large coal fire power plants must reduce mercury emissions by 85% by January 1, 2008
and then by 95% by October 1, 2012.
New Hampshire's State Legislature in 2002 told New Hampshire's Department on Environmental
Services to come up with rules establishing a cap on mercury emissions.
Wisconsin's Department of Natural Resources came up with 90% reductions in mercury emissions of coal
fire power plants by January 1, 2015.
Colorado, Hawaii, Iowa, New York, Virginia, and Washington all have bills currently circulating around
their state legislators that would limit mercury emissions.
The Effects of Mercury: Mercury emissions from power plants are in the form of gas and average 48 tons. This gas cycles through
the atmosphere and winds up in soil and water. The fish in the water absorb the mercury which can make
the fish unsafe to eat: to quantify this, only 1/70th a teaspoon of mercury is needed to cause the fish in a
25 acre lake unsafe to eat. Mercury can cause brain damage to fetuses and developing minds.
Failure Prediction Modeling of Power Plant Emission Control Systems | IPRO 303 |
Results 20 of 34
Failure Prediction Modeling of Power Plant Emission Control Systems | IPRO 303 |
Results 20 of 34
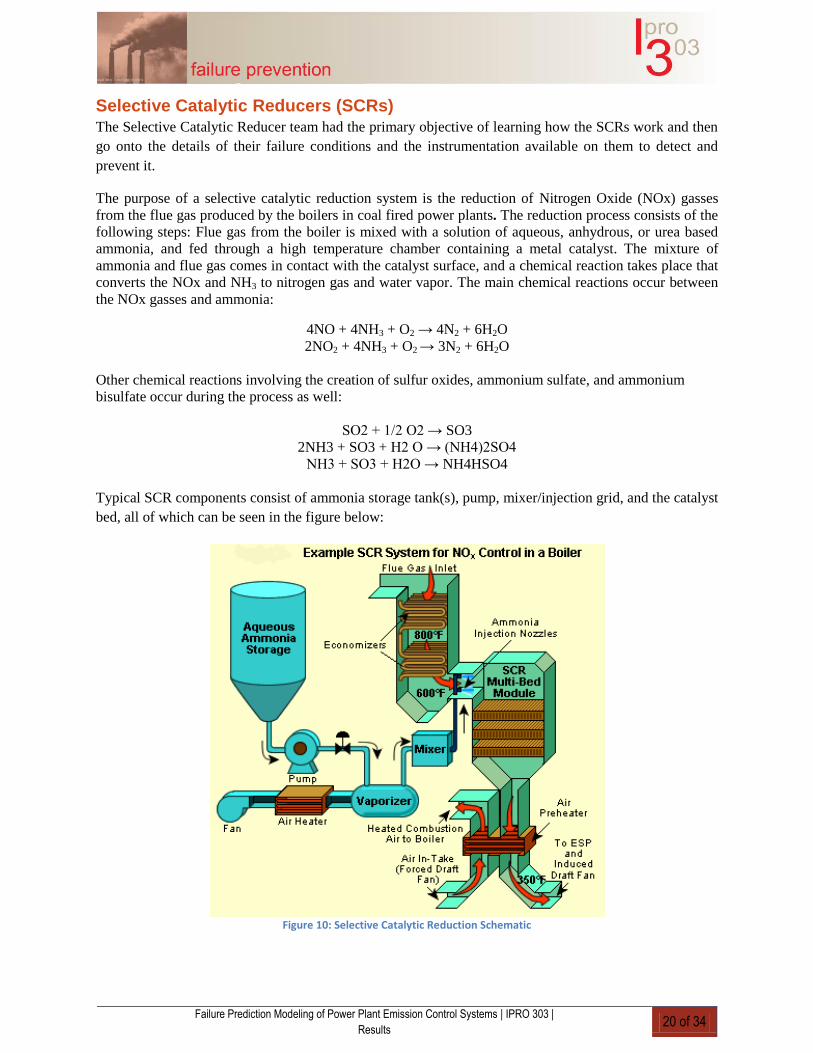
Selective Catalytic Reducers (SCRs) The Selective Catalytic Reducer team had the primary objective of learning how the SCRs work and then
go onto the details of their failure conditions and the instrumentation available on them to detect and
prevent it.
The purpose of a selective catalytic reduction system is the reduction of Nitrogen Oxide (NOx) gasses
from the flue gas produced by the boilers in coal fired power plants. The reduction process consists of the
following steps: Flue gas from the boiler is mixed with a solution of aqueous, anhydrous, or urea based
ammonia, and fed through a high temperature chamber containing a metal catalyst. The mixture of
ammonia and flue gas comes in contact with the catalyst surface, and a chemical reaction takes place that
converts the NOx and NH3 to nitrogen gas and water vapor. The main chemical reactions occur between
the NOx gasses and ammonia:
4NO + 4NH3 + O2 → 4N2 + 6H2O
2NO2 + 4NH3 + O2 → 3N2 + 6H2O
Other chemical reactions involving the creation of sulfur oxides, ammonium sulfate, and ammonium
bisulfate occur during the process as well:
SO2 + 1/2 O2 → SO3
2NH3 + SO3 + H2 O → (NH4)2SO4
NH3 + SO3 + H2O → NH4HSO4
Typical SCR components consist of ammonia storage tank(s), pump, mixer/injection grid, and the catalyst
bed, all of which can be seen in the figure below:
Figure 10: Selective Catalytic Reduction Schematic
Failure Prediction Modeling of Power Plant Emission Control Systems | IPRO 303 |
Results 21 of 34
Failure Prediction Modeling of Power Plant Emission Control Systems | IPRO 303 |
Results 21 of 34
Depending on the design of the power plant, one of three main configurations can be used:
Hot Side, High Dust: upstream of the air preheater (APH) and electrostatic precipitator (ESP)
Hot Side, Low Dust: upstream of the APH and downstream of the ESP
Cold Side, Low Dust: downstream of the APH and ESP
The hot side, high dust setup is the most common configuration throughout power plants in the United
States.
The two most important aspects of proper SCR functionality are operating temperature, and ammonia
slip. The paragraphs below give details as to why this is so.
Operating Temperature: The cost of the catalyst metals alone is 15-20% of the capital cost of an SCR
unit (between $9000-13000 per square meter); thus it is very important to operate at as high a temperature
as possible because this will maximize space velocity and thus minimize catalyst volume needed. It is
also necessary to minimize the rate of oxidation of SO2 to SO3, which is more temperature sensitive than
the SCR reaction. The optimum operating temperature for the selective catalytic reduction process using
the most common catalysts, titanium, tungsten and vanadium oxide, is about 650-750°F.
Ammonia Slip: Unreacted ammonia in the flue gas downstream of the SCR reactor is referred to as
ammonia slip. It is paramount that ammonia slip not exceed 5 ppm, preferably 2-3 ppm, so as to minimize
the formation of ammonium sulfate and ammonium bisulfate, which can cause plugging and corrosion in
the equipment. Additionally, it is important to monitor ammonia slip because of its harmful effects on the
environment and human health when too much slips through the system unreacted. Ammonia slip is a
greater problem with high-sulfur coals, caused by higher SO3 levels resulting from both higher initial
SO3 levels due to fuel sulfur content and oxidation of SO2 in the SCR reactor.
The table below gives a detailed description of the most common failures associated with Selective
Catalytic Reduction Systems, along with any corrective and preventative measures that can be taken.
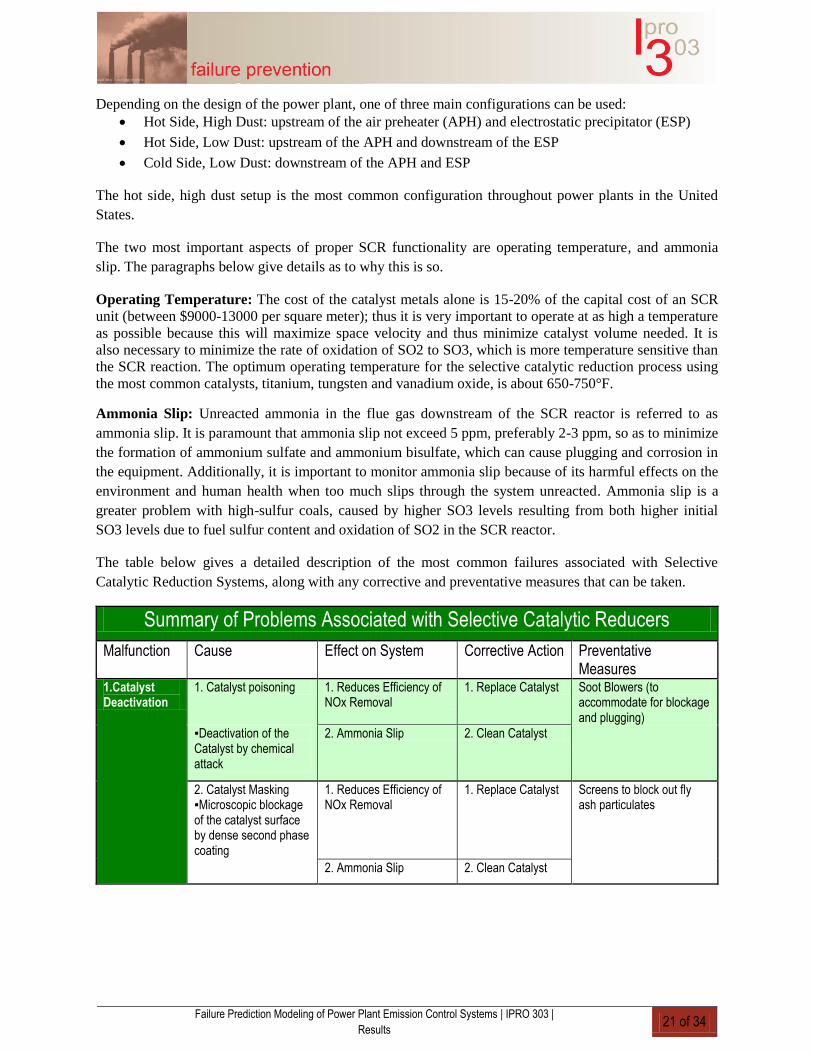
Summary of Problems Associated with Selective Catalytic Reducers
Malfunction Cause Effect on System Corrective Action Preventative Measures
1.Catalyst Deactivation
1. Catalyst poisoning 1. Reduces Efficiency of NOx Removal
1. Replace Catalyst Soot Blowers (to accommodate for blockage and plugging)
▪Deactivation of the Catalyst by chemical attack
2. Ammonia Slip 2. Clean Catalyst
2. Catalyst Masking ▪Microscopic blockage of the catalyst surface by dense second phase coating
1. Reduces Efficiency of NOx Removal
1. Replace Catalyst Screens to block out fly ash particulates
2. Ammonia Slip 2. Clean Catalyst

Failure Prediction Modeling of Power Plant Emission Control Systems | IPRO 303 |
Results 22 of 34
Failure Prediction Modeling of Power Plant Emission Control Systems | IPRO 303 |
Results 22 of 34
3. Catalyst Plugging ▪Macroscopic blockage of the catalyst system pore system by small flash ash particles
1. Reduces Efficiency of NOx Removal
1. Replace Catalyst Sonic Horns
2. Ammonia Slip 2. Clean Catalyst
2. Catalyst Deterioration
Use across life span causes the catalyst to deteriorate
1. Reduces Efficiency of NOx Removal
Replace Catalyst every 3-7 years
None. Deterioration is an unavoidable phenomenon that happens over the SCR's life span.
2. Ammonia Slip
3. Ammonia Slip
1. Unreacted ammonia exiting SCR reactor
No effect on system, effects level compliance with regulations for NOx and ammonia emissions
1. Ensure Mixer is working properly
1. Some slip is expected. Monitor gas sensors to maintain an acceptable range of slip.
2. Adjust ammonia supply
2. Un-even distribution of ammonia and flue gas across catalyst surface
No effect on system, effects level compliance with regulations for NOx and ammonia emissions
Prevent clogging of the ammonia injection grid
1. Correct design of SCR system
2. Monitor gas sensors for proper ammonia and flue gas mix ratios
4. Broken Pump
1. Broken Housing or Shafts From:
Improper distribution of flue gas and ammonia
Replace Pump 1. Do not overload pump
▪Excessive vibration, causing:
2. Inspect pump during installation
i. Bent, cracked or broken fan
ii. Fan not squarely mounted on shaft
iii. Cracked or bent pulleys due to improper handling or installation
▪Belts to tight, causing:
i. Excessive loading
ii. Bending force on the shaft causing a deflection from the center of rotation
Figure 11: SCR Failure Chart
Noticeably absent from the above table is any instrumentation. SCR systems are fairly simple in nature,
thus there is not a lot of instrumentation necessary to monitor SCR performance. The two most important
forms of instrumentation are temperature gauges, and gas sensors. The temperature gauge will tell the
operator if the SCR is operating within its optimal temperature range. Reasons as to why this is important
are detailed later in this section. The gas sensors can measure the amount of a particular chemical present
in the gas flow, so they are very useful in monitoring the amounts of ammonia and NOx gases in the air
both before and after the SCR system. Reasons for monitoring ammonia slip, as with temperature, are

Failure Prediction Modeling of Power Plant Emission Control Systems | IPRO 303 |
Results 23 of 34
Failure Prediction Modeling of Power Plant Emission Control Systems | IPRO 303 |
Results 23 of 34
detailed later in this section. Monitoring NOx both before and after the SCR system gives a good
indication of both the percent NOx reduction the system is achieving, and if output NOx complies with
regulations.
More instrumentation may be available/used on SCRs in service, however, relatively few power plants
utilize SCR technology at this time, and thus it is possible that insufficient data on instrumentation was
collected.
Advantages:
NOx reduction of up to 92%
Fairly simple system to monitor
Disadvantages:
Incredibly expensive to operate and maintain
Ammonia used for reduction reaction is dangerous to transport and deal with
Process can create destructive amounts of ammonium sulfate and ammonium bisulfate if not
carefully monitored
NOx Regulations for Solid Fuel Type Boilers in the USA:
Status Wattage Range
(MW)
2008 Regulations
(mg/m^3)
2016 Regulations
(mg/m^3)
Existing Units 50-500 600 300
Existing Units >500 500 200
New Units 50-100 N/A 400
New Units 100-300 N/A 200
New Units, biomass
fueled
100-300 N/A 300
New Units >300 N/A 200 Figure 12: NOx Regulation Chart
Overall: Much of the information on SCRs beyond that of basic operation and components was obtained
late into the semester when Babcock Power, an SCR manufacturer, finally responded to our request for
information. We feel that our research on NOx regulations, SCR functionality, and common SCR
malfunctions and failures was comprehensive; however, our research on failure indicators could be much
more in depth. If we had had more time, potentially our contact at Babcock Power could have provided us
with that sort of information, so it would be wise for future IPROs in this area to make use of this contact.
Failure Prediction Modeling of Power Plant Emission Control Systems | IPRO 303 |
Results 24 of 34
Failure Prediction Modeling of Power Plant Emission Control Systems | IPRO 303 |
Results 24 of 34
Wet Scrubbers (FGD)
Purpose
Flue Gas Desulfurization
Removes Fly Ash particulate
Common Design Types depending on use
Fly Ash: Venturi, Packed Bed, Impingement Plate
FGD: Spray Tower
Advantages
Small space requirement
Treats particles in gas
Treats high temperature and high pressure
Disadvantages Corrosion problems
High power usage
Water pollution problem
Although a variety of Wet Scrubbers exist, they all share a few common characteristics. They "scrub"
undesirable pollutants out of gas streams by introducing a particular liquid depending on the pollutant.
Most Wet Scrubbers are used in coal-fired power plants to target Sulfur Oxide gases through a method
called Flue Gas Desulfurization (FGD). These types of scrubbers operate through a chemical reaction
caused by interaction between the scrubbing liquid and the gas. In coal flue gas, a limestone slurry is
typically used to react with the sulfur dioxide in order to form a synthetic gypsum precipitate. The
gypsum particulate can be sold and transformed into the common building material gypsum board. The
chemical reaction is as follows:
SO2 + CaCO3 + 1/2O2 + 2H2O = CaSO4.2H2O + CO2
Alternate Wet Scrubber designs can also be used to treat and remove fly ash and other particulates from
the flue gas. This type of scrubber is designed to have a shorter retention time for the gas and narrow
chambers to increase the contact area between the scrubbing liquid and the particulates. Properly
designed Wet Scrubbers operate in efficiencies over 99% in both Flue Gas Desulfurization and Fly Ash
removal. They operate at pressure drops between 6 and 70 inches of water but most commonly around 10
inches of water.
The regulations that drive the design of Wet Scrubbers are primarily set by the EPA. Regulations were
set in response to public outcry regarding acid rain. Sulfur Oxides have been linked to acid rain, the
poisoning of crops and vegetation as well as increased cancer rates in humans and in animals. Some
states also set stricter regulations of Sulfur Oxide pollution. Currently the regulation states that power
plants do not exceed 0.03 parts per million SOx over a calendar year. An additional regulation of no
more than 0.14 ppm may be emitted over the course of twenty four hours more than once over the course
of a calendar year. The federal regulations are growing stricter and will require the majority and then
eventually all coal-fired power plants to install FGD systems to meet tighter regulations.
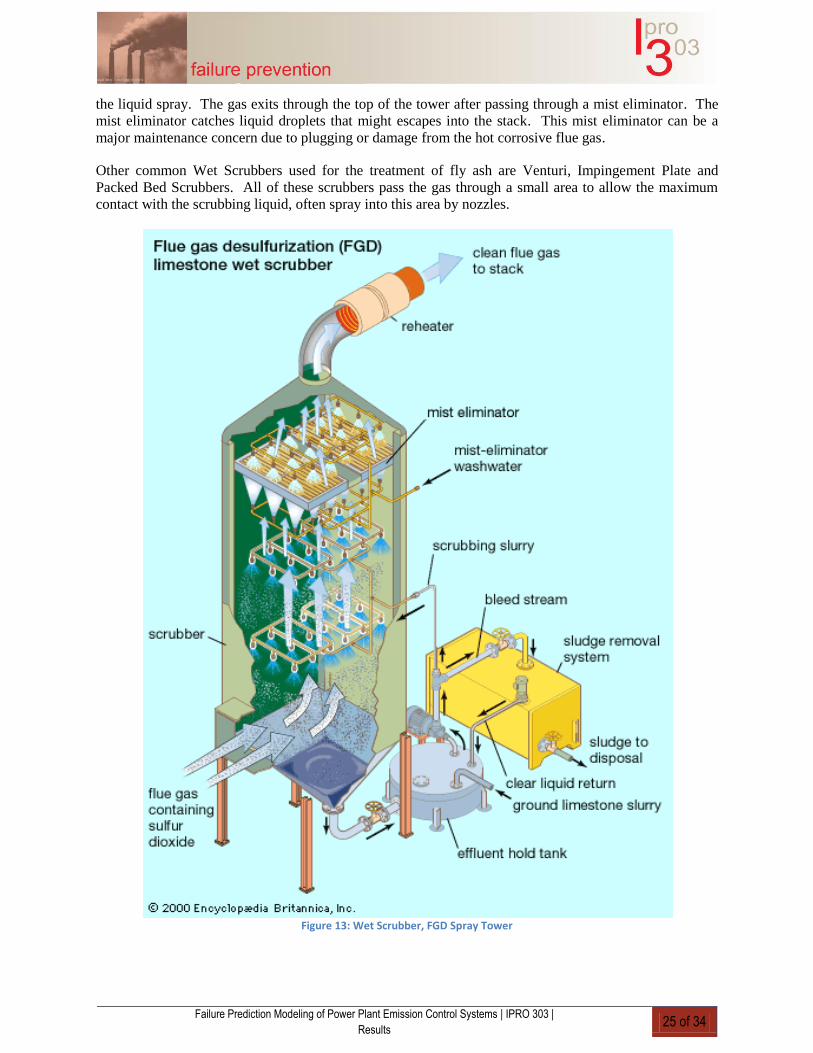
Several types of Wet Scrubbers exist. The most common Wet Scrubber in coal-fired power plants is the
Spray Tower. This design contains a series of nozzle racks stacked vertically on top of each other. The
dirty flue gas enters from the bottom of the tower and is allowed to react as the gas rises and interact with
Failure Prediction Modeling of Power Plant Emission Control Systems | IPRO 303 |
Results 25 of 34
Failure Prediction Modeling of Power Plant Emission Control Systems | IPRO 303 |
Results 25 of 34
the liquid spray. The gas exits through the top of the tower after passing through a mist eliminator. The
mist eliminator catches liquid droplets that might escapes into the stack. This mist eliminator can be a
major maintenance concern due to plugging or damage from the hot corrosive flue gas.
Other common Wet Scrubbers used for the treatment of fly ash are Venturi, Impingement Plate and
Packed Bed Scrubbers. All of these scrubbers pass the gas through a small area to allow the maximum
contact with the scrubbing liquid, often spray into this area by nozzles.
Figure 13: Wet Scrubber, FGD Spray Tower

Failure Prediction Modeling of Power Plant Emission Control Systems | IPRO 303 |
Results 26 of 34
Failure Prediction Modeling of Power Plant Emission Control Systems | IPRO 303 |
Results 26 of 34
Figure 14: Wet Scrubber FGD Schematic
Wet Scrubbers use a variety of instrumentation and are widely accepted to be the most complex of the
major air pollution control systems. This intricately is due to the liquid component of the system. The
scrubbing slurry must be monitored as well as the flue gas. The slurry is monitored using pH, pressure,
temperature and humidity sensors. The walls and containment is monitored using acoustic and vibration
sensors to locate corrosion. Common issues that arise from the limestone slurry are pH imbalance,
corrosion and plugging in the delivery (nozzle) systems. The flue gas is monitored using pressure,
temperature and humidity sensors. The flue gas instrumentation can detect potential problems with the
mist eliminator, fans, and containment. The major downside of Wet Scrubbers is that they produce water
pollution that must be treated and dealt with. We did not investigate this side of Wet Scrubber systems in
detail as our focus was on air pollution control. These systems however suffer common maintenance
issues related with pumps and the problems related to the liquid slurry mentioned before. On the
following page is a table outlines the available instrumentation and the indicators or particular failures.

Failure Prediction Modeling of Power Plant Emission Control Systems | IPRO 303 |
Results 27 of 34
Failure Prediction Modeling of Power Plant Emission Control Systems | IPRO 303 |
Results 27 of 34
Instrumentation Indicator Possible Failure
Pressure Gages High Pressure Difference Leakage in the system
(Gas Flow) Check Sealants
Check for structural cracks (Stack, ducts, etc.)
Corrosion
Gas Flow Unbalance
Fan malfunction
Check Inlet Duct
Particle Build Up
Low Pressure Difference Gas Flow Unbalance
Fan malfunction
Check Inlet Duct
Leakage in the system
Check Sealants
Check for structural cracks (Stack, ducts, etc.)
Corrosion
Pressure Gages High Pressure Nozzle Plugging
(Nozzle Slurry Line) Valve Failure
Low Pressure Pump Failure
Line Leakage
Valve Failure
Temperature Monitor High Temperature Gas Flow Unbalance
Fan Malfunction
Check Inlet Duct
Low Temperature Leakage in the system
Check Sealants
Check for structural cracks (Stack, ducts, etc.)
Corrosion
Check Gas Flow (Fans)
pH Probe Low/High pH Check Slurry System
Lime Addition
Pump Failure
Valve Failure
Solids Removal
Corrosion
Failure Prediction Modeling of Power Plant Emission Control Systems | IPRO 303 |
Results 28 of 34
Failure Prediction Modeling of Power Plant Emission Control Systems | IPRO 303 |
Results 28 of 34
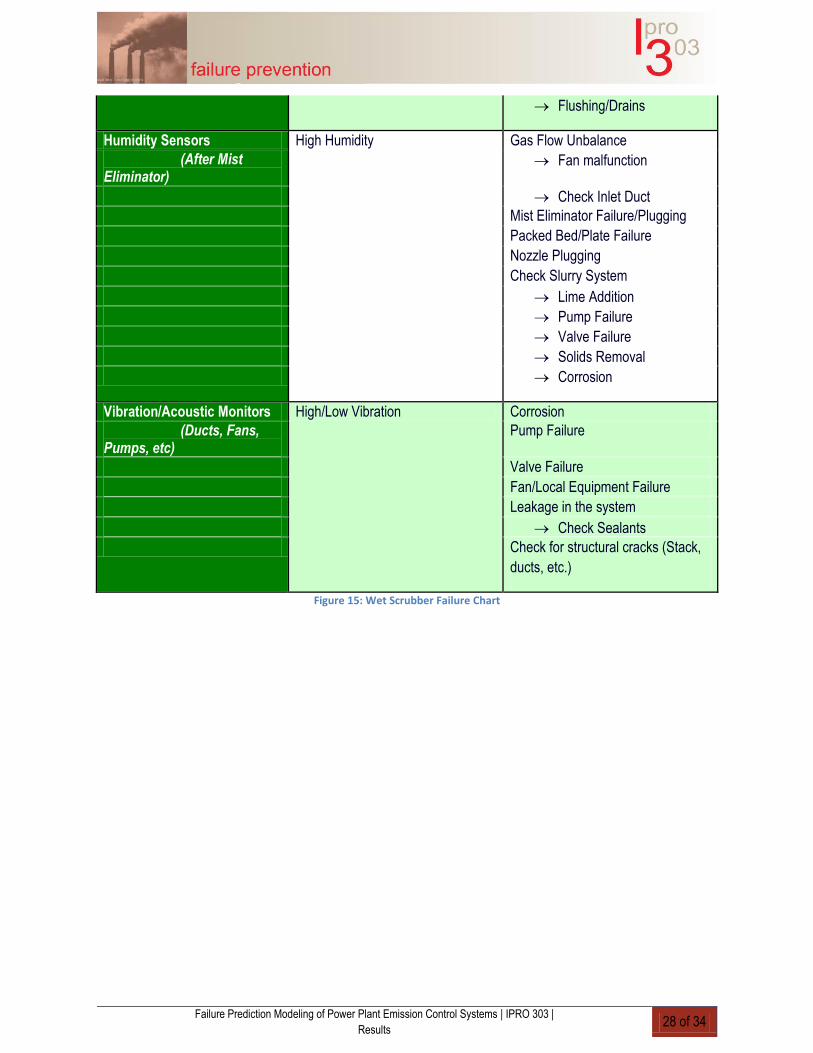
Flushing/Drains
Humidity Sensors High Humidity Gas Flow Unbalance
(After Mist Eliminator)
Fan malfunction
Check Inlet Duct
Mist Eliminator Failure/Plugging
Packed Bed/Plate Failure
Nozzle Plugging
Check Slurry System
Lime Addition
Pump Failure
Valve Failure
Solids Removal
Corrosion
Vibration/Acoustic Monitors High/Low Vibration Corrosion
(Ducts, Fans, Pumps, etc)
Pump Failure
Valve Failure
Fan/Local Equipment Failure
Leakage in the system
Check Sealants
Check for structural cracks (Stack,
ducts, etc.)
Figure 15: Wet Scrubber Failure Chart

Failure Prediction Modeling of Power Plant Emission Control Systems | IPRO 303 |
Obstacles 29 of 34
Failure Prediction Modeling of Power Plant Emission Control Systems | IPRO 303 |
Obstacles 29 of 34
Obstacles Over the course of the semester we encountered several obstacles as a team and in smaller groups. Below
we have listed several obstacles we came across and the resolutions to each issue. Solid bullets indicate an
obstacle and hollow bullets indicate the solution.
Team Obstacles
There was difficulty contacting control system manufacturers
o We decided to obtain relevant information from elsewhere
We initially had unclear goals and sponsor expectations
o We held a meeting with David Farrel
o We gathered feedback on the Mid-Term report
There was disorganized assignment of tasks
o We appointed team leader
We had trouble arranging power plant visits
o We increased the number of people contacting plants and arranging meetings
o We also increased the frequency of contact
We had trouble finding valuable information
o We met with power plant staff
o We talked to professionals and experts in the respective fields
Matching availability of team members and getting the power plant visits scheduled accordingly.
o Came up with the availability chart for general availability
o Team members volunteered to schedule power plant visits
o Scheduled multiple power plant power visits so as to get everyone at least one visit.
Ethical Issues - Look at code of ethics
Non disclosure of sponsor
Distribution of work
Cross cultural communication - See ethics code
Difficult to find consistent data due to varying plant layouts and sizes
Sub-Team Obstacles
Wet Scrubbers
Finding Wet Scrubbers in service
o None of the power plant visits involved this system and hence it would be a good
recommendation for teams researching on this IPRO during coming semesters to
look for some to visit.
o A power plant with this system was contacted to get theoretical information that
substituted for a visit.
Team members not showing up for the meeting
SCRs
Finding SCRs in service
Choosing a subteam leader
ESPs/Baghouse
Findings Baghouses in service treating exit flue gas

Failure Prediction Modeling of Power Plant Emission Control Systems | IPRO 303 |
Recommendations: 30 of 34
Failure Prediction Modeling of Power Plant Emission Control Systems | IPRO 303 |
Recommendations: 30 of 34
Recommendations: ESPs and Baghouses Electrostatic precipitators were found to be the most common emission control system in place in coal-
fired power plants. One estimate claims that 90% of power plants in the United States use ESPs to
control fly ash. In contrast only 10% of power plants in the US use baghouses. As future emission
standards grow more stringent particularly on mercury control, ESPs will become even more dominant in
the industry due to their ability to capture mercury and high efficiency. Therefore it is our
recommendation that ESPs be a primary target for SmartSignal to apply their technology and to market
towards in the industry. Baghouses are more widely used in Europe due to their inclination towards
plants designed with a positive pressure. Therefore baghouses would be a better market for SmartSginal’s
technology overseas.
Selective Catalytic Reducers Currently, Selective Catalytic Reduction Systems are underutilized in the United States. However, with
increasing regulations many power plants will need to retrofit SCRs into their emissions control processes
by 2016. We feel that our research on NOx regulations, SCR functionality, and common SCR
malfunctions and failures was comprehensive; however, our research on indicators of failure could be
much more in depth. We would recommend attempting to do more research on this aspect of SCRs in a
few years, by when SCRs will have become more of a standard in power plants, thus making information
more easily attainable. As previously stated above in the results section, we would again like to stress
our recommendation of keeping in contact with Babcock Power, the SCR manufacturer from which our
subgroup got much of its pertinent information.
Wet Scrubbers Similarly to SCRs, Wet Scrubbers are not currently in common use as air pollution controls in the United
States. As regulations become stricter in 2010, 2012 and in the future, more coal-fired power plants will
require Wet Scrubbers serving as FGD systems. Although Wet Scrubbers can be designed to treat fly ash,
ESPs are generally considered more efficient and more economical for that purpose. The Spray tower
configuration is the most common design for treating sulfur oxides and therefore will be the primary
design used in future coal fired power plants. Our recommendation is to focus on more prominent
systems currently, but develop a system to monitor FGD systems in the near future. Several power
generation companies have installed Wet Scrubbers in flagship plants or in one or two plants in order to
prepare for installation throughout their entire operation. These plants, such as We Energies in Pleasant
Prairie are a good place to start this process.
Failure Prediction Modeling of Power Plant Emission Control Systems | IPRO 303 |
References: 31 of 34
Failure Prediction Modeling of Power Plant Emission Control Systems | IPRO 303 |
References: 31 of 34
References: Electrostatic Precipitators and Baghouses
Clack, Herek. "Interview with Herek Clack on ESPs." Interview with Zachary Capps and Satyam
Kaneria. Mar. 2009.
"Electrostatic Precipitator." ELECTRICAL ENGINEERING FOR POLLUTION CONTROL. Apr.
2009 <http://www.eas.asu.edu/~holbert/wise/electrostaticprecip.html>
"Electrostatic Precipitator Knowledge Base." Neundorfer: Particulate Knowledge. Feb. 2009
<http://www.neundorfer.com/knowledge_base/electrostatic_precipitators.aspx#itp>
Gas Detection, Gas Monitors, Gas Detectors. Apr. 2009 <http://www.rkiinstruments.com/>
Home - Environment Virginia. Apr. 2009 <http://www.environmentvirginia.org/newsroom/clean-
water news/clean-waternews/environment-america-challenges-epa-on-weak-mercury-rules>
Industrial Scientific: The Gas Detection People. Apr. 2009 <http://www.indsci.com/?gclid=CO
11_OXq5oCFQzxDAodMFxK1w>
"Monitor: Dust Alarm® Particle Emmission Monitor." Monitor Technologies, LLC: Level
Measurement for Powder and Bulk Solids. Mar. 2009
<http://www.monitortech.com/product_pe_broken.shtml>
"State Mercury Laws for Coal Plants." Sierra Club: Minnesota North Star Chapter. Feb. 2009
<http://northstar.sierraclub.org/campaigns/air/mercury/stateLaws.html>
Stock - Schenck Process Group. Mar. 2009 <http://www.stockequipment.com>
Stock: Schenck Process Group. Forry AVC XM Voltage Control. Brochure. Chargrin Falls:
Author, Stock Schenck Process Group. Apr. 2009
<http://www.google.com/url?sa=U&start=2&q=http://www.stockequipment.com/docOpen.asp%3Fd
ocID%3D97&ei=cFYDSsOvHJuqMrTK9KID&sig2=ekSfXK4T8K8U1KAMOYbfA&usg=AFQjC
NHWbIoHsNz1AABLKLdhxL_0Ihuhgg>
U.S. Environmental Protection Agency. Feb. 2009 <http://www.epa.gov>.
"U.S. Supreme Court Blocks Weak Bush-era Mercury Rule." Environment News Service. Apr.
2009 <http://www.ens-newswire.com/ens/feb2009/2009-02-24-093.asp>.
Selective Catalytic Reducers
Babcock Power Inc. "Planning for a Successful SCR Installation."
Centrifugal Pump. Digital image. 23 Mar. 2009 <http://www.global-
b2bnetwork.com/direct/dbimage /50235528/Direct_Coupled_Clean_Water_Centrifugal_Pump.jpg>
Demonstration of Selective Catalytic Reduction Technology for the Control of NOx Emissions from
High-Sulfur-Coal-Fired Boilers. Digital image. 11 Mar. 2009<http://www.netl.doe.gov/
technologies/coalpower/cctc/summaries/scr/images/scr_schematic.jpg>.
EPA Office of Air and Radiation. Performance of Selective Catalytic Reduction on Coal-Fired
Steam Generating Units. Tech. 1997
Example SCR System for NOx Control in a Boiler. Digital image. 27 Dec. 2007. 22 Feb. 2009
<http://en.wikipedia.org/wiki/Selective_catalytic_reduction>
GMB North America Inc. "Common Water Pump Failures and Their Causes." 14 Mar. 2009
<http://www.gmb.net/html/catalog/2008/2008_WP_CommonFailures.pdf>

Failure Prediction Modeling of Power Plant Emission Control Systems | IPRO 303 |
References: 32 of 34
Failure Prediction Modeling of Power Plant Emission Control Systems | IPRO 303 |
References: 32 of 34
Injection grid for ammonia shown in front of the primary mixer. Digital image. 23 Mar. 2009
<http://www.forcetechnology.com/NR/rdonlyres/.../17422en.pdf>
McLaughlin, B. R., E. A. Jones Jr., E. C. Lewis, and Babcock &Wilcox. Selective Catalytic
Reduction
(SCR) Retrofit at San Diego Gas & Electric Company South Bay Generating Station. Rep. 1997
Nitrogen Oxides: How NOx Emissions Affect Human Health and the Environment. Rep. New
York: Environmental Defense Fund, 2000
Patulski, Scott. "We Energies Interview." Interview with Brett McQuillan. 13 Apr. 2009: 1-2
"SCR and NOx Regulations." TRAX - a world leading supplier of simulation based products and
services. 2007. 5 Apr. 2009 <http://www.traxcorp.com/scrregs.html>
SensAlert Plus. Digital image. <www.sensidyne.com>
Staudt, James E. Measuring Ammonia Slip from Post Combustion NOx Reduction Systems. Tech.
North Andover: Andover Technology Partners, 2000
Temperature Gauge. Digital image. 26 Apr. 2009
<www.cpsc.gov/cpscpub/prerel/prhtml04/04085d.jpg>
Tonn, D. P., A. Kokkinos, and the Babcock & Wilcox Company. SCR System Operating
Experience at AES Somerset. Rep. 2002
The U.S. Department of Energy, and Southern Company Services, Inc. Control of Nitrogen Oxide
Emissions: Selective Catalytic Reduction (SCR). Rep. 1997.
Wet Scrubbers
Theodore, Louis and Anthony J Buonicore. Air Pollution Control Equipment. Englewood Cliffs,
New Jersey: Prentice Hall, 1982
American Electric Power. Wet Flue Gas Desulfurization. AEP, 2005
Holmes, J. E. Control and Instrumentation Aspects of Flue Gas Desulphurization. Tech. Shirley,
Solihull, UK: Department of Power Generation. IEEE Xplore
Muscatine Power and Water FGD Task Force. Impact of FGD Systems. Rep. North American
Electric Reliability Council, 1991
PEI Associates Inc. Flue Gas Inspection and Performance Evaluation Manual. Rep. EPA, 1985
Power Engineering. Self-Cleaning Filters Unclog Wet Scrubbers. Publication. June 2006. Power
Engineering. Mar. 2009 <www.power-eng.com>
Pudvay, Michael L. Operating Experience on the Treatment of FGD Scrubber Blowdown From
Existing Generating Systems. Rep. Richmond,Va,US: Infilco Degremoont, 2006
Title 35.B Chapter I.C. Tech. EPA. Apr. 2009 <www.epa.com>
Unified Facilities. Unified Facilities Guide Specifications Dust and Gas Collector, Dry Scrubber and
Fabric Filter Type. Ser. 2351430020. Unified Facilities Guide Specifications, 2009
We Energies. Pleasant Prairie Power Plant. Publication. Sept. 2008. We Energies. Mar. 2009
<www.we-energies.com>

Failure Prediction Modeling of Power Plant Emission Control Systems | IPRO 303 |
Resources: 33 of 34
Failure Prediction Modeling of Power Plant Emission Control Systems | IPRO 303 |
Resources: 33 of 34
Resources: Listed below are the expertise and contributions of each member of our team. We did not keep
timesheets, however each group member was responsible for presenting the work they had accomplished
every week for review. Each team member took meeting minutes on a rotating basis and each member
gave several presentations to the group to share their work.
Insiyah Aratsu, Architecture
Logo Design, Wet Scrubber Research, Midterm Presenter, Power Plant Contact, Power Plant Driver,
SmartSignal Presenter, Poster/Brochure Design
David Belanger, Civil Engineering
SCR Research, IPRO Presenter, SmartSignal Presenter, Research Compiler, Budget Manager
John Bouikidis, Mechanical Engineering
Wet Scrubber Research, Power Plant Contact, Power Plant Driver, SmartSignal Presenter, Research
Compiler
Zachary Capps, Aerospace Engineering
Baghouse Research, Midterm Presenter, Power Plant Contact, Professor Clack Contact, Research
Compiler
Cari Hesser, Aerospace Engineering
SCR Research, Research Compiler, Reserve IPRO Presenter, Report Formatter
Sean Irish, Architecture
Logo Design, SCR Research, IPRO Presenter, Poster/Brochure Design, IPRO Presenter
Satyam Kaneria, Electrical Engineering
iGroups Moderator, ESP Research, Research Compiler, IPRO Presenter
Brett McQuillan, Architectural Engineering
Team Leader, Wet Scrubber Research, Midterm Presenter, Research Presenter, Research Compiler,
Report Compiler
Lavesh Mohinani, Electrical Engineering
Project Plan Compiler, ESP Research, Professor Clack Contact, Research Compiler, Report
Formatter
Jay Patel, Computer Science
iGroups Moderator, Gantt Chart Moderator, Wet Scrubber Research, IPRO Presenter, Research
Compiler, Food Coordinator

Failure Prediction Modeling of Power Plant Emission Control Systems | IPRO 303 |
Acknowledgements: 34 of 34
Failure Prediction Modeling of Power Plant Emission Control Systems | IPRO 303 |
Acknowledgements: 34 of 34
Acknowledgements:
Babcock Power
A SCR manufacturer from which the SCR subgroup obtained the majority of its information
Edmund Feldy
Our advisor
IPRO and Illinois Institute of Technology
For their continued support
Midwest Generation
For all their information and kindly allowing us to visit their plants
Dr. Herek Clack
For his expertise in Electrostatic Precipitators
Dr. Noll
For his guidance in regulations and general design practices
Scott Patulski
A We Energies employee that provided relevant information about system costs, life expectancy,
maintenance issues, and instrumentation for all four systems that our IPRO was researching
SmartSignal
Our generous Sponsor