research article prediction of matrix failure in fibre...
TRANSCRIPT

Hindawi Publishing CorporationJournal of EngineeringVolume 2013 Article ID 973026 9 pageshttpdxdoiorg1011552013973026
Research ArticlePrediction of Matrix Failure in Fibre ReinforcedPolymer Composites
J Wang1 and W K Chiu2
1 Air Vehicles Division Defence Science and Technology Organisation 506 Lorimer Street Fishermans Bend VIC 3207 Australia2 School of Mechanical Engineering Monash University Clayton VIC 3800 Australia
Correspondence should be addressed to J Wang johnwangdstodefencegovau
Received 16 January 2013 Revised 16 June 2013 Accepted 18 June 2013
Academic Editor Tae Jin Kang
Copyright copy 2013 J Wang and W K Chiu This is an open access article distributed under the Creative Commons AttributionLicense which permits unrestricted use distribution and reproduction in any medium provided the original work is properlycited
Recent development has enabled fibre and matrix failure in a fibre reinforced composite material to be predicted separately Matrixyieldfailure prediction is based on a Von Mises strain and first strain invariant criteria Alternative matrix failure criteria forenhanced prediction accuracy are discussed in this paperThe proposed failure envelope formedwith basic failure criteria intersectswith uniaxial compression pure shear and uniaxial tensile test data points smoothly For failure of typical neat resin significantimprovement of prediction accuracy compared with measured material data is demonstrated For a unit cell with a fibre andsurrounding matrix with typical material properties a FEM analysis indicates a significant improvement in prediction accuracyin the pure shear load case and a marginal improvement in the biaxial tensile load case This paper also provided a preliminarydiscussion about the issues when material nonlinearity of the matrix material is involved
1 Introduction
Fibre reinforced polymer matrix composites are beingincreasingly used for aircraft structures because of theirsuperior structural performance (such as high strength highstiffness long fatigue life and low density) Some recentlydeveloped military helicopters have nearly all-composite air-frame structures (such as Eurocopter Tiger and BellBoeingV22)
In the conventional laminate theory widely used to pre-dict the strength of fibre reinforced polymer composites thelaminae are treated as homogeneous orthotropic materialsRecent development has made it possible to extend theconventional laminate theory to predict separately the failureof the polymer matrix and fibres In essence this is througha microstructural analysis conducted on a unit cell of thecomposite material that contains a fibre and surroundingpolymeric matrix to determine the correlation between thestress-strain states of the whole cell and its matrix and fibrecomponentsThis correlation is thenused in a structural anal-ysis to predict matrix or fibre failure In a linear finite elementmethod the failure of the polymer matrix and fibres can be
separately predicted during postprocessing of the results froma computation based on the conventional laminate theory bycorrelating the element of stress-strain state with matrix andfibre stress-strain states In principle this micromechanicalapproach may also predict the interfacial failure between thefibre and matrix
Significant work in the aforementioned area was reportedby Gosse and his coworkers [1 2] In their approach it wasproposed that two properties that control damage in thematrix are the first invariant of the strain tensor 119869
1120576 and the
second invariant deviator 120576eqv
1198691120576= 1205761+ 1205762+ 1205763 (1)
120576eqv = 05 [(1205761 minus 1205762)2
+ (1205761minus 1205763)2
+ (1205762minus 1205763)2
]05
(2)
where 1205761 1205762 and 120576
3are principal strains
These two strain variants are considered to be ableto indicate matrix initial failure due to volume increase(dilational strain) and distortional strains respectivelyWheneither of these reaches its critical value failure will occurTypical matrix initial failure includes microcracking and
2 Journal of Engineering
Table 1 Typical resin material strength data [7]
Resin Tensile (MPa) Compression (MPa) Shear (MPa) Compression () Shear ()Type 1119864 = 36GPa 120582 = 035
Yield strength 58 96 50Ultimate strength 58 130 62 Ultimate strain 45 93
Type 2119864 = 39GPa 120582 = 035
Yield Strength 50 100 36Ultimate strength 50 130 60 Ultimate strain 59 70
delamination initiation Note that (2) is essentially a VonMises equivalent strain In their work the analysis so far isrestricted to a linear elastic material model
As a newly developed novel approach alternative to theconventional laminate theory thismethod has great potentialto be further developed both in the areas of verification andvalidation The analytical approach can be further assessedand improved A wide range of tests need be conducted tovalidate the model or determine its limitations
This paper aims to demonstrate that the accuracy ofmatrix failure prediction could be increased significantly byenhancing these two failure criteria In addition this paperwill also discuss the issues when material nonlinearity of thematrix material is involved Note that the approach providedin [1 2] covers also fibre failure prediction which is notdiscussed in this paper
2 Discussion about Polymer Failure Criteria
In this section the discussion is restricted to the linearelastic condition (the discussion about material nonlinearityis provided in Section 4) and four basic load cases willbe considered namely uniaxial compression pure in-planeshear uniaxial tension and biaxial tension refer to Figure 1The stress and strain states under the four load cases are asfollows
(i) Uniaxial compression
1205901lt 0 120590
2= 1205903= 0
1205761=1205901
119864lt 0 120576
2= 1205763= minus120582120576
1
(3)
(ii) Pure in-plane shear
1205901gt 0 120590
2= minus120590
1 1205903= 0
1205761=(1 + 120582) 120590
1
119864gt 0 120576
2= minus1205761 1205763= 0
(4)
(iii) Uniaxial tension
1205901gt 0 120590
2= 1205903= 0
1205761=1205901
119864gt 0 120576
2= 1205763= minus 120582120576
1
(5)
(iv) Biaxial tension
1205901= 1205902gt 0 120590
3= 0
1205761= 1205762=(1 minus 120582) 120590
1
119864 120576
3= minus2120582120576
1
(6)
1205902
1205901 12059011205902
12059011205901
Figure 1 Four basic load cases considered
where 1205901 1205902 and 120590
3are principal stresses 119864 is Youngrsquos
modulus and 120582 is Poisonrsquos ratio
21 Uniaxial Compression and Pure Shear Cases Accordingto [1 2] the failure criterion (with the discussion restricted tothe linear elastic condition failure here just means reachingthe limit of elastic range (can mean yield or other nonlinearbehaviour or ultimate failure)) expressed by (2) applies tothese two load cases
It is well known that the strength of polymer materialscould be affected by compressive hydrostatic stress [3ndash6]For those polymer materials to cover both uniaxial com-pression and pure shear load cases a yield criterion such asthe Drucker-Prager criterion would be more suitable thanVon Mises criterion (Many advanced material models areavailable to describe the hydrostatic effect However onlybasic failure criteria that are relatively easy to implement areconsidered here) [7]
Table 1 provides yield strength data for two typical resinmaterials used in laminate composites
For the prediction of yield strength if one generates thecritical value of 120576eqv from pure shear data the measuredyield strength in the uniaxial compression case will be higherthan the predicted using (2) by 11 and 60 respectivelyfor these two materials This discrepancy can be removed byapplying the 2-parameter Drucker-Prager criterion (based onthe following)
120576eqv + 1198611198691120576 = 119860 (7)
where 120576eqv and 1198691120576 are calculated using (1) and (2) with themeasured failure data from compression and shear tests(Table 1) 119860 and 119861 are two parameters determined from thisequation
Failure is predicted when
1205761015840
eqv = 120576eqv + 1198611198691120576 = 119860 (8)
where 1205761015840eqv is the revised equivalent strain
Journal of Engineering 3
Equations (9) describe the first invariant of the stresstensor 119869
1120590 and the second stress invariant deviator 120590eqv
1198691120590= 1205901+ 1205902+ 1205903
120590eqv = 05 [(1205901 minus 1205902)2
+ (1205901minus 1205903)2
+ (1205902minus 1205903)2
]05
(9)
Note the following relationship
120576eqv = 120590eqv1 + 120582
119864
1198691120576= 1198691120590
1 minus 2120582
119864
(10)
Thus the failure prediction equations discussed so far canall be alternatively expressed using stress variables with fullequivalence
For isotropic materials a stress based failure criterion isalso commonly used since it is often easier to use and hasa clearer physical meaning (eg hydrostatic pressure effectshown in Drucker-Prager criterion) Alternative equations of(7) and (8) expressed in stresses are
120590eqv + 1198611198691120590 = 119860 (11)
1205761015840
eqv = 120590eqv + 1198611198691120590 = 119860 (12)
For the materials listed in Table 1 119860 and 119861 calculated valuesare listed in Table 2
22 Uniaxial and Biaxial Tension Cases Before discussingthe uniaxial and biaxial tension cases we may consider anextreme case where the polymer is loaded with uniformlydistributed tensile stress in all the three axial directions It iswell known that the Von Mises yield criterion is not valid inthis situation A Drucker-Prager criterion established usingparameters determined from compression and shear loadcases would also significantly overpredict the strength in thisdilation type failure situation
The failure pattern of typical composite matrix materialsunder uniaxial loading can be considered as dilation failure(rather than shear or distortional failure) as indicated fromthe observation that the broken sections generally are approx-imately perpendicular to the tensile load direction (ratherthan with a lager angle ie shear or distortion angle) yetwithout significant necking
Equation (1) adopted by Gosse and Christensen uses thevolume increase of thematerial (summation of the 3 principalstrain components) as the criterion to assess dilation typefailure Figure 2 from [1] shows the combined failure envelopformed with (1) and (2)
From Figure 2 one could see the significant singularpoints at the intersections between the two curves Thisis an area that needs refinement (noting that a significantimprovement of the Von Mises criterion over the maximumshear (Tresca) criterion is that it smooths the curve andremoves the singular points in Tresca criterion)
Bardenheier [8] and Kolling et al [9] provided experi-mental data from uniaxial and biaxial tension tests of three
Table 2 Parameter 119860 and 119861 values
Resin Strain-based equation Stress-based equation119860 119861 119860 119861
Type 1 325 times 103 120583120576 0439 866MPa 0098Type 2 216 times 103 120583120576 169 624MPa 0376
uniaxial tensile
uniaxial compression
1205902
J1120590
1205901
120590eqv
Figure 2 Failure envelope for a polymer described in [1]
types of polymer materials Analysing these data it is indi-cated that under a biaxial tensile load condition predictionbased on (1) would significantly underestimate the materialstrength refer to Table 3The dilational failure could be moreaccurately predicted using the critical value of for examplewith
1198691015840
1120590= (1205901
2+ 1205902
2+ 1205903
2)05
(13)
This fits more closely with the experimental results Notethat since principal stresses are used (13) is unaffected byany transformation of coordinates As will be discussed inSection 23 this can join other failure criteria smoothly
23 Combined Failure Envelope A generic form of the equa-tion that expresses the failure envelop can be as follows
119865120576(1205761 1205762 1205763 119862120576) = 0 (14)
or
119865120590(1205901 1205902 1205903 119862120590) = 0 (15)
Equations (14) and (15) are strain- and stress-based respec-tively where 119862
120576and 119862
120590represent a set of parameters
determined from experiment Amore generic formwould bethe combination of these two equations
Equations (14) and (15) are expressed in the form ofldquounifiedrdquo formulae applicable to all the load cases with justone formula Alternatively a set of equations may be usedTheir combination governs the full failure envelope in thestrain or stress space No matter which forms are used theaccuracy of these failure prediction criteria must be judgedby experiment results Coupon tests are the most reliabletests as these are conducted under the most desired load andboundary conditions in a well-controlled manner
As mentioned earlier though there are many advancedmaterial models available only basic failure criteria that are
4 Journal of Engineering
Table 3 Data from neat resin biaxial tests [8 9] and errors with different prediction methods
Resin Stress appliedlowast Error with prediction methodlowastlowast ()1205901
1205902
Equation (1) Equation (13) Max stress criterionType A 079 079 minus367 minus105 +210Type B 084 050 minus254 +23 +160Type C 085 080 minus394 minus143 +150lowastExpressed using the ratio of the yield stress in the biaxial test against that in the uni-axial tensile testlowastlowastIn each method the yield stress from the uni-axial tensile test was used to determine the critical value for prediction of yield strength in biaxial tests A ldquo+rdquosign means overprediction and a ldquominusrdquo sign means underprediction
1205902
1205901
BTUT
UT
PS
PS
UC
UC
J1120590UT
120590eqvUCJ9984001120590UT
120590998400eqvST
120590998400eqvCS
Figure 3 Illustration of failure envelope (plane-stress) UT =uniaxial tensile BT = biaxial tensile PS = pure shear UC = uniaxialcompression 120590eqvUC = 120590eqv with critical value determined fromuniaxial compression test 1205901015840eqvCS = 120590
1015840
eqv with parameters determinedfrom uniaxial compression and shear tests 1205901015840eqvST = 120590
1015840
eqv withparameters determined from shear and uniaxial tensile tests 119869
1120590UT =
1198691120590
with critical value determined from uniaxial tensile test and1198691015840
1120590UT = 1198691015840
1120590with critical value determined from uniaxial tensile test
relatively easy to implement are considered here Figure 3illustrates the proposed failure envelope with the plane-stresscondition (1205903 equiv 0) The portion of the failure envelopeformed with the Drucker-Prager failure criterion has twoparts The solid line part (1205901015840eqvCS) is established with theuniaxial compression and pure shear test data as discussed inSection 21 whilst the fine dot line part (1205901015840eqvST) is establishedwith the pure shear and uniaxial tensile data in a similar way
This figure shows that the portion of the failure enve-lope formed with the Drucker-Prager failure criterion canintersect with uniaxial compression pure shear and uniaxialtensile test data points and join with the 1198691015840
1120590curve smoothly
that indicates significant improvementIn the 3-dimensional space with 120590
1 1205902 and 120590
3coordinate
axes the failure envelope is represented by two cone surfaces(formed with the Drucker-Prager failure criterion with theaxis along the line 120590
1= 1205902= 1205903and joined at 120590
1+ 1205902+ 1205903=
0) truncated by a hemisphere surface (formed with 11986910158401120590
= theuniaxial tensile yield stress)
3 Lamina Unit Cell Analysis
A unit cell analysis using a finite element method wasfurther conducted with the four typical load cases discussedpreviously The failure prediction based on (1) and (2) wascompared with that based on (12) and (13) when bothfibre and matrix are present As the focus is on such arelative comparison some factors such as the residual stresseffect (due to the difference between curing and servicetemperatures moisture ingression chemical shrinkage etc)are not included
Since the discussion in Section 2 indicated that the failurecriteria proposed in this paper could predict neat resin failuremore accurately (12) and (13) are used as a yardstick in thiscomparison
31 Finite Element Model The following typical materialproperties are assumed
(i) fibre Youngrsquos modulus (119864119891) = 200GPa
(ii) fibre Poisson ratio (120582119891) = 03
(iii) matrix Youngrsquos modulus (119864119898) = 36GPa
(iv) matrix Poisson ratio (120582119898) = 035
(v) Fibre volume fraction (119881119891) = 05
Referring to Figure 4 with a relatively low fibre volumefraction of 05 a ldquosquarerdquo pattern fibre distribution in thematrix can be assumed (as opposed to a ldquohexagonrdquo pattern) Aunit cell was extractedwith two different orientations A FEMmodel is shown in Figure 5 Considering the symmetricalcondition only one-eighth of the unit cell was built
The load condition is applied in the form of uni-form surface displacement Symmetry boundary conditionsare applied to three orthogonal surfaces The remainingunloaded surfaces were given a uniform displacement thatresults in the gross load on the surface being zero to reflectthe ldquoPoisson effectrdquo The loading and boundary conditionsapplied ensure all the surfaces are kept straight as requiredfor the simulation of a unit cell in a lamina structure Thismethod was benchmarked against the rule of mixtures andproved to be accurate Further discussion about this could befound in [12]
32 Results and Discussion
321 Compression and Shear Load Cases Theunit cell shownin Figure 4(a) was considered As expected for the matrixmaterial in the uniaxial compression case high compressive
Journal of Engineering 5
(a) Orientation 1 (b) Orientation 2
Figure 4 Unit cells with two orientations (119881119891= 05)
Figure 5 A unit cell FEM mesh (one-eighth model of the unit cellin Figure 4(a))
stress concentration (over 4 times the average strain of theunit cell) occurred at the area indicated in Figure 6(a) Dueto the Poisson effect from the stiff fibre the other twostress components perpendicular to the applied load are alsocompressive in the high stress concentration areaThis resultsin a relatively high hydrostatic stress in this area and thus thestrength predicted with the Drucker-Prager type criterion ismuch higher than that with Von Mises criterion
In contrast in the pure shear case high compressive andtensile stress concentration occurred separately at the areasshown in Figure 6(b) This results in the strength predictedwith Drucker-Prager type criterion to be much less than thatwith Von Mises criterion in the tensile stress concentrationarea
With a load applied that resulted in 001 gross strainthe calculated maximum effective stress values are listed inTable 4
Compression stressconcentration area
concentration areaTensile stress
(a) (b)
Figure 6 Stress concentration areas in uniaxial compression andldquopure shearrdquo load cases
Table 4 Predicted maximum 120576eqv and 1205901015840
eqv values under uni-axialcompression and pure shear loadings
(1) Uni-axialcompression (2) Pure shear Ratio (2)(1) Discrepancy
120576eqv 00574 00624 109 6061205901015840
eqv 1141198642MPa 2001198642MPa 175
For practical applications of the approach described in [12] the failure strength of the matrix is generally determinedusing laminate specimen tests rather than from neat resintests (the effect of scale difference between the unit celland lamina structure is generally not considered in thisapproach refer to [1] whilst this calibration may to a certaindegree take the scale effect into consideration) If the strengthis calibrated using the uniaxial compression strength formaterial type 1 (Table 1) when predicting strength in the pureshear load case as indicated inTable 4 the difference betweenthe original approach and the proposed revised approach is606
6 Journal of Engineering
Table 5 Predicted maximum 1198691120576and 11986910158401120590values under uni-axial and
biaxial tension loadingsmdashorientation 1
(1) Uni-axialtension (2) Biaxial tension Ratio (2)(1) Discrepancy
1198691120576 00376 00438 118 341198691015840
1120590 2731198642MPa 3121198642MPa 114
concentration areaTensile stress
(a) (b)
Figure 7 Stress concentration areas in uniaxial and biaxial tensionload casesmdashorientation 1
322 Uniaxial and Biaxial Tension Load Cases Figure 7shows the stress concentration areas in these two load casesfor the unit cell shown in Figure 4(a) In the biaxial tensioncase each of the two stress concentration areas was affectedmainly by one of the two loads Thus there is no significantbiaxial tensile stress Table 5 lists maximum 119869
1120576and 11986910158401120590
values Consequently when using the two different methodscalibrated using uniaxial tensile state data to predict biaxialstate strength the difference is only 34
The unit cell shown in Figure 4(b) was subsequently usedin the comparison The maximum critical value locationsin the uniaxial tensile load case are at ldquo119886rdquo positions shownin Figure 8(a) whilst the maximum critical value locationsin the biaxial tensile load case are at ldquo119887rdquo positions shownin Figure 8(b) These maximum critical values are listed inTable 6
As shown in Table 6 when using the two differentmethods calibrated using uniaxial tensile state data to predictbiaxial state strength the difference is 61 in terms of themaximum critical values in the whole matrix however fora specific critical location such as at ldquo119887rdquo locations the twomethods yield a significant difference This might have acomplicated effect on determining the correlation betweenthe element stress-strain and matrix and fibre stress-strainstates
Note that when a further tensile load is applied alongthe fibre direction resulting in a more uniformed stress stateamong the three principal stresses at the critical location ahigher difference was predicted between these two criteriaSince this is beyond the four load cases considered detaileddescription is not presented
a
ab
(a)
a
ab
(b)
Figure 8 Stress concentration areas in uniaxial and biaxial tensionload casesmdashorientation 2
120576e120576
120590
120576ult
120590ult
Nonlinear range
Ei
Figure 9 Nonlinear stress-strain relationship 119864119894= initial or
nominal modulus 120576119890= elastic limit strain 120576ult = ultimate strain and
120590ult = ultimate stress
4 Preliminary Discussion aboutMaterial Nonlinearity
Once the matrix stress-strain state is within the nonlinearrange its modulus would no longer be constant [7 13 14]Thus in the microstructural analysis as shown in Figure 9the correlation between the stress-strain states of the wholeunit cell and its matrix and fibre components becomes stressdependent (or strain dependent) As a strain hardeningmate-rial the effective modulus of the matrix could be significantlylower than the nominal (initial) modulus
In principle a nonlinear structural analysis can be con-ducted using a finite element method with laminar nonlinearmodulus properties based on the conventional laminatetheory The failure of the polymer matrix and fibres canbe separately predicted by correlating the element stress-strain state with matrix and fibre stress-strain states at eachiteration step However this could become impractical due tothe computational expense of the nonlinear microstructuralanalysis at every iteration step
41 Matrix Dominant Case Where the effect of materialnonlinearity on laminate strength prediction ismost apparentwould be a strong matrix dominant case such as to predict
Journal of Engineering 7
Table 6 Predicted 1198691120576and 11986910158401120590values at critical points under uni-axial and biaxial tension loadingsmdashorientation 2
(1) Uni-axial tension (2) Biaxial tension Ratio (2)(1) Difference
Point 119886 1198691120576
00141 00334 237 101198691015840
11205901051198642MPa 2441198642MPa 232
Point 119887 1198691120576
000978 00435 444 4901198691015840
11205901021198642MPa 3051198642MPa 298
Max 1198691120576
00141 00435 309 611198691015840
11205901051198642MPa 3051198642MPa 290
Table 7 Mechanical properties of AS43501-6 laminamdashsource [10]
Elastic constants Strength propertiesLongitudinal modulus 119864
11GPa 142 Longitudinal tensile [120590
11119905]MPa 2280
Transverse modulus 11986422GPa 103 Longitudinal compressive [120590
11119888]MPa minus1769lowast
Shear modulus 11986612GPa 72 Transverse tensile [120590
22119905]MPa 57
Poissonrsquos ratio V12
027 Transverse compressive [12059022119888]MPa minus228
Shear [12059112]MPa 71
lowastValue adjusted according to microbuckling consideration [11]
delamination on-set load for a laminate subject to a through-thickness shear load The material nonlinearity is reflecteddirectly in the load-displacement relationship of the laminateand thus needs to be taken into account for an accuratemicrostructure analysis and accurate prediction for the loadlimit of the laminate
It would be feasible to conduct a global analysis runwith the conventional laminate theory model (may includematerial nonlinearity) and give an initial assessment tomatrix failure based on the ldquostandardrdquo linear microstructuralanalysis approach to locate the critical area and the local loadcondition Then conduct a local model FEM structural anal-ysis in conjunction with a unit cell microstructural analysisin which the nonlinear material property is considered Thecomputational expense might be manageable
42 Fibre Dominant Case We may examine a typical fibredominant load case a panel made of AS43501-6 prepreg tapewith a quasi-isotropic layup [0-454590]s under a uniaxialcompression in-plane load along the 0-direction
The material properties are listed in Table 7 The mea-sured nonlinear stress-strain curve for the angle layers isprovided in Figure 10 If we apply a linear FEM analysis basedon the conventional laminate theory with the linear propertydata fromTable 7 the computation predicts that the angle plywill fail first and the laminate strength will be significantlylower than that from the nonlinear analysis or the measuredexperimental result by 35 [11]
An alternative way of linear approximation is to considerthat the laminate failure occurs when the 0-ply ultimate stressis reached when the angle ply has not yet reached its ultimatestrain (according to Figure 10) The elastic shear modulusvalue shown in Table 7 is used in the calculation for the anglelayer up to the laminate failure (linear approximation) Thiswill overpredict the strength by around 5 (nonconserva-tive)
0
20
40
60
80
100
0 10000 20000 30000 40000 50000
120591(M
Pa)
120574 (120583120576)
5 test results
Table 7 value
Figure 10 Shear stress-strain curve of AS43501-6 (plusmn45∘ tensiontest) [11]
Though arguably 5 overprediction may not be negli-gible the aforementioned does indicate that with a linearapproximation when the ultimate strain of a matrix domi-nant lamina stress-strain component is used the predictedloading capacity is much closer to the nonlinear analysis thanthat when the ultimate stress is used (35 under prediction)This is due to the matrix strain hardening behaviour andthe insignificant contribution of the matrix dominated stresscomponent in the overall loading capacity of the laminar
The previous discussion relates two different ways oflinear approximation Extending this discussion one mayconclude that in themicrostructural analysis (postprocessionof a FEM linear approximation analysis) to use the ultimatestrain of amatrix would result in a nonconservative butmuchsmaller strength prediction error than to use the ultimatestress of the matrix (conservative much larger strengthprediction error)
Thus when a prediction based on linear analysis approx-imation is used in the case where the matrix materialnonlinearity effect is significant it is important to determine
8 Journal of Engineering
120590
A
O
B
C
D
120576120576ult
120590ult
Figure 11 Different ways of linear approximation for nonlinearstress-strain relationship of polymer matrix or matrix dominantlamina property
the maximum possible error and if it is acceptable in terms ofthe requirementpurpose of the prediction
A further point to make is the different way to makethe linearization As shown in Figure 11 line OA uses theinitial modulus in conjunction with ultimate stress as failureindication (conservative) line OB uses the initial modulusand ultimate strain (nonconservative) line OC uses a secantmodulus and ultimate stress (conservative) and line OD usesthe strain energy to define modulus and uses ultimate strainas failure indication Line OD may be a good way for thelinearization in terms of strength prediction error
5 Summary
Recent development has enabled fibre and matrix failure in afibre reinforced compositematerial to be predicted separatelyMatrix yieldfailure prediction is based on a VonMises strainand first strain invariant criteria Improvement of the matrixfailure criteria for enhanced prediction accuracy is discussedand demonstrated in this paper
For two typical resin materials considered Von Misesyield criterion is unable to fit both yield strength values fromuniaxial compression and pure shear tests When calibratedusing the measured shear yield strength the discrepancybetween the predicted and measured uniaxial compressionstrengths is found to be 11 and 60 respectively whilstusing a Drucker-Prager criterion these discrepancies couldbe removed
Use of the critical value of the first invariant strainwhen calibrated using the uniaxial tensile yield strengthunderpredicts the biaxial tensile strength significantly by over30 on average compared with available measurement dataof neat resin materials A revised criterion proposed in this
paper could reduce the discrepancy to less than 10 Theproposed failure envelope intersects with all the uniaxialcompression pure shear and uniaxial tensile test data pointsand a revised tensile failure criterion The areas governed bythese criteria join each other smoothly
For a unit cell with a fibre and surrounding matrix froma lamina with 50 fibre volume fraction and typical materialproperties a FEM analysis conducted in this study indicatesthat the difference between the yield strength of the matrixmaterial predicted using VonMises and Drucker-Prager typecriteria is over 60 in the pure shear load case when thecritical values of these yield criteria are determined in theuniaxial compression load case
The FEM analysis showed that the difference between theyield strength of the matrix material in a unit cell predictedusing the first strain variant and the revised criterion reaches61 in the biaxial tensile load case when the critical valuesof these yield criteria are determined in the uniaxial tensileload case With a tensile load added along the fibre directionthis difference is further increased
This paper also provided a preliminary discussion aboutthe issues when matrix material nonlinearity is involved
As a newly developed novel approach alternative to theconventional laminate theory thismethod has great potentialto be further developed both in the areas of verification andvalidation The analytical approach can be further assessedand improved A wide range of tests need be conducted tovalidated the model or determine its limitations
Acknowledgment
The authors would like to acknowledge that this paper is theoutcome of a research project of the Cooperative ResearchCentre for Advanced Composite Structures (CRC-ACS)
References
[1] J H Gosse and S Christensen ldquoStrain invariant failure criteriafor polymers in composite materialsrdquo in Proceedings of the 42ndAIAAASMEASCEAHSASC Structures Structural Dynamicsand Materials Conference and Exhibit Technical Papers pp 45ndash55 Seattle Wash USA April 2001
[2] D L Buchanan J H Gosse J A Wollschlager A Ritcheyand R Byron Pipes ldquoMicromechanical enhancement of themacroscopic strain state for advanced composite materialsrdquoComposites Science and Technology vol 69 no 11-12 pp 1974ndash1978 2009
[3] S S Sternstain and F A Myers ldquoYielding of glassy polymersin the second quadrant of principal stress spacerdquo Journal ofMacromolecular Science B vol 8 pp 537ndash571 1973
[4] P B Bowden and J A Jukes ldquoThe plastic flow of isotropicpolymersrdquo Journal of Materials Science vol 7 no 1 pp 52ndash631972
[5] T Wang K Kikno and N Mitsuo ldquoEffect of triaxial stressconstraint on the deformation and fracture of polymersrdquo ActaMechanica SinicaLixue Xuebao vol 18 no 5 pp 480ndash4932002
[6] Y P Fei Mechanics of Fibre Reinforced Composite TongjiUniversity Press Shanghai China 1981
Journal of Engineering 9
[7] D C Drucker and W Prager ldquoSolid mechanics and plasticanalysis for limit designrdquoQuarterly of AppliedMathematics vol10 no 2 pp 157ndash165 1952
[8] Bardenheier Mechanicaches Versagen von PolymerwerkstooenHanser 1982
[9] S Kolling A Haufe M Feucht and P A Du Bois ldquoAconstitutive formulation for polymers subjected to high strainratesrdquo in Proceedings of the 9th International LS-Dyna UsersConference Detroit Mich USA June 2006
[10] P K Mallick Composites Engineering Handbook 1997[11] J Wang P J Callus and M K Bannister ldquoExperimental
and numerical investigation of the tension and compressionstrength of un-notched and notched quasi-isotropic laminatesrdquoComposite Structures vol 64 no 3-4 pp 297ndash306 2004
[12] J Wang D Kelly and W Hillier ldquoFinite element analysis oftemperature induced stresses and deformations of polymercomposite componentsrdquo Journal of CompositeMaterials vol 34no 17 pp 1456ndash1471 2000
[13] R K Goldberg G D Roberts and A Gilat ldquoAnalytical model-ing of the high strain rate deformation of polymer matrix com-positesrdquo in Proceedings of the 44th AIAAASMEASCEAHSASC Structures Structural Dynamics andMaterials Conferencepp 3264ndash3272 April 2003
[14] R K Goldberg Implementation of Fiber Substructuring intoStrain Rate Dependent Micromechanics Analysis of PolymerMatrix Composites National Aeronautics and Space Adminis-tration GlennResearchCenter 2001 NASATMm2001-210822
International Journal of
AerospaceEngineeringHindawi Publishing Corporationhttpwwwhindawicom Volume 2014
RoboticsJournal of
Hindawi Publishing Corporationhttpwwwhindawicom Volume 2014
Hindawi Publishing Corporationhttpwwwhindawicom Volume 2014
Active and Passive Electronic Components
Control Scienceand Engineering
Journal of
Hindawi Publishing Corporationhttpwwwhindawicom Volume 2014
International Journal of
RotatingMachinery
Hindawi Publishing Corporationhttpwwwhindawicom Volume 2014
Hindawi Publishing Corporation httpwwwhindawicom
Journal ofEngineeringVolume 2014
Submit your manuscripts athttpwwwhindawicom
VLSI Design
Hindawi Publishing Corporationhttpwwwhindawicom Volume 2014
Hindawi Publishing Corporationhttpwwwhindawicom Volume 2014
Shock and Vibration
Hindawi Publishing Corporationhttpwwwhindawicom Volume 2014
Civil EngineeringAdvances in
Acoustics and VibrationAdvances in
Hindawi Publishing Corporationhttpwwwhindawicom Volume 2014
Hindawi Publishing Corporationhttpwwwhindawicom Volume 2014
Electrical and Computer Engineering
Journal of
Advances inOptoElectronics
Hindawi Publishing Corporation httpwwwhindawicom
Volume 2014
The Scientific World JournalHindawi Publishing Corporation httpwwwhindawicom Volume 2014
SensorsJournal of
Hindawi Publishing Corporationhttpwwwhindawicom Volume 2014
Modelling amp Simulation in EngineeringHindawi Publishing Corporation httpwwwhindawicom Volume 2014
Hindawi Publishing Corporationhttpwwwhindawicom Volume 2014
Chemical EngineeringInternational Journal of Antennas and
Propagation
International Journal of
Hindawi Publishing Corporationhttpwwwhindawicom Volume 2014
Hindawi Publishing Corporationhttpwwwhindawicom Volume 2014
Navigation and Observation
International Journal of
Hindawi Publishing Corporationhttpwwwhindawicom Volume 2014
DistributedSensor Networks
International Journal of
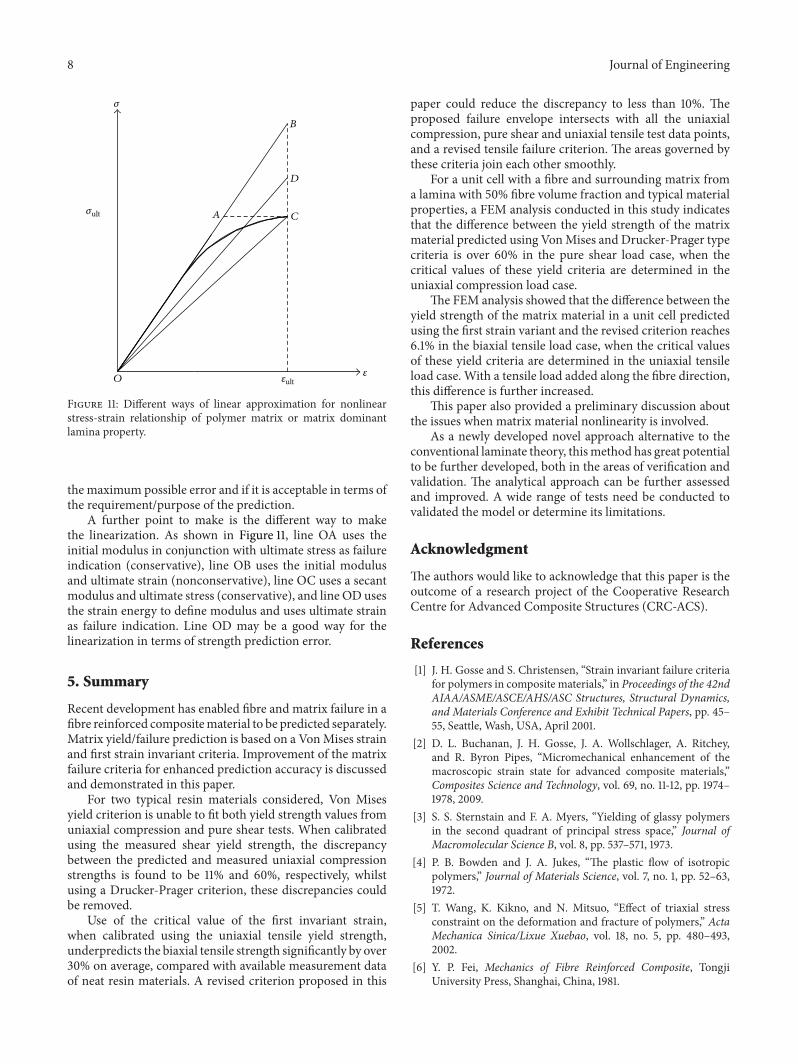

International Journal of
AerospaceEngineeringHindawi Publishing Corporationhttpwwwhindawicom Volume 2014
RoboticsJournal of
Hindawi Publishing Corporationhttpwwwhindawicom Volume 2014
Hindawi Publishing Corporationhttpwwwhindawicom Volume 2014
Active and Passive Electronic Components
Control Scienceand Engineering
Journal of
Hindawi Publishing Corporationhttpwwwhindawicom Volume 2014
International Journal of
RotatingMachinery
Hindawi Publishing Corporationhttpwwwhindawicom Volume 2014
Hindawi Publishing Corporation httpwwwhindawicom
Journal ofEngineeringVolume 2014
Submit your manuscripts athttpwwwhindawicom
VLSI Design
Hindawi Publishing Corporationhttpwwwhindawicom Volume 2014
Hindawi Publishing Corporationhttpwwwhindawicom Volume 2014
Shock and Vibration
Hindawi Publishing Corporationhttpwwwhindawicom Volume 2014
Civil EngineeringAdvances in
Acoustics and VibrationAdvances in
Hindawi Publishing Corporationhttpwwwhindawicom Volume 2014
Hindawi Publishing Corporationhttpwwwhindawicom Volume 2014
Electrical and Computer Engineering
Journal of
Advances inOptoElectronics
Hindawi Publishing Corporation httpwwwhindawicom
Volume 2014
The Scientific World JournalHindawi Publishing Corporation httpwwwhindawicom Volume 2014
SensorsJournal of
Hindawi Publishing Corporationhttpwwwhindawicom Volume 2014
Modelling amp Simulation in EngineeringHindawi Publishing Corporation httpwwwhindawicom Volume 2014
Hindawi Publishing Corporationhttpwwwhindawicom Volume 2014
Chemical EngineeringInternational Journal of Antennas and
Propagation
International Journal of
Hindawi Publishing Corporationhttpwwwhindawicom Volume 2014
Hindawi Publishing Corporationhttpwwwhindawicom Volume 2014
Navigation and Observation
International Journal of
Hindawi Publishing Corporationhttpwwwhindawicom Volume 2014
DistributedSensor Networks
International Journal of