faed 1st qtr 2010 opcc -...
TRANSCRIPT
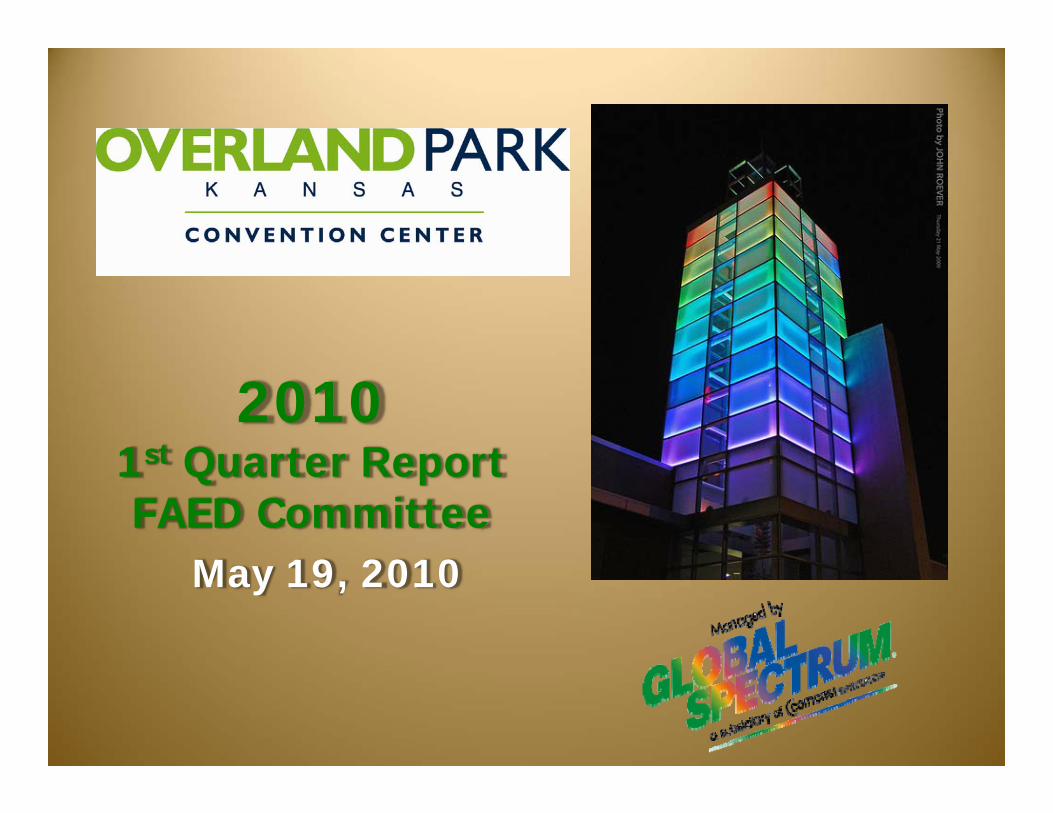
2010 1st Quarter ReportFAED Committee
May 19, 2010
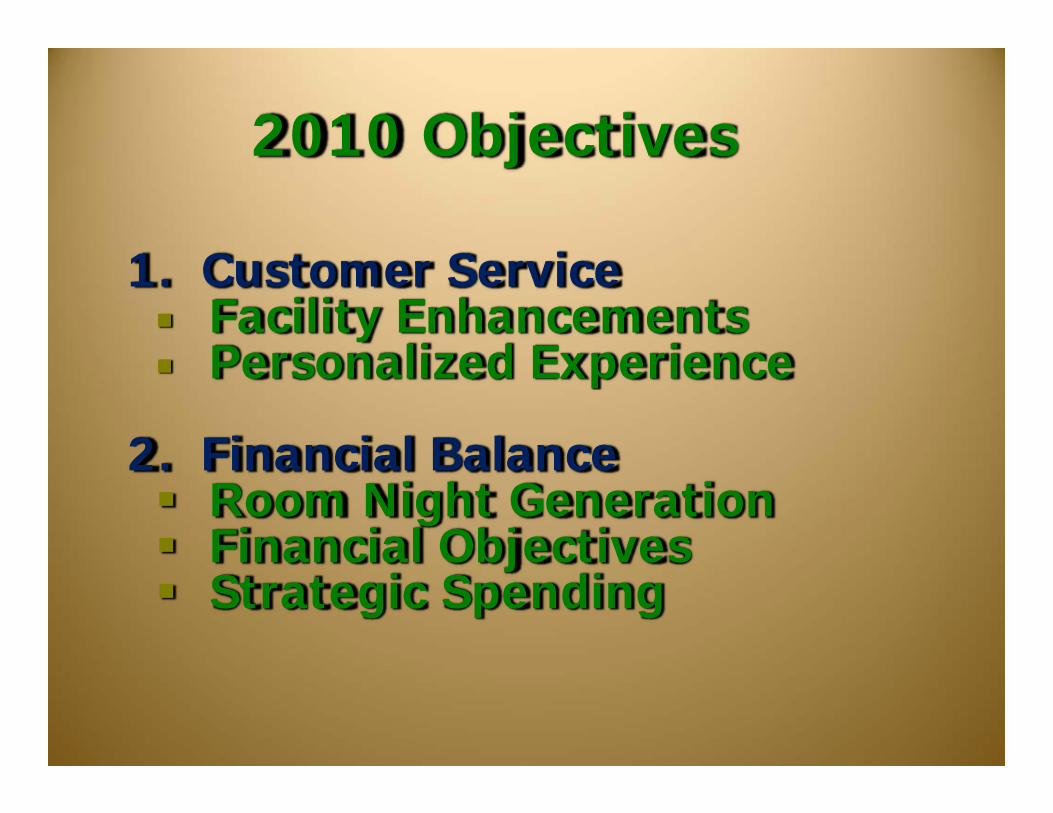
2010 Objectives
1. Customer ServiceFacility EnhancementsPersonalized Experience
2. Financial BalanceRoom Night GenerationFinancial ObjectivesStrategic Spending

CUSTOMER SERVICE
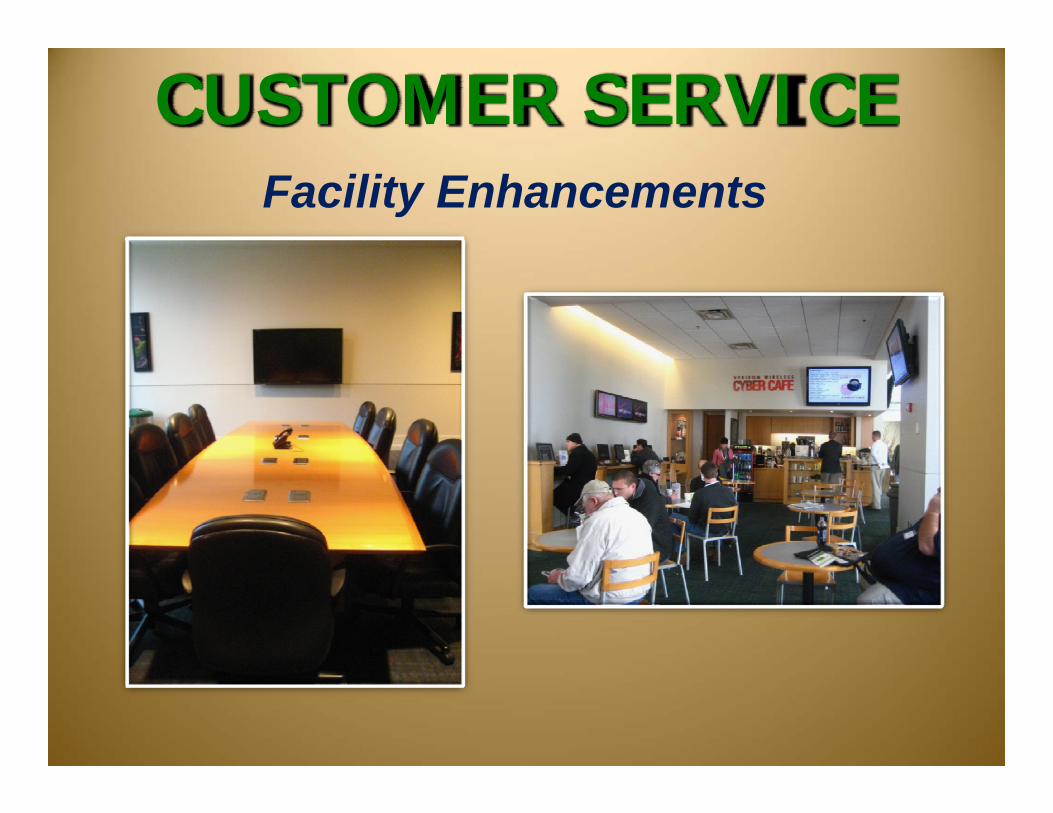
CUSTOMER SERVICEFacility Enhancements

CUSTOMER SERVICEPersonalized Experience

Q1 2010 Customer Survey Average 4.68
(1) Poor (2) Fair (3) Good (4) Very Good (5) Excellent
0.000.501.001.502.002.503.003.504.004.505.00
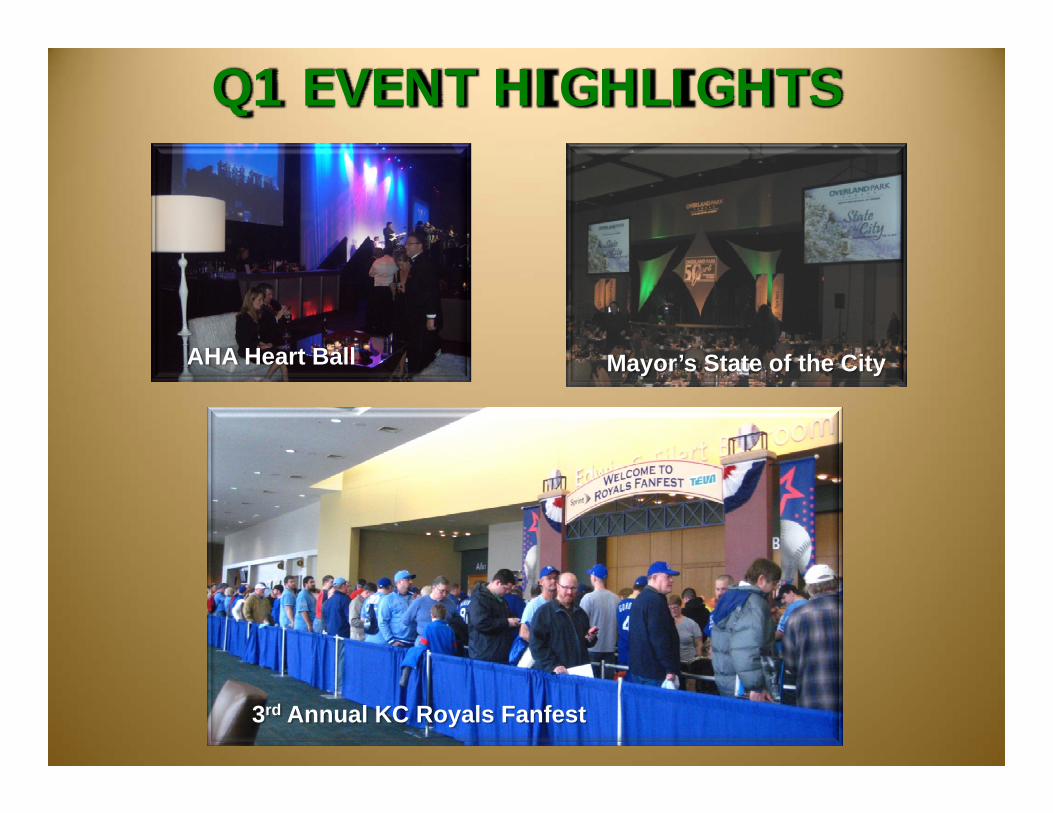
Q1 EVENT HIGHLIGHTS
3rd Annual KC Royals Fanfest
AHA Heart Ball Mayor’s State of the City
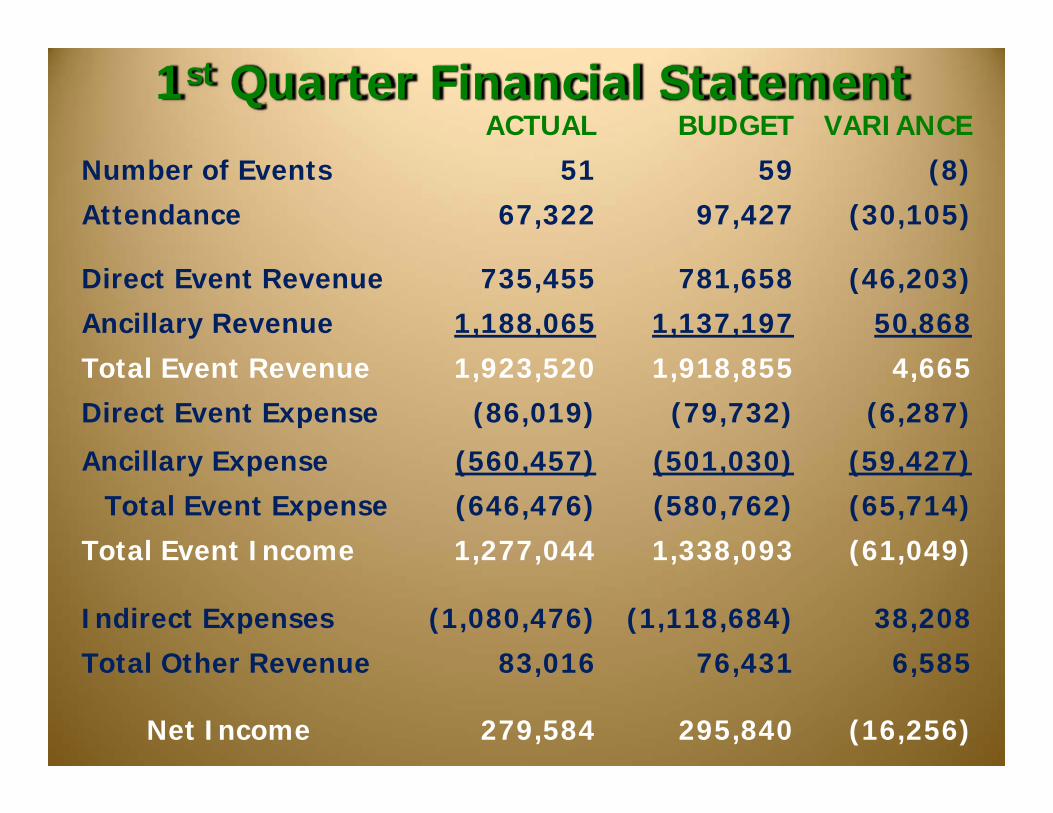
1st Quarter Financial StatementACTUAL BUDGET VARIANCE
Number of Events 51 59 (8)
Attendance 67,322 97,427 (30,105)
Direct Event Revenue 735,455 781,658 (46,203)
Ancillary Revenue 1,188,065 1,137,197 50,868
Total Event Revenue 1,923,520 1,918,855 4,665
Direct Event Expense (86,019) (79,732) (6,287)
Ancillary Expense (560,457) (501,030) (59,427)
Total Event Expense (646,476) (580,762) (65,714)
Total Event Income 1,277,044 1,338,093 (61,049)
Indirect Expenses (1,080,476) (1,118,684) 38,208
Total Other Revenue 83,016 76,431 6,585
Net Income 279,584 295,840 (16,256)
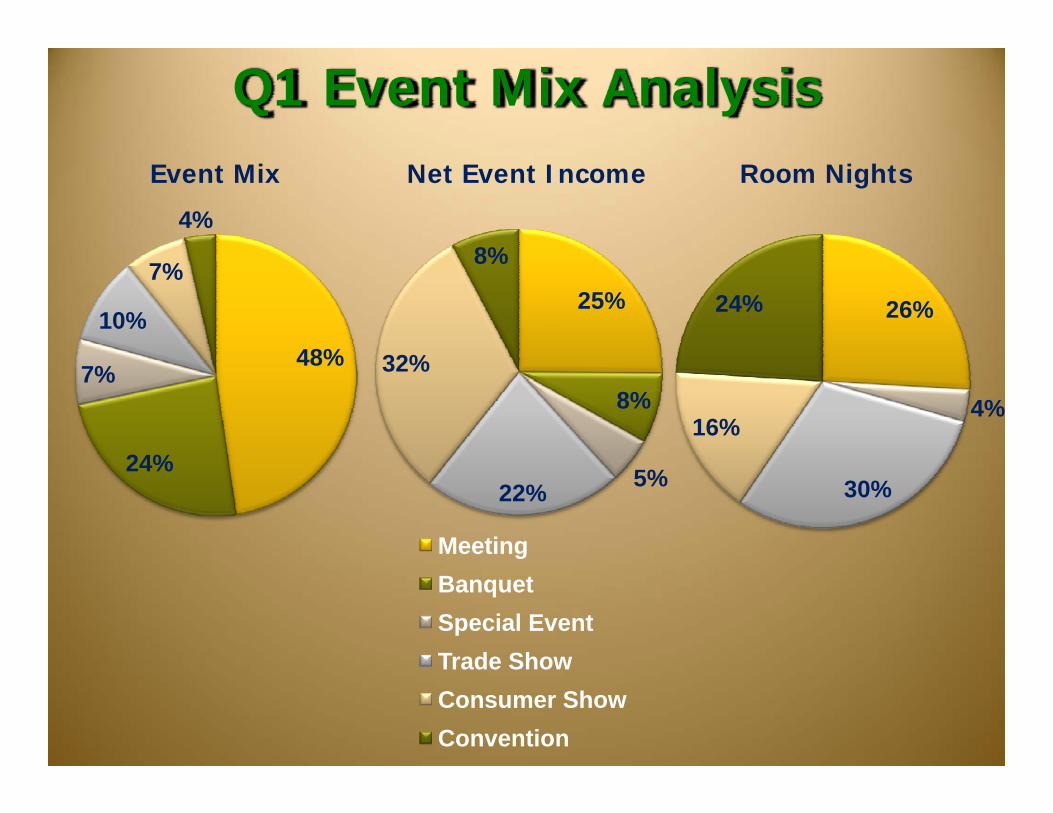
26%
4%
30%
16%
24%
Net Event IncomeEvent Mix Room Nights
48%
24%
7%
10%
7%
4%
25%
8%
5%22%
32%
8%
MeetingBanquetSpecial EventTrade Show Consumer ShowConvention
Q1 Event Mix Analysis
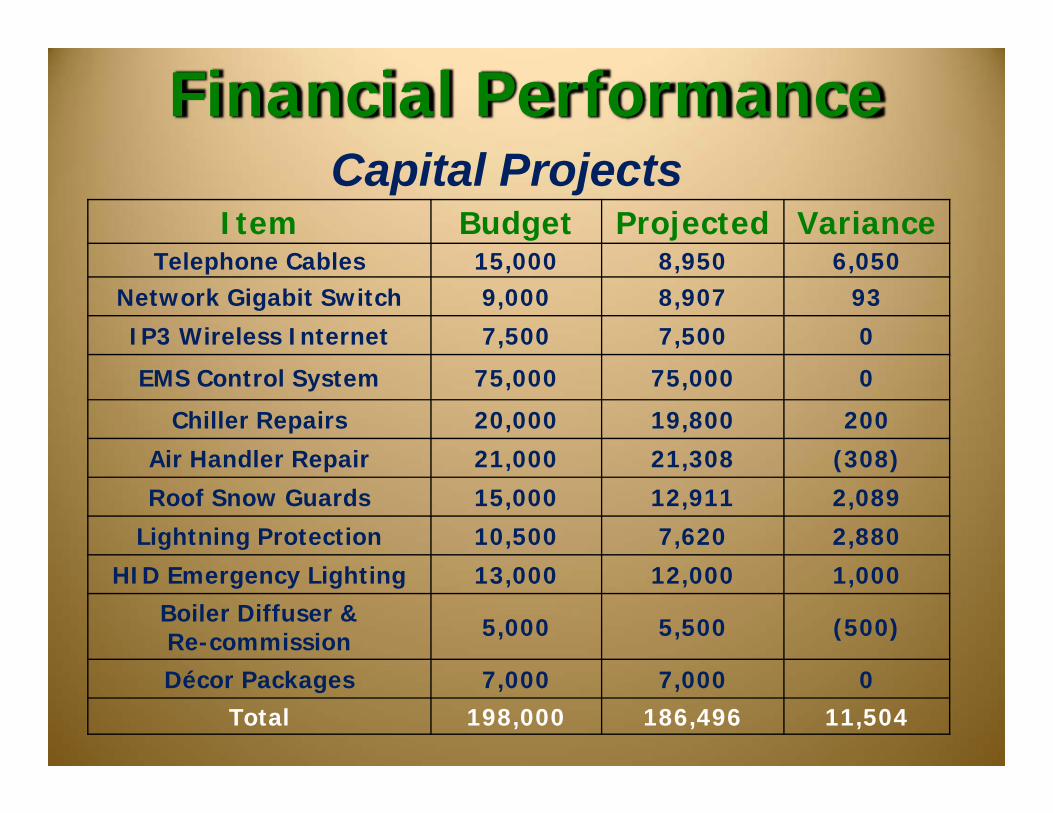
Item Budget Projected VarianceTelephone Cables 15,000 8,950 6,050
Network Gigabit Switch 9,000 8,907 93
IP3 Wireless Internet 7,500 7,500 0
EMS Control System 75,000 75,000 0
Chiller Repairs 20,000 19,800 200
Air Handler Repair 21,000 21,308 (308)
Roof Snow Guards 15,000 12,911 2,089
Lightning Protection 10,500 7,620 2,880
HID Emergency Lighting 13,000 12,000 1,000Boiler Diffuser & Re-commission 5,000 5,500 (500)
Décor Packages 7,000 7,000 0Total 198,000 186,496 11,504
Capital ProjectsFinancial Performance
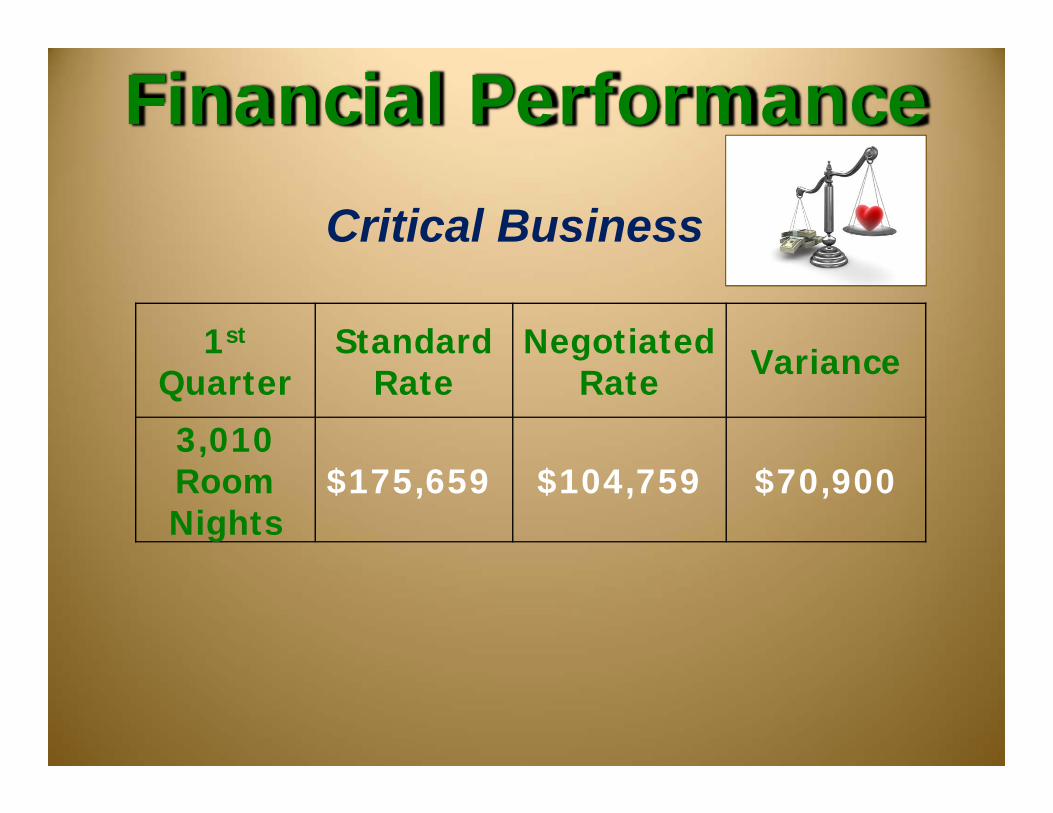
Financial Performance
Critical Business
1st
QuarterStandard
RateNegotiated
Rate Variance
3,010 Room Nights
$175,659 $104,759 $70,900
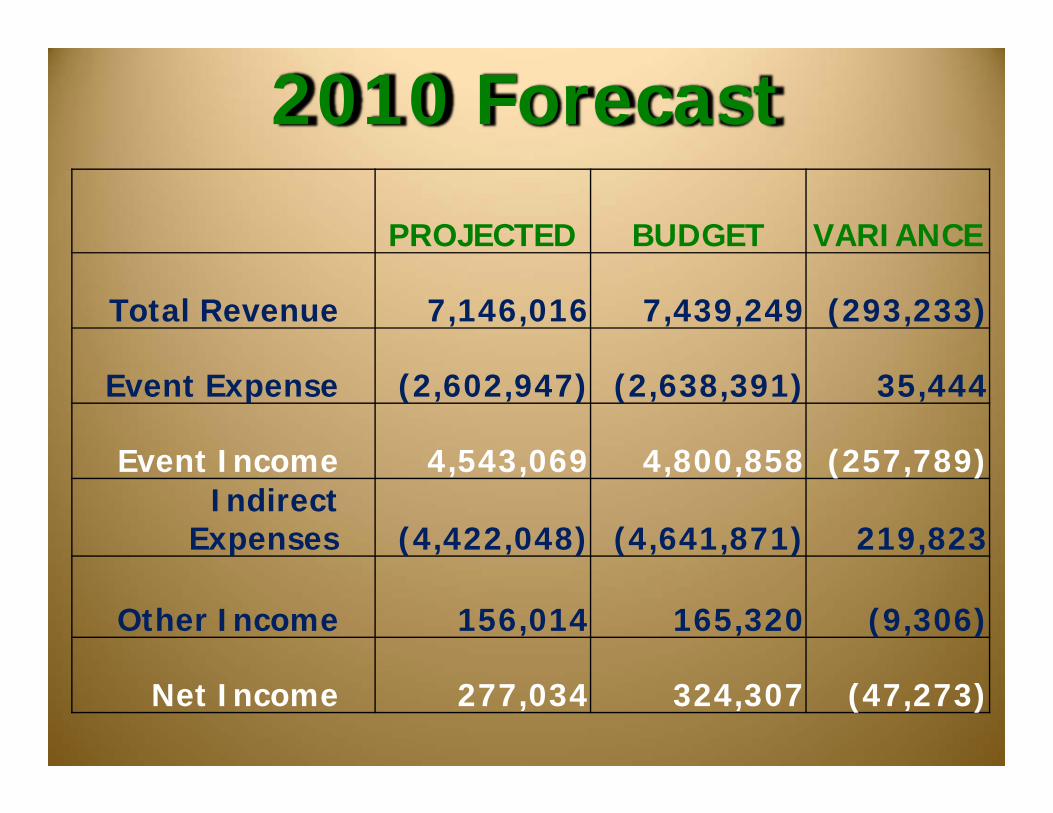
2010 Forecast
PROJECTED BUDGET VARIANCE
Total Revenue 7,146,016 7,439,249 (293,233)
Event Expense (2,602,947) (2,638,391) 35,444
Event Income 4,543,069 4,800,858 (257,789)Indirect
Expenses (4,422,048) (4,641,871) 219,823
Other Income 156,014 165,320 (9,306)
Net Income 277,034 324,307 (47,273)

2010 Outlook
• Revenues remain flat to 2009
• Strategic Spending
• Maintain Hospitality Support