faculty of engineering - multimedia universityfoe.mmu.edu.my/lab/lab/lab sheet/lab sheet trim 2...
TRANSCRIPT
FACULTY OF ENGINEERING
LAB SHEET
HIGH VOLTAGE ENGINEERING
EET 4106
TRIMESTER 2 (2012-2013)
HV 1: TRANSFORMER OIL TESTING
HV 2: ANALYSIS, DESIGN AND SIMULATION OF
IMPULSE GENERATING CIRCUITS
*Note: On-the-spot evaluation may be carried out during or at the end of the experiment.
Students are advised to read through this lab sheet before doing experiment. Your
performance, teamwork effort, and learning attitude will count towards the marks.
- 2 -
EET 4106 HIGH VOLTAGE ENGINEERING
EXPERIMENT 1
TRANSFORMER OIL TESTING
OBJECTIVES To conduct withstand test of given transformer oil sample.
To find out the breakdown voltage of oil sample.
To compute the standard deviation of the test results.
1. Introduction Transformer Oil is high quality electrical insulating oil. It is manufactured using
specially selected base stocks to help provide protection against oxidation and
sludge formation. It is recommended for use as an electrical insulating oil in
applications such as transformers, oil immersed switch gear, circuit breakers, oil
filled capacitors, tap changers, reclosures and fuses, where an oil meeting the
Australian Standard, British Standards Institution (BSI), International
Electrotechnical Commission (IEC) or other comparable specification is required
by the equipment manufacturer or user.
Good insulating properties, achieved by high dielectric strength and low dielectric
losses are the result of careful control in manufacture and handling. High dielectric
strength ensures good insulation of electrical conductors and prevention of arcing
between electrodes under the voltage stresses encountered in normal insulating oil
service. Low loss tangent minimizes energy loss due to the changing polarity of
the alternating current.
Good heat transfer and fluid flow characteristics are obtained as a result of low
viscosity and pour point. This assures effective cooling of transformer cores and
windings, and ease of operation of switches, circuit breakers, pumps, regulators,
and load tap changer mechanisms. Good oxidation stability minimizes
development of sludge and acidity in storage and service. Sludge and acidity can
have an adverse effect on the electrical properties and cooling ability.
- 3 -
2. SAMPLING & TESTING
2.1. Causes of Bad Oil
Transformers and switchgear oil may be rendered unsuitable for further use
due to four main reasons
Low dielectric strength
High acidity
High sludge content
Excessive free water content
Low dielectric strength may result form many causes, the most common of
which is foreign particles or fibres and water in combination. Individually their
effect may be relatively small, but together a contamination of only a few parts
in a million can cause considerable lowering of the breakdown voltage of the
oil. High acidity, sludge and free water should not be tolerated, but will not
necessarily reduce the dielectric strength below acceptable or specified levels.
2.2. Appearance of the Sample
Only an experienced person can judge the condition of insulating oil from its
appearance, but a general guide may be obtained from the following
observations: -
A cloudy appearance may indicate that sludge has been formed.
A dark yellow color could be a sign of overheating
A blackish color often results from an arc having taken place with either
carbonization of the oil or of the degradation of insulation within the
equipment.
A green color may be due to copper salts dissolving in the oil
3. PERFORMING THE TEST
3.1. Cleanliness of the Apparatus
The necessity for scrupulous cleanliness in the apparatus and during the
process of sampling cannot be over emphasized. The measurement of the
dielectric strength of the sample is as dependent on the cleanliness of the test
cell and the sampling apparatus as the condition of the oil itself. After cleaning
- 4 -
the apparatus, it should under no circumstances be wiped, dried or even
handled with a dusty or fibrous cloth as loose dust or fibers
3.2. Precautions necessary during Sampling
Since the oil taken from a drain cock will inevitably contain excess of settled
out solid impurities, and will not necessarily be representative of the bulk of
the oil, it should be run to waste until clear.
Always run off a quantity of oil into a glass bottle or a test tube for an initial
check on the appearance of the oil. Attention to this point may prevent
contamination of a clean test vessel.
If necessary, thoroughly clean and dry the sample point using a suitable
solvent. Any cloth used should be lint free. Open the sample cock and drain to
waste enough oil to ensure that the sample cock is fully flushed and the sample
is representative of the bulk of oil to be tested. This quantity will depend upon
the size of the transformer or main container. About 2 liters is usually suitable.
When sampling from a drum or supply container, the oil should flow at a
steady rate into the test vessel and after being swilled around the sides it should
be discarded. Without altering the rate of flow of the oil the quantity required
for the test should then be run off while taking extreme care to prevent the
ingress of atmospheric dust, cloth fibers or moisture. Do not use a syphon. In
the absence of a useable sample point, use a ‘thief’.
Shield the sample from direct light until ready to be tested.
Turbulence and air bubbles should be avoided when pouring the oil. Relevant
national specifications should be observed.
4. ITEMS REQUIRED
OIL TEST SET OTS60AF/2 (Appendix A)
TEST SAMPLE OF TRANSFORMER OIL
- 5 -
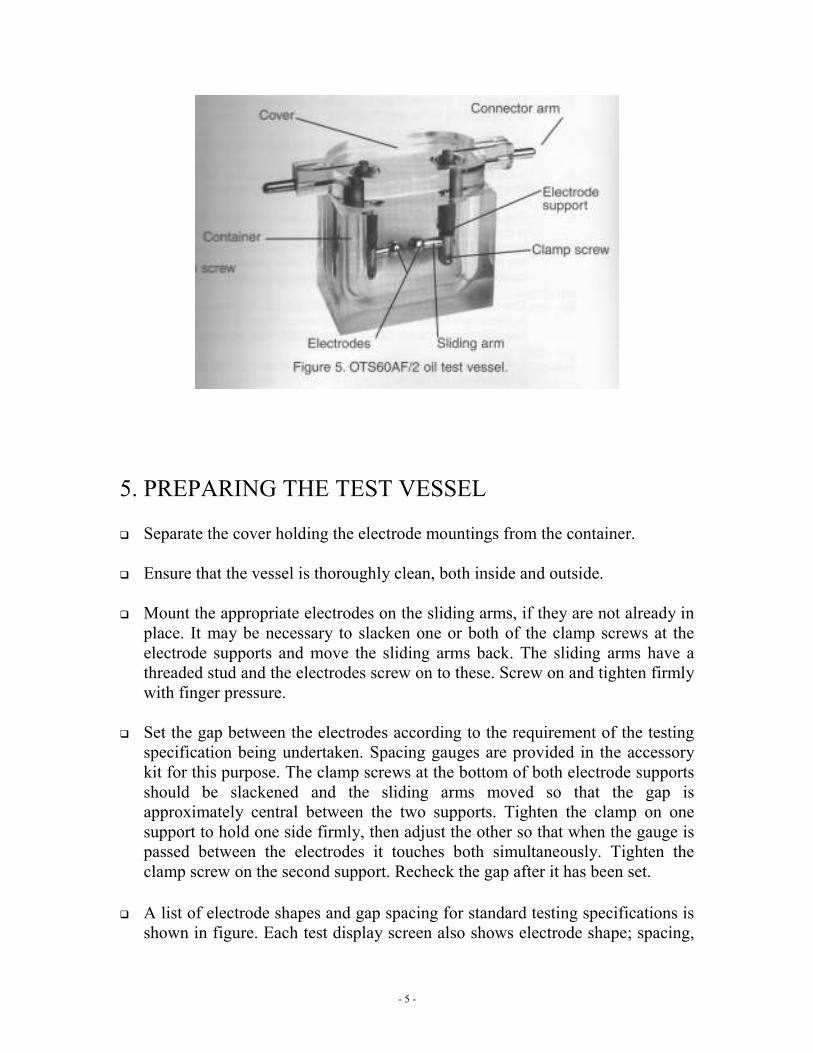
5. PREPARING THE TEST VESSEL Separate the cover holding the electrode mountings from the container.
Ensure that the vessel is thoroughly clean, both inside and outside.
Mount the appropriate electrodes on the sliding arms, if they are not already in
place. It may be necessary to slacken one or both of the clamp screws at the
electrode supports and move the sliding arms back. The sliding arms have a
threaded stud and the electrodes screw on to these. Screw on and tighten firmly
with finger pressure.
Set the gap between the electrodes according to the requirement of the testing
specification being undertaken. Spacing gauges are provided in the accessory
kit for this purpose. The clamp screws at the bottom of both electrode supports
should be slackened and the sliding arms moved so that the gap is
approximately central between the two supports. Tighten the clamp on one
support to hold one side firmly, then adjust the other so that when the gauge is
passed between the electrodes it touches both simultaneously. Tighten the
clamp screw on the second support. Recheck the gap after it has been set.
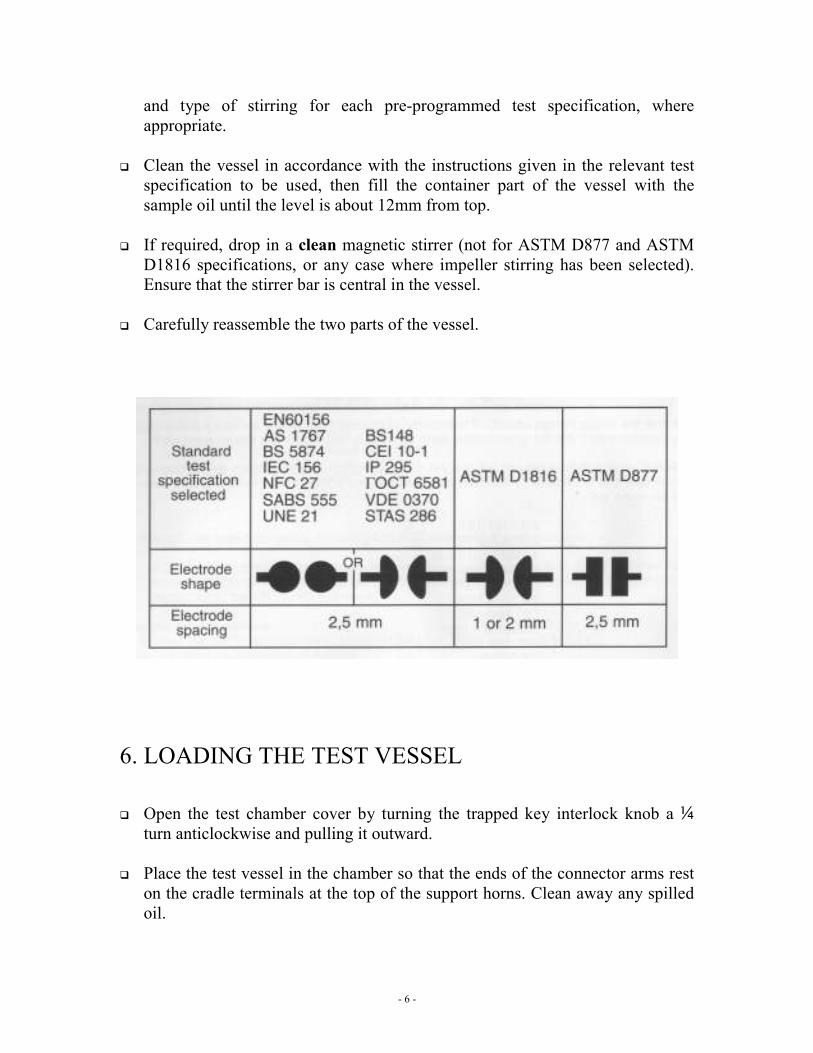
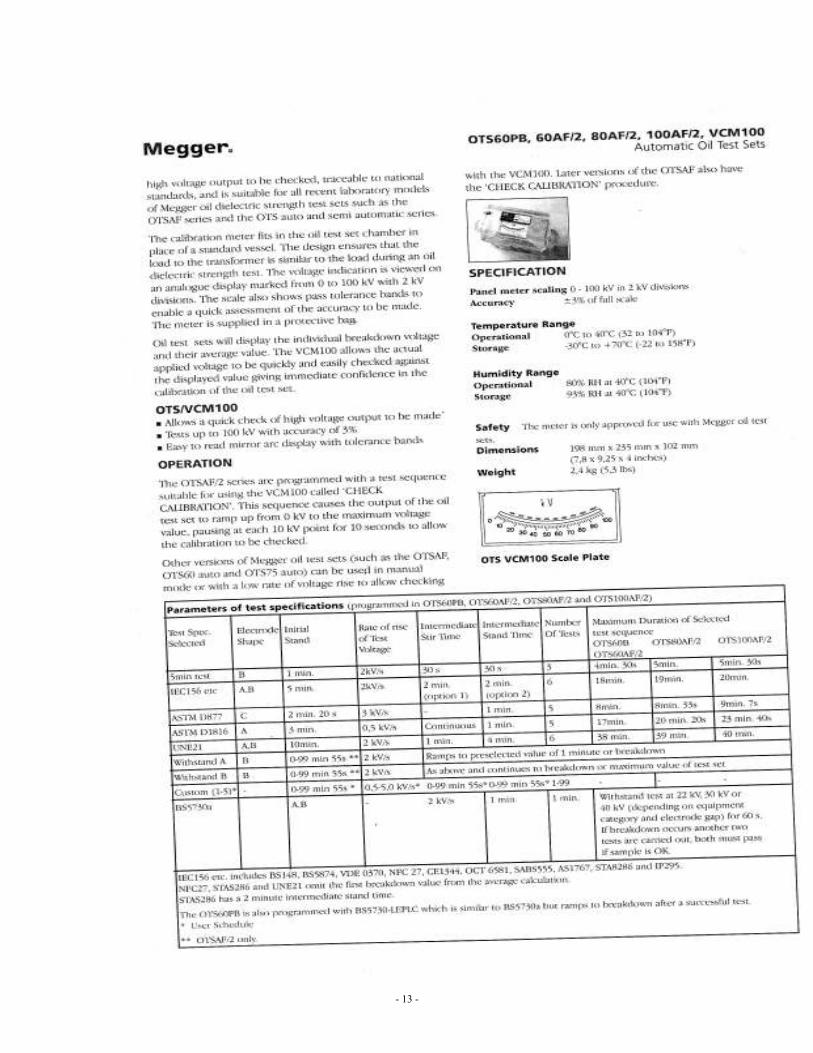
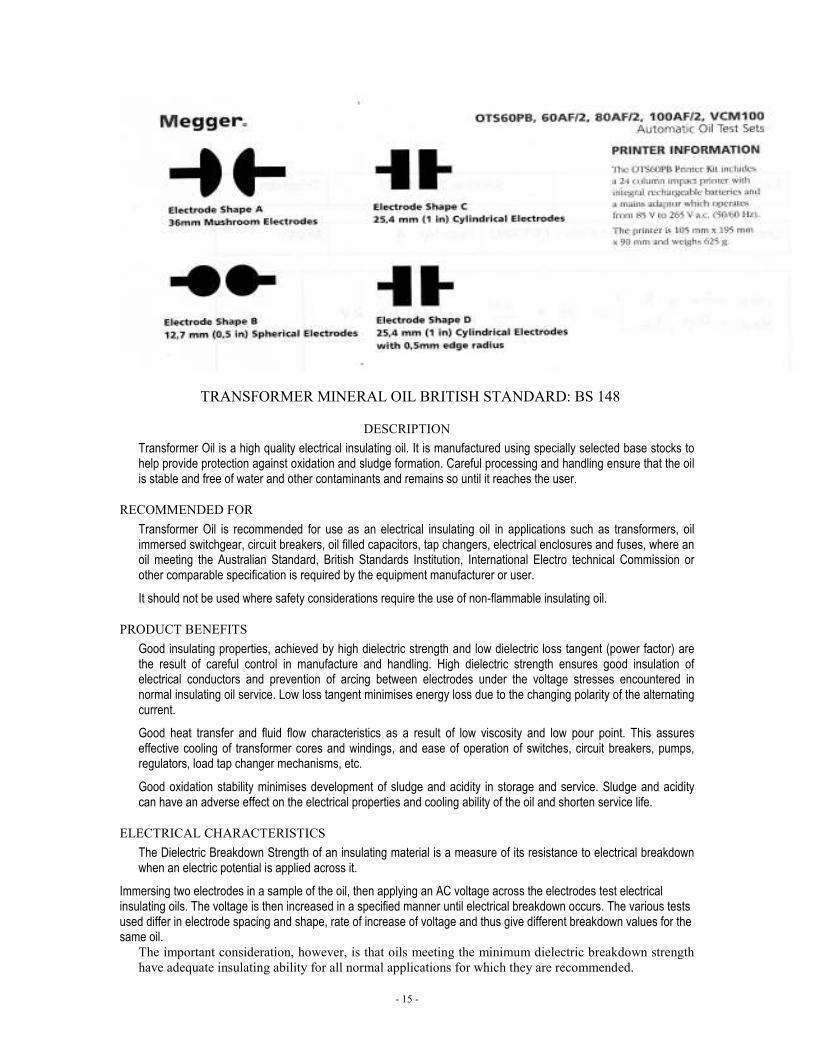
A list of electrode shapes and gap spacing for standard testing specifications is
shown in figure. Each test display screen also shows electrode shape; spacing,
- 6 -
and type of stirring for each pre-programmed test specification, where
appropriate.
Clean the vessel in accordance with the instructions given in the relevant test
specification to be used, then fill the container part of the vessel with the
sample oil until the level is about 12mm from top.
If required, drop in a clean magnetic stirrer (not for ASTM D877 and ASTM
D1816 specifications, or any case where impeller stirring has been selected).
Ensure that the stirrer bar is central in the vessel.
Carefully reassemble the two parts of the vessel.
6. LOADING THE TEST VESSEL
Open the test chamber cover by turning the trapped key interlock knob a ¼
turn anticlockwise and pulling it outward.
Place the test vessel in the chamber so that the ends of the connector arms rest
on the cradle terminals at the top of the support horns. Clean away any spilled
oil.
- 7 -
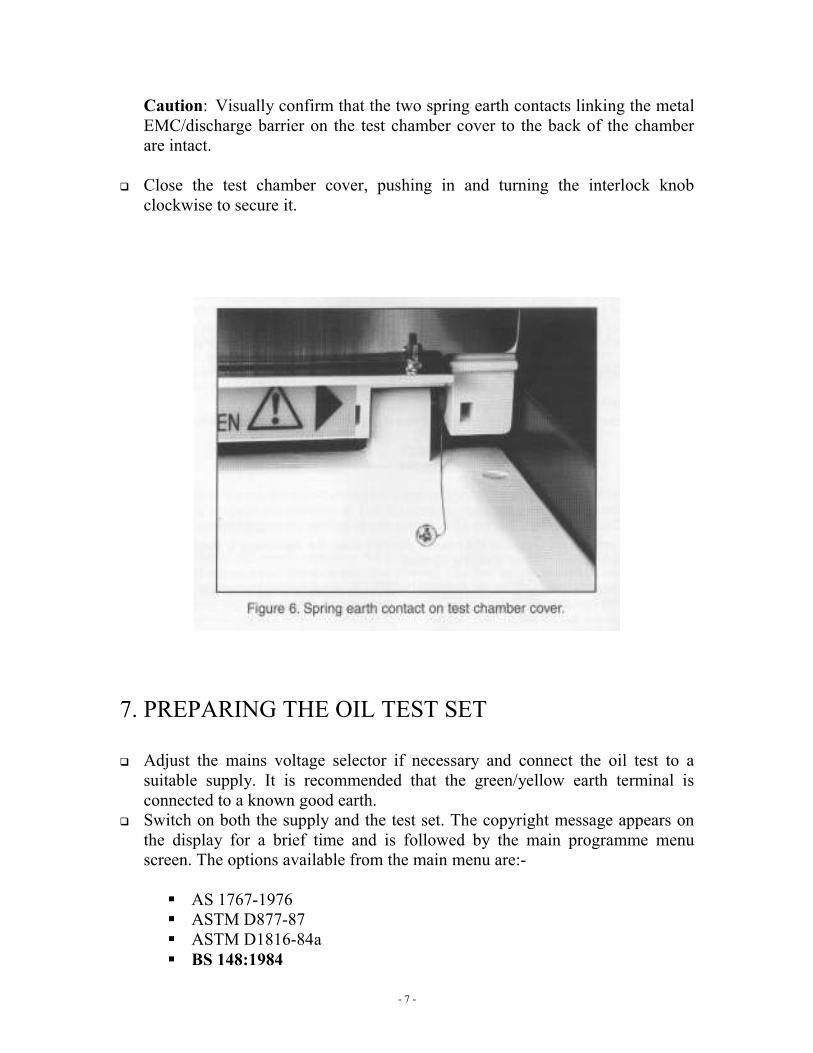
Caution: Visually confirm that the two spring earth contacts linking the metal
EMC/discharge barrier on the test chamber cover to the back of the chamber
are intact.
Close the test chamber cover, pushing in and turning the interlock knob
clockwise to secure it.
7. PREPARING THE OIL TEST SET
Adjust the mains voltage selector if necessary and connect the oil test to a
suitable supply. It is recommended that the green/yellow earth terminal is
connected to a known good earth.
Switch on both the supply and the test set. The copyright message appears on
the display for a brief time and is followed by the main programme menu
screen. The options available from the main menu are:-
AS 1767-1976
ASTM D877-87
ASTM D1816-84a
BS 148:1984
- 8 -
BS 5730a:1979
BS 5874:1980
CEI 10-1-1987
EN60156 – 1996
IEC 156 1995
OPTIONS
IP 295/83
NFC 27-221:1974
ГOCT 6581-75
SABS 555-1985
UNE21-309-89
VDE 0307/84
5 MINUTE TEST
SELF CHECK
CHECK CALIBRATION
CUSTOM
WITHSTAND (PROOF)
The main menu display allocates to the three control keys, as their function
changes. On switching on, these will be (from left to right) ,, and SELECT.
The left and center keys control scrolling up and down through the menu options,
and the SELECT key activates the highlighted option.
Note: The display shows only five menu options at any time and those in view
will depend upon the last option used. When scrolling, the highlighted option is
the one ready for selection.
Select the BS 148/IEC 156 1995 option and follow the display instructions.
Selecting OPTIONS from the main menu
DISPLAY CONTRAST/
DISPLAY BACKLIGHT/
LANGUAGE/ select English
PRINTER CONTROL/
PRINT LAST RESULTS
AUTO PRINT/ select ON
NO. OF COPIES/ select accordingly
BAUD RATE / select for external printer usage
QUIT
INT. PRINTER ON
EXT. PRINTER OFF
TIME/DATE/ adjust Time & Date accordingly
- 9 -
8. AUTOMATIC TESTING SEQUENCE Choose the appropriate pre-programmed oil testing specification program from the
main menu by scrolling through using ,keys until the required specification is
highlighted. Then press SELECT.
When a test specification has been selected in this way, the display screen changes
to show the name of the test (this remains in view throughout the test sequence)
and gives an option to START the test sequence with the left hand key, or return
to the main menu with the right hand key. For each separate test specification, the
display will indicate appropriate choices of electrode shape and spacing, if the
specification stipulates these. The appropriate method of stirring is also shown. If
the STIR MODE option is displayed, the user may vary the mode of stirring
between MAGNETIC (magnetic stirrer bar), IMPELLER (stirrer test vessel), or
NONE as is appropriate to the selected test.
When started, each test sequence is carried out completely automatically.
Note: The microprocessor software contains routines, which monitor the operation
of the test set. In the unlikely event of a problem occurring (whether caused by the
test set or an external event), the test currently in progress will when resumed
continue from the point at which the problem occurred. If this is not possible the
test set will be placed in a safe condition and a situation status message will be
displayed.
- 10 -
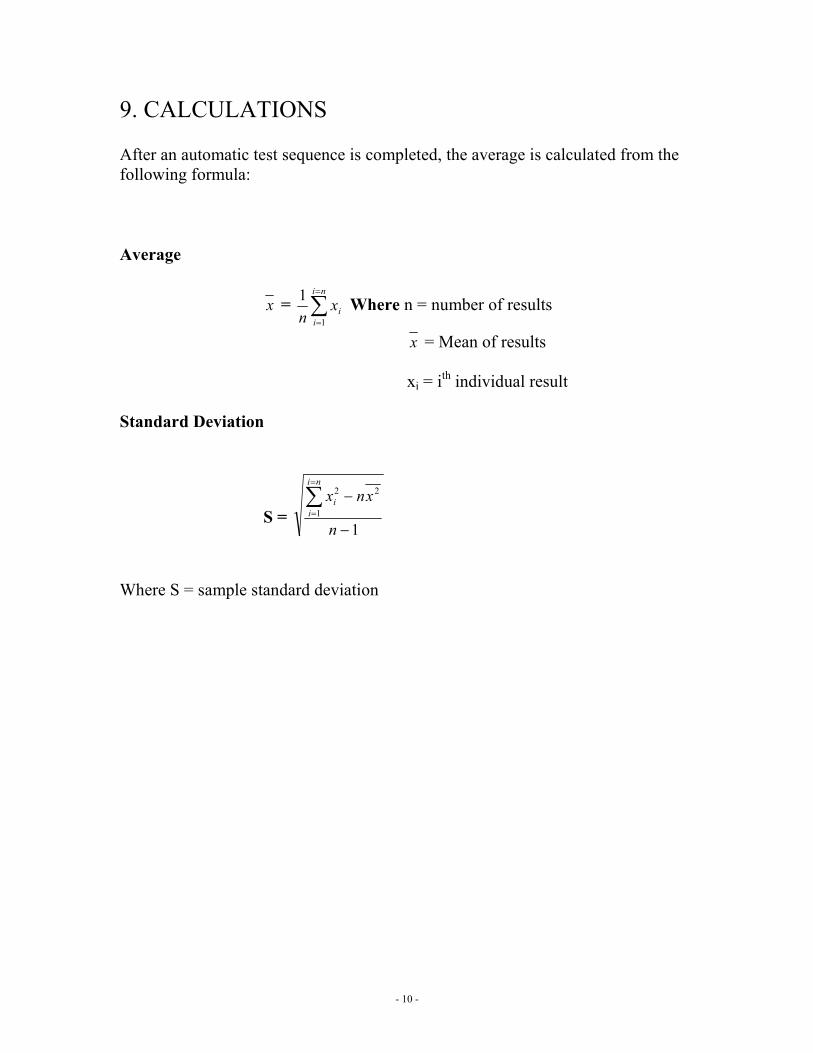
9. CALCULATIONS After an automatic test sequence is completed, the average is calculated from the
following formula:
Average
x = ∑=
=
ni
i
ixn 1
1 Where n = number of results
x = Mean of results
xi = ith
individual result
Standard Deviation
S = 1
1
22
−
−∑=
=
n
xnxni
i
i
Where S = sample standard deviation
- 11 -
What are the properties of good Transformer Oil?
What is the schedule for testing of Transformer Oil?
Compare the appearance of Transformer oil before and after testing.
Explain the test procedure of transformer oil with suitable reason.
Explain the results of transformer oil breakdown from the BS148 & IEC
156.
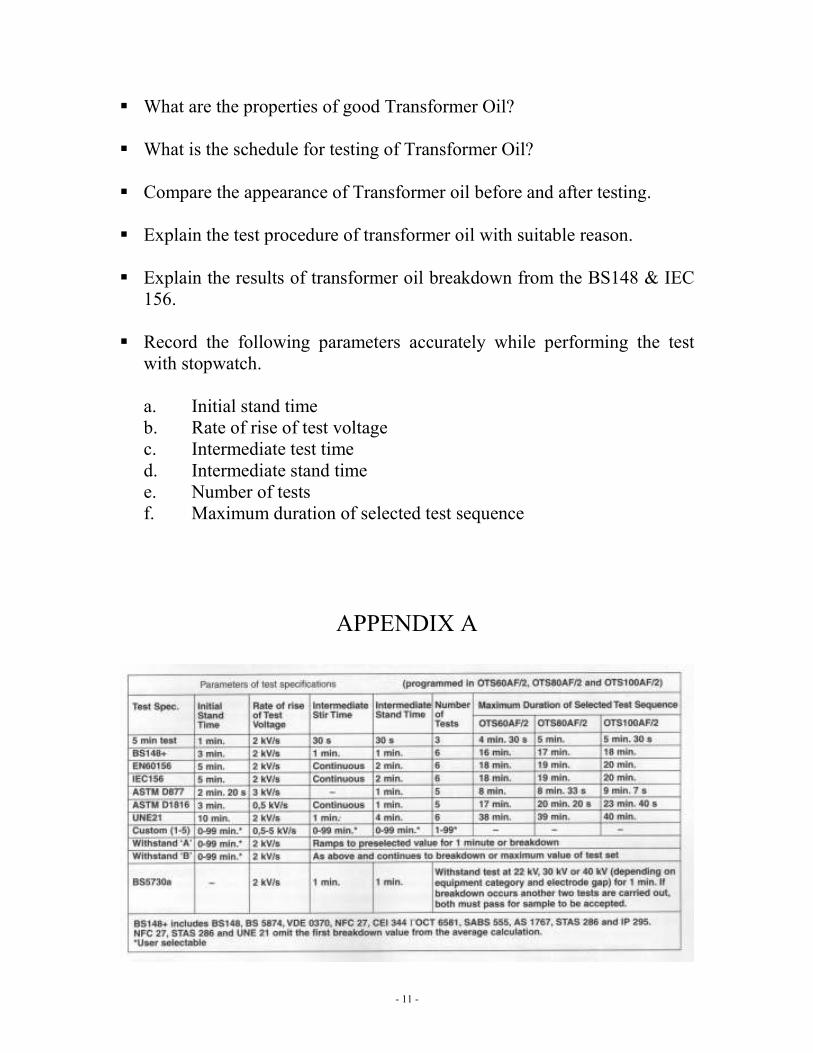
Record the following parameters accurately while performing the test
with stopwatch.
a. Initial stand time
b. Rate of rise of test voltage
c. Intermediate test time
d. Intermediate stand time
e. Number of tests
f. Maximum duration of selected test sequence
APPENDIX A
- 12 -
- 13 -

- 14 -
- 15 -
TRANSFORMER MINERAL OIL BRITISH STANDARD: BS 148
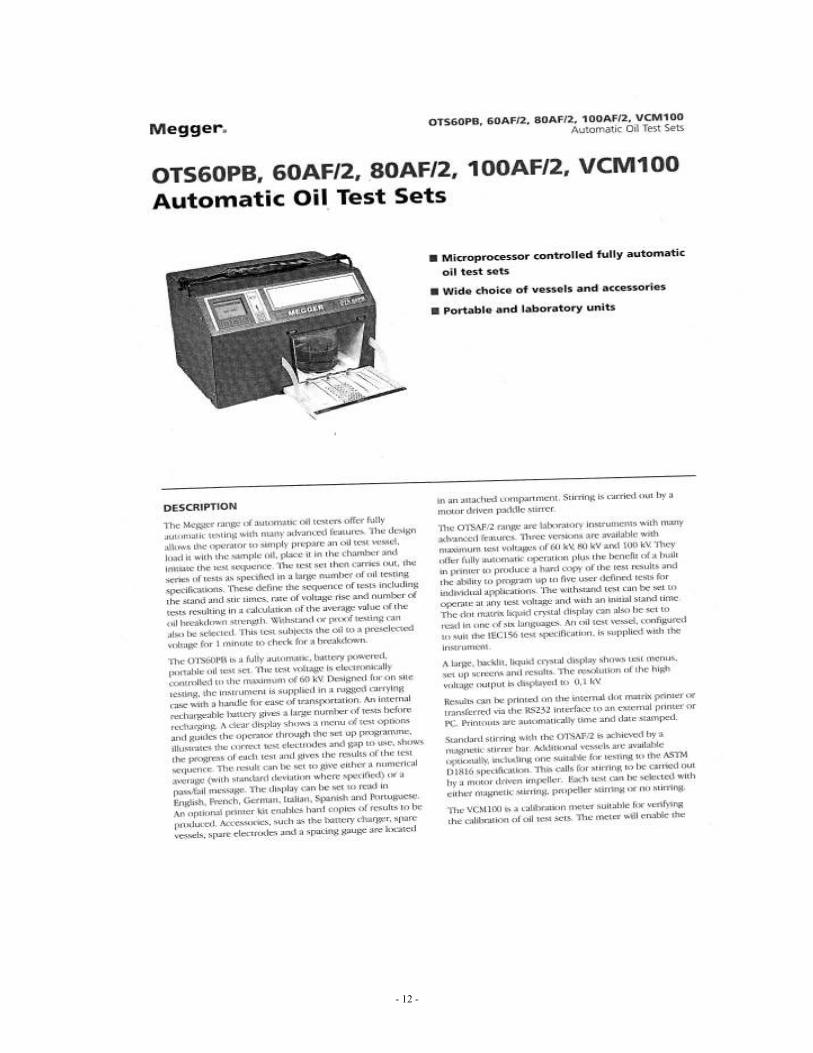
DESCRIPTION
Transformer Oil is a high quality electrical insulating oil. It is manufactured using specially selected base stocks to help provide protection against oxidation and sludge formation. Careful processing and handling ensure that the oil is stable and free of water and other contaminants and remains so until it reaches the user.
RECOMMENDED FOR
Transformer Oil is recommended for use as an electrical insulating oil in applications such as transformers, oil immersed switchgear, circuit breakers, oil filled capacitors, tap changers, electrical enclosures and fuses, where an oil meeting the Australian Standard, British Standards Institution, International Electro technical Commission or other comparable specification is required by the equipment manufacturer or user.
It should not be used where safety considerations require the use of non-flammable insulating oil.
PRODUCT BENEFITS
Good insulating properties, achieved by high dielectric strength and low dielectric loss tangent (power factor) are the result of careful control in manufacture and handling. High dielectric strength ensures good insulation of electrical conductors and prevention of arcing between electrodes under the voltage stresses encountered in normal insulating oil service. Low loss tangent minimises energy loss due to the changing polarity of the alternating current.
Good heat transfer and fluid flow characteristics as a result of low viscosity and low pour point. This assures effective cooling of transformer cores and windings, and ease of operation of switches, circuit breakers, pumps, regulators, load tap changer mechanisms, etc.
Good oxidation stability minimises development of sludge and acidity in storage and service. Sludge and acidity can have an adverse effect on the electrical properties and cooling ability of the oil and shorten service life.
ELECTRICAL CHARACTERISTICS
The Dielectric Breakdown Strength of an insulating material is a measure of its resistance to electrical breakdown when an electric potential is applied across it.
Immersing two electrodes in a sample of the oil, then applying an AC voltage across the electrodes test electrical insulating oils. The voltage is then increased in a specified manner until electrical breakdown occurs. The various tests used differ in electrode spacing and shape, rate of increase of voltage and thus give different breakdown values for the same oil.
The important consideration, however, is that oils meeting the minimum dielectric breakdown strength
have adequate insulating ability for all normal applications for which they are recommended.
- 16 -
The dielectric strength of insulating oil is reduced if there is water or solid particles in the oil. Also,
oxidation products, resulting from oil deterioration in service, lower the dielectric strength. As a result
periodic checks of the dielectric strength of an oil can be a useful method of determining whether
contamination or deterioration of oil has occurred.
Any two adjacent conductors form a capacitor. In an ideal capacitor, the phase difference between an
applied AC voltage and the current is 90° and the power dissipated is zero. If the dielectric between the
conductors is less than ideal, the phase difference will be less than 90° and some power dissipation will
occur. In order to keep this loss low, it is desirable to have the dielectric as near to ideal as is practical.
For insulating oils the value for this characteristic is called the power factor, or loss tangent (dissipation
factor) and is expressed as a percentage at a specified temperature. These values are determined
experimentally and represent trigonometric functions of the angle of phase difference. With the
particular functions used, a value of zero would represent a 90° phase difference and the ideal condition,
therefore low values are desirable.
Oxidation and contamination of an oil can cause power factor or loss tangent of an oil to rise, so
determination of this property may provide useful information about a used electrical insulating oil.
Since these values vary with temperatures, comparisons must always be made at the same temperature.
The resistivity of electrical insulating oil is a measure of the resistance to DC current flow between
conductors. The resistivity of mineral insulating oil is naturally high but, as with loss tangent, is very
sensitive to the presence of even minute amounts of suspended water, free ions or ion forming materials
such as acidic oxidation products or polar contaminants. Again, measurement of the resistivity of used
insulating oil may provide useful information as to whether or not the oil is suitable for further service.
SERVICE CONSIDERATIONS
The sensitivity of the electrical insulating oil properties to contaminants, such as water and solid
particles, makes it extremely important to handle and store these products so that the risk of
contamination is minimised.
As a general rule, all shipments of electrical insulating oils should be tested for dielectric strength
before being placed in service. If the dielectric breakdown strength is low, the oil should be polished by
filtration and/or dehydration.
Drums of electrical insulating oils should be stored indoors. If drums must be stored outside, they
should be placed on their sides on racks that will keep them clear of any ground water. The bungs
should be positioned low to prevent them from breathing moisture. The drums should be protected with
a waterproof cover to keep off rain, and to protect the drum markings from being obliterated.
Electrical insulating oils in service should be checked at periodic intervals to determine if they are suitable
for continued service. Proper sampling is critical.
- 17 -
EET 4106 HIGH VOLTAGE ENGINEERING
EXPERIMENT 2
ANALYSIS, DESIGN AND SIMULATION OF IMPULSE
GENERATING CIRCUITS
1. Objectives
To analyse single-stage impulse generating circuits and derive expressions for front
and tail times.
To design circuit parameters to generate lightning and switching impulses of
specified waveshape.
To simulate the impulse generating circuit using MATLAB simulink (or any other
simulation software) and verify the design.
2. Introduction
Transient overvoltages due to lightning and switching surges cause steep build-up of
voltage on transmission lines and other electrical apparatus. Experimental investigations
showed that impulse voltage is a unidirectional voltage with a rise time of 0.5 to 10 µs and decay time to 50% of the peak value of the order of 30 to 200 µs. The waveshapes
are arbitrary, but could be either positive or negative. The maximum value is called the
peak value of the impulse and the impulse voltage is specified by this value. If an impulse
voltage develops without causing flash over or punctures, it is called a full impulse
voltage. If flash over or puncture occurs, thus causing a sudden collapse of the impulse
voltage, it is called a chopped impulse voltage. The lightning overvoltage can be
represented by equation
V = V0e-αt
– e-βt
(1)
where α and β are constants of microsecond values.
The above equation represents a unidirectional wave, which usually rises rapidly to the
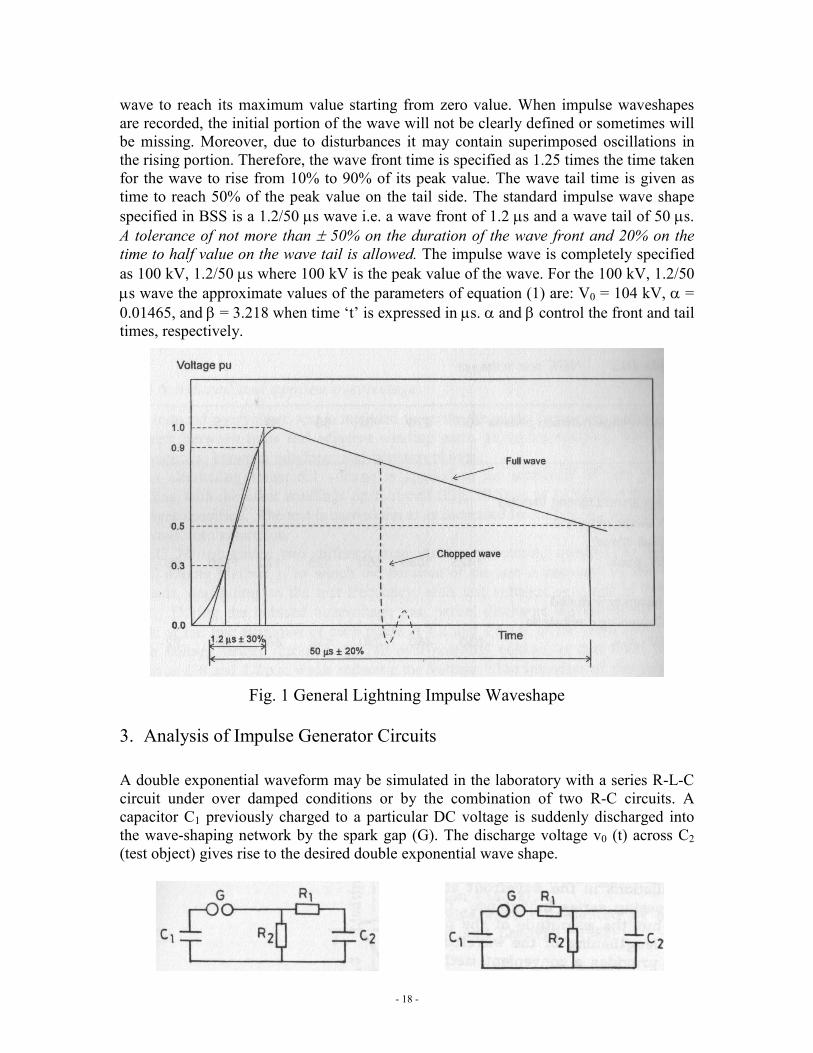
peak value and slowly falls to zero value. The general waveshape is given Fig. 1. A full
impulse voltage is characterized by its peak value and its two time intervals, the wave
front and wave tail time intervals. Thus, 1.2/50 µs, 1000 kV wave represents an impulse
voltage wave with a front time of 1.2 µs, fall time to 50% peak value of 50 µs, and a peak
value of 1000 kV. Hence, the wave front time of an impulse wave is the time taken by the
- 18 -
wave to reach its maximum value starting from zero value. When impulse waveshapes
are recorded, the initial portion of the wave will not be clearly defined or sometimes will
be missing. Moreover, due to disturbances it may contain superimposed oscillations in
the rising portion. Therefore, the wave front time is specified as 1.25 times the time taken
for the wave to rise from 10% to 90% of its peak value. The wave tail time is given as
time to reach 50% of the peak value on the tail side. The standard impulse wave shape
specified in BSS is a 1.2/50 µs wave i.e. a wave front of 1.2 µs and a wave tail of 50 µs.
A tolerance of not more than ± 50% on the duration of the wave front and 20% on the
time to half value on the wave tail is allowed. The impulse wave is completely specified
as 100 kV, 1.2/50 µs where 100 kV is the peak value of the wave. For the 100 kV, 1.2/50
µs wave the approximate values of the parameters of equation (1) are: V0 = 104 kV, α =
0.01465, and β = 3.218 when time ‘t’ is expressed in µs. α and β control the front and tail
times, respectively.
Fig. 1 General Lightning Impulse Waveshape
3. Analysis of Impulse Generator Circuits
A double exponential waveform may be simulated in the laboratory with a series R-L-C
circuit under over damped conditions or by the combination of two R-C circuits. A
capacitor C1 previously charged to a particular DC voltage is suddenly discharged into
the wave-shaping network by the spark gap (G). The discharge voltage v0 (t) across C2
(test object) gives rise to the desired double exponential wave shape.
- 19 -
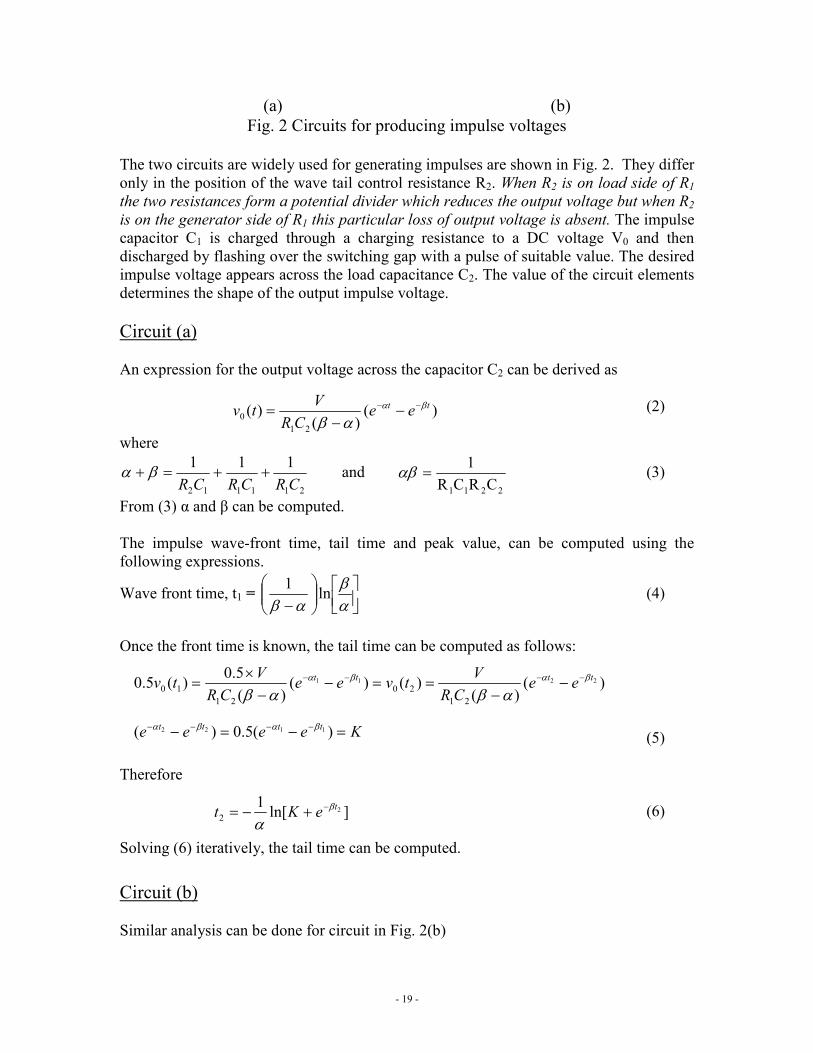
(a) (b)
Fig. 2 Circuits for producing impulse voltages
The two circuits are widely used for generating impulses are shown in Fig. 2. They differ
only in the position of the wave tail control resistance R2. When R2 is on load side of R1
the two resistances form a potential divider which reduces the output voltage but when R2
is on the generator side of R1 this particular loss of output voltage is absent. The impulse
capacitor C1 is charged through a charging resistance to a DC voltage V0 and then
discharged by flashing over the switching gap with a pulse of suitable value. The desired
impulse voltage appears across the load capacitance C2. The value of the circuit elements
determines the shape of the output impulse voltage.
Circuit (a)
An expression for the output voltage across the capacitor C2 can be derived as
(2)
where
211112
111
CRCRCR++=+ βα and
2211 CRCR
1=αβ (3)
From (3) α and β can be computed.
The impulse wave-front time, tail time and peak value, can be computed using the
following expressions.
Wave front time, t1 =
− α
βαβ
ln1
(4)
Once the front time is known, the tail time can be computed as follows:
(5)
Therefore
(6)
Solving (6) iteratively, the tail time can be computed.
Circuit (b)
Similar analysis can be done for circuit in Fig. 2(b)
)()(
)(21
0
tt eeCR
Vtv βα
αβ−− −
−=
)()(
)()()(
5.0)(5.0 2211
21
20
21
10
ttttee
CR
Vtvee
CR
Vtv
βαβα
αβαβ−−−− −
−==−
−×
=
Keeee tttt =−=− −−−− )(5.0)( 1122 βαβα
]ln[1
2
2
teKt
β
α−+−=
- 20 -
4. Design of Circuit Parameters for a given waveshape
Determination of α and β for given front and tail times for circuit in Fig. 2(a).
From (3) we can write
+=αβ
αβ ln1
1t (7a)
From (5) we can write
where K is defined in (5) (7b)
Solving (7a) and (7b) using Gauss iterative technique α and β for given front and tail
times can be computed.
Determination of R1 and R2 for the specified C1 and C2 and for the given
α and β
Usually the load capacitance C2 will be fixed by the test equipment (load). For the
given value of the load capacitor C2 the source capacitance C1 is normally chosen 5 –
10 times C2 for better voltage efficiency. Hence we have to design R1 and R2 for the
given α and β, and C1 and C2.
Let
211112
111
CRCRCRa ++=+= βα and
2211 CRCR
1== αβb
From these two equations we can derive
+−+
+=
1
21
2
2
21
2
)(4
)(2
1
bC
CC
b
a
b
a
CCR (8)
and 221
1CRbC
1=R (9)
+
= −Ket
t2
1ln
1
2
βα
- 21 -
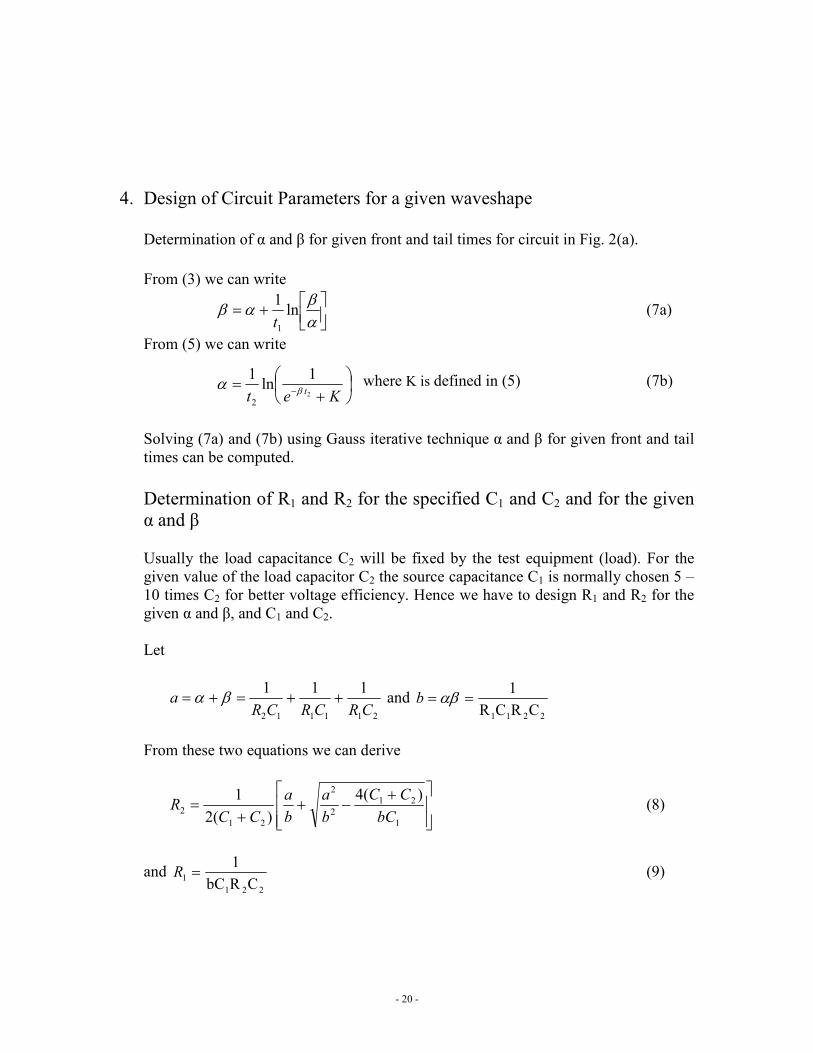
5. Simulation of the Impulse Generation Circuit
The following circuit may be used to simulate the circuit to generate the impulse voltage
using MATLAB Simulink.
Figure 3 Circuit for generating impulse voltage
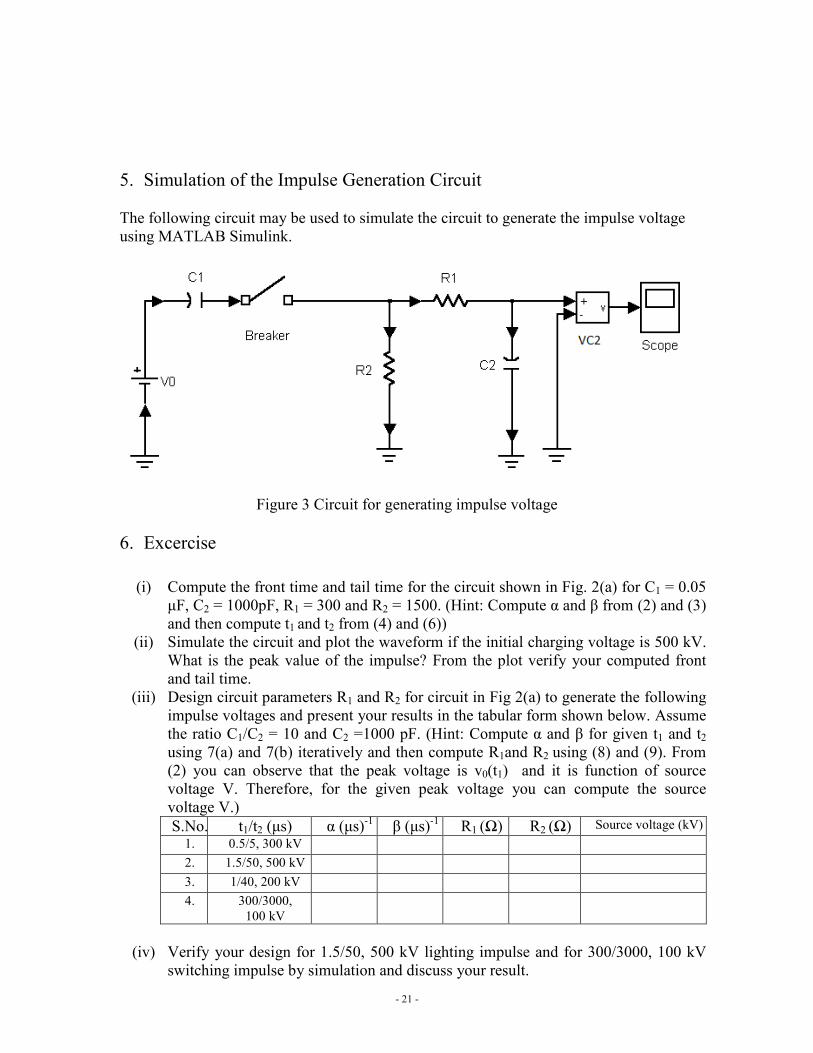
6. Excercise
(i) Compute the front time and tail time for the circuit shown in Fig. 2(a) for C1 = 0.05
µF, C2 = 1000pF, R1 = 300 and R2 = 1500. (Hint: Compute α and β from (2) and (3)
and then compute t1 and t2 from (4) and (6))
(ii) Simulate the circuit and plot the waveform if the initial charging voltage is 500 kV.
What is the peak value of the impulse? From the plot verify your computed front
and tail time.
(iii) Design circuit parameters R1 and R2 for circuit in Fig 2(a) to generate the following
impulse voltages and present your results in the tabular form shown below. Assume
the ratio C1/C2 = 10 and C2 =1000 pF. (Hint: Compute α and β for given t1 and t2
using 7(a) and 7(b) iteratively and then compute R1and R2 using (8) and (9). From
(2) you can observe that the peak voltage is v0(t1) and it is function of source
voltage V. Therefore, for the given peak voltage you can compute the source
voltage V.)
S.No. t1/t2 (µs) α (µs)-1
β (µs)-1
R1 (Ω) R2 (Ω) Source voltage (kV)
1. 0.5/5, 300 kV 2. 1.5/50, 500 kV 3. 1/40, 200 kV 4. 300/3000,
100 kV
(iv) Verify your design for 1.5/50, 500 kV lighting impulse and for 300/3000, 100 kV
switching impulse by simulation and discuss your result.

- 22 -
(v) Give a brief write up about what you have learned from this experiment.