faculty of economics and business faculty of resource ... of escherichia coli in the serin river,...
TRANSCRIPT
Modelling of Escherichia coli in The Serin River, Serian Using The
QUAL2K Model
Lim Swee Wee
Bachelor of Science with Honours
(Resource Biotechnology)
2010
Faculty of Economics and Business
Faculty of Resource Science and Technology
Modelling of Escherichia coli in The Serin River, Serian Using The QUAL2K Model
LIM SWEE WEE
(18860)
A thesis submitted in partial fulfilment of the requirement for the degree of Bachelor of
Science with Honours (Resource Biotechnology)
Faculty of Resource Science and Technology
UNIVERSITI MALAYSIA SARAWAK
2010
i
Acknowledgments
My greatest gratitude to my supervisor, Assoc. Prof. Dr. Ling Teck Yee for giving me the
opportunity to work on this project under her guidance, her valuable advice, and most
certainly her generous suggestions and encouragements. I would like to also thank my co.
supervisor, Dr. Lesley Maurice Bilung for her help in the microbiology part of my project
and her assistance in providing the microbiology lab for analysis. Besides that, I would like
to dedicate my special thanks to Ms. Kho Chui Ping (MSc candidate) for sharing her
experiences and knowledge with me throughout my project and also to Ms Koh Kai Ling
(MSc candidate) and Ms. Cheng Yik Ming (MSc candidate) for their help in the
microbiology lab. Furthermore, many thanks to the staffs, especially UNIMAS drivers, and
lab assistants that assisted me during the many field trips. Not to forget to mention my
warmest grateful and thankful to my fellow course mates that assisted me during the entire
project. Lastly, I would like to thank my parents for their understandings and supports.
ii
Table of Contents
Acknowledgement……………………………………………………………………... i
Table of Contents………………………………………………………………............ ii
List of Abbreviations…………………………………………………………….......... v
List of Tables and Figures…………………………………………………….............. vi
Abstract………………………………………………………………………………... ix
1.0 Introduction & Objectives…………………………………………………… 1
2.0 Literature Review………………………………………………………........ 3
2.1 Water Quality Monitoring ……………………………………….. 4
2.2 Conventional Water Pollutants………………………………........ 4
2.2.1 Faecal Indicator Organisms…………………………. 4
2.2.1.1 Faecal Coliforms……………………… 5
2.2.1.2 Escherichia coli………………………...... 6
2.2.2 Suspended Solids …………………………………... 7
2.3 Source of Pollutants ……………………………………………… 8
2.3.1 Animal Farming in Sarawak ………………….…..... 8
2.3.1.1 Waste Effluents from Animal Farming... 9
2.3.2 Agriculture Run-Off…………………………………. 10
2.4 Surface Water Quality Modelling………………………………… 11
2.4.1 History of QUAL Model…………………………….. 11
2.4.2 QUAL2E Model……………………………………... 12
2.4.3 QUAL2K Model……………………………………... 12
2.4.3.1 Modelling Process…………………… 14
iii
2.5 Faecal Bacteria Die-Off Rate……………………………………. 15
2.5.1 Natural Die-Off Rate of Bacteria……………………. 16
2.5.2 Effect of Solar Radiation on Die-Off Rate of Bacteria 17
2.5.3 Effect of Settling on Die-Off Rate of Bacteria……... 18
3.0 Materials and Methods……………………………………………………... 20
3.1 Study Area……………………………………………………….. 20
3.2 Sample Collection and Storage…………………………………... 22
3.3 Data Collection………………………………………………….... 22
3.3.1 In-situ Data Collection……………………………..... 22
3.3.2 Field Measurement……………............................... 22
3.3.2.1 Geometric Characteristics…………… 22
3.3.2.2 Hydraulic Characteristics……………. 24
3.3.3 Meteorological Data…………………………………. 25
3.4 Analysis of Sample……………………………………………...... 25
3.4.1 Total Suspended Solids…………………………….... 25
3.4.2 Bacterial Analysis……………………………………. 26
3.4.2.1 Enumeration and Isolation of
E. coli using Spread Plate Method..…
26
3.5 Statistical Analysis……………………………………………..... 27
3.6 Water Quality Modelling………………………………………… 27
3.6.1 Calibration and Validation…………………………... 30
3.6.2 Data Input…………………………………………... 30
3.6.3 Application of the Model…………………………… 31
4.0 Results and Discussion……………………………………………………. 32
4.1 Hydrogeometric Data……………………………………………. 32
iv
4.1.1 Depth………………………………………………... 32
4.1.2 Width………………………………………………... 33
4.1.3 Flow……………………………………………….... 34
4.2 In-situ Data………………………………………………………. 35
4.2.1 Temperature………………………………………… 35
4.2.2 Solar Radiation……………………………………... 37
4.2.3 pH…………………………………………………... 39
4.2.4 Total Suspended Solids…………………………….. 41
4.2.5 Dissolved Oxygen………………………………….. 43
4.3 E. coli Concentration……………………………………………. 45
4.4 Correlation Study………………………………………………… 47
4.5 Die-Off Rate of E. coli………………………………………...... 47
4.6 Modelling Results………………………………………………... 50
4.6.1 Calibration Results…………………………………. 51
4.6.2 Validation Results………………………………….. 54
4.6.3 Prediction Results………………………………….. 56
4.6.3.1 Prediction of Suitability for Drinking
Water Purpose...................................
56
4.6.3.2 Prediction of Suitability for
Recreational Uses……………………
57
5.0 Conclusions……………………………………………………………....... 59
References……………………………………………………………………….….... 60
Appendices…………………………………………………………………………… 66
Appendix A……………………………………………………………………...…… 66

v
List of Abbreviations
CFU Colony Forming Units
DO Dissolved Oxygen
EMB Eosin Methylene Blue
g/d Gram per Day
g/m3/d Gram per Cubic Meter per Day
IMViC Indole, Methyl Red, Voges-Proskauer, and Citrate
ly hr-1
Langleys per Hour
m2 Square Meter
m3/s Cubic Meter per Second
m/d Meter per Day
mg/d Milligram per Day
mg/m3/d Milligram per Cubic Meter per Day
MPN Most Probable Number
NWQS National Water Quality Standards for Malaysia
TCBS Thiosulfate-Citrate-Bile-Salts-Sucrose
TSS Total Suspended Solids
vi
List of Tables
Table 1: Segmentation of Serin River, Serian................................................ 29
Table 2: Data for calibration and validation.................................................. 31
Table 3: Reaction coefficients that were adopted for QUAL2K model........... 32
Table 4: Mean depth at different stations...................................................... 33
Table 5: Mean width at different stations...................................................... 34
Table 6: Mean flow at different stations........................................................ 35
Table 7: Mean temperature at different stations............................................ 37
Table 8: Mean solar radiation at different stations........................................ 39
Table 9: Mean pH at different stations....................................................... 41
Table 10: Mean total suspended solids at different stations............................. 43
Table 11: Mean DO at different stations...................................................... 45
Table 12: Mean concentrations of E. coli at different stations........................ 47
Table 13: Temperature dependent die-off rate of E. coli using Equation 6..... 49
Table 14: Solar radiation dependent die-off rate of E. coli using Equation 7.. 49
Table 15: Settling dependent die-off rate of E. coli using Equation 9............ 50
Table 16: Total die-off rate of E. coli using Equation 4................................. 50
Table 17: Diffuse flow and non-point E. coli sources.................................... 52
Table 18: Data inputs for model calibration during low tide and high tide...... 53
Table 19: Data inputs for model validation during low tide and high tide....... 55
Table 20: The maximum concentration of E. coli allowed to qualify for Class
IIB water quality........................................................................
58
Table 21: National Water Quality Standards for Malaysia (DOE, 2008)......... 67
Table 22: Water classes and uses (DOE, 2008)............................................ 67

vii
Table 23: Enumeration of E. coli and V. cholerae using Most Probable
Method..........................................................................................
68
Table 23: MPN index for 5 tubes per dilution (10 ml, 1 ml and 0.1ml)
(Clesceri et al., 1998)...................................................................
69
viii
List of Figures
Figure 1: Sampling stations of Serin River where a total of five stations
located along the main river and four tributaries that were
studied with the location of different land uses along the river.....
20
Figure 2: Geometry representation of the river…………………………….. 23
Figure 3: Segmentation of Serin River for QUAL2K model application
(Kho, 2009)…................................................................................
30
Figure 4: Graphical representation of mean temperature at different
stations…………………………………………………………....
37
Figure 5: Graphical representation of mean solar radiation at different
stations……………………………………………………………
39
Figure 6: Graphical representation of mean pH at different stations………. 41
Figure 7: Graphical representation of mean total suspended solids at
different stations……………………………………………….….
43
Figure 8: Graphical representation of mean DO at different stations……… 45
Figure 9: Graphical representation of mean E. coli concentration at
different stations…………………………………………..……….
47
Figure 10: Calibration results of flow and E. coli concentration during
low tide of the Serin River using QUAL2K model………………..
54
Figure 11: Calibration results of flow and E. coli concentration during
high tide of the Serin River using QUAL2K model………………
54
Figure 12: Validation results of flow and E. coli concentration during
low tide of the Serin River using QUAL2K model……………….
56
Figure 13: Validation results of flow and E. coli concentration during
high tide of the Serin River using QUAL2K model…………..….
56
Figure 14: Prediction results of E. coli concentration for drinking
water source without input from Sg. Bukah during low tide of the
Serin River using QUAL2K model. a) during low tide and b)
during high tide.............................................................................
57
Figure 15: Prediction results of E. coli concentration of the Serin River for
recreational purposes using QUAL2K model. a) during low tide
and b) during high tide...............................................................
59
ix
Modelling of Escherichia coli in The Serin River, Serian Using The QUAL2K Model
Lim Swee Wee
Resource Biotechnology Programme
Faculty of Resource Science and Technology
University Malaysia Sarawak
ABSTRACT
Serin River is an important river because it is a source of drinking water and is used for recreation by the
villagers. Hence, the objectives of this study were to determine the impact of different land uses on the faecal
bacteria concentration and to determine the suitability and reliability of QUAL2K model to predict faecal
bacteria concentration in the river water. A total of 8 trips were made from September 2009 till March 2010
with 5 stations along the main river and 4 tributaries that were studied. Results of analysis showed that
tributaries that received pig farm effluent recorded significantly higher mean concentration of Escherichia
coli (E. coli) of 3.31 log CFU/mL and total suspended solids (TSS) of 57 mg/L. Present study also showed
that there is significant correlation between E. coli concentration and TSS. According to the NWQS, all the
stations fell into Class III and Class IV based on E. coli concentration. The model was calibrated and
validated using field data from October 2009 to March 2010. The prediction results showed that for the river
water to be suitable as drinking water source, no E. coli contamination should be discharged from the
headwater and from Sg. Bukah. As for the suitability of river water for recreational purposes, the maximum
recommended concentration of E. coli allowed for the headwater, SB, SP and SR; were <400 CFU/100mL,
<900 CFU/100mL, <1000 CFU/100mL and <380 CFU/100mL respectively during low tide, and during high
tide, maximum concentration of E. coli allowed were <400 CFU/100mL, <1600 CFU/100mL, <2500
CFU/100mL and <510 CFU/100mL respectively. It is recommended that further studies be conducted on
monitoring water quality by using models to ensure long term planning and sustainability use of river water.
Key words: Water quality, animal farming, agriculture run-off, E. coli, QUAL2K.
ABSTRAK
Sungai Serin merupakan sebatang sungai yang penting kerana ia merupakan sumber air minuman serta
digunakan oleh penduduk tempatan untuk tujuan rekreasi. Maka, objektif-objektif kajian ini adalah untuk
menentukan kesan pengunaan tanah yang pelbagai jenis terhadap kepekatan bakteria najis, dan bagi
menentukan kesesuaian dan kebolehpercayaan model QUAL2K dalam meramalkan kepekatan bacteria najis
dalam air sungai. Keputusan analisa menunjukkan anak sungai yang menerima efluen ladang khinzir
mempunyai jumlah purata nyata yang lebih tinggi secara signifikan berbanding anak sungai yang tidak
menerima efluen, di mana Escherichia coli (E. coli) berjumlah 3.31 log CFU/mL dan jumlah pepejal
terampai (TSS) berjumlah 57 mg/L. Kajian menunjukkan bahawa terdapat korelasi yang signifikan antara
kepekatan E. coli dan TSS. Menurut NWQS, semua stesen jatuh ke dalam Kelas III dan Kelas IV berdasarkan
kepekatan E. coli, di mana. Model ditentukur dan disahkan menggunakan data kajian dari Oktober 2009
hingga Mac 2010. Keputusan meramal menunjukkan bahawa tiada pencemaran E. coli daripada hulu sungai
dan daripada Sg. Bukar adalah perlu supaya air sungai dapat dijadikan sebagai sumber air minuman.
Kesesuaian air sungai untuk tujuan rekreasi adalah bergantung kepada kepekatan E. coli di hulu sungai dan
daripada anak sungai di mana, cadangan kepekatan maksima E. coli semasa air surut daripada hulu sungai
adalah <400 CFU/100mL, SB adalah <900 CFU/100mL, SP adalah <1000 CFU/100mL dan SR adalah
<380 CFU/100mL. Kepekatan maksima E. coli semasa air pasang daripada hulu sungai adalah ,400
CFU/100mL, SB adalah <1600 CFU/100mL, SP adalah <2500 CFU/100mL dan SR adalah <510
CFU/100mL. Adalah dicadangkan bahawa kajian lanjutan dijalankan berkaitan penilaian kualiti air dengan
menggunakan model matematik supaya perancangan masa depan dapat dijalankan dan untuk memastikan
kepelbagaian gunaan air sungai.
Kata kunci: Kualiti air, lading haiwan, peningkatan larian pertanian, E. coli, QUAL2K.
1
1.0 Introduction
Constant developments along rivers and streams have been great threats to water quality.
Effluents discharge from animals’ farms, agricultures and residential areas have been a
great source of microbial contamination along the river that prevents the usage of river
water for drinking and recreational purposes (Ganoulis et al., 2005; Ling et al., 2006;
Pappas et al., 2008). Animal wastes have been known to harbour pathogenic organisms
that could cause water-related infectious diseases such as dysentery, cholera,
gastroenteritis, salmonellosis and typhoid fever (Bitton, 1994; Maier et al., 2009; Mara &
Horan, 2003; Steynberg et al., 1995). Therefore, there is a need to understand the
persistence of bacteria in the river so that proper management of waste can be planned.
The major source of organic contamination in Malaysia rivers were caused by
continued discharge of untreated or partially treated waste from human and pigs (Muyibi et
al., 2008). DOE (2008) had reported that monitoring stations in Sarawak showed that 8
river basins were found to be clean and 13 river basins were found to be slightly polluted.
A study by Ling et al. (2006) has shown that tributary that received pig farm effluent
recorded higher level of BOD5, COD, and Escherichia coli (E. coli) when compared to
other tributaries. The DO recorded was also not suitable for aquatic life.
Microbial water quality modelling is used to predict bacterial concentration in
rivers and streams by determining the decay rate of bacteria in the environment. Faecal
coliforms are the most common indicator of microbial contamination in water (Ham &
Kobori, 2009; Mishra et al., 2008). A common approach would be to predict initial loading
concentration of fecal coliforms and the die-off rate as a function of time or distance
travelled from the source and of environmental conditions (Bowie et al., 1985).
2
Hohls et al. (1995), Steynberg et al. (1995) and Venter et al. (1997) had used
QUAL2E model to simulate microbial water quality, but most of the time, the model was
not able to predict microbial concentration accurately. DNR (2007) had used QUAL2K, a
modernised version of QUAL2E, to measure total maximum loads for E. coli but the
amount of sites studied was insufficient. Kho (2009) and Srikaran (2009) had used
QUAL2K model to simulate water quality in the Serin River but the concentration of
faecal bacteria was not simulated. Thus, in this study, QUAL2K model will be used to
simulate different scenarios on the impact of land use on faecal bacteria concentration in
the Serin River.
Objectives
The objectives of this study were:
1. to determine the impact of different land uses on the fecal bacterial concentration in
Serin River, Serian, Sarawak.
2. to determine the suitability and reliability of QUAL2K model to predict fecal
bacterial concentration in the Serin River, Serian, Sarawak.
3
2.0 Literature Review
2.1 Water Quality Monitoring
Water quality monitoring is important to provide a constant updated archive of water
quality data and also allow constant monitoring of pollution sources. Some of the pollution
sources that deteriorate surface water quality are municipal and domestic wastewater,
industrial and agricultural wastes and solid and semisolid refuse (Viessman & Hammer,
2005).
The Department of Environment (DOE) has set up a total of 1,063 monitoring
stations located at 143 river basins during 2008 to detect water quality changes in river
water quality and to identify the pollution sources (DOE, 2008). Using Water Quality
Index (WQI) stipulated by the National Water Quality Standards for Malaysia (NWQS), it
was found that, out of these 1,063 monitoring stations, 612 (58%) were found to be clean,
412 (38%) were found to be slightly polluted and 39 (4%) were polluted. Out of the 143
river basins monitored, 21 were located at Sarawak with 8 river basins found to be clean
and 13 river basins found to be slightly polluted (DOE, 2008). The amount of clean river
basins had also dropped from 91 clean rivers in 2007 to 76 clean rivers in 2008. This was
due to increased in pollutant from sewage treatment plants, agro-based factories and pig
farms. In addition to that, prolonged dry spell in Pahang (5 rivers) and Sarawak (11 rivers)
resulted in deterioration of clean rivers to slightly polluted rivers (DOE, 2008).
The DOE had also reported that 4.48% of water pollution sources were from pig
farming. The rest of the pollution sources were from sewage treatment plants (54.01%),
manufacturing industries (38.73%) and agro-based industries (2.78%). The amount of pig
farms had also increased from 779 in 2007 to 788 farms in 2008 which partly explained the
deterioration of clean rivers in Malaysia (DOE, 2008). Muyibi et al. (2008) had pointed out
4
that the major source of organic contamination in Malaysia rivers were caused by
continued discharge of untreated or partially treated waste from human and pigs.
2.2 Conventional Water Pollutants
Some of the conventional water pollutants are biochemical oxygen demand (BOD),
suspended solids, fecal coliforms, pH, ammonia nitrogen, phosphorus, oil and grease, and
chlorine residual (Viessman & Hammer, 2005). National Water Quality Standards for
Malaysia (NWQS) has set up a guideline to control the concentration of pollutants in the
river by designating water quality index for different degrees of contaminations. Refer
Appendix A for classification.
2.2.1 Fecal Indicator Organisms
Fecal microorganisms are commonly used as an indicator for fecal contamination in the
river (Ham & Kobori, 2009; Mishra et al., 2008). Some of the characteristics of an ideal
fecal indicator organisms are member of the intestinal microflora of warm-blooded
animals, present when pathogens are present and absent in uncontaminated samples,
present in greater numbers than the pathogen, at least equally resistant as the pathogen to
environment harshness and to disinfection in water and wastewater treatment plants, not
multiply in the environment, detectable by means of easy, rapid and inexpensive methods,
and indicator organisms should be non-pathogenic (Bitton, 1994).
5
2.2.1.1 Faecal Coliforms
The coliforms group consists of faecal and non-faecal coliforms. Some of the
characteristics of coliforms group include aerobic and facultative anaerobic, gram-
negative, non-spore-forming, rod-shaped bacteria that ferment lactose with gas production
within 48 hours. Coliforms group are discharged in high numbers (2 X 10⁹ coliforms per
day per capita) in human and animal faeces (Bitton, 1994).
The faecal coliforms are mainly from the Escherichia and Klebsiella genera
whereas the non-faecal coliforms are mainly from the Enterobacter and Citrobacter genera
(Bowie et al., 1985). Faecal coliforms are the most common indicator of microbial
contamination in water due to their risk of infectious diseases towards human. The most
common test to enumerate and isolate faecal coliforms is through multiple-tube
fermentation where incubation is elevated to a higher temperature at around 44.5°C ±0.2°C
(Bowie et al., 1985; Mara & Horan, 2003).
Faecal coliforms can be introduced into the river through point and non-point
sources that include runoff from agriculture lands (Mishra et al., 2008), from discharges of
domestic effluents (Jordao et al., 2007), effluents from animal farm (Ling et al., 2006) and
wildlife animals (Ahmed et al., 2006), from combined sewer overflow and stormwater
effluents (Ham & Kobori, 2009), from industrial discharge (Akaninwor et al., 2006) and
effluents from wastewater treatment plants (Garcia-Armisen & Servais, 2007).
USEPA has recommended that the geometric mean bacterial concentration in
freshwater should be at 33 CFU/100ml for Enterococci and 126 CFU/100mL for E. coli
(USEPA, 2006). Previous studies by Ling et al. (2006) showed that E. coli concentration at
stations situated away from effluents discharge was in the range of 4-141 CFU/mL while
6
E. coli concentration at stations situated near effluents discharge was in the range of 4-10
000 CFU/mL.
2.2.1.2 Escherichia coli
E. coli is a non-sporing, gram negative, rod shape bacterium. It is a facultative anaerobic
microorganism and it ferments lactose. The common way to isolate E. coli would be to
streak on Eosin Methylene Blue (EMB) agar and observe for green metallic sheen colony
which indicates positive result for isolation of E. coli. EMB agar contains lactose which is
used by E. coli for fermentation and acid produced will result in precipitation of green
metallic pigment. The biochemical tests that are used usually to identify E. coli are gram
staining and IMViC test. E. coli will be stained pink or red colour due to the absence of a
thick peptidoglycan cell wall. IMViC test is an acronym that stands for indole, methyl red,
Voges-Proskauer and citrate test. A typical positive result of IMViC test for E. coli will be
++-- (Clesceri et al., 1998).
In recent years, E. coli had substituted faecal coliforms as the ideal indicator
organism because it is easier to distinguish than other faecal coliforms and have a high
occurrence rate in feces (Baudisova, 1997; Bitton, 1994; Edberg et al., 2000; Garcia-
Armisen & Servais, 2004; Tallon et al., 2005). There are several strains of E. coli in
gastrointestinal tract of humans and warm-blooded animals. Diarrhoea is caused by several
virulence strains, such as enterotoxigenic, enteropathogenic, enterohemorrhagic and
enteroinvasive strains where these strains represented approximately 2%-8% strains of E.
coli found in water (Bitton, 1994).
E. coli O157:H7 strain is of great importance because of its ability to cause severe
bloody diarrhea with abdominal cramping, especially with the very young and the very old
7
(Mara & Horan, 2003). In severe case, haemolytic uremic syndrome might occur and cause
kidney damage. There were several outbreak of this strain where in Cabool, Missouri
during winter of 1990, 243 diarrhea cases were reported and 4 registered deaths among the
elderly, and in Sakai, Japan, 1996, 6000 people were infected and 3 children dead (Bitton,
1994).
2.2.2 Suspended Solids
Suspended solids in river or streams are usually from eroded silt, organic silt, organic
detritus and plankton (Kinson et al., 2001). High suspended solids are present in polluted
rivers or streams (Ling et al., 2006; Ling et al., 2007). Several studies had shown that
surface water with high total suspended solids had higher fecal bacteria concentrations
(Fries et al., 2006; Hipsey et al., 2006; Rehmann & Soupir, 2009)
Fecal coliforms concentration in the river could be influenced by sediment
resuspension (Fries et al., 2008). Anderson et al. (2005) showed that fecal coliforms
recorded a higher decay rate when inoculated in saltwater sediments and water column
when compared to freshwater sediments and water column. The study had also shown that
fecal coliforms in freshwater sediments had lower average decay rate when compared to
fecal coliforms in freshwater column. Garcia-Armisen & Servais (2009) had reported that
the decay rate of free E. coli was on average twice higher than the decay rate of attached E.
coli. McFeters (1974) had shown that fecal coliforms had a lower average die off rate (half
life = 17.0 hours) than Vibrio cholerae (half life = 7.2 hours).
8
2.3 Source of Pollutants
The sources of pollutants can be divided into 2 types; point and nonpoint sources. Point
sources are sources that have been well categorized while nonpoint sources cannot be
categorized accurately, i.e. the location of the emission cannot be pinpoint accurately
(Dunnivant & Anders, 2006).
2.3.1 Animal Farming in Sarawak
Pig farming is a lucrative economic opportunity in animal farming industry in Sarawak. It
was estimated that there were 154 farms in Sarawak housing around estimated standing pig
population of 461, 289 which generated about RM 60 million a year (Kinson et al., 2001).
This in turn caused high amount of waste production and thus, the Control of Livestock
Pollution Rules of the Natural Resources and Environmental Board (NREB) Sarawak
specifies that farms with more than 100 animals are required to install oxidation ponds
(Ainon et al., 2005; Ling et al., 2007).
Wastes from animal farming have to be properly treated before being introduced to
the environment. This problem is aggravated with report from Kinson et al. (2001) showed
that a mature pig of an average weight of 150 kg produces three times the waste a person
does which amounted to approximately 21.1 kg/animal/day of solid material and 15.9
liters/animal/day of liquid wastes. Ainon et al. (2005) had reported that in Serian, Sarawak,
there were 2 farms which have been operated for 10 years with 8000 and 800 pigs each.
This would result in approximately 185,680 kg of solid wastes and 139,920 litres of solid
wastes per day.
Due to the high temperature and high humidity of our country, the pigs are hosed
down with water twice a day (Teoh et al., 1988). As a result, the washwater carried pigs’
9
feces, urine and spilled feed from the pig pens. This causes high amount of indirect wastes
being released into the environment in addition to the wastes that have been treated in
oxidation ponds. Kinson et al. (2001) had reported that the oxidation ponds installed in
Sabah were considered too small which caused over spilled of pigs’ wastes. Ling et al.
(2007) had recommended that the pond size had to be in proportionate with the standing
pig population and construction of 3-pond system for better efficiency.
Serin River is an important river in Sarawak because it is a source of drinking water
(Ling et al., 2008). A study by Ling et al. (2006) showed that tributaries that received
wastewater discharge from the pig farms reported high TSS, BOD, and E. coli
concentrations and decreased DO value.
2.3.1.1 Waste Effluents from Animal Farming
Ainon et al. (2005) reported that pollution from animal farming caused generation of
malodor, release of harmful ammonia gas to the atmosphere, under-utilization of persistent
chemicals and spreading of zoonotic diseases. The potential presence of faecal bacteria is
of great concern because of their pathogenicity to transmit diseases. Some of the diseases
transmitted are such as cholera, dysentery, and typhoid fever (Bitton, 1994; Maier et al.,
2009; Mara & Horan, 2003).
Bitton (1994) reported that fecal matter can contained up to 1 X 10¹²
bacteria per
gram of faeces which represented about approximately 9% by wet weight. There were
about 400 different species of bacteria present in feces where member of
Enterobacteriaceae amounted to an average of 8.6 log/g dry weight (Mara & Horan, 2003).
It had also been reported that the average number of E. coli were 3.3 X 10⁶ per gram of
pig’s feces and daily load E. coli of 8.9 X 10⁹. E. coli concentration in sewage and sewage
10
effluent were 3.4 X 10⁵-2.8 X 10
7 per 100 mL and 1 X 10
3-1 X 10
7 per 100 mL
respectively.
2.3.2 Agricultural Run-Off
Wastewater is often reuse for agricultural irrigation and can be considered as land
treatment and/or disposal (Viessman & Hammer, 2005). It is used to recycle nutrient back
to the land rather than dispose treated wastewater into the river. Manure is also used on
agricultural lands to increase soil fertility and tilth but in many cases, improper usage
caused fecal contamination of the receiving water body (Jamieson et al., 2002; Mishra et
al., 2008; Pachepsky et al., 2006; Pappas et al., 2008; Thiagarajan et al., 2007).
Thiagarajan et al. (2007) had reported that application of dairy manure on field
drainage sites produced annual E. coli loads that varied from 4.1 X 10¹⁰
CFU/ha to 5.5 X
1010
CFU/ha. The timing of manure application had effect on run-off of E. coli
concentration where heavy rainfall can increase transport of E. coli from land surface to
water body (Pappas et al., 2008; Shehane et al., 2005).
Indicator organisms can be transported from soil into water body through
movement carrying water and the movement of sediment and waste particles (Jamieson et
al., 2002). Overland flow can be a predominant way for indicator organisms to be
transported from land to surface water (Tyrrel & Quinton, 2003).
11
2.4 Surface Water Quality Modelling
Surface water quality is more reliable and prone to faecal contamination than underground
water as underground water had undergone various types of natural filtration (Mara &
Horan, 2003). During the past decades, water quality has been evaluated and simulated by
mathematical models. The most commonly used models are: multimedia fate models
(Mackay and EUSES models), hydrodynamic models (Mike 11 and QUASAR models),
steady state models (QUAL2E and QUAL2K models) and finally stochastic models
(TOMCAT and GREAT-ER models) (Hassanin, 2007).
Simulation allows an integrated and robust way to evaluate waste load abatement
alternatives, thus able to predict the effects on surface water (Bowie et al., 1985; Ennet et
al., 2008; Mohamed, 2001). A simple model is preferable over a complex model because
of the uncertainty nature of a complex model due to the abundance of data required for
simulation. Several studies had successfully used basic water quality models to simulate
conditions of surface water quality (Fan et al., 2009; Ganoulis et al., 2005; Park & Lee,
2002).
2.4.1 History of QUAL Model
QUAL-1 was built in the late 1960s by the Texas Water Development Board (TWDB)
which was used for steady state predictions of DO, BOD, and NBOD including effects of
longitudinal dispersion, nonpoint runoff and SOD (McCutcheon, 1989). QUAL-1 model
later served as a foundation for later model where in early 1970s, the United States
Environmental Protection Agency (USEPA) built a newer, more advanced model, known
as QUAL-II. Soon, this lead to an enhanced model called QUAL2E which was later
modified to a version named QUAL2K model (Hassanin, 2007).
12
2.4.2 QUAL2E Model
QUAL2E model has been used extensively to simulate surface water quality (Chapra,
1997; McCutcheon, 1989; Paliwal et al., 2007; Park and Lee, 2002). Furthermore the
model is numerically accurate and most conventional pollutants are provided with an
updated kinetic structure (Chapra, 1997; Park and Lee, 2002). The model is able to
simulate the river condition and up to 15 different water quality parameters (Mohamed,
2001).
QUAL2E model is able to simulate concentration of coliforms by determining the
bacteria die-off rate which is expressed as a first order decay functions and represented as:
= - K5 E (1)
where E = concentration of coliforms [colonies/100ml], K5 = temperature dependent
coliforms die-off rate [day-1
] (Brown & Barnwell, 1987). Several studies by Hohls et al.
(1995), Steynberg et al. (1995) and Venter et al. (1997) had used QUAL2E model as a
management tool for microbial water quality control. These studies showed that the
microbial die-off rate and dilution were of little effect considering the concentration of
bacteria at downstream station were still high even though away from the pollution source.
2.4.3 QUAL2K Model
QUAL2K is a modernized version of QUAL2E model that was developed by Brown &
Barnwell (1987). QUAL2K model is mainly used to simulate river and stream condition to
allow a better understanding of the river and stream characteristics. Some of the
characteristics of QUAL2K model include; a one dimensional model where river channel
13
is thought to be well-mixed vertically and laterally; employs steady state hydraulics; uses
diel heat budget and calculates diel water-quality kinetics (Chapra et al., 2007). QUAL2K
model simulates a river by representing a river as a series of reaches which have constant
hydraulics characteristics and these reaches can be further divided into a series of elements.
QUAL2K can simulate several elements including temperature, conductivity,
inorganic solids, dissolved oxygen, carbonaceous biochemical demand, organic nitrogen,
ammonia nitrogen, nitrate nitrogen, organic and inorganic phosphorus, phytoplankton,
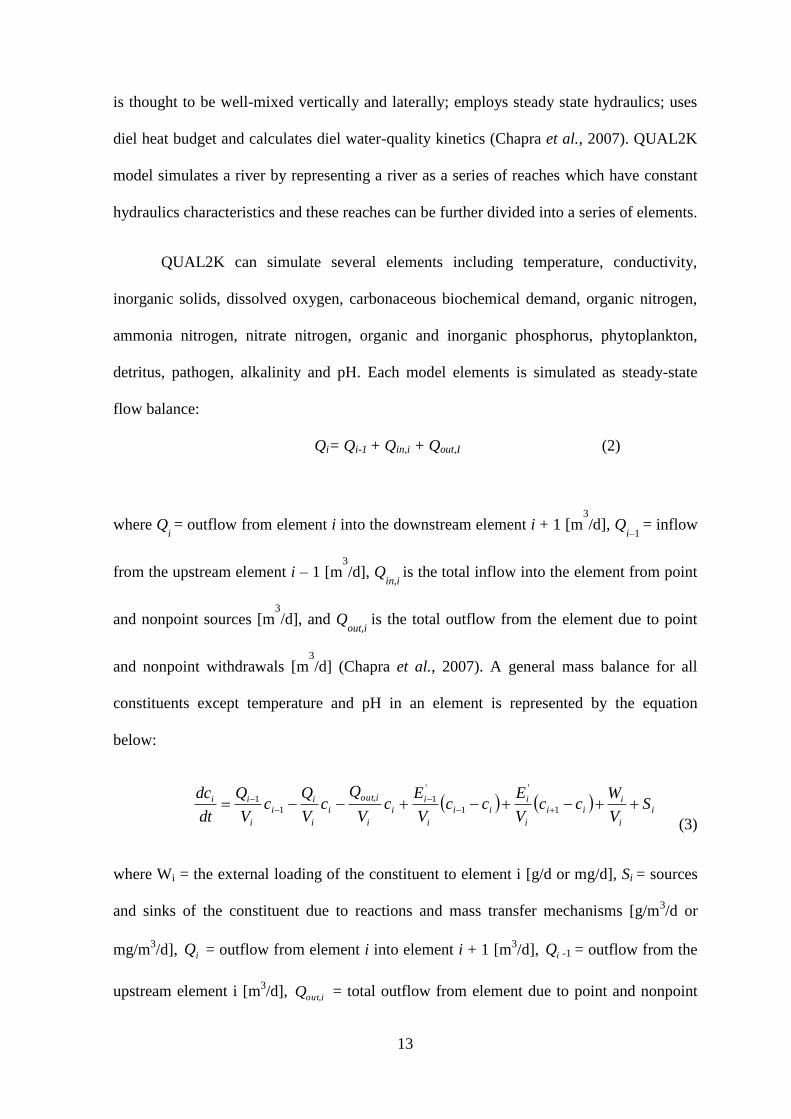
detritus, pathogen, alkalinity and pH. Each model elements is simulated as steady-state
flow balance:
Qi= Qi-1 + Qin,i + Qout,I (2)
where Qi = outflow from element i into the downstream element i + 1 [m
3
/d], Qi–1
= inflow
from the upstream element i – 1 [m3
/d], Qin,i
is the total inflow into the element from point
and nonpoint sources [m3
/d], and Qout,i
is the total outflow from the element due to point
and nonpoint withdrawals [m3
/d] (Chapra et al., 2007). A general mass balance for all
constituents except temperature and pH in an element is represented by the equation
below:
i
i
i
ii
i
i
ii
i
i
i
i
iout
i
i
i
i
i
ii SV
Wcc
V
Ecc
V
Ec
V
Qc
V
Qc
V
Q
dt
dc
1
'
1
'
1,
1
1
(3)
where Wi = the external loading of the constituent to element i [g/d or mg/d], Si = sources
and sinks of the constituent due to reactions and mass transfer mechanisms [g/m3/d or
mg/m3/d], iQ
= outflow from element i into element i + 1 [m
3/d], iQ -1 = outflow from the
upstream element i [m3/d],
ioutQ , = total outflow from element due to point and nonpoint