faculty education report final 3.12.20
TRANSCRIPT

Addressing Nurse Workforce Issues for the Health of Florida
KEY FINDINGS
The following presents key findings regarding Florida’s nursing program faculty for Academic Year (AY) 2018-19. The full report provides an overview of nursing programs, and details faculty staffing patterns, demographic characteristics, and trends over time. Implications and recommendations are discussed.
FT Faculty Vacancies and Perceived Need for New Positions
FT Faculty Vacancy Rates by Program Type, 3-Year Trend
Student to FT Faculty Ratio, 3-Year Trend
Faculty New Hires, AY 2017-18 and AY 2018-19
7%
9%
12%
8%9%
11%
9%10%
12%
2 0 1 6 - 1 7 2 0 1 7 - 1 8 2 0 1 8 - 1 9
FT V
ACAN
CY R
ATE
LPN ADN BSN
14.2
20.6
12.3
0.0
5.0
10.0
15.0
20.0
25.0
LPN ADN BSN
2016-17
2017-18
2018-19
153 195 83 106
432613
250 253
377
435
157 213
2 0 1 7 - 1 8 2 0 1 8 - 1 9 2 0 1 7 - 1 8 2 0 1 8 - 1 9
P A R T - T I M E F U L L - T I M E
BSNADNLPN
FT Vacancies
(Sept. 30, 2019) # Additional FT
Positions Needed LPN 48 95 ADN 93 155 BSN 109 111 Total 250 361
• 96% overall response rate o 107 LPN, 115 ADN, and 66 BSN programs
provided faculty data • Faculty vacancy rates increased for all pre-
licensure program types o 12.3% BSN programs o 11.0% ADN programs o 12.5% LPN programs
• Programs reported a need for 361 additional full-time positions not budgeted
• The student to faculty ratio increased for all program types. o LPN: 14 to 1 o ADN: 21 to 1 o BSN: 12 to 1
• Limited qualified applicant pools (39%) and non-competitive salaries (38%) were the most common barriers to faculty recruitment.
• Pediatric/Child Health (37%) and Obstetrics (35.5%) were most commonly difficult positions to fill.
• Part time new hires outnumbered full-time hires. • 390 faculty separated from responding programs • 83 retirements were reported. • 17% of the faculty reported were over the age of 60
KEY FINDINGS Florida Nurse Faculty Supply and Demand: Academic Year 2018-19
Recommendations
1. Build a faculty pipeline: create incentives for nurses to seek advanced education from ADN to BSN and into graduate study and assist existing nurses to further their education.
2. Develop strategies to retain faculty and reduce vacancy rates. Reported full-time vacancy rates have increased since AY 2017-18 and positions needed but not budgeted increase vacancy rates about 26 percentage points, overall.
3. Fund a consistent, long-term data collection, analysis, and reporting system to provide critical information on which to base funding and policy decisions. Consequences for not participating in the mandated education survey should be established.

Addressing Nurse Workforce Issues for the Health of Florida
Florida’s Nursing Education Programs Academic Year 2018-19
Nursing Faculty Supply and Demand

March 2020 Florida Nursing Education Faculty Report: AY 2018-19 i Data are from responding schools only unless indicated otherwise.
CONTENTS
Background ................................................................................................................................................... 1
Data Source .............................................................................................................................................. 1
Overview of Responding Programs ............................................................................................................... 2
Program Types and Curriculum Offerings ................................................................................................ 2
Program Accreditation Status ................................................................................................................... 2
Faculty Positions and Staffing ....................................................................................................................... 3
Budgeted, Filled, and Vacant Positions .................................................................................................... 3
Perceived Faculty Need ............................................................................................................................ 4
Student to Faculty Ratios .......................................................................................................................... 5
Recruitment Barriers and Difficult Positions to Fill .................................................................................. 5
New Faculty Hires, Separations, and Retirement ..................................................................................... 6
Faculty Demographics ................................................................................................................................... 7
Faculty Age Distribution ........................................................................................................................... 7
Faculty Race/Ethnicity and Gender .......................................................................................................... 7
Faculty Education Attainment .................................................................................................................. 8
Discussion...................................................................................................................................................... 9
Recommendations .................................................................................................................................. 11
References .................................................................................................................................................. 13

March 2020 Florida Nursing Education Faculty Report: AY 2018-19 1 Data are from responding schools only unless indicated otherwise.
Florida Nurse Faculty Supply and Demand: Academic Year 2018-19
BACKGROUND
The Florida Center for Nursing (FCN, the Center) has collected data on Florida’s nursing education programs since 2007 to report trends in nursing education and the nurse faculty workforce.1 This report presents Academic Year (AY) 2018-19 and trend data for nursing program faculty. Exploring trends over time enables outcome monitoring and identification of promising practices and areas for improvement. The Center’s data collection, analysis, and reports provide multiple benefits to stakeholders:
1. Schools can use the data to… • make academic decisions, • strengthen grant applications, • plan for faculty demand, and • maximize student capacity.
2. Policy makers can use the data to… • initiate and/or modify policies and
regulations, • guide funding decisions, and • plan strategic use of resources.
Findings highlight nursing program characteristics, staffing composition and faculty demand, demographics, and trends over time when available. Implications and recommendations are offered. Information on Florida’s LPN and RN students and the Florida Center for Nursing Education Survey can be found in companion reports. Data Source Data for this report are from the 2019 Florida Center for Nursing Survey of Nursing Education Programs.2 FCN identified education programs from the Board of Nursing website, which maintains an updated database of Licensed Practical Nurse (LPN), Associate Degree in Nursing (ADN) and pre-licensure Bachelor of Science in Nursing (BSN) programs by National Council Licensure Examination (NCLEX) code.3 The Board of Nursing does not track post-licensure nursing programs that do not lead to a new RN license, including RN to BSN, Master of Science in Nursing (MSN), and doctoral programs. Thus, FCN does not have a comprehensive count of RN to BSN, MSN and Doctoral programs in the state of Florida. Participating ADN and BSN programs with a pre-licensure NCLEX code were able to provide information on affiliated post-licensure programs. Relevant companion reports present information on many of these programs. Survey invitations were sent to all active programs with NCLEX codes listed on the Board of Nursing’s website in September 2019. FCN emailed a survey link to the last known Dean or Program Director for each program on October 1, 2019 and made multiple efforts to contact each school. In total, FCN requested information from 369 schools (145 LPN, 143 ADN, 31 BSN). Compared to AY 2017-18, the number of LPN and pre-licensure BSN programs increased. The number of ADN programs stayed the same. In total, 356 pre-licensure programs provided valid responses, resulting in a response rate of 96% (Table 1, next page). This response rate increased 14% since the previous survey cycle. Increased participation may be attributed to FCN outreach and, importantly, a citation and $1,000 penalty newly imposed by the Florida Department of Health for non-participation in this data request.
1 No data available for AY 2013-14 and AY 2014-15 due to low response rates and lack of resources to administer the annual survey, respectively. 2 Since 2017, program participation is mandated in statute re: collection of education program data (FS 464.019(10)). 3 All nursing graduates must successfully pass the NCLEX to be licensed to practice, graduation alone is not sufficient.

March 2020 Florida Nursing Education Faculty Report: AY 2018-19 2 Data are from responding schools only unless indicated otherwise.
Table 1. Response Rates by Program Type, AY 2018-19 Program Type
Total # Schools
Responding Programs
Response Rate
Compared to 2017-18
LPN 145 139 95.9% + 15.6%
ADN 143 138 96.5% + 13.3%
BSN 81 79 97.5% + 14.6%
TOTAL 369 356 96.5% + 14.5%
Participants were asked to describe program capacity and enrollment for AY 2018-19 and provide faculty and student population characteristics as of September 30th, 2019. This report includes faculty characteristics. Student characteristics and program capacity are reported in companion reports. Faculty members may be represented more than once if they are actively teaching in multiple pre-licensure programs. Faculty that exclusively teach students in post-licensure programs are not represented. OVERVIEW OF RESPONDING PROGRAMS
Program Types and Curriculum Offerings Among the 356 program respondents, 66 did not have student enrollment during AY 2018-19 and were not asked to provide student or faculty information. Thirty-seven percent (37%) of Florida’s nursing education programs with students enrolled were LPN programs, while the remaining 63% were RN programs. Among RN programs, there were more ADN programs (63%) than BSN programs (37%) with students enrolled. A total of 61 participants also reported student enrollment in one or more post-licensure program(s) (Table 2). The number of programs with students enrolled increased for all program types and curriculum, compared to AY 2017-18. However, counts may be impacted by greater survey response rates, and may not accurately reflect an increase in the number of active programs enrolling students. Program Accreditation Status Table 3 (next page) shows the Accreditation Commission for Education in Nursing (ACEN) or Commission on Collegiate Nursing Education (CCNE) national accreditation status of program respondents. Achieving national accreditation indicates a program’s ability to meet recognized quality standards related to the academic curriculum and faculty qualifications. Since 2014, Florida law requires pre-licensure RN programs to achieve national accreditation within five years of first student enrollment. Programs with enrollment prior to July 1, 2014 were required to achieve
Pre-Licensure Programs # LPN Participants 108
LPN Generic/Traditional 106 LPN Bridge 5
ADN Participants 115 ADN Generic/Traditional 112 ADN Bridge 55
Pre-Licensure BSN Participants 67 Generic/Traditional 58 Second Degree 27
Post-Licensure Programs # RN to BSN programs reported 53 Master's programs reported 22 Doctoral programs reported 14
Curricula exceed the number of participants as many schools offer more than one curriculum track; Program counts represent respondents only and may not reflect the entirety of Florida’s nursing education programs (96% response rate)
Table 2. Program and Curriculum Options Offered by Survey Respondents, AY 2018-19

March 2020 Florida Nursing Education Faculty Report: AY 2018-19 3 Data are from responding schools only unless indicated otherwise.
accreditation by July 1, 2019. 4 Programs that do not comply with accreditation requirements will lose their license and must discontinue operations. In October 2019, 67% of pre-licensure RN program respondents (57% ADN, 84% BSN) were nationally accredited. LPN programs are not currently required to achieve accreditation, however 9% were nationally accredited, and 9% were in the process of accreditation (Table 3). This report does not include programs with no student enrollment (n = 66).
Table 3. Accreditation Status of Responding Programs by Program Type, AY 2018-19
LPN ADN BSN TOTAL RN Accredited by AECN and/or CCNE 9% 57% 84% 67% Accreditation in Progress 9% 29% 6% 20% Not Accredited 81% 14% 10% 13%
Compared to AY 2017-18, the number of accredited RN programs increased 6.5%. This may be attributed to increased response rates, mandated accreditation requirements going into effect on July 1, 2019, and/or Board of Nursing monitoring of non-compliant programs. FACULTY POSITIONS AND STAFFING
Budgeted, Filled, and Vacant Positions Participants reported the number of vacant and filled faculty positions as of September 30, 2019. Counts were used to assess the current demand for nurse faculty. The number of budgeted positions is the sum of filled and vacant positions. Full-time and part-time faculty are included in budgeted positions unless programs indicate that their part-time faculty are not budgeted. 5 There were 5,573 budgeted nursing faculty positions reported. Programs reported 2,637 full-time and 3,408 part-time positions filled as of September 30, 2019. LPN programs have the fewest filled faculty positions (n=861), compared to ADN and BSN programs. The number of part-time faculty continue to exceed the number of full-time faculty for all program types. Only 40% of ADN program faculty were full-time, compared to 46% of BSN programs and 47% of LPN programs. Programs reported 461 vacant full- and part-time positions in September 2019. ADN programs had the largest number of vacant positions (n=200), although the full-time faculty vacancy rate for LPN (12.5%)
4 Chapter 2014-92 Laws of Florida 5 17% of participants indicated that part-time positions are not included in their budget, therefore a total of 915 part-time faculty are not included in this count, and the number of filled positions exceeds the number of budgeted positions, despite 461 vacancies reported.
ADN BSN LPN TOTAL
Filled Faculty Positions Full-Time 1,144 1,085 408 2,637 Part-Time 1,703 1,252 453 3,408
Vacant Faculty Positions
Full-Time 93 109 48 250 Part-Time 107 48 56 211
Budgeted Positions a
Full-Time 1,237 1,194 456 2,887 Part-Time 1,423 840 423 2,686
Needed, Not Budgeted 155 111 95 361 a Total Budgeted Positions do not include filled part-time positions for schools whose Part-Time positions are not included in their budget Note: Faculty information for each NCLEX code. Faculty may be reported more than once if they teach in multiple programs
Table 4. Filled, Vacant, Budgeted, and Needed Faculty as of September 30, 2019, by Program Type

March 2020 Florida Nursing Education Faculty Report: AY 2018-19 4 Data are from responding schools only unless indicated otherwise.
and BSN programs (12.3%) were greater than ADN (11%) programs (Figure 1). Overall, program respondents had an average full-time faculty vacancy rate6 of 11.8%. Faculty vacancy rates have once again increased since the previous survey cycle (Figure 1). Vacancy rates have been climbing since AY 2016-17. The BSN vacancy rate (12.3%) is the highest since AY 2009-10 (12.4%) but remains lower than the AY 2012-13 peak (15.6%). LPN (12.5%) and ADN (11.0%) vacancy rates currently fall just short of their program peaks in AY 2012-13 (13.4% LPN, 11.8% ADN) (Florida Center for Nursing, 2014). Perceived Faculty Need Vacancy rates measure economic demand for nurse faculty – the number of faculty members that schools are willing to employ given their current budgets. However, the economic reality is that many nursing programs cannot afford to staff at levels they consider desirable or appropriate. In addition to vacancy rates, variance in needed versus actual positions may impact faculty retention and job satisfaction due to increased workloads resulting from shortages. Perceived need for nurse faculty measures the desired number of faculty members regardless of available funding. Programs reported 361 additional full-time positions needed but not budgeted (Table 4, previous page). Figure 2 combines full-time faculty need and vacancy rates for greater insight into perceived faculty workload and shortages. 7
6 Full-time faculty vacancy rates = (∑ FT positions vacant / ∑ FT positions budgeted) *100. 7 Full-time perceived faculty vacancy rates = ((∑ FT positions vacant + ∑ FT positions needed) / ∑ FT positions budgeted) *100.
Figure 1. Average Full-Time Vacancy Rate (%), by Program Type – AY 2016-17 to AY 2018-19
6.8%
9.0%
12.5%
7.9%9.1%
11.0%
8.8%10.0%
12.3%
2 0 1 6 - 1 7 2 0 1 7 - 1 8 2 0 1 8 - 1 9
FT V
ACAN
CY R
ATE
(%)
LPN ADN BSN
Note: Represents respondents only. Trend data should be interpreted with caution as response rates vary over time
Figure 2. Average Full-Time Vacancy Rate Incorporating Perceived Need (%), by Program Type - 10 Year Trend (2009-2019)
Note: Rates represent survey respondents only. Trend data should be interpreted with caution as participation/response rates have varied over time. Data are not available for AY 2013-14 or AY 2014-15
44.0%
36.7%
31.0%
0%
5%
10%
15%
20%
25%
30%
35%
40%
45%
50%
2 0 0 8 -0 9
2 0 0 9 -1 0
2 0 1 0 -1 1
2 0 1 1 -1 2
2 0 1 2 -1 3
2 0 1 3 -1 4
2 0 1 4 -1 5
2 0 1 5 -1 6
2 0 1 6 -1 7
2 0 1 7 -1 8
2 0 1 8 -1 9
LPN
ADN
BSN

March 2020 Florida Nursing Education Faculty Report: AY 2018-19 5 Data are from responding schools only unless indicated otherwise.
When needed but not budgeted positions are added to vacant budgeted positions, the average vacancy rate increases more than 26 percentage points, overall (38%). As a group, LPN programs have the largest gap between reported vacancy rate (12.5%) and perceived need (44%). ADN programs’ combined need + vacancy rate was about 26% higher than their vacancy rate (11%), and BSN programs’ perceived need was 19% higher than their vacancy rate (12%). Current estimates show the highest perceived vacancy rates in the past ten (10) years, for each program type (Figure 2, previous page). Student to Faculty Ratios Student to faculty ratios consider the average number of students per each full-time faculty. Compared to AY 2017-18, the student to full-time faculty ratio increased for each program type (Figure 3). In AY 2018-19, there were about 14 students per full-time LPN faculty, 21 students per full-time ADN faculty, and 12 students to each full-time BSN faculty. BSN programs have the highest reported enrolled students to full-time faculty ratio (for their program type) since the Center has been collecting this information. This likely means that that each BSN faculty is responsible for more students than they have been in at least the past thirteen academic years. The AY 2018-19 enrolled students to full-time ADN faculty ratio is approaching the peak rate (23.4 to 1, AY 2016-17) for this program type. LPN program student to faculty ratio is approaching the AY 2009-10 rate (14.6 to 1). AY 2015-16 maintains the peak reported ratio for LPN programs (15.7 to 1). Ratios consider the mathematical relationship between the number of enrolled students and full-time faculty members. On their own, ratios may not fully represent faculty workload. However, when paired with a deeper understanding of additional responsibilities, ratios can draw attention to potential impacts on workload and student outcomes. High workloads and student to faculty ratios may contribute to ineffective learning or unsafe practices when thorough, personalized guidance is unavailable. There is no established, fixed ratio benchmark. Ratio ranges should consider individual needs, learning styles, and the patient conditions and scenarios students encounter.
Recruitment Barriers and Difficult Positions to Fill The most commonly reported barriers to faculty recruitment were a limited qualified applicant pool (39%) and non-competitive salaries (38%). About 37% of programs reported no barriers to recruiting new faculty members. The proportion of programs reporting salary barriers decreased about 5% since AY 2017-18, however this should be interpreted with caution as response rates vary each year and do not represent the total number of schools indicating any barriers.
Figure 3. Enrolled Students to Full-Time Faculty Ratio, by Program Type, AY 2016-17 to AY 2018-19
15.7
23.4
9.0
12.8
17.4
9.8
14.2
20.6
12.3
0.0
5.0
10.0
15.0
20.0
25.0
LPN ADN BSN
2016-17
2017-18
2018-19
Note: Rates represent survey respondents only. Trend data should be interpreted with caution as response rates vary over time
39%
38%
9%
Limited qualified applicant pool
Non-competitive salaries
Cost of living
AY 2018-19 Barriers to Faculty Recruitment
March 2020 Florida Nursing Education Faculty Report: AY 2018-19 6 Data are from responding schools only unless indicated otherwise.
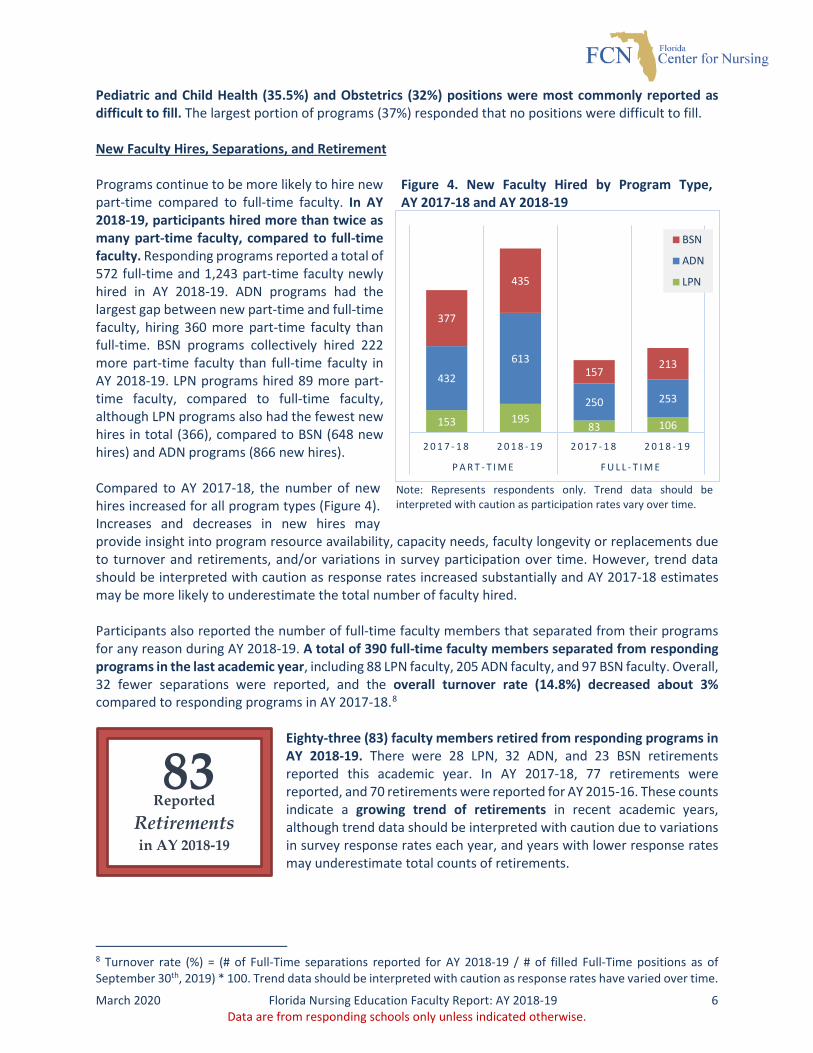
Pediatric and Child Health (35.5%) and Obstetrics (32%) positions were most commonly reported as difficult to fill. The largest portion of programs (37%) responded that no positions were difficult to fill. New Faculty Hires, Separations, and Retirement Programs continue to be more likely to hire new part-time compared to full-time faculty. In AY 2018-19, participants hired more than twice as many part-time faculty, compared to full-time faculty. Responding programs reported a total of 572 full-time and 1,243 part-time faculty newly hired in AY 2018-19. ADN programs had the largest gap between new part-time and full-time faculty, hiring 360 more part-time faculty than full-time. BSN programs collectively hired 222 more part-time faculty than full-time faculty in AY 2018-19. LPN programs hired 89 more part-time faculty, compared to full-time faculty, although LPN programs also had the fewest new hires in total (366), compared to BSN (648 new hires) and ADN programs (866 new hires). Compared to AY 2017-18, the number of new hires increased for all program types (Figure 4). Increases and decreases in new hires may provide insight into program resource availability, capacity needs, faculty longevity or replacements due to turnover and retirements, and/or variations in survey participation over time. However, trend data should be interpreted with caution as response rates increased substantially and AY 2017-18 estimates may be more likely to underestimate the total number of faculty hired. Participants also reported the number of full-time faculty members that separated from their programs for any reason during AY 2018-19. A total of 390 full-time faculty members separated from responding programs in the last academic year, including 88 LPN faculty, 205 ADN faculty, and 97 BSN faculty. Overall, 32 fewer separations were reported, and the overall turnover rate (14.8%) decreased about 3% compared to responding programs in AY 2017-18.8
Eighty-three (83) faculty members retired from responding programs in AY 2018-19. There were 28 LPN, 32 ADN, and 23 BSN retirements reported this academic year. In AY 2017-18, 77 retirements were reported, and 70 retirements were reported for AY 2015-16. These counts indicate a growing trend of retirements in recent academic years, although trend data should be interpreted with caution due to variations in survey response rates each year, and years with lower response rates may underestimate total counts of retirements.
8 Turnover rate (%) = (# of Full-Time separations reported for AY 2018-19 / # of filled Full-Time positions as of September 30th, 2019) * 100. Trend data should be interpreted with caution as response rates have varied over time.
153 19583 106
432
613
250 253
377
435
157213
2 0 1 7 - 1 8 2 0 1 8 - 1 9 2 0 1 7 - 1 8 2 0 1 8 - 1 9
P A R T - T I M E F U L L - T I M E
BSN
ADN
LPN
Figure 4. New Faculty Hired by Program Type, AY 2017-18 and AY 2018-19
Note: Represents respondents only. Trend data should be interpreted with caution as participation rates vary over time.
Reported Retirements in AY 2018-19
83

March 2020 Florida Nursing Education Faculty Report: AY 2018-19 7 Data are from responding schools only unless indicated otherwise.
FACULTY DEMOGRAPHICS
Faculty Age Distribution Forty-eight percent (48%) of all nursing education program faculty in Florida were 50 or younger. Another 27% were between 51 and 60 years old, and 17% were 61 or older. The largest portion of full-time ADN faculty (25%) and BSN faculty (26%) were between 41 and 50 years old. In LPN programs, the largest portion of faculty were between 56 and 60 (21%) (Figure 5). Part-time faculty were more likely to be younger than full-time. Fifty-one percent (51%) of part-time BSN faculty were 50 or younger, compared to 44% of full-time faculty. Additionally, 56% of ADN and 52% of LPN part-time faculty were 50 or younger, compared to 43% of full-time ADN and 32% of full-time LPN faculty (Figure 5). In total, 1,046 faculty were over the age of 60 (17%), including 178 LPN, 441 ADN, and 427 BSN faculty. A larger portion of full-time faculty were over 60 (n = 551, 21%), compared to part-time faculty (n = 495, 14.5%). Faculty over 60 may be expected to begin reducing hours or retiring within the next five years. Faculty Race/Ethnicity and Gender A majority of faculty members in all program types were white (53% overall). LPN programs reported the largest portion of Black/African American faculty (31%) compared to ADN (24%) and BSN (19%) programs. Hispanic/Latino faculty were least represented in LPN programs (6%) compared to ADN (12%) and BSN (16%) programs. Two to three percent of faculty identified as Asian. Compared to the 2019 Florida population, whites were slightly more
Figure 5. Age Distribution of Part-Time and Full-Time Faculty, by Program Type
14%
18% 18%
21%
18%
4%1%
17%
25%
19%
16%
13%
4%
1%
18%
26%
15%16%
15%
5%3%
0%
5%
10%
15%
20%
25%
30%
< 41 41-50 51-55 56-60 61-65 66-70 71 +
Full-
Tim
e Fa
culty
LPN
ADN
BSN
20%
32%
11% 12%10%
5%3%
28% 28%
13%
10%7%
4%2%
28%
23%
12%
9%8%
4% 2%0%
5%
10%
15%
20%
25%
30%
35%
< 41 41-50 51-55 56-60 61-65 66-70 71 +
Part
-Tim
e Fa
culty
LPN
ADN
BSN
Figure 6. Faculty Race/Ethnicity by Program Type, AY 2018-19 and 2019 Florida Census Data
52% 54%52% 54%
31%
24%20%
17%
6%12%
16%
26%
3% 3% 3%4%0%
10%
20%
30%
40%
50%
60%
LPN ADN BSN FL Population
White
Black
Hispanic
Asian
Other
March 2020 Florida Nursing Education Faculty Report: AY 2018-19 8 Data are from responding schools only unless indicated otherwise.
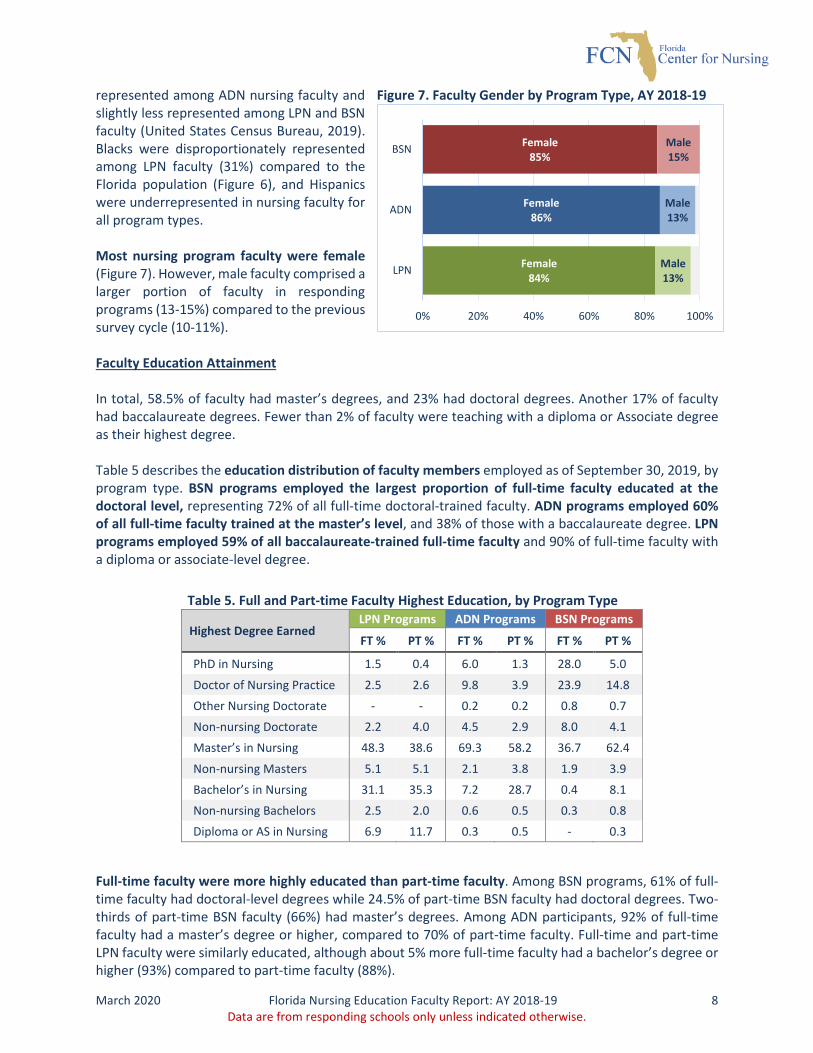
represented among ADN nursing faculty and slightly less represented among LPN and BSN faculty (United States Census Bureau, 2019). Blacks were disproportionately represented among LPN faculty (31%) compared to the Florida population (Figure 6), and Hispanics were underrepresented in nursing faculty for all program types. Most nursing program faculty were female (Figure 7). However, male faculty comprised a larger portion of faculty in responding programs (13-15%) compared to the previous survey cycle (10-11%). Faculty Education Attainment In total, 58.5% of faculty had master’s degrees, and 23% had doctoral degrees. Another 17% of faculty had baccalaureate degrees. Fewer than 2% of faculty were teaching with a diploma or Associate degree as their highest degree. Table 5 describes the education distribution of faculty members employed as of September 30, 2019, by program type. BSN programs employed the largest proportion of full-time faculty educated at the doctoral level, representing 72% of all full-time doctoral-trained faculty. ADN programs employed 60% of all full-time faculty trained at the master’s level, and 38% of those with a baccalaureate degree. LPN programs employed 59% of all baccalaureate-trained full-time faculty and 90% of full-time faculty with a diploma or associate-level degree.
Full-time faculty were more highly educated than part-time faculty. Among BSN programs, 61% of full-time faculty had doctoral-level degrees while 24.5% of part-time BSN faculty had doctoral degrees. Two-thirds of part-time BSN faculty (66%) had master’s degrees. Among ADN participants, 92% of full-time faculty had a master’s degree or higher, compared to 70% of part-time faculty. Full-time and part-time LPN faculty were similarly educated, although about 5% more full-time faculty had a bachelor’s degree or higher (93%) compared to part-time faculty (88%).
Figure 7. Faculty Gender by Program Type, AY 2018-19
Female84%
Female86%
Female85%
Male13%
Male13%
Male15%
0% 20% 40% 60% 80% 100%
LPN
ADN
BSN
Table 5. Full and Part-time Faculty Highest Education, by Program Type
Highest Degree Earned LPN Programs ADN Programs BSN Programs
FT % PT % FT % PT % FT % PT %
PhD in Nursing 1.5 0.4 6.0 1.3 28.0 5.0
Doctor of Nursing Practice 2.5 2.6 9.8 3.9 23.9 14.8 Other Nursing Doctorate - - 0.2 0.2 0.8 0.7 Non-nursing Doctorate 2.2 4.0 4.5 2.9 8.0 4.1 Master’s in Nursing 48.3 38.6 69.3 58.2 36.7 62.4
Non-nursing Masters 5.1 5.1 2.1 3.8 1.9 3.9 Bachelor’s in Nursing 31.1 35.3 7.2 28.7 0.4 8.1 Non-nursing Bachelors 2.5 2.0 0.6 0.5 0.3 0.8 Diploma or AS in Nursing 6.9 11.7 0.3 0.5 - 0.3

March 2020 Florida Nursing Education Faculty Report: AY 2018-19 9 Data are from responding schools only unless indicated otherwise.
DISCUSSION
Florida continues to see growth in the number of pre-licensure nursing education programs in the state. In September 2019, there were 369 pre-licensure programs in Florida (145 LPN, 143 ADN, and 81 BSN). LPN programs had a net increase of eight (8) new programs and BSN programs had a net increase of five (5) new programs. The number of ADN programs stayed the same, despite some programs closing and the approval of new ADN programs. Sixty-six (66) program respondents were active pre-licensure programs but did not have students enrolled in AY 2018-19, including 26 programs that were newly approved since September 2018. Program participants with students enrolled were asked to provide faculty information in order to aid state-level analyses on faculty employment, turnover/retirements, recruitment barriers, and demographic characteristics. Responding programs reported a total of 2,637 full-time and 3,408 part-time faculty employed in their programs, including 572 full-time new-hires and 1,243 new part-time faculty. In the same period, there were 390 full-time faculty separations, resulting in a net increase of 182 new full-time nursing faculty among responding LPN, ADN, and BSN programs. The net faculty gain increased by 114 compared to AY 2017-18. However, 36 more programs responded to the current survey compared to the previous year. Increased response rates add to and improve the accuracy of total counts, while making it more difficult to determine the accuracy of comparisons to previous years. On the other hand, the number of vacant budgeted positions increased slightly since AY 2017-18, for all program types. 9 When the number of new full-time positions needed but not budgeted (n = 361) were included, perceived vacancy rates increased more than 26 percentage points, overall (44% LPN, 37% ADN, and 31% BSN). Perceived need for new full-time faculty positions increased for all program types since AY 2017-18 and currently represent the peak values for each program type, indicating that vacancy issues have not reduced since the Center's last survey cycle. Academic leadership and relevant stakeholders should evaluate their academic work environment and, as appropriate, implement policies and practices to assess and address reasons for separation and retain faculty. Vacancy rates, and perceived need + vacancy rates may have a significant impact on faculty retention and/or job satisfaction due increased workloads. Regardless, fewer separations were reported in AY 2018-19 compared to AY 2017-18, even with more programs providing data, suggesting that faculty may not be leaving their positions at the same rate in the current sample compared to the previous year. The net gain of new faculty members in AY 2018-19 is also substantially higher than the AY 2017-18 net gain, indicating that, proportionally, a larger number of faculty are being hired compared to those leaving. Regardless, limited qualified applicant pools (39%) and non-competitive salaries (38%) continue to be faculty recruitment barriers, affecting more than a third of all programs. However, 37% reported no barriers toward faculty recruitment. Additional analyses may be useful to identify distinctions between programs experiencing barriers and those with no barriers, as this may suggest that faculty available for hire may be disproportionately applying to programs with specific characteristics. Academic stakeholders may find benefit in addressing the ability to provide competitive market rate salaries and increasing the pipeline of qualified nurses into faculty positions to adapt to separations, retirement, vacancies, and recruitment barriers. The total turnover rate for AY 2018-19 (15%) decreased compared to AY 2017-18 (17%). LPN programs had the highest turnover rate (22%) compared to ADN (18%) and BSN (9%) programs. The turnover rate
9 Based on counts provided by responding programs only. Trends should be interpreted with caution as participation varies over time.
March 2020 Florida Nursing Education Faculty Report: AY 2018-19 10 Data are from responding schools only unless indicated otherwise.
decreased for ADN and BSN programs since AY 2017-18, while turnover increased for LPN programs. Additionally, the number of reported retirements increased since AY 2017-18. However, previous counts of retired faculty may have been underestimations due to lower response rates. In AY 2018-19, 83 retirements were reported (96% response rate), compared to 77 in AY 2017-18 (82% response rate) and 70 in AY 2016-17 (77% response rate). The number of part-time faculty (n = 3,408) continue to outnumber full-time faculty (n = 2,637). Forty percent (40%) of ADN faculty, 46% of BSN faculty, and 47% of LPN faculty were full-time. The student to full-time faculty ratios increased for each program type. BSN programs have the highest student to full-time faculty ratio (12:1) for their program type since the Florida Center for Nursing began tracking this information in AY 2006-07. Both the ADN (21:1) and LPN (14:1) ratios are approaching their peak ratios reported in AY 2016-17 (23:1 and 16:1, respectively). Trend data indicating increases in the average number of students served by each faculty may indicate that, although new faculty members are hired into nursing education programs each year and turnover/separations currently show declines, student enrollment continues to outpace available faculty. Programs may be mitigating these ratios with the availability of part-time faculty. More research is needed to understand the distinct roles between part-time and full-time faculty, factors contributing to part-time faculty comprising a majority for each program type, and the potential impact on student outcomes. Do these proportions relate to budgetary limitations? Are part-time faculty members adequately trained or receiving adequate training to fill educator roles (Ried, Hinderer, Jarosinski, Mister, & Seldomridge, 2013)? Use of part-time faculty members may be in response to reported shortages and limited full-time faculty applicant pools, yet little is known about the “growing proportion of adjunct, part-time, and non-benefited nurse faculty positions at educational institutions” (Daw, Mills, & Ibarra, 2018, p. 66). The 2010 Institute of Medicine (IOM) report recommended doubling the number of nurses with a doctoral degree by 2020 in order to respond to the growing demand for nurse faculty (Institute of Medicine (IOM), 2010). As of AY 2018-19, 1,400 program faculty had a doctorate degree (including nursing and non-nursing degrees). Programs reported a total of 574 nursing doctoral graduates (396 DNP and 178 PhD) and 225 MSN nurse educator graduates in AY 2018-19 (Florida Center for Nursing, 2020). There were about 100 more doctoral graduates compared to those reported in AY 2017-18, and 18 fewer MSN nurse educator graduates. In addition to strengthening faculty budget and incentives within academia, tracking enrollment and graduation in graduate level programs likely to produce future educators and encouraging students toward career paths as researchers and educators may contribute to a solid foundation of future faculty. The data presented here represent a 96% response rate, which is a 14% improvement since AY 2017-18. It is important to note that the Florida Department of Health imposed a citation and $1,000 penalty for non-participation, which likely contributed to the substantial increase in survey response and increased validity of analyses. Without 100% participation each year, counts do not provide a complete view of nursing education programs in Florida and interpreting trend data requires caution as counts of vacancies, separations, retirements, perceived need, filled positions, and new hires are likely underestimates, especially when response rates are lower. Regardless, the data presented here provide valuable insight into the perceived and actual shortages and potential future trajectory of these education programs. In order to provide valuable trending data in the future, it is important that Center retains support from the Florida Department of Health and response rates remain as close to 100% as possible. The Florida Legislature recognizes the importance of increasing the availability of nursing education programs and the pool of licensed, qualified nurses in the state (FS 464.019). In addition to capacity issues,

March 2020 Florida Nursing Education Faculty Report: AY 2018-19 11 Data are from responding schools only unless indicated otherwise.
program quality and cost-effectiveness examinations are still needed. The Center previously established the position that it is crucial to evaluate the impact of new nursing education programs in terms of student quality, cost-benefit analysis of the programs, and health industry assessment of the program’s graduates’ ability to meet employment needs (Florida Center for Nursing, 2018). Limited resources are available for objective assessments of new and existing programs except for National Council of State Boards of Nursing Licensure Examination passage rates for first-time takers from LPN and pre-licensure RN programs. In the 2018 calendar year, Florida’s combined (associate and bachelor’s degree) passage rate for RNs was 72.7%. Passage rates did not improve in 2019 (71.9% combined passage rate). The 2019 national average was 88.2%, ranking Florida 53rd out of 55 US States and territories. LPN passage rates also declined since 2018 (75.6%) (Florida Board of Nursing, 2019). In 2019, Florida’s LPN program passage rate was 72.1%, compared to 85.6% nationally, ranking Florida 50th out of 54 US States and territories. 10 Florida’s NCLEX rankings are of critical concern and in need of significant action to achieve an acceptable passage rate and demonstrate a satisfactory return on the State’s investment. The Center’s report on Florida’s 2019 NCLEX passage rates by nursing education program will be available in Spring 2020. Recommendations The Center offers the following research and policy recommendations related to Florida’s nursing program faculty to contribute to efforts to address nurse workforce issues and the health of Florida’s population. These recommendations should be a starting point for education stakeholders and policy makers working to make valuable contributions to the nurse workforce. 1. Build the pipeline of nurse faculty: 1) create incentives for nurses to seek advanced education, from
ADN to BSN and into graduate study; 2) assist existing nurses to further their education. Legislative efforts to address Florida’s ongoing shortage of RNs and LPNs resulted in a 116% increase in the number of nursing programs since 2009. The commensurate demand for qualified nurse educators combined with increasing retirements among an aging faculty population contributes to the increasing nurse faculty vacancy rates. Increasing the output of nurses with nursing and nursing education graduate degrees with intentions to teach in Florida is key to addressing the growing need for nurse faculty in LPN, ADN, and BSN programs.
2. Develop strategies to reduce faculty separations and vacancy rates. Responding programs reported 572 new full-time faculty positions and 1,243 new part-time faculty in AY 2018-19. In the same period, 390 full-time faculty separated, resulting in a net increase of 182 full-time nursing faculty in all program types in Florida.11 There were 32 fewer faculty separations in AY 2018-19 compared to AY 2017-18 (n = 422), yet Florida's nursing education programs are still losing a substantial number of full-time faculty members, and new hires to replace separated faculty and/or contribute to program expansion are increasingly more likely to be part-time. Vacancy rates increased for all program types (12.5% LPN, 11% ADN, and 12.3% BSN).12 Including the number of additional faculty needed but not budgeted increases perceived vacancy rates 26 percentage points, overall (38%). Variance in needed versus actual positions may impact faculty retention due to expectations for fewer people to do the work of more. Perceived need for new full-time faculty positions also increased since AY 2017-18, indicating that vacancy issues have not reduced since the Center's last education program report. Academic leadership and stakeholders should evaluate their academic work environment and, as appropriate, implement policies and
10 Alaska does not have any LPN programs 11 Excludes new hires among programs that did not comply with the Center’s request for data 12 Based on counts provided by responding programs only. Trends should be interpreted with caution as participation varies over time.

March 2020 Florida Nursing Education Faculty Report: AY 2018-19 12 Data are from responding schools only unless indicated otherwise.
practices to assess and address reasons for separation and retain faculty. Such policy changes may include analysis of market competitiveness of faculty salaries. Industry continues to report difficulty hiring nurses with advanced experience and education, current faculty represent a pool of potential recruits to fill these vacancies.
3. Develop and fund a consistent, long-term data collection, analysis, and reporting system. The Florida Legislature established the Florida Center for Nursing in 2001 to address issues related to nursing manpower in Florida. The first of three mandates given in statute (FS 464.0195) is to develop a strategic statewide plan for nursing manpower in this state by:
• Establishing and maintaining a database on nursing supply and demand in the state, to include current supply and demand, and future projections; and
• Selecting from the plan priorities to be addressed.
Since 2010, the Center has only received state funds in support of this mandate for one fiscal year (2015-2016). The legislature responded to the prior recommendation that the Center be given the authority to collect appropriate data by mandating nursing program participation in the FCN’s annual education survey. However, to fully achieve this mandate, the Center needs fiscal resources as well. The Center also needs resources and the authority to collect workforce demand data, in addition to educational output. Demand data would support development of a more complete picture of the nursing workforce pipeline from initial education through retirement.
Florida’s legislature should put in place a sustainable funding mechanism for the Center to accomplish its statutory mandate. FCN’s analysis of supply, education, and demand data would facilitate the state’s ability to be responsive to the health industry’s workforce needs.

March 2020 Florida Nursing Education Faculty Report: AY 2018-19 13 Data are from responding schools only unless indicated otherwise.
REFERENCES Florida Board of Nursing. (2019). Education and Training Programs. Retrieved March 20, 2019, from
https://floridasnursing.gov/education-and-training-programs/
Florida Center for Nursing. (2014). Florida Nurse Faculty Supply and Demand: Academic Year 2012-2013. Retrieved from https://www.flcenterfornursing.org/DesktopModules/Bring2mind/DMX/API/Entries/Download?Command=Core_Download&EntryId=698&PortalId=0&TabId=151
Florida Center for Nursing. (2018). Florida's 2016-2017 Nursing Education Programs: Nursing Faculty Supply and Demand. Retrieved from https://www.flcenterfornursing.org/DesktopModules/Bring2mind/DMX/Download.aspx?Command=Core_Download&EntryId=1672&PortalId=0&TabId=151
Florida Center for Nursing. (2020). Florida's Nursing Education Programs Academic Year 2018-19: Post-Licensure Registered Nurse (RN) Education. Retrieved from https://www.flcenterfornursing.org/StatewideData/FCNNurseEducationReports.aspx
Institute of Medicine (IOM). (2010). The Future of Nursing: Leading Change, Advancing Health. Washington, DC: The National Academies Press.
Ried, T. P., Hinderer, K. A., Jarosinski, J. M., Mister, B. J., & Seldomridge, L. A. (2013). Expert Clinician to Clinical Teacher: Developing a Faculty Academy and Mentoring Initiative. Nurse Education in Practice(13), 288-293.
United States Census Bureau. (2019). QuickFacts, Florida. Retrieved from https://www.census.gov/quickfacts/fl