facts property casualty insurance industry in canadaassets.ibc.ca/documents/facts...
TRANSCRIPT

FACTS of the Property and Casualty Insurance Industry in Canada
2017

Facts of the Property and Casualty Insurance Industry in Canada 2017 is published by Insurance Bureau of Canada (IBC). IBC is the trade association representing Canada’s private property and casualty (P&C) insurance companies. Since 1972, IBC has published Facts to provide a snapshot of the state of the P&C insurance industry.
The data in Facts 2017 come from several national and international sources, including IBC. Data are from 2015, 2016 or 2017, depending on when sources released their information.
All P&C financial data for 2016 are preliminary.
In some instances, figures may not add up to 100% as a result of rounding. Also, because sources collect data in different ways, there can be small differences among similar data.
39th edition, 2017 Spring ISSN 1197 3404
© Insurance Bureau of Canada. All rights reserved.
Facts of the Property and Casualty Insurance Industry in Canada 2017

IBC Facts 2017 1
President’s message
When a wildfire swept through the northern Alberta city of Fort McMurray in May 2016, destroying or damaging 2,500 homes and buildings, and displacing almost 90,000 people, the devastation was a test for many. Residents were tested by the loss of their homes and businesses and the need to rebuild. For months, first responders were tested by a fire the size of Prince Edward Island that was so hot they nicknamed it “The Beast.”
The Fort McMurray disaster – the largest insured loss in Canada’s history – was also a test for Canada’s property and casualty (P&C) insurance industry.
Insurers are second responders. They arrive immediately after a disaster with cheques in hand to help their policyholders get through those first tough days. And in large-scale events, insurers work very closely with their policyholders and government stakeholders for months and even years.
Almost a year after the fire, with rebuilding well underway, the P&C insurance industry can be proud of its response as it continues to help Fort McMurray residents recover. The industry will remain on the ground, identifying and responding to issues until the community is back on its feet.
For Canadian insurers, 2016 is on record as the worst year ever for catastrophic losses (which are insured losses that total $25 million or more from a single event). The most recent tally is $5.03 billion, of which the Fort McMurray wildfire accounts for $3.7 billion.
Our changing climate is creating more weather extremes – more rain, more heat, more drought, more wind – and is pushing these losses ever higher.
In Canada and around the world, climate change is not a future threat but a present danger.
These numbers tell the story.
• The Fort McMurray wildfire reduced Canada’s GDP by almost half a percentage point in the second quarter of 2016.
• Canada’s parliamentary budget officer estimated that the cost of natural disasters, driven in large part by climate change, will be almost $1 billion annually by 2021.
• Globally, the average annual economic cost of weather disasters has increased sixfold since the 1980s.
Our companies, our customers and all Canadians are feeling the financial and emotional strain of our changing climate.
This is why Insurance Bureau of Canada (IBC) and P&C insurers continue to work with governments and all stakeholders to tackle the effects of climate change and to help Canadians prepare for emergencies. Many Canadian insurers now offer homeowners new overland flood protection products. As well, insurers are encouraging governments to employ better land-use planning, repair existing infrastructure and create new, green infrastructure to make communities more resilient.
P&C insurers are tackling another pocketbook issue, the cost of car insurance in some provinces, which continues to increase. There are encouraging signs that relief is on the way. In Ontario, the provincial government is working to create a new regulator with a mandate to focus on market conduct and innovation. The government has also committed to studying the reforms recommended in Fair Benefits Fairly Delivered, the report by David Marshall. The Alberta government has agreed to bring forward changes that can improve its system. In the Atlantic provinces, Newfoundland and Labrador and Nova Scotia are committed to reviews of their auto insurance systems.
When we work together with our customers and governments, we can affect significant change on issues that Canadians care about.
Don Forgeron President and CEO, Insurance Bureau of Canada

2 IBC Facts 2017
Contents
Section three
49–62Insurance organizations50 IBC members55 IBC offices56 IBC services57 Superintendents of insurance59 Insurance-related organizations
Section two
25–48Canada’s P&C insurance industry by line of businessAuto insurance26 Mandatory insurance26 Optional insurance27 “No-fault” insurance28 What’s mandatory where40 Premiums and claims41 Average losses42 Major issues Home insurance44 Types of coverage44 Premiums and claims45 Major issues Business insurance47 Types of coverage47 Premiums and claims48 Major issues
Section one
3–24Canada’s P&C insurance industry, all sectors4 Industry at a glance6 Premiums 8 Insurance dollar 9 Claims10 Taxes and levies12 Operating expenses 13 Profit 16 Catastrophic losses 24 Regulation and regulatory issues

IBC Facts 2017 3
1
Canada’s P&C insurance industry, all sectors4 Industry at a glance 6 Premiums 8 Insurance dollar 9 Claims 10 Taxes and levies12 Operating expenses 13 Profit 16 Catastrophic losses 24 Regulation and regulatory issues

4 IBC Facts 2017
�� 42.4% of direct written premiums were for car insurance in 2016
�� Of its $170.2 billion in total assets, the P&C insurance industry had $111.3 billion in invested assets in 2016
�� In 2016, Canadian insurers wrote $53.4 billion in direct written premiums for insurance on consumers’ homes, cars and businesses
�� $9.0 billion – the amount the P&C insurance industry contributed in taxes and levies to federal and provincial governments in 2015
�� The P&C insurance industry employed 124,900 people across Canada in 2016
IBC helped recover stolen vehicles worth $28 million in 2016
Industry at a glance

IBC Facts 2017 5
�� Property claims as a percentage of total claims have risen significantly over the last decade
24.4%
39.3%
�� More than half of every dollar of premiums received by insurers is paid out in claims
• 56.6% - claims paid out to policyholders
• 21.5% - operating expenses including employee compensation
• 13.6% - taxes and levies
• 8.3% - profit margin
More than 203 private P&C insurers actively compete in Canada

6 IBC Facts 2017
Top 20 private P&C insurers by direct written premiums, 2016
Rank Company %1 Intact Group 15.782 Aviva Group 9.753 Desjardins Group 8.494 TD Insurance Group 5.785 Co-operators Group 5.416 The Wawanesa Mutual Insurance Company 5.367 Lloyd's Underwriters 5.328 RSA Group 5.309 Economical Group 3.96
10 Travelers Group 2.8511 Allstate Group 2.7112 Northbridge Group 2.6513 AIG Insurance Company of Canada 2.1014 Chubb Group 1.8615 Capitale Group 1.7516 Genworth Financial Mortgage Insurance
Company Canada1.45
17 Zurich Insurance Company Ltd. 1.3818 CAA Group 1.3519 The Guarantee Company of North America 0.9020 Green Shield Canada 0.86
Sources: IBC, MSA
The requirement to estimate future costs is a unique challenge in the insurance business. Most businesses can calculate the actual costs of producing and selling a product before the selling price is determined. However, when setting premiums, P&C insurance companies can only estimate the costs of the medical treatments, car repairs or house repairs they will have to pay in the future.
Consumers often find this confusing and are unsure about what a premium represents. Many think of their premiums as a bank account – it is there just for them in case of a loss. But that’s not how it works.
Insurance companies report premiums in two ways. Direct written premiums are the total amount of premiums that a P&C insurance company receives in one year. Net written premiums are direct written premium amounts plus reinsurance written premium amounts minus reinsurance ceded premium amounts.
There are more than 203 private P&C insurers actively competing in Canada to sell insurance policies on homes, cars and businesses.
In 2016, private Canadian insurers wrote $53.4 billion in direct written premiums ($48.7 billion in net written premiums) for insurance on consumers’ homes, cars and businesses.
Premiums
Insurance premiums are determined based on risk. Insurers consider the likelihood of a customer (or a group of customers with the same set of circumstances) making a claim, and how much those claims will likely cost. The price for premiums is based, in part, on an insurer’s best estimate of the amount it will be required to pay out in claims on the policies it wrote in any given year. Insurers pool the premiums of their many policyholders to cover the losses claimed by the few in that year. Along with covering claim costs, premiums are calculated to cover taxes, operating expenses and expected profits.

IBC Facts 2017 7
Net written premiums (NWP) in $000,000, 1993 to 2016
Auto NWPPersonal
property NWPCommercial
property NWP Liability NWP Other NWP Total NWP1993 8,158 2,803 2,062 1,298 918 15,239
1994 8,697 3,042 2,337 1,430 975 16,482
1995 9,403 3,163 2,553 1,694 1,258 18,071
1996 9,597 3,246 2,658 1,867 1,202 18,570
1997 9,553 3,281 2,711 1,878 1,185 18,608
1998 9,686 3,383 2,469 1,823 1,198 18,559
1999 9,839 3,293 2,434 1,846 1,315 18,728
2000 10,705 3,429 2,591 1,982 1,471 20,178
2001 11,281 3,481 2,768 2,194 1,519 21,242
2002 13,150 3,971 3,909 3,145 3,333 27,507
2003 15,781 4,452 4,518 4,081 2,581 31,413
2004 16,415 5,079 4,802 4,357 2,622 33,275
2005 16,430 5,315 4,820 4,600 2,698 33,864
2006 16,590 5,621 4,985 4,826 2,943 34,964
2007 16,758 6,033 4,997 4,766 3,540 36,095
2008 17,140 6,495 5,001 4,624 3,438 36,698
2009 18,126 7,013 5,313 4,667 3,068 38,187
2010 18,977 7,598 5,568 4,726 3,416 40,285
2011 20,239 8,192 6,014 4,817 3,533 42,794
2012 20,690 8,565 6,136 4,502 3,758 43,653
2013 21,089 9,024 6,339 4,731 3,823 45,007
2014 21,295 9,791 6,621 4,781 4,143 46,632
2015 20,630 10,187 6,656 4,988 4,547 47,009
2016 21,563 10,798 6,789 4,969 4,557 48,676
Sources: IBC, MSA, SCOR, AMF
Direct written premiums (DWP) by line, 2016
LineDWP in
$000,000
DWP as % of total
businessTotal auto 22,650 42.4 Auto - private passenger 18,769 35.1Personal property 11,739 22.0Commercial property 7,523 14.1Liability 5,969 11.2Specialized 4,179 7.8Accident and sickness 1,360 2.5Total business 53,418 100.0
Sources: IBC, MSA, SCOR, AMF
Net written premiums (NWP) by line, 2016
LineNWP in
$000,000
NWP as % of total
businessTotal auto 21,563 44.3 Auto - private passenger 17,859 36.7Personal property 10,798 22.2Commercial property 6,789 13.9Liability 4,969 10.2Specialized 3,555 7.3Accident and sickness 1,002 2.1Total business 48,676 100.0
Sources: IBC, MSA, SCOR, AMF
Of the $48.7 billion in net written premiums, 44.3% was for one line of business: automobile, including commercial vehicle insurance. (Figures do not include government-owned auto insurers in British Columbia, Saskatchewan, Manitoba and Quebec, which exclusively provide the compulsory component of auto insurance in those provinces.) Personal property, commercial property and liability made up most of the rest.
Specialized lines of insurance, such as boiler and machinery, marine and aircraft, and surety and fidelity, make up about 7.3% of the business. The smallest portion of the business is accident and sickness insurance, which a few P&C insurance companies sell. Most of this type of insurance is sold by life and health insurers.

8 IBC Facts 2017
Insurance dollar
�� The “Insurance Dollar” graphic shows how insurers spent each dollar of revenue averaged over seven years, from 2010 to 2016. More than half of every dollar received is paid out in claimsSources: IBC, MSA
• 56.6% - claims paid out to policyholders
• 21.5% - operating expenses including employee compensation
• 13.6% - taxes and levies
• 8.3% - profit margin

IBC Facts 2017 9
Net claims incurred (NCI) in $000,000, 1993 to 2016Auto NCI Personal property NCI Commercial property NCI Liability NCI Other NCI Total NCI
1993 6,420 1,974 1,430 1,004 661 11,490 1994 6,892 1,955 1,493 1,159 545 12,043 1995 7,342 2,003 1,504 1,218 773 12,840 1996 7,034 2,301 1,665 1,449 761 13,210 1997 7,221 2,112 1,838 1,406 613 13,190 1998 7,185 2,523 2,089 1,275 696 13,768 1999 7,475 2,152 1,758 1,438 659 13,483 2000 8,443 2,286 1,847 1,430 784 14,790 2001 9,431 2,316 2,031 1,495 887 16,161 2002 10,844 2,352 2,195 2,085 2,019 19,494 2003 12,028 2,574 2,161 2,632 993 20,388 2004 11,081 2,921 2,033 3,263 864 20,161 2005 10,626 3,570 3,356 3,071 944 21,568 2006 10,968 3,556 2,173 2,577 1,052 20,326 2007 11,753 3,842 2,589 2,642 990 21,817 2008 12,997 4,720 3,157 2,726 1,404 25,003 2009 13,472 5,071 3,454 2,878 1,464 26,338 2010 15,205 4,566 3,276 2,766 1,475 27,288 2011 14,607 5,336 4,087 2,977 1,560 28,567 2012 14,731 5,013 3,981 2,615 1,479 27,817 2013 15,125 6,161 4,699 2,486 1,650 30,120 2014 15,835 6,045 3,955 2,526 1,970 30,330 2015 15,277 5,489 3,797 3,106 1,761 29,431 2016 15,450 6,339 5,570 2,973 1,710 32,043
Sources: IBC, MSA, SCOR, AMF
Net claims incurred (NCI) by line, 2016Line of business NCI in $000,000 NCI as % of total businessTotal auto 15,450 48.2 Auto - private passenger 13,100 40.9Personal property 6,339 19.8Commercial property 5,570 17.4Liability 2,973 9.3Specialized 1,074 3.4Accident and sickness 636 2.0Total business 32,043 100.0
Sources: IBC, MSA
In 2016, Canadian P&C insurers paid out $32.0 billion, or 63%, of insurance company revenues in claims. A note about terminology in the chart below: Net claims incurred are the total claims cost incurred in the period less any share to be paid by reinsurers.
Claims

10 IBC Facts 2017
The main taxes and levies applied to the P&C insurance industry are:
• Retail sales tax on claims and expenses. The P&C insurance industry paid an estimated $2.17 billion in goods and services tax (GST) and provincial sales tax (PST/QST) applicable to P&C insurance claims. An additional $458 million in sales taxes related to general and administrative expenses was incurred as part of daily operations. Being a GST/HST exempt industry means these costs are unrecoverable through input tax credits.
• Insurance premium tax. Provinces apply this tax, which is included in premiums, at different rates on different insurance products. Some jurisdictions have combined this tax with a fire tax. The fire tax is collected by some provincial governments to be disbursed to municipalities to support fire services.
• Retail sales tax on premiums. This is a provincial sales tax collected from policyholders in Manitoba, Ontario and Quebec. On July 1, 2016, Newfoundland and Labrador also applied a 15% RST on P&C insurance products.
• Health care levy. This levy is paid to most provincial governments to support the health care system, particularly to pay the public health system costs for victims of automobile collisions. Health care levies are included in the industry’s total tax contribution because they are a mandatory payment.
Excluding income taxes and the portion of payroll taxes remitted to governments on behalf of employees, the remaining taxes and levies accounted for over $6.5 billion or
Federal and provincial taxes and levies payable in $000,000, 2015Income taxes 1,267.5 Payroll taxes 1,482.2 Realty and business taxes 34.2 Transaction taxes
GST on claims* 903.6 PST/QST on claims* 1,270.8 Sales tax on operating expenses 457.7
RST on premiums (Man., Ont., Que.) 1,593.7 Insurance premium taxes 1,661.6
Transaction subtotal 5,887.4 Total taxes 8,671.3 Health levies 322.8 Total 8,994.1
*Harmonized sales tax (HST) is allocated into the appropriate component
Source: IBC
73% of the total tax contribution. The impact of these taxes on premiums varies depending on the insurance product. On a Canada-wide basis, these taxes account for 14.6% of the premium for personal property insurance, 13.7% of the premium for private passenger auto insurance (includes health care levies), 11.2% of the premium for commercial liability insurance and 10.2% of the premium for commercial property insurance.
Taxes and levies
Each year, the P&C insurance industry makes significant tax contributions to government tax revenues. In 2015, Canadian P&C insurers contributed taxes and levies totalling $9.0 billion to federal and provincial governments. About 86% ($7.7 billion) of the industry’s total tax contribution was incurred through the insurance supply chain and was paid regardless of the industry’s bottom line, while only 14% ($1.3 billion) was paid in income taxes.
IBC Facts 2017 11
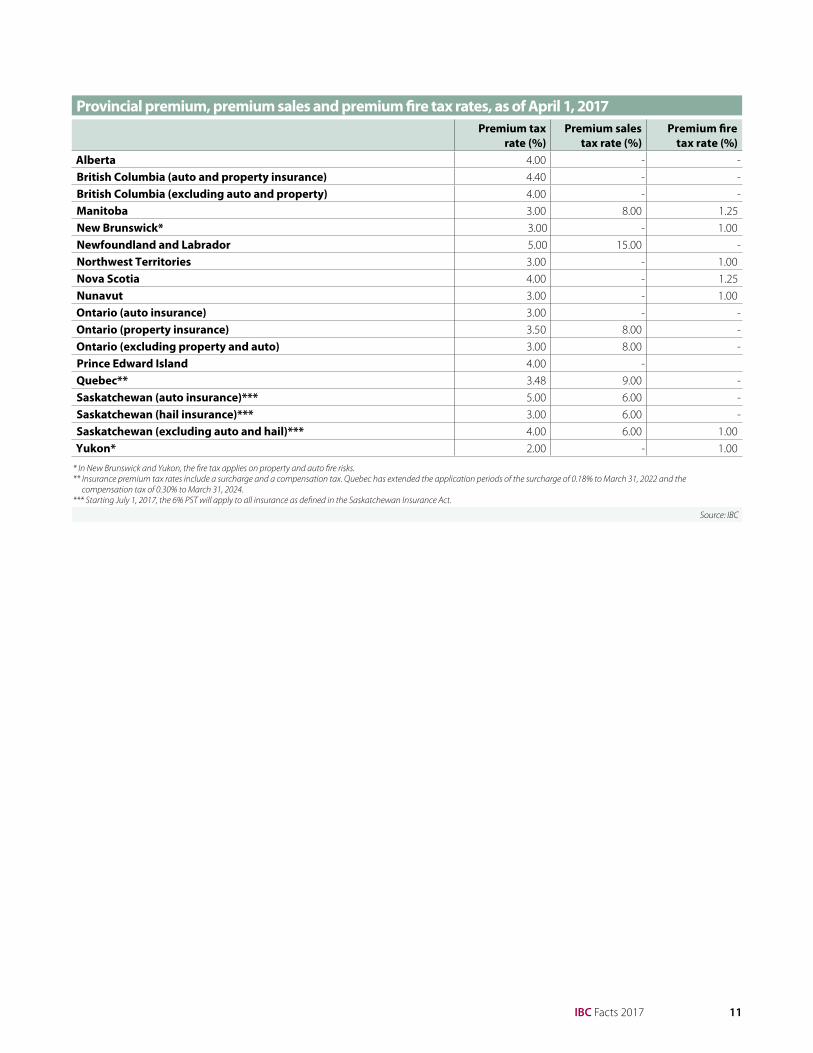
Provincial premium, premium sales and premium fire tax rates, as of April 1, 2017Premium tax
rate (%)Premium sales
tax rate (%)Premium fire
tax rate (%)Alberta 4.00 - - British Columbia (auto and property insurance) 4.40 - - British Columbia (excluding auto and property) 4.00 - - Manitoba 3.00 8.00 1.25New Brunswick* 3.00 - 1.00Newfoundland and Labrador 5.00 15.00 - Northwest Territories 3.00 - 1.00Nova Scotia 4.00 - 1.25Nunavut 3.00 - 1.00Ontario (auto insurance) 3.00 - - Ontario (property insurance) 3.50 8.00 - Ontario (excluding property and auto) 3.00 8.00 - Prince Edward Island 4.00 - Quebec** 3.48 9.00 - Saskatchewan (auto insurance)*** 5.00 6.00 - Saskatchewan (hail insurance)*** 3.00 6.00 - Saskatchewan (excluding auto and hail)*** 4.00 6.00 1.00Yukon* 2.00 - 1.00
* In New Brunswick and Yukon, the fire tax applies on property and auto fire risks.** Insurance premium tax rates include a surcharge and a compensation tax. Quebec has extended the application periods of the surcharge of 0.18% to March 31, 2022 and the
compensation tax of 0.30% to March 31, 2024.*** Starting July 1, 2017, the 6% PST will apply to all insurance as defined in the Saskatchewan Insurance Act.
Source: IBC

12 IBC Facts 2017
Average weekly wage compared tobenchmark industries, 2016Mining and quarrying (except oil and gas) 1,716.9 Professional, scientific & tech. services 1,316.9 Information & cultural industries 1,305.3 Insurance carriers & related activities 1,234.2 Public administration 1,232.5 Credit intermediation 1,149.3 Manufacturing 1,088.9 Hospitals 1,060.4 Educational services 1,016.5 All industries 956.5 Retail trade 561.9 Accommodation & food service 370.7
Source: Statistics Canada Table 281-0027
Employee compensation is the largest operating expense. In 2016, the P&C insurance industry employed 124,900 people across Canada.
Compensation levels in the industry are relatively high compared with most other sectors in the economy. The average weekly salary in 2016 was $1,234. This reflects the advanced skill mix that employees in the P&C insurance industry possess.
Employment in the insurance industry as a whole (which includes life, health and medical, and P&C) grew by 11% between 2010 and 2016, according to Statistics Canada.
Operating expenses
Operating expenses for P&C insurers include facility costs, information technology, market research and employee compensation.

IBC Facts 2017 13
Of its $170.2 billion in total assets, the P&C insurance industry has $111.3 billion in invested assets. This makes the Canadian P&C insurance industry a major stakeholder and investor in the national economy. P&C insurers invest mainly in domestic government and corporate bonds, and in preferred and common stocks. These investments produce a steady flow of income and balance the more variable income from the underwriting side of the business, which tends to fluctuate from year to year.
Investments in $000,000 as of December 31, 2016*Bonds Shares Mortgages Real estate Term deposits Other Total 75,999 11,607 1,219 243 4,561 17,687 111,316
68.3% 10.4% 1.1% 0.2% 4.1% 15.9% 100.0%* As per the latest OSFI regulatory filing forms, which came into effect Q4 2016
Sources: IBC, MSA
In 2016, underwriting posted gains for the 14th consecutive year. The 2016 net underwriting income was $489 million. Before 2003, underwriting posted losses for 24 years in a row.
On investment, 2016 was a year of relatively low returns of 2.7%. Return on investment moves in lockstep with the yields for 3- and 5-year Government of Canada bonds, which have fallen for the last two decades. Investment income for 2016 was $3.0 billion.
The P&C insurance industry is highly regulated by governments and is required by law to invest its assets prudently. More than 68% of invested assets are placed in bonds.
Profit
Profit or return on equity in the P&C insurance industry is cyclical. It has fluctuated around an average of 10.5% since 1975. The 2016 industry return on equity was 6.0%.

14 IBC Facts 2017
Return on equity, return on investment and underwriting ratios, 1993 to 2016
Return on equity *Return on
investment Earned loss ratioOperating
expense ratio Combined ratio1993 9.5% 10.7% 77.1% 32.8% 109.9%1994 6.8% 8.0% 75.7% 31.3% 107.0%1995 11.7% 9.1% 73.3% 30.8% 104.1%1996 13.6% 10.3% 72.7% 30.7% 103.4%1997 13.1% 10.4% 71.4% 31.2% 102.6%1998 6.8% 8.5% 74.9% 32.9% 107.8%1999 6.5% 7.3% 72.6% 33.2% 105.9%2000 6.3% 9.0% 75.9% 32.7% 108.7%2001 2.6% 7.5% 80.0% 31.0% 111.0%2002 1.7% 5.4% 76.9% 28.9% 105.8%2003 11.6% 6.2% 69.9% 28.6% 98.4%2004 18.1% 5.6% 62.7% 28.2% 91.0%2005 17.2% 5.9% 64.7% 28.7% 93.4%2006 16.9% 5.9% 59.5% 28.1% 87.5%2007 14.1% 5.5% 62.5% 28.5% 91.0%2008 6.0% 3.9% 70.3% 30.0% 100.3%2009 6.9% 4.2% 69.5% 30.0% 99.6%2010 7.6% 4.3% 69.1% 30.2% 99.4%2011 8.0% 4.2% 68.2% 30.3% 98.4%2012 10.8% 3.9% 64.7% 30.6% 95.3%2013 6.9% 3.1% 68.1% 30.8% 98.9%2014 9.9% 3.9% 66.6% 31.0% 97.6%2015 10.0% 3.3% 63.5% 31.4% 94.9%2016 6.0% **2.7% 67.6% 31.8% 99.4%
* Excluding Lloyd’s** As per the latest OSFI regulatory filing forms, which came into effect Q4 2016
Sources: IBC, MSA, SCOR, AMF

IBC Facts 2017 15
Return on investment (ROI) compared with Government of Canada bond yield, 1989 to 2016 (%)
Sources: IBC, MSA, Bank of Canada
4
12
8
01989 1991 1993 1995 1997 1999 2001 2003 2005 2007 2009 2011 2013 2015
P&C ROI
Yield for 3–5 yearGovernment of Canada bonds
Return on equity (ROE), 1975 to 2016 (%)
11.2 9.9 8.3
5
10
15
20
01975 1980 1985 1990 1995 2000 2005 2010 2016
Average ROE 10.5
Excluding Lloyd’s Sources: IBC, MSA
0.61

16 IBC Facts 2017
Catastrophic losses in Canada in $000,000,000, 1983 to 2016
Loss + Loss Adjustment Expenses in 2016 dollarsEstimated Trend Line
Source: IBC, PCS Canada, CatIQ, Swiss re, Munich Re, Deloitte
1.0
2.0
4.0
5.0
6.0
3.0
01983 1985 1990 1995 2000 2005 2010 2015
In 2016, catastrophic losses accounted for approximately $5.03 billion, which were the highest ever; of the $5.03 billion, $3.7 billion were a result of the Fort McMurray wildfire. The wildfire that occurred in May 2016 forced the evacuation of almost 90,000 people from Fort McMurray and surrounding communities. The fire destroyed or damaged 2,500 homes and buildings and thousands of vehicles and resulted in almost 49,000 claims in total.
Before 2016, the year 2013 was the record-breaker for catastrophic losses, when insurers paid out more than $3.4 billion, including $1.8 billion as a result of the floods in southern Alberta and around $1 billion as a result of a summer storm and flooding in Toronto. As well, at the end of 2013, a massive winter storm hit southern Ontario and parts of Eastern Canada.
Another record year for insured losses was 1998, the year that an ice storm occurred in Quebec and Ontario that included six days of freezing rain, month-long power outages and $2.1 billion in insured losses.
Milestone losses of the past decade include the hailstorms in Alberta during the summer of 2014 that cost insurers $550 million in insured losses. They also include the Slave Lake fire that ravaged a remote area of Alberta, causing $750 million in insured losses in the spring of 2011, and the Toronto rains of 2005 that generated $708 million in claims.
(All figures in this section are in 2016 dollars. For catastrophic losses plus loss adjustment expenses, see chart next page.)
Insured losses for a given disaster are deemed catastrophic when they total $25 million or more. Catastrophic losses for a year are the sum total of insured losses from these natural disasters. Catastrophic losses due to natural disasters have increased dramatically over the last decade.
Catastrophic losses

IBC Facts 2017 17
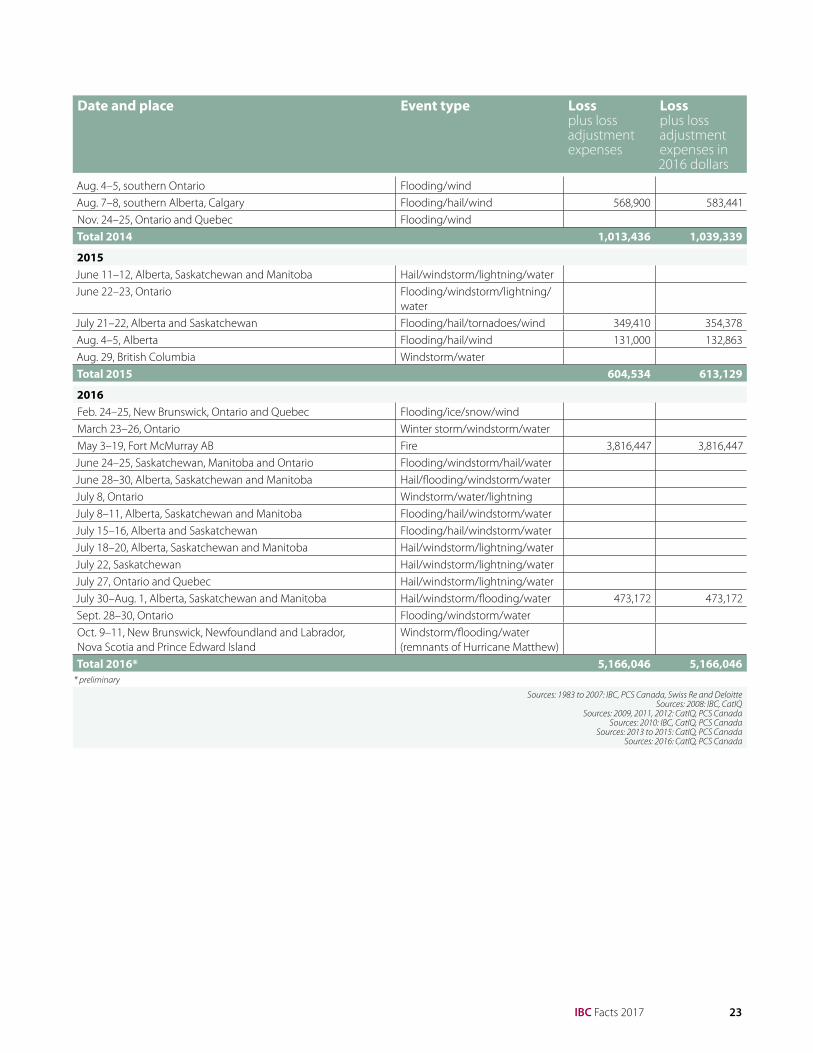
The table below shows the steady increase in the number and cost of catastrophic losses in Canada. This is not a Canada-only phenomenon; it is part of a worldwide trend.
The table includes insured losses by event and annual totals from 1983 to 2008. From 2009 on, it sets out insured losses for the two largest events in the year and annual totals.
The figures are reported by Property Claim Services Canada (PCS Canada), which tracks insured losses arising from catastrophic events in Canada, and Catastrophe Indices and Quantification Inc. (CatIQ) as indicated at the end of the table. Insured losses for all events are available through subscription to PCS Canada and CatIQ.
Catastrophic losses by event in $000, 1983 to 2016
Date and place Event type Lossplus loss adjustmentexpenses
Lossplus loss adjustmentexpenses in 2016 dollars
1983July 9, Saskatchewan Storm 16,385 36,211 Aug. 3, Edmonton AB Storm 22,060 48,752 Total 1983 38,445 84,963
1984 April 30, Bruce County ON Wind 39,066 82,774
Total 1984 39,066 82,774
1985May 30, Leamington ON Storm 16,390 33,404 May 31, Barrie ON Tornado 83,922 171,041 Total 1985 100,312 204,445
1986May 29, Montreal QC Hail 45,473 89,005 Total 1986 45,473 89,005
1987May 29, Montreal QC Hail 24,891 46,657 July 14, Montreal QC Storm 44,678 83,747 July 31, Edmonton AB Tornado 148,377 278,126 Total 1987 217,946 408,529
1988June 7, Medicine Hat AB Tornado 50,027 90,217 July 6, Slave Lake AB Flooding 21,500 38,772 Aug. 16, Calgary AB Hail 37,127 66,954 Total 1988 108,654 195,943
1989July 20, Harrow ON Flooding 13,807 23,701 Total 1989 13,807 23,701
1990July 9, Calgary AB Hail 16,279 26,661 Total 1990 16,279 26,661
1991March 27–28, Sarnia ON Tornado 25,407 39,399 July 3, Red Deer AB Storm 28,202 43,734 Aug. 27, Maskinongé QC Tornado 17,667 27,397 Sept. 7, Calgary AB Hail 342,745 531,503 Nov. 30, Ontario Wind 5,429 8,419 Total 1991 419,450 650,451

18 IBC Facts 2017
Date and place Event type Lossplus loss adjustmentexpenses
Lossplus loss adjustmentexpenses in 2016 dollars
1992July 31, Calgary AB Hail 22,078 33,748 July 31, Toronto ON Flooding 4,898 7,487 Aug. 28, Alberta Hail 5,263 8,045 Aug. 28, Elmira and Aurora ON Flooding 4,348 6,646 Sept. 1, Alberta Hail 7,421 11,344 Oct. 6–7, Avalon NL Wind 8,216 12,559 Nov. 12–13, southern Ontario Wind 36,437 55,697 Nov. 12–13, Quebec Wind 12,056 18,428 Total 1992 100,717 153,953
1993March 13–14, Quebec Storm 18,447 27,671 July 25–Aug.14, Winnipeg MB Flooding 184,837 277,256 July 29–30, Alberta Hail 8,116 12,174 July 29, Saskatchewan Flooding 5,383 8,075 July 29–30, Quebec Flooding 7,624 11,436 Total 1993 224,407 336,611
1994Jan. 16–17, southern Ontario Flooding 13,145 19,694 Jan. 28, southern Ontario Storm 6,250 9,364 May 18, southern Manitoba Storm 8,260 12,376 May 22, Saskatchewan Storm 8,666 12,984 June 18, southern Alberta Hail 8,263 12,380 Aug. 4, Salmon Arm BC Storm 10,225 15,320 Aug. 4, Aylmer QC Tornado 6,911 10,354 Aug. 27, southern Manitoba Hail 8,112 12,154 Aug. 28, southern Ontario Storm 7,219 10,816 Total 1994 77,051 115,442
1995June 6–9, Calgary AB Flooding 20,764 30,435
July 4, Edmonton AB Hail 14,698 21,544
July 10, southern Alberta Hail 26,389 38,680
July 13–15, southern Ontario Storm 53,439 78,328
July 17, Calgary AB Hail 52,304 76,665
July 30, southern Manitoba Storm 8,468 12,412
Aug. 26, Regina SK Storm 12,294 18,020
Oct. 5–6, Hamilton ON Storm 16,325 23,928
Total 1995 204,681 300,012
1996July 16, Winnipeg MB Flooding/hail 146,825 212,062
July 16–18, Calgary AB Hail 119,091 172,005
July 24–25, Calgary AB Hail 85,222 123,088
July 19–20, Saguenay QC Flooding 207,159 299,204

IBC Facts 2017 19
Date and place Event type Lossplus loss adjustmentexpenses
Lossplus loss adjustmentexpenses in 2016 dollars
July 23, Outaouais QC Wind/hail 1,571 2,269
Aug. 8, Ottawa ON Flooding 20,257 29,258
Aug. 8, Outaouais and Estrie QC Flooding 7,882 11,384
Nov. 9, Montreal and Quebec City QC Flooding 76,040 109,826
Total 1996 664,047 959,096
1997Feb. 27, Niagara Peninsula ON Wind 23,776 33,770
April 6–7, Sudbury ON Flooding 20,558 29,200
July 14–15, Chambly QC Flooding 29,865 42,419
Total 1997 74,199 105,389
1998Jan., southern Quebec Ice storm 1,384,100 1,946,533 Jan., eastern Ontario Ice storm 170,000 239,080 Jan., southern New Brunswick Ice storm 20,000 28,127 July 4–9, Calgary AB Hail 69,742 98,082 Sept. 26–27, Niagara Peninsula ON Wind 63,403 89,167 Total 1998 1,707,245 2,367,329
1999Jan., southern Ontario Snowstorm 120,021 165,885 June 5, Drummondville QC Hail 20,555 28,410 July 5–6, Quebec Wind 43,321 59,875 July 28, Atlantic provinces Flooding 15,756 21,777 Sept. 22, Atlantic provinces Flooding 15,648 21,628 Total 1999 215,301 297,574
2000May 12, southern Ontario Storm 128,121 172,440 July 7, southern Manitoba Storm 18,559 24,979 July 14, Pine Lake AB Tornado 17,916 24,113 Aug. 9, Calgary AB Storm 28,058 37,764 Oct. 30, Sydney NS Flooding 4,010 5,397 Dec. 17, Atlantic provinces Wind 19,756 26,590 Total 2000 216,420 291,282
2001Feb. 1, Atlantic provinces Snowstorm 13,746 18,047 Feb. 8, southern Ontario Storm 54,078 70,998 Feb. 8, Quebec Storm 53,843 70,690 July 13, Alberta Storm 25,513 33,496 July 28, Edmonton, AB Storm 23,902 31,381 Sept. 19, Atlantic provinces Flooding 6,362 8,353 Dec. 14, southwestern British Columbia Wind 27,035 35,494 Total 2001 204,480 268,458

20 IBC Facts 2017
Date and place Event type Lossplus loss adjustmentexpenses
Lossplus loss adjustmentexpenses in 2016 dollars
2002Jan. 31, southern Ontario Wind 34,508 44,308 March 9, Ontario Wind 110,989 142,510 June 8, southern Alberta Flooding 42,828 54,991 June 10, southern Ontario Storm 53,943 69,263 July 26, southwestern Ontario Storm 60,060 77,117 Total 2002 302,327 388,188
2003March 30–April 1, New Brunswick Flooding 4,695 5,864 March 30–April 1, Newfoundland and Labrador Flooding 711 888 March 30–April 1, Prince Edward Island Flooding 628 784 March 30–April 1, Nova Scotia Flooding 18,557 23,178 Aug. 11–12, Alberta Wind/hail 33,565 41,924 Aug. 11–12, Saskatchewan Wind/hail 29,055 36,290 Summer, British Columbia Forest fires 200,000 249,805 Sept. 28–29, Prince Edward Island Hurricane 6,665 8,325 Sept. 28–29, Nova Scotia Hurricane 132,671 165,710 Total 2003 426,548 532,770
2004July 2–11, Edmonton AB Hail 166,000 203,576 July 15, Calgary AB Hail 21,500 26,367 July 15, Peterborough ON Flooding 87,303 107,065 Sept. 9, eastern Ontario Rainstorm 57,600 70,638 Total 2004 332,403 407,646
2005June 6–8 and June 17–19, Alberta Flooding 300,000 360,000 June 20–30 and July 1–2, Manitoba Flooding 60,000 72,000 July 5 and Sept. 26, Quebec Rainstorm 57,000 68,400 Aug. 19, Ontario Hail/tornadoes/wind 625,400 750,480 Total 2005 1,042,400 1,250,880
2006Feb. 6, British Columbia Storm 6,406 7,539 Aug. 10, Alberta Hail 13,593 15,998 Sept. 24, Greater Toronto Area ON Wind/hail 4,628 5,447 Nov.15–Dec. 15, British Columbia Storm 133,086 156,629 Total 2006 157,713 185,613
2007Jan. 5, British Columbia Storm 16,235 18,696 June 5, Alberta Storm 44,621 51,384 June 22–24, Manitoba Storm 17,607 20,276 Summer, Manitoba Storms 47,400 54,584 July 7, Alberta Forest fires 7,376 8,494 July 28–29, Alberta Hail 16,581 19,094 Aug. 1, Newfoundland and Labrador Wind 6,039 6,954 Total 2007 155,859 179,482

IBC Facts 2017 21
Date and place Event type Lossplus loss adjustmentexpenses
Lossplus loss adjustmentexpenses in 2016 dollars
2008Jan. 9, Ontario Storm 28,017 31,528
April/May, New Brunswick Flooding 8,010 9,014
June 10, several regions in Quebec Hail 125,000 140,666
July 1, Lethbridge AB Windstorm/hail 20,500 23,069
July 9, Swift Current SK Hail/windstorm/lightning/water
Aug. 8, Red Deer AB Hail/windstorm/lightning/water
Sept., Saskatchewan Hail 132,000 148,543
Dec. 21, Vancouver BC Winter storm
Total 2008 446,460 502,414
2009Jan 6–8, Fraser Valley BC Flooding/waterFeb. 11–13, Ontario Flooding/ice/snow/windApril 25–27, Ontario Hail/tornadoes/windJuly 11–13, Hamilton and Ottawa ON, Montreal and Mirabel QC Hail/tornadoes/windJuly 24–28, Ontario Flooding/wind 227,900 255,790 Aug. 1–3, Alberta Hail/wind 376,300 422,351 Aug. 13–15, Manitoba Hail/windAug. 20, southern Ontario Hail/tornadoes/windAug. 23, New Brunswick and Newfoundland and Labrador Flooding/hurricane/wind
(Hurricane Bill)Aug. 29, New Brunswick, Newfoundland and Labrador, and Quebec
Flooding/tropical storm/wind (Tropical Storm Danny)
Total 2009 1,032,782 1,159,171
2010March 13, Toronto and Hamilton ON Flooding/windMay 28, Winnipeg MB Flooding/waterJune 5–6, Leamington and Windsor/Essex County ON Flooding/hail/tornadoes/wind 127,200 140,193 June 16–18, southern Alberta and Saskatchewan Flooding/waterJune 29, various regions, AB and Saskatoon, SK Hail/flooding/windstorm/
lightningJuly 1–3, Swift Current, Wynyard and Hudson Bay region SK Flooding/hail/tornadoes/windJuly 12–13, Calgary and southern Alberta Hail/wind 530,000 584,137 Aug. 22, Calgary AB Hail/windstorm/lightning/waterSept. 20–21, Newfoundland and Labrador Flooding/hurricane/wind
(Hurricane Igor)Sept. 30–Oct. 1, Ontario and Quebec Flooding/windstorm/lightning/
water (remnants of Tropical Storm Nicole)
Dec., Atlantic provinces StormsTotal 2010 1,235,299 1,361,480
2011March 5–7, Ontario and Quebec Flooding/ice/windApril 10–11, Thunder Bay, southern and eastern Ontario Hail/windstorm/lightning/waterApril 27–28, Ontario and Quebec Hail/tornadoes/windMay 14–17, Slave Lake AB Fire 742,000 794,602 June 2, Manitoba and Saskatchewan Hail/windstorm/lightning/water

22 IBC Facts 2017
Date and place Event type Lossplus loss adjustmentexpenses
Lossplus loss adjustmentexpenses in 2016 dollars
June 7, southern Ontario Hail/windstorm/lightning/waterJune 17–21, Weyburn and Estavan, SK Flooding/waterJune 23–24, Ontario and Quebec Flooding/hail/windstorm/
lightningJuly 7, Red Deer, Bergen, Olds, Bowden and Innisfail, AB Windstorm/hail/lightning/waterJuly 18–19, Alberta, Manitoba and Saskatchewan Hail/tornados/windAug. 15, Saskatoon, Biggar and Warman, SK Hail/flooding/windstorm/
lightningAug. 21, Goderich ON Flooding/hail/tornados/windAug. 28–30, New Brunswick, Quebec and Ontario Flooding/wind
(remnants of Hurricane Irene)Nov. 27, Alberta Wind 238,500 255,408 Total 2011 2,044,397 2,189,329
2012March 2–3, Ontario and Quebec Windstorm/winter storm/waterMay 26–29, Thunder Bay ON and Montreal QC Flooding/wind 259,700 273,997 June 25–27, Saskatchewan Windstorm/hail/lightning/waterJuly 11–12, Edmonton AB Flooding/hail/windJuly 22–23, Hamilton, Ottawa and surrounding areas ON Flooding/hail/windJuly 26, southern Alberta (Cardston to Nanton) Hail/windAug. 11, southern Quebec Flooding/windstorm/lightning/
waterAug. 12, region around Calgary AB Flooding/hail/wind 562,000 592,940 Aug. 14, Calgary AB Hail/windstorm/lightning/waterOct. 29–31, Ontario and Quebec Flooding/wind
(remnants of Hurricane Sandy)Total 2012 1,460,893 1,541,320
2013April 11–14, southwestern Ontario Winter stormMay 28–June 2, parts of Ontario and Quebec Flooding/windJune 19–24, southern Alberta Flooding/hail/wind 1,827,000 1,910,316 July 2, Edmonton AB Hail/windstorm/lightning/waterJuly 8–9, Toronto and southern Ontario Flooding/wind 999,500 1,045,080 July 19, central and southern Ontario and southwest Quebec Flooding/hail/windJuly 19, Regina SK Hail/lightning/waterJuly 23, southern Alberta Hail/windstorm/lightning/waterDec. 22–26, Ontario, Quebec, New Brunswick, Nova Scotia, Prince Edward Island, and Newfoundland and Labrador
Freezing/ice/wind
Total 2013 3,540,388 3,701,839
2014June 17–18, southern Ontario Flooding/hail/tornadoes/windJune 28–July 1, southern Manitoba and Saskatchewan Flooding/wind 109,400 112,196 July 5, Quebec, New Brunswick, Nova Scotia and Prince Edward Island
Windstorm/flooding/water (remnants of Tropical Storm Arthur)
July 17, Alberta and Saskatchewan Hail/windstorm/lightning/water
IBC Facts 2017 23
Date and place Event type Lossplus loss adjustmentexpenses
Lossplus loss adjustmentexpenses in 2016 dollars
Aug. 4–5, southern Ontario Flooding/windAug. 7–8, southern Alberta, Calgary Flooding/hail/wind 568,900 583,441 Nov. 24–25, Ontario and Quebec Flooding/windTotal 2014 1,013,436 1,039,339
2015June 11–12, Alberta, Saskatchewan and Manitoba Hail/windstorm/lightning/waterJune 22–23, Ontario Flooding/windstorm/lightning/
waterJuly 21–22, Alberta and Saskatchewan Flooding/hail/tornadoes/wind 349,410 354,378 Aug. 4–5, Alberta Flooding/hail/wind 131,000 132,863 Aug. 29, British Columbia Windstorm/waterTotal 2015 604,534 613,129
2016Feb. 24–25, New Brunswick, Ontario and Quebec Flooding/ice/snow/windMarch 23–26, Ontario Winter storm/windstorm/waterMay 3–19, Fort McMurray AB Fire 3,816,447 3,816,447 June 24–25, Saskatchewan, Manitoba and Ontario Flooding/windstorm/hail/waterJune 28–30, Alberta, Saskatchewan and Manitoba Hail/flooding/windstorm/waterJuly 8, Ontario Windstorm/water/lightningJuly 8–11, Alberta, Saskatchewan and Manitoba Flooding/hail/windstorm/waterJuly 15–16, Alberta and Saskatchewan Flooding/hail/windstorm/waterJuly 18–20, Alberta, Saskatchewan and Manitoba Hail/windstorm/lightning/waterJuly 22, Saskatchewan Hail/windstorm/lightning/waterJuly 27, Ontario and Quebec Hail/windstorm/lightning/waterJuly 30–Aug. 1, Alberta, Saskatchewan and Manitoba Hail/windstorm/flooding/water 473,172 473,172Sept. 28–30, Ontario Flooding/windstorm/waterOct. 9–11, New Brunswick, Newfoundland and Labrador, Nova Scotia and Prince Edward Island
Windstorm/flooding/water (remnants of Hurricane Matthew)
Total 2016* 5,166,046 5,166,046 * preliminary
Sources: 1983 to 2007: IBC, PCS Canada, Swiss Re and DeloitteSources: 2008: IBC, CatIQ
Sources: 2009, 2011, 2012: CatIQ, PCS CanadaSources: 2010: IBC, CatIQ, PCS Canada
Sources: 2013 to 2015: CatIQ, PCS CanadaSources: 2016: CatIQ, PCS Canada

24 IBC Facts 2017
Market conduct – going global
The International Association of Insurance Supervisors’ “Insurance Core Principles” are driving regulatory activity in Canada. For instance, they are influencing the market conduct regulation governing how insurance companies treat their customers. The increased influence of international regulatory bodies means that regulation of the P&C insurance market in Canada is becoming more consistent with regulations that are in place around the globe.
IBC monitors global regulations to assess their impact on Canadian insurers. This involves ensuring that international regulations are sensitive to the domestic regulatory landscape and the particulars of the P&C insurance industry in Canada. IBC also participates in the discussions led by the Global Federation of Insurance Associations, providing input into the development of many aspects of international regulations that affect P&C insurers.
While it is impossible to pinpoint exactly how much the industry pays per year to comply with regulatory requirements, it’s estimated to be hundreds of millions of dollars.
Auto insurance, in particular, is very highly regulated. The provincial governments determine how claims are handled and how complaints are managed; they also administer rate approval systems. IBC is advocating for auto insurance reform in several provinces, including Alberta, Ontario, and Newfoundland and Labrador.
Through IBC, the P&C insurance industry also engages with regulators and the federal government to ensure that new regulatory initiatives balance the needs of both consumers and insurers.
Enhancing the efficiency and cost effectiveness of insurance regulation can also bring significant benefits to consumers by reducing costs, which will be reflected in premiums.
OSFI’s 2015 Minimum Capital Test (MCT) Guideline captured significant regulatory capital changes following an 18-month consultation period with the industry. Further revisions to the MCT will be announced in mid-2017, in the form of a Draft MCT that will be subject to a public consultation. The final MCT Guideline is expected in September 2017 and will come into effect on January 1, 2018.
In recent years, standards and guidelines developed by international bodies have had a greater influence on Canada’s regulatory system. This is a result of the global financial crisis of 2008, which spurred a revamping of rules worldwide.
Particularly significant is the guidance provided by the G20, a forum for the governments and central bank governors of 20 major economies; the Financial Stability Board, which monitors and makes recommendations about the global financial system; and the International Association of Insurance Supervisors, which is leading the development of the global
Insurance Capital Standard (ICS). While the ICS is currently in early stages of development, later versions of the ICS are likely to influence the Canadian capital standard, where deemed appropriate by OSFI. IBC is collaborating with its international colleagues to monitor and comment on the ICS development and with OSFI to ensure that any capital changes are appropriate in the Canadian context.
To better align with international trends and the evolving expectations of regulators, IBC has revised its Code of Rights and Responsibilities and its Standards of Sound Marketplace Practice. All IBC members are urged to adopt the new voluntary code and standards, and post them on their websites.
The federal and provincial governments regulate the P&C insurance industry. The provincial governments regulate market conduct, and the federal Office of the Superintendent of Financial Institutions (OSFI) regulates solvency.
Regulation and regulatory issues

IBC Facts 2017 25
2
Canada’s P&C insurance industry by line of businessAuto insurance26 Mandatory insurance26 Optional insurance27 “No-fault” insurance28 What’s mandatory where40 Premiums and claims41 Average losses42 Major issues Home insurance44 Types of coverage44 Premiums and claims45 Major issues Business insurance47 Types of coverage47 Premiums and claims48 Major issues

26 IBC Facts 2017
law in all provinces, and in some provinces may include direct compensation property damage (DCPD) coverage.
DCPD covers damage to an insured vehicle and to any property inside the vehicle when another motorist is responsible for the collision. It is called direct compensation because drivers collect from their own insurer, even though someone else is at fault. DCPD is mandatory in Ontario, Quebec, New Brunswick, Nova Scotia and Prince Edward Island.
Uninsured auto coverage protects an insured person if he or she is injured through the fault of a driver who does not have auto insurance or is unidentified.
Optional insuranceCollision and comprehensive insurance are optional in all provinces except Saskatchewan and Manitoba, where both are mandatory.
Collision coverage pays for the cost of repairing or replacing a vehicle following a collision with another vehicle or object, such as a tree, house, guardrail or pothole. Comprehensive coverage pays for repairs to or replacement of a vehicle for damage caused by something other than a collision; for example, fire, theft, vandalism or wind.
There are about 109 private P&C insurance companies competing for auto insurance business in Canada. In addition to these private insurers, government-owned insurers in British Columbia, Saskatchewan, Manitoba and Quebec provide the mandatory component of auto insurance in those provinces.
Mandatory insuranceThere are three kinds of mandatory coverage:
Accident benefits (AB) coverage helps people recover from injuries sustained in a collision. It pays for medical care, rehabilitation, income replacement and other benefits to aid the recovery of collision victims, including drivers, passengers and pedestrians. In the case of a death, this coverage also provides funeral expenses and survivor benefits. This insurance is mandatory in all provinces except Newfoundland and Labrador. In some provinces, it is referred to as “Section B” benefits.
Accident benefits are paid on a no-fault basis. This means that the benefits are available to anyone injured in a vehicle collision regardless of whether he or she was “at fault” for the collision. See the next page for more detail on “no-fault” insurance.
Third-party liability (TPL) coverage protects the insured driver and/or owner of the vehicle if the motor vehicle injures or kills someone or damages someone’s property through the fault of the driver. Third-party liability coverage is required by
In the event of an automobile collision, auto insurance covers the owner of the vehicle, the driver operating the vehicle with the owner’s consent, passengers, pedestrians and property. In 2016, auto insurance, which is required by law in every Canadian province and territory, accounted for approximately half the insurance written by P&C insurers.
Auto insurance

IBC Facts 2017 27
“No-fault” insuranceThe concept of “no-fault” insurance developed over time as a way to reduce the legal and administrative costs associated with having to prove fault in a vehicle collision.
Before “no fault,” insurers required those involved in a collision to establish which driver was at fault. The insurer of the at-fault driver would be responsible for covering the losses resulting from injuries arising from the incident to those who were not at fault. This process was lengthy and required expensive investigation and often litigation.
In a pure no-fault car insurance system, if a person is injured or his or her car is damaged in a collision, the person deals directly with his or her own insurance company, regardless of who is at fault.
Every province and territory offers some degree of no-fault insurance.
l Pure no-fault systems with no right to sue
l Mix of no-fault and tort-based systems
In most provinces and territories, the person who did not cause the collision also has the right to sue the at-fault driver for damages but, in some provinces, only if his or her injuries meet a prescribed threshold.
Every province offers some degree of no-fault insurance. Two provinces – Manitoba and Quebec – have pure no-fault systems, with no right to sue respecting bodily injury or death. Other provinces use a mix of no-fault and tort-based systems. Some of them specify accident benefits limits and the right to sue for additional compensation under certain specified situations, such as when injuries are determined to be permanent and serious.

28 IBC Facts 2017
This information is for educational purposes only; IBC recommends consulting a qualified professional for further assistance.
A note about terminology: Some provincial acts refer to “spouse” and some to “spouse/partner,” which have different definitions. Some provinces use the term “unpaid housekeeper,” which is called “homemaker” or “non-earner benefit” in other provinces.
“Head of household” is usually defined as the spouse or partner with the larger income in the previous 12 months. For the full legal terminology, see the links in the Sources section at the end of each provincial chart.
Comparison of mandatory private passenger auto insurance coverage by province
Mandatory minimum third-party liability:
$200,000 available for any one accident; however, if a claim involving both bodily injury and property damage reaches this figure, payment for property damage will be capped at $20,000
Direct compensation property damage required?
No
Medical payments: Up to $150,000/person
Disability income benefits: 75% of gross weekly wages to maximum $300/week; 104 weeks for temporary disability, lifetime for total disability; nothing payable for the first seven days of disability; homemaker up to $145/week, maximum 104 weeks
Death benefits: Death following a collision; death of head of household $5,000, plus $145/week for 104 weeks to first survivor, plus $1,000 and $35/week for 104 weeks to each child; death of spouse/partner of head of household $2,500; death of dependent child, according to age, maximum $1,500
Impairment benefits: N/A
Right to sue for pain and suffering? Yes
Right to sue for economic loss in excess of no-fault benefits?
Yes
Administration: Government (government and private insurers compete for optional and additional coverage)
Source:ICBC Autoplan Insurance,
http://www.icbc.com/autoplan/Documents/autoplan-insurance.pdf
Quebec nwt pei yukonalberta nun
sask newf ont nb mbbc ns
as of January 1, 2017
British Columbia
Auto insurance comes under provincial jurisdiction, so the rules are slightly different in each province. The following charts compare provincial regulations and have been abbreviated for space and edited for consistency and clarity.
Auto insurance What’s mandatory where

IBC Facts 2017 29
Mandatory minimum third-party liability:
$200,000 is available for any one accident; however, if a claim involving both bodily injury and property damage reaches this figure, payment for property damage will be capped at $10,000
Direct compensation property damage required?
No
Medical payments: Up to $50,000/person
Funeral expense benefits: $5,000
Disability income benefits: 80% of gross weekly wages to maximum $400/week; up to 104 weeks for total disability; nothing payable for the first seven days of disability; non-earner benefit (unemployed person 18 years or older) $135/week, up to 26 weeks
Death benefits: Death of head of household $10,000, plus 20% ($2,000) for each dependent survivor after first, plus additional $15,000 for first survivor and $4,000 for each remaining survivor; death of spouse/adult interdependent partner of head of household $10,000; death of dependent relative, according to age, maximum $3,000; grief counselling up to $400 per family with respect to death of any one person
Impairment benefits: N/A
Right to sue for pain and suffering? Yes. If injury is deemed “minor” under provincial legislation, maximum award is $5,020
Right to sue for economic loss in excess of no-fault benefits?
Yes
Administration: Private insurers
Sources: Automobile Accident Insurance Benefits Regulations,
www.qp.alberta.ca/1266.cfm?page=1972_352.cfm&leg_type=Regs&isbncln=0779751140;Alberta Standard Automobile Policy, S.P.F. No. 1,
http://www.finance.alberta.ca/publications/insurance/automobile-insurance/policies-forms-certificates/SPF1-Standard-Automobile-Policy-2013.pdf;Alberta Superintendent of Insurance Bulletin 07-2016,
http://www.finance.alberta.ca/publications/insurance/bulletins-notices/2016/Superintendent-of-Insurance-2016-07-Bulletin.pdf
Quebec nwt pei yukonalberta nun
sask newf ont nb mbbc ns
as of January 1, 2017
Alberta

30 IBC Facts 2017
Mandatory minimum third-party liability:
$200,000 is available for any one accident; however, if a claim involving both bodily injury and property damage reaches this figure, payment for property damage will be capped at $10,000
Direct compensation property damage required?
No
If no-fault option selected: If tort option selected:
Medical payments: Up to $7,813,680/person Up to $26,667/person for non-catastrophic injury, up to $200,000 for catastrophic injury
Funeral expense benefits: $10,219 $6,667
Disability income benefits: 90% of net wages based on gross annual income of maximum $94,587/year; nothing payable for the first seven days of disability unless catastrophically injured
Up to two years; $429/week for total disability (lifetime if unable to return to any job); $214/week for partial disability; maximum $22,308/year
Death benefits: 50% of deceased’s income benefit; minimum $70,293 to spouse; 5% of calculated death benefits to each dependent child; if no spouse, $15,620 to each surviving parent or child (21 years or older), to maximum $70,293; death of dependent child $31,240
45% of deceased’s net income; minimum $60,000 to spouse; 5% of calculated death benefits to each dependent child; if no spouse or dependant, estate receives up to $13,333
Impairment benefits: Up to $195,257/person for non-catastrophic injury, up to $238,479 for catastrophic injury
Up to $13,333/person for non-catastrophic, up to $173,333 for catastrophic injury
Right to sue for pain and suffering? No Yes, subject to deductible of $5,000
Right to sue for economic loss in excess of no-fault benefits?
Yes Yes
Administration: Government (government and private insurers compete for optional and additional coverage)
Sources:SGI Canada Personal Injury Coverage,
https://www.sgi.sk.ca/individuals/registration/personalautoinjury/index.html;Your Guide to No Fault Coverage, 2017,
https://www.sgi.sk.ca/pdf/guide_nofault_2017.pdf;Your Guide to Tort Coverage, 2017,
https://www.sgi.sk.ca/pdf/guide_tort_2017.pdf;SGI Auto Pak: Policy booklet, 2017,
http://www.sgicanada.ca/sk/pdf/booklets/2017_auto_pak.pdf
Quebec nwt pei yukonalberta nun
sask newf ont nb mbbc ns
as of January 1, 2017
Saskatchewan

IBC Facts 2017 31
Mandatory minimum third-party liability:
$200,000 is available for any one accident; however, if a claim involving both bodily injury and property damage reaches this figure, payment for property damage will be capped at $20,000
Direct compensation property damage required?
No
Medical payments: No time or amount limit
Funeral expense benefits: $8,409 (maximum)
Disability income benefits: 90% of net wages based on gross annual income of maximum $94,500/year; nothing is payable for the first seven days of disability
Death benefits: Death any time after injury; benefits for partners depend on wage and age of deceased and range from $61,706 to $472,500; benefits for dependent children depend on their age and range from $29,309 to $53,993; disabled dependants receive an additional $26,995; non-dependent children or parents receive $13,741
Impairment benefits: Minimum $770/week to maximum $154,261 for non-catastrophic injury; maximum $243,580 for catastrophic injury
Right to sue for pain and suffering? No
Right to sue for economic loss in excess of no-fault benefits?
Yes
Administration: Government
Sources:Guide to Autopac,
http://www.mpi.mb.ca/en/PDFs/PolicyGuide2017.pdf; Basic Personal Injury Protection Plan (PIPP) Benefits,
https://www.mpi.mb.ca/en/Claims/BI/Pages/benefits.aspx;Services and Support Guide for Fatality Claims,
https://www.mpi.mb.ca/en/PDFs/SupportGuideFatalityClaims.pdf
Quebec nwt pei yukonalberta nun
sask newf ont nb mbbc ns
as of March 1, 2017
Manitoba

32 IBC Facts 2017
Mandatory minimum third-party liability:
$200,000 is available for any one accident; however, if a claim involving both bodily injury and property damage reaches this figure, payment for property damage will be capped at $10,000
Direct compensation property damage required?
Yes
Medical payments: Up to $3,500 for minor injury; up to $65,000/person for non-minor and non-catastrophic injury for up to 5 years; up to $1 million for catastrophic injury
Funeral expense benefits: $6,000 (if optional indexation coverage is purchased, this amount may be higher)
Disability income benefits: Income Replacement Benefit: 70% of gross wages to maximum $400/week, minimum $185/week for 104 weeks (longer if victim is unable to pursue any suitable occupation); nothing is payable for the first seven days of disabilityNon-earner Benefit (disabled unemployed persons, students enrolled in education full time, or students who completed their education less than one year before the accident and are not employed): $185/week for 104 weeks; four-week wait; limit two years. Not available if the insured is eligible for, and elects to receive, the income replacement or caregiver benefit
Death benefits: Death within 180 days of accident (or three years if continuously disabled prior to death); $25,000 minimum to spouse, $10,000 to each surviving dependant, $10,000 to each parent/guardian (if optional indexation coverage is purchased, these amounts may be higher)
Impairment benefits: N/A
Right to sue for pain and suffering? Yes, if injury meets severity test (called “threshold”), and subject to deductible. Lawsuit allowed only if injured person dies or sustains permanent and serious disfigurement and/or impairment of important physical, mental or psychological function. The court assesses damages and deducts $37,385 ($18,693 for a Family Law Act claim)
Right to sue for economic loss in excess of no-fault benefits?
Yes. Income replacement award above no-fault benefit is based on net income after deductions for income tax, Canada Pension and Employment Insurance. Injured person may sue for 70% of net income loss before trial, 100% of gross after trial; also for medical, rehabilitation and related costs when injury meets severity test for pain and suffering claims
Administration: Private insurers
Sources:Ontario Automobile Policy,
www.fsco.gov.on.ca/en/auto/forms/Documents/OAP-1-Application-and-Endorsement-Forms/1215E.1.pdf; Statutory Accident Benefits Schedule (SABS), Insurance Act, O. Reg. 34/10,
www.e-laws.gov.on.ca/html/regs/english/elaws_regs_100034_e.htm;Financial Services Commission of Ontario: Auto Bulletins,
www.fsco.gov.on.ca/en/auto/autobulletins/Pages/default.aspx
Quebec nwt pei yukonalberta nun
sask newf ont nb mbbc ns
as of January 1, 2017
Ontario

IBC Facts 2017 33
Private Insurance
Mandatory minimum third-party liability:
$50,000 is available for any one accident; liability limits relate to property damage claims within Quebec and to personal injury and property damage claims outside Quebec
Direct compensation property damage required?
Yes
Public Insurance
Medical payments: No time or amount limit
Funeral expense benefits: $5,178
Disability income benefits: 90% of net wages based on gross annual income of maximum $72,500/year; nothing is payable for the first seven days of disability; indexed
Death benefits: Death any time after accident; benefits depend on gross annual income multiplied by a factor between one and five, depending on age of the victim; benefits for spouse range from $69,102 to $362,500; benefits for dependent child depend on their age and range from $32,822 to $60,466; if there is no surviving spouse/dependant, parents or estate receive $55,386
Impairment benefits: Up to $242,311
Right to sue for pain and suffering? No
Right to sue for economic loss in excess of no-fault benefits?
No
Administration: Bodily injury: governmentProperty damage: private insurers
Sources:Quebec Auto Insurance Policy Form Q.P.F. No.1, March 1, 2014,
www.lautorite.qc.ca/files/pdf/formulaires-professionnels/assureur/automobile/qpf_1.pdf;The Insurance Policy for All Quebecers: Accident Victim,
www.saaq.gouv.qc.ca/en/accident_victim/insurance_policy/index.php; Calculation of Death Benefits, 2017,
www.saaq.gouv.qc.ca/en/accident_victim/insurance_policy/death_table.php
Quebec nwt pei yukonalberta nun
sask newf ont nb mbbc ns
as of January 1, 2017
Quebec

34 IBC Facts 2017
Mandatory minimum third-party liability:
$200,000 is available for any one accident; however, if a claim involving both bodily injury and property damage reaches this figure, payment for property damage will be capped at $20,000
Direct compensation property damage required?
Yes
Medical payments: Up to $50,000/person; four-year time limit
Funeral expense benefits: $2,500
Disability income benefits: Maximum $250/week; 104 weeks for partial disability, lifetime for total disability; must be disabled for at least seven days to qualify; unpaid housekeeper $100/week, maximum 52 weeks
Death benefits: Death within 180 days (or two years if continuously disabled prior to death); death of head of household $50,000, plus $1,000 to each dependent survivor after first; death of spouse/partner $25,000; death of dependant $5,000
Impairment benefits: N/A
Right to sue for pain and suffering? Yes. If injury is deemed “minor” under provincial legislation, maximum award is $7,818.87
Right to sue for economic loss in excess of no-fault benefits?
Yes
Administration: Private insurers
Sources:New Brunswick Standard Owner’s Policy N.B.P.F. No.1,
http://0101.nccdn.net/1_5/1c2/1a0/1a9/StandardOwnersPolicy.pdf (Effective October 1, 2010);Injury Regulation, NB Reg 2003-20,
www.canlii.org/en/nb/laws/regu/nb-reg-2003-20/106597/nb-reg-2003-20.html;Financial and Consumer Services Commission. Notice Re: Annual Indexation PDF,
http://0104.nccdn.net/1_5/156/05b/0a6/January-2017-Annual-Indexation-Notice.pdf; Financial and Consumer Services Commission: Automobile Insurance,
http://fcnb.ca/automobile-insurance.html
as of January 1, 2016
Quebec nwt pei yukonalberta nun
sask newf ont nb mbbc ns
as of January 1, 2017
New Brunswick

IBC Facts 2017 35
Mandatory minimum third-party liability:
$500,000 is available for any one accident
Direct compensation property damage required?
Yes
Medical payments: Up to $50,000/person; four-year time limit (Consumers have option to purchase additional coverage)
Funeral expense benefits: $2,500
Disability income benefits: Maximum $250/week; 104 weeks for partial disability; lifetime for total disability; must be disabled for at least seven days to qualify; unpaid housekeeper $100/week, maximum 52 weeks
Death benefits: Death within 180 days after accident (or two years if continuously disabled prior to death); death of head of household $25,000, plus $1,000 to each dependent survivor after first; death of spouse/partner $25,000; death of dependant $5,000
Impairment benefits: N/A
Right to sue for pain and suffering? Yes. If injury is deemed “minor” under provincial legislation, maximum award is $8,486
Right to sue for economic loss in excess of no-fault benefits?
Yes
Administration: Private insurers
Sources:Nova Scotia Standard Automobile Policy NSPF No.1, 2013,
www.novascotia.ca/finance/site-finance/media/finance/SPF1-64103-01_2013.pdf;Automobile Insurance Contract Mandatory Conditions Regulations,
www.novascotia.ca/just/regulations/regs/imandcon.htm; Office of the Superintendent of Insurance Bulletin: Minor Injury Cap,
http://www.novascotia.ca/finance/site-finance/media/finance/Cap_Bulletin-Jan_2017.pdf
as of January 1, 2016
Quebec nwt pei yukonalberta nun
sask newf ont nb mbbc ns
as of January 1, 2017
Nova Scotia

36 IBC Facts 2017
Mandatory minimum third-party liability:
$200,000 is available for any one accident; however, if a claim involving both bodily injury and property damage reaches this figure, payment for property damage will be capped at $10,000
Direct compensation property damage required?
Yes
Medical payments: Up to $50,000/person; four-year time limit
Funeral expense benefits: $2,500
Disability income benefits: Maximum $250/week; 104 weeks for partial disability; lifetime for total disability; must be disabled for at least seven days to qualify; unpaid housekeeper $100/week, maximum 52 weeks
Death benefits: Death within 180 days after accident (or two years if continuously disabled prior to death); death of head of household $50,000, plus $1,000 to each dependent survivor after first; death of spouse of head of household $25,000; death of dependant $5,000
Impairment benefits: N/A
Right to sue for pain and suffering? Yes. If injury is deemed “minor” under provincial regulation, maximum award is $7,545
Right to sue for economic loss in excess of no-fault benefits?
Yes
Administration: Private insurers
Sources:Insurance Act, RSPEI 1988, c I-4,
www.gov.pe.ca/law/statutes/pdf/i-04.pdf;Prince Edward Island Standard Automobile Policy S.P.F. No.1, for accidents occurring on or after October 1, 2014,
www.gov.pe.ca/photos/original/ELJ_SampleAuto.pdf;Prince Edward Island Standard Automobile Policy S.P.F. No.1, for accidents occurring on or after October 1, 2015,
www.gov.pe.ca/photos/original/JPS_SampleAuto.pdf;Bill 46, An Act to Amend the Insurance Act (No. 2) (Chapter 36),
www.assembly.pe.ca/bills/onebill.php?session=4&generalassembly=64&number=46;Office of Superintendent of Insurance Bulletin: Automobile Insurance Minor Injury Cap - Indexation,
http://www.gov.pe.ca/photos/original/MinInjCap2017.pdf;October 1, 2015, Automobile Insurance Reforms,
www.gov.pe.ca/photos/original/JPS_InsReform.pdf
Quebec nwt pei yukonalberta nun
sask newf ont nb mbbc ns
as of January 1, 2017
Prince Edward Island
IBC Facts 2017 37
Mandatory minimum third-party liability:
$200,000 is available for any one accident; however, if a claim involving both bodily injury and property damage reaches this figure, payment for property damage will be capped at $20,000
Direct compensation property damage required?
No
Medical payments: (Optional to buy) Up to $25,000/person; four-year time limit
Funeral expense benefits: (Optional to buy) $1,000
Disability income benefits: (Optional to buy) Maximum $140/week; 104 weeks for partial disability; lifetime for total disability; must be disabled for at least seven days to qualify; unpaid housekeeper $70/week, maximum 12 weeks
Death benefits: (Optional to buy) Death within 180 days (or two years if continuously disabled prior to death); death of head of household $10,000, plus $1,000 to each dependent survivor after first; death of spouse $10,000; death of dependant $2,000
Impairment benefits: N/A
Right to sue for pain and suffering? Yes. Awards are subject to deductible of $2,500
Right to sue for economic loss in excess of no-fault benefits?
Yes
Administration: Private insurers
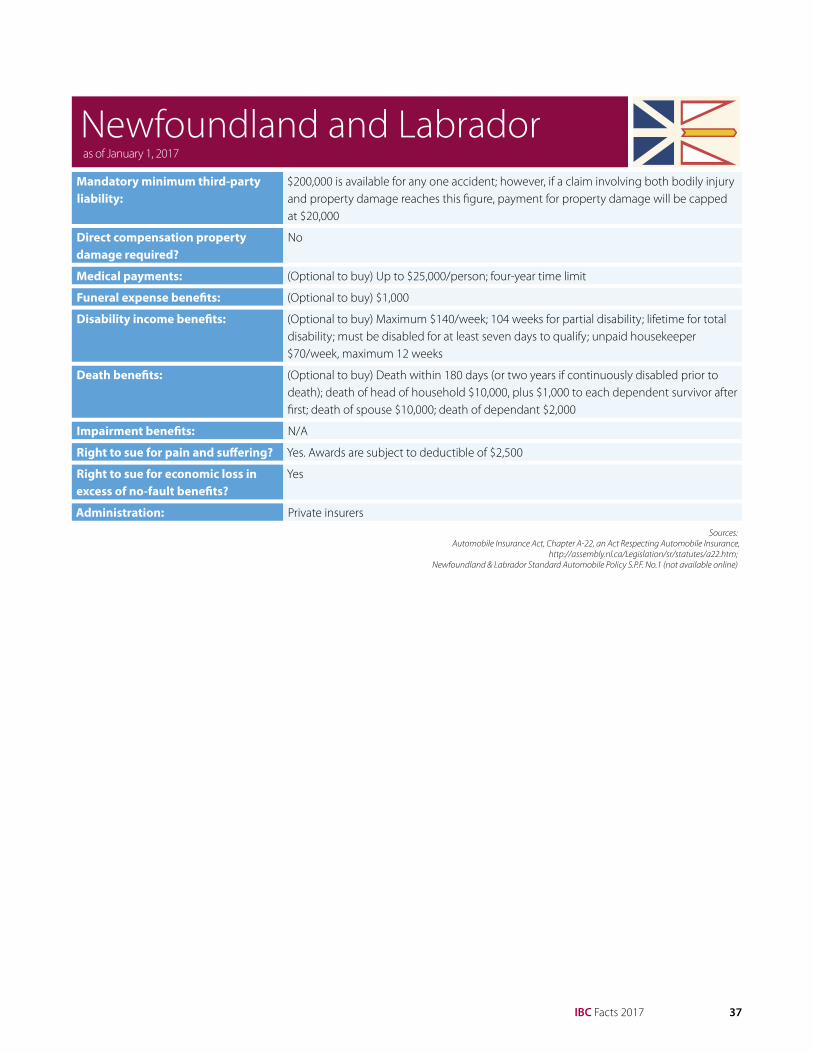
Sources:Automobile Insurance Act, Chapter A-22, an Act Respecting Automobile Insurance,
http://assembly.nl.ca/Legislation/sr/statutes/a22.htm;Newfoundland & Labrador Standard Automobile Policy S.P.F. No.1 (not available online)
Quebec nwt pei yukonalberta nun
sask newf ont nb mbbc ns
as of January 1, 2017
Newfoundland and Labrador

38 IBC Facts 2017
Mandatory minimum third-party liability:
$200,000 is available for any one accident; however, if a claim involving both bodily injury and property damage reaches this figure, payment for property damage will be capped at $10,000
Direct compensation property damage required?
No
Medical payments: Up to $10,000/person; two-year time limit
Funeral expense benefits: $2,000
Disability income benefits: 80% gross wages to maximum $300/week; 104 weeks for temporary or total disability; nothing is payable for the first seven days of disability; unpaid housekeeper $100/week, maximum 26 weeks
Death benefits: Death any time after accident; death of head of household $10,000, plus $2,000 to each dependent survivor other than the first, and 1% of total principal sum to each dependant/survivor after first, for 104 weeks; death of spouse of head of household $10,000; death of dependent relative, according to age, maximum $3,000
Impairment benefits: N/A
Right to sue for pain and suffering? Yes
Right to sue for economic loss in excess of no-fault benefits?
Yes
Administration: Private insurers
Sources:Insurance Act, O.I.C. 1988/090,
www.gov.yk.ca/legislation/regs/oic1988_090.pdf;Yukon Territories Standard Automobile Policy S.P.F. No.1 (not available online)
Quebec nwt pei yukonalberta nun
sask newf ont nb mbbc ns
as of January 1, 2017
Yukon

IBC Facts 2017 39
Mandatory minimum third-party liability:
$200,000 is available for any one accident; however, if a claim involving both bodily injury and property damage reaches this figure, payment for property damage will be capped at $10,000
Direct compensation property damage required?
No
Medical payments: Up to $25,000/person; four-year time limit
Funeral expense benefits: $1,000
Disability income benefits: 80% of gross weekly wages to maximum $140/week; 104 weeks for temporary disability; lifetime for total disability; nothing is payable for the first seven days of disability; unpaid housekeeper $100/week, maximum 12 weeks
Death benefits: Death within 180 days after accident (or two years if continuously disabled prior to death); death of head of household $10,000, plus $1,500 to single survivor or $2,500 to each survivor after first if more than one; death of spouse of head of household $10,000; death of dependant $2,000
Impairment benefits: N/A
Right to sue for pain and suffering? Yes
Right to sue for economic loss in excess of no-fault benefits?
Yes
Administration: Private insurers
Sources:Northwest Territories
Insurance Act, R.S.N.W.T. 1988, c.I-4, https://www.justice.gov.nt.ca/en/files/legislation/insurance/insurance.a.pdf?t1455034045286;
Northwest Territories Standard Automobile Policy S.P.F. No.1 (not available online)Nunavut
Insurance Act, R.S.N.W.T.1988, c.I-4,http://www.gov.nu.ca/sites/default/files/gnjustice2/justicedocuments/Consolidated%20Law/Current/634975585772928750-1316283194-consRSNWT1988cI-4.pdf;
Nunavut Territories Standard Automobile Policy S.P.F. No.1 (not available online)
as of January 1, 2017
Northwest Territories and NunavutQuebec nwt pei yukonalberta nun
sask newf ont nb mbbc ns
Quebec nwt pei yukonalberta nun
sask newf ont nb mbbc ns

40 IBC Facts 2017
Costs of claims for private passenger auto by type of coverage in $000, 1991 to 2015 Third-party
liability (includes DCPD where
applicable) Accident benefits Collision Comprehensive Other* Total1991 1,560,737 836,245 786,524 693,287 112,977 3,989,771 1992 1,704,172 953,985 775,413 617,102 105,832 4,156,504 1993 1,884,346 1,094,001 781,578 645,625 104,710 4,510,260 1994 1,844,546 1,404,122 777,597 655,119 110,267 4,791,652 1995 1,873,421 1,326,969 745,668 668,055 142,629 4,756,741 1996 2,042,668 1,299,208 741,631 670,471 161,114 4,915,092 1997 2,334,542 981,828 714,058 542,327 205,174 4,777,929 1998 2,601,141 1,132,328 735,814 578,644 251,870 5,299,796 1999 3,050,302 1,365,574 829,869 537,762 282,720 6,066,227 2000 3,321,590 1,615,065 964,951 579,363 333,714 6,814,682 2001 3,490,779 1,748,033 978,222 588,400 379,719 7,185,153 2002 3,812,894 2,219,847 1,065,950 571,689 428,410 8,098,790 2003 3,608,421 2,084,008 1,010,302 542,331 420,837 7,665,899 2004 3,258,054 1,774,309 934,936 486,695 399,757 6,853,751 2005 3,249,501 1,963,807 989,146 534,151 409,870 7,146,476 2006 3,452,617 2,179,485 1,065,165 533,692 415,216 7,646,176 2007 3,804,933 2,499,385 1,246,512 637,617 442,290 8,630,738 2008 3,924,424 2,861,450 1,265,991 663,710 463,426 9,179,001 2009 4,284,666 3,964,697 1,208,918 664,655 482,248 10,605,184 2010 4,340,868 3,984,641 1,158,894 749,435 462,395 10,696,232 2011 4,184,042 2,329,416 1,236,996 643,629 458,496 8,852,579 2012 4,302,058 2,366,622 1,239,735 788,029 429,089 9,125,532 2013 4,636,671 2,540,812 1,384,561 803,321 487,161 9,852,526 2014 4,842,796 2,663,041 1,491,165 855,556 531,562 10,384,119 2015 5,184,902 2,853,114 1,595,013 891,731 574,937 11,099,697
Sources: GISA Automobile Insurance Experience ExhibitsFigures may not add up to 100% as a result of rounding
*Includes uninsured auto, underinsured motorist, all perils and specified perils
Premiums and claimsPrivate insurers wrote insurance policies totalling $21.6 billion in net written premiums for auto insurance in 2016.
Automobile insurance premiums, like all insurance premiums, are determined based on risk. Insurers estimate how likely it is that a customer – and a group of customers with the same set of circumstances – will make a claim, and how much those claims will likely cost in a given year. A number of factors help to determine car insurance premiums. These include where a customer lives, the type of vehicle the customer drives, how the vehicle is used, and the customer’s driving record and driver profile. (A driver profile includes the claims history of a group of customers of the same age, for example.)
For a complete breakdown of how each dollar collected by insurers is spent, see Insurance Dollar on page 8.
In 2016, Canadian private P&C insurers paid out $15.5 billion in net claims incurred to policyholders for all types of auto insurance coverage: third-party liability, accident benefits, collision and comprehensive, and other coverages. Third-party liability claims payouts accounted for 43.3% of all net claims incurred. The vast majority of claims – 84.8% – were for incidents involving private passenger vehicles.
A note about terminology: The following three tables show claims costs by accident year, which is how much insurers paid out for all claims that occurred in that year (although in some instances claims may be paid in future years).
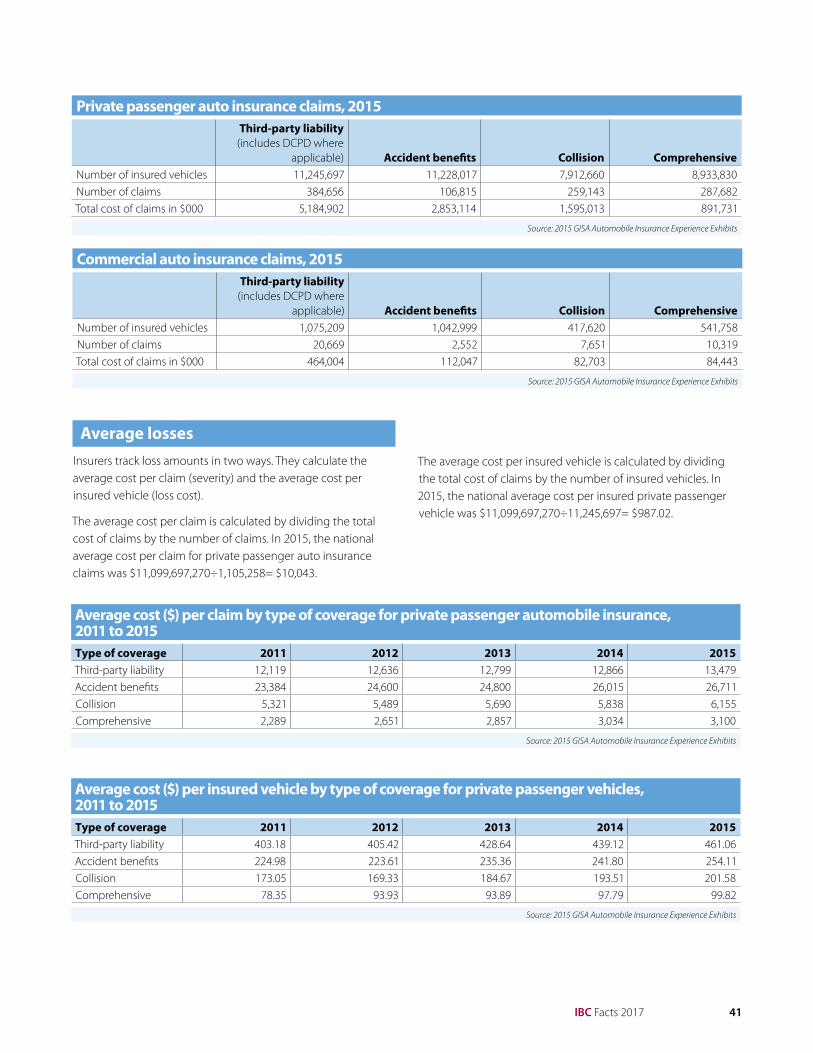
IBC Facts 2017 41
Private passenger auto insurance claims, 2015Third-party liability (includes DCPD where
applicable) Accident benefits Collision ComprehensiveNumber of insured vehicles 11,245,697 11,228,017 7,912,660 8,933,830Number of claims 384,656 106,815 259,143 287,682Total cost of claims in $000 5,184,902 2,853,114 1,595,013 891,731
Source: 2015 GISA Automobile Insurance Experience Exhibits
Commercial auto insurance claims, 2015Third-party liability (includes DCPD where
applicable) Accident benefits Collision ComprehensiveNumber of insured vehicles 1,075,209 1,042,999 417,620 541,758Number of claims 20,669 2,552 7,651 10,319Total cost of claims in $000 464,004 112,047 82,703 84,443
Source: 2015 GISA Automobile Insurance Experience Exhibits
Average lossesInsurers track loss amounts in two ways. They calculate the average cost per claim (severity) and the average cost per insured vehicle (loss cost).
The average cost per claim is calculated by dividing the total cost of claims by the number of claims. In 2015, the national average cost per claim for private passenger auto insurance claims was $11,099,697,270÷1,105,258= $10,043.
Average cost ($) per claim by type of coverage for private passenger automobile insurance, 2011 to 2015Type of coverage 2011 2012 2013 2014 2015Third-party liability 12,119 12,636 12,799 12,866 13,479Accident benefits 23,384 24,600 24,800 26,015 26,711Collision 5,321 5,489 5,690 5,838 6,155Comprehensive 2,289 2,651 2,857 3,034 3,100
Source: 2015 GISA Automobile Insurance Experience Exhibits
Average cost ($) per insured vehicle by type of coverage for private passenger vehicles, 2011 to 2015Type of coverage 2011 2012 2013 2014 2015Third-party liability 403.18 405.42 428.64 439.12 461.06Accident benefits 224.98 223.61 235.36 241.80 254.11Collision 173.05 169.33 184.67 193.51 201.58Comprehensive 78.35 93.93 93.89 97.79 99.82
Source: 2015 GISA Automobile Insurance Experience Exhibits
The average cost per insured vehicle is calculated by dividing the total cost of claims by the number of insured vehicles. In 2015, the national average cost per insured private passenger vehicle was $11,099,697,270÷11,245,697= $987.02.

42 IBC Facts 2017
Major issues - affordable, effective auto insurance
In Canada, the provincial governments regulate almost all aspects of auto insurance. The P&C insurance industry works closely with these governments to improve the auto insurance product and system for consumers.
On June 1, 2016, the Ontario government implemented much needed reforms for the province’s 9.7 million drivers. The reforms reduced premiums by an average of 8.5%. More than half of the savings come from changes to accident benefits, and the remainder come from changes to bodily injury coverage. Regardless of the savings, Ontario drivers still pay more for auto insurance than drivers anywhere else in Canada.
A key component of the reforms is more choice. The catastrophic impairment benefit offers $1 million for medical/rehabilitation and attendant care combined, regardless of fault. There is also an option to buy up to $2 million for this benefit; when combined with the optional medical/rehabilitation eligible benefit, the amount can be increased to $3 million.
Also in June 2016, the Expert Panel examining the mandate of the regulator of insurance, the Financial Services Commission of Ontario (FSCO), issued its final report after more than a year of study and stakeholder consultations that P&C insurers fully participated in.
The report makes 44 recommendations including one to replace FSCO with a new agency – the Financial Services Regulatory Authority – that will operate as an integrated financial services regulator, independent of the Ontario Public Service. According to IBC’s analysis, this is a critical first step to establishing an environment that will allow insurers to evolve and be more responsive to consumer needs.
David Marshall, former Workplace Safety and Insurance Board President & CEO, was appointed as an advisor on auto insurance to the Ontario Minister of Finance. His report identified additional opportunities to make premiums more affordable for Ontario consumers.
In Atlantic Canada, the highest premiums are in Newfoundland and Labrador, where the average written premium was $1,138 in January 2017. In April 2016, the provincial government reintroduced a 15% retail sales tax on P&C insurance policies issued or renewed on or after July 1, 2016. The industry successfully advocated for the tax not being applied to policies already in force.
The average premiums in the three other Atlantic provinces were around $800, the second lowest in Canada, after Quebec. Auto insurance in Nova Scotia and New Brunswick, however, has seen a deterioration of financial results. Their return on equity was about -6% in 2015. P&C insurers are examining the
factors contributing to the higher claims costs per vehicle, and are working with the governments to maintain a sustainable, competitive market.
In Alberta, a 2012 court decision weakened the minor injury cap. Lawyers and plaintiffs can now escape the cap by claiming difficult-to-prove conditions such as anxiety and temporomandibular joint disorder. Between 2011 and 2015, the cost of settling bodily injury claims rose 51%. In early 2016, the Alberta government started public consultations on auto insurance that P&C insurance industry representatives fully participated in. The government has said that it may bring forward any regulation changes by summer of 2017.
In British Columbia, Saskatchewan and Manitoba, the industry continues to advocate for private rather than public auto insurance. With such government-run insurance companies, there is limited choice for consumers; for example, the deductibles are fixed and there are no multi-vehicle discounts. And with a captive audience, public insurance companies have no incentive to develop new services.
In comparison, private insurers have created novel products, such as first-accident forgiveness, replacement cost coverage and roadside assistance. And while taxpayers subsidize the premiums in every province with public auto insurance, private insurance adds to communities by paying taxes and investing in the private sector through corporate shares, bonds and real estate.
In a world of rapidly changing technology that includes transportation network companies (of which UberX is the most well-known), some private insurers are offering insurance solutions to meet evolving consumer needs. Representatives of the insurance industry are working with provincial governments to develop the legislative and regulatory changes necessary to integrate the sharing economy into the auto insurance system.
The insurance industry is also exploring the implications of autonomous vehicles and the best way to protect consumers.
Major issues - crime, including fraudAuto insurance crime increases insurers’ claims costs, and this drives up premiums for consumers. By using a powerful combination of data analytics, education and the collaborative efforts of members and police services, IBC’s team made significant progress in the fight against insurance crime in 2016.
In April, for example, member companies and IBC supported police in laying charges against four individuals involved in a staged collision scheme in York region, north of Toronto. In November, they again partnered to help establish that assessment facilities in the Greater Toronto Area were involved in medical-service-provider identity fraud and associated false insurance billings.

IBC Facts 2017 43
IBC has several initiatives to combat insurance fraud, including a toll-free insurance TIPS Line that allows consumers to anonymously report fraud. In 2016, it received close to 600 reports of suspected insurance crime. The industry also works with Canadian National Insurance Crime Services (CANATICS), which analyzes pooled auto insurance data to identify potential fraud. And the Provincial Auto Theft Network (PATNET) brings together law enforcement agencies and the insurance industry to reduce auto theft and auto insurance fraud. In 2016, the industry launched PATNET in Ontario, Alberta, and Newfoundland and Labrador, bringing it closer to its goal of coast-to-coast participation.
Major issues - auto theft In 2016, IBC assisted the P&C insurance industry in recovering $28 million worth of stolen automobiles, an increase from the $23.6 million in 2015.
Since auto theft defies jurisdictional, political, geographical and administrative boundaries, the industry fights auto theft with multiple partners. Project Cyclone, for example, involved IBC, several members, police services in three regions and Canada Border Services Agency. The investigation recovered 60 stolen vehicles worth $3.4 million.
To inform consumers about vehicles that are potential targets, IBC publishes an annual list of the Top 10 most frequently stolen vehicles. In 2016, it also published a list of the Top 10 most frequently stolen vehicles for each of its regional offices for the first time. The regional lists determined that Ford trucks are most commonly stolen in the Western and Pacific region, while auto thieves favour high-end luxury SUVs in Ontario.
The 10 most frequently stolen vehicles in Canada, 20162007 FORD F-350 SUPER DUTY 4WD PICKUP
2006 FORD F-350 SUPER DUTY 4WD PICKUP
2005 FORD F-350 SUPER DUTY 4WD PICKUP
2004 FORD F-350 SUPER DUTY 4WD PICKUP
2003 FORD F-350 SUPER DUTY 4WD PICKUP
2015 TOYOTA 4RUNNER 4-DOOR 4WD SUV
2003 CADILLAC ESCALADE 4-DOOR 4WD SUV
2002 FORD F-350 SUPER DUTY 4WD PICKUP
2006 FORD F-250 SUPER DUTY 4WD PICKUP
2010 ACURA ZDX 4-DOOR AWD SUV
Major issues - road safetyToday’s number 1 road safety issue is driver distraction; in particular, texting while driving. A texting driver is 23 times more likely to be involved in a crash or near-crash event than a non-texting driver.
To encourage Canadians to put down their phones while behind the wheel, in January 2016 IBC launched its #LikeLife campaign by releasing a video about the dangers of distracted driving. The “Your life is worth more than a like” campaign was IBC’s most successful media campaign to date, obtaining more than 230,000 video views.
The P&C insurance industry has long advocated for safer roads, and IBC takes its SafetyMobile across Ontario. This acclaimed driving simulator takes drivers through four staged-collision scenarios, teaching them how to detect, avoid and report them. The SafetyMobile inspired IBC’s SafetyMobile App for smartphones, which raises awareness of staged collisions.
Major issues - adapting to technological innovation
In response to requests from the industry, the Canadian Council of Insurance Regulators agreed to look into a common regulatory approach for usage-based insurance (UBI) and greater flexibility so that consumers can better benefit from this technological innovation. The industry also asked the council to explore the viability of electronic proof of automobile insurance (EPAI) so that consumers have the option of showing proof of auto insurance on their smartphones.
In 2016, the council announced that EPAI will be permitted across Canada by the end of June 2017. It will be up to provincial regulators to implement it.
Industry representatives have also been advocating their provincial governments for greater technological innovation in the way that insurers are allowed to interact with their customers. In the U.S., consumers can file a claim, pay a premium, submit photos of damage and receive their insurance card online. On behalf of its members, IBC made a submission to the Government of Ontario’s Red Tape Challenge that contained recommendations for allowing insurers to communicate with their policyholders in the way their customers prefer.
Major issues - severe weather - hailClimate change and severe weather are affecting auto insurance. In particular, the increased incidence of hail has driven up premiums. In 2015 alone, hail caused around $500 million in insured losses. Most of the hail damage occurred in the Prairie provinces.

44 IBC Facts 2017
There are various types of policies:
• An all-perils policy provides coverage for a home and its contents from loss or damage from all perils except those specifically excluded. A peril is a chance event that is unexpected and accidental. Some perils are excluded from comprehensive policies – for example, earthquakes. Coverage for this peril may be purchased as a policy add-on. However, there are some excluded perils, such as overland flooding, for which home insurance may not be available. But availability of coverage for some perils is changing. Following recent large floods, insurers have seen a higher demand for coverage. In 2015, some insurers began offering coverage for overland flooding and, since then, others have entered the market.
• A broad-form policy provides coverage for a home from loss or damage from all perils except those specifically excluded, but only insures contents for perils that are specifically named in the policy.
• A standard, basic or named perils policy provides coverage for a home and its contents for perils specifically named in the policy.
• A no-frills policy provides very basic coverage for properties that do not meet an insurer’s normal underwriting standards.
Premiums and claimsIn 2016, private P&C insurers wrote $10.8 billion in net written premiums for personal property insurance and paid out $6.3 billion for net claims incurred.
As the second largest line of P&C policies after auto insurance, home or personal property insurance includes home, condominium, cottage, mobile home and tenant’s insurance. It covers the property, personal belongings and personal liability of the policyholder and the policyholder’s spouse or partner, children (with age limits) and dependants (with age and other limits).
As with all insurance premiums, insurers consider a number of risk factors to determine the price an individual pays for home insurance. For example, insurers look at the neighbourhood and the frequency and types of past claims in that area; the cost to replace a home’s contents and restore a home to its previous condition; the condition and age of the roof; the type of heating, electrical and plumbing systems; and details about any additional structures on the property.
Insurers analyze these risks to estimate how likely it is that a policyholder, or a group of people with the same set of circumstances, will make a claim and how much that claim will cost.
Types of coverageHome insurance generally covers a homeowner’s residential building, outbuildings, contents, additional living expenses (if an insured event damages the home so that it is uninhabitable during the repairs) and personal liability. Tenant’s insurance generally covers loss or damage to personal belongings, additional living expenses and personal liability.
Unlike auto insurance, home or personal property insurance is not mandatory by law. However, it provides coverage for an individual’s single largest investment – a home. In fact, most banks and mortgage holders require proof of insurance on property as security for the loan or mortgage.
Home insurance

IBC Facts 2017 45
Major issues - severe weatherClimate change has brought more rain and snow – and with it more flooding – from coast to coast to coast. Over the past 60 years, the weather has become wetter, with a 12% average increase in rainfall across the country, making water damage the primary cause of home insurance losses.
Governments across the country are starting to put plans in place to moderate human influence on the Earth’s climate. But a climate change strategy that effectively protects Canadians and our economy must include adaptation measures to address the effects that we are already seeing.
Adapting to climate change in Canada is not a future proposition – these changes are affecting our homes and businesses now. Although it is not possible to attribute any single event to climate change, the trends in the occurrence of severe weather events seem clear. To adapt to these changing risks, Canada needs to build a culture of disaster risk reduction that resonates with consumers and engages businesses, institutions and all levels of government.
IBC and P&C insurers are committed to working with governments in the areas of mitigation, adaptation and emergency management – all of which form the basis of a comprehensive climate change strategy. To address current and future climate risks, Canada needs to invest in community flood mitigation such as green infrastructure, revisit building code provisions and improve land-use planning. Homeowners also have a role to play in reducing their own risk, and IBC makes it a priority to share information with consumers about ways they can protect their property from severe weather.
Major issues - flood coverage Canada’s P&C insurance industry underwrites virtually all weather-related risks including wind, hail, ice, rainfall, snow and flooding. Severe weather-related risks tied to climate change are increasing in severity and frequency. The risk posed by water is a particular challenge for governments, the insurance industry and consumers. Governments and the P&C insurance industry need to work together to address these risks and better serve consumers.
Several P&C insurers now offer new products that cover residential overland flooding, with more insurers expected to follow. IBC is also working with the federal and provincial governments and organizations focused on flood-related issues – such as the Intact Centre on Climate Adaptation and the Institute for Catastrophic Loss Reduction – to advocate for a national strategy to address flood risk. Insurance itself is not sufficient; provincial governments can take specific actions to reduce risks for consumers.
A call to action
The insurance industry and provincial governments can reduce flood risks by taking the following steps:
• Educate and empower consumers to mitigate. Both the industry and governments have a role to play in educating citizens about the risks associated with floods and the measures they can take to better protect themselves. The insurance industry will continue to invest in consumer education to improve awareness of flood risks.
• Improve land-use planning. Zoning restrictions that discourage building on flood plains will reduce future losses. Provincial disaster assistance programs should exclude claims arising from properties located in these areas as a disincentive for irresponsible real estate development policies.
• Make targeted infrastructure investments. Infrastructure spending should be directed to include projects that increase resiliency to flooding, including repairing and upgrading sewer and stormwater systems, and creating new flood defences.
• Improve building codes. Add resiliency as a building code objective to help ensure that homes are better prepared to withstand weather extremes.
• Share data. Provincial and municipal governments can provide insurance companies with access to up-to-date infrastructure investments they have made, to help insurers better measure risk and appropriately price flood insurance.
• Preserve and restore wetlands. Wetland preservation and restoration can help protect communities from the destructive effects of floods. Securing properties and compensating landowners for wetland restoration are more cost effective than investing in traditional, hard infrastructure. Such initiatives would also complement the objectives of any infrastructure program.

46 IBC Facts 2017
Major issues - earthquakesIn Canada, there are 4,000 recorded earthquakes each year. An earthquake is a peril that is not normally included in a home insurance policy. Earthquake coverage may be purchased separately as an add-on, and it is usually subject to a higher deductible than coverage for other perils. Purchasing earthquake insurance should be a key element of earthquake preparedness plans for residents of Canada’s earthquake-prone areas.
IBC and the P&C insurance industry continue to take a leadership approach in furthering the dialogue on Canada’s earthquake risk in both of Canada’s active seismic zones.
In 2016, IBC partnered with the province of British Columbia and 34 of its municipalities to bring the ShakeZone earthquake simulator to local emergency preparedness events to raise awareness of this risk and to encourage residents to prepare for a potential quake. Also, IBC continues to sponsor the annual Great British Columbia ShakeOut earthquake drill. The British Columbia ShakeOut event, which launched in 2011, set a new record in 2016 with over 800,000 British Columbians taking part. In addition, IBC partnered with the province of British Columbia to develop the Master of Disaster learning resource, a first-of-its-kind education program designed to teach Grade 6 students how to build resiliency and what to do before, during and after an emergency.
In autumn 2016, IBC took the ShakeZone earthquake simulator on a tour along the Ottawa-Montreal-Quebec City corridor, the other major seismic zone in Canada. The tour included stops in six major cities in Quebec and a stop in Ottawa. In 2013, IBC helped launch the Great Quebec ShakeOut and has been a primary sponsor of the earthquake drill event in Quebec for the last four years. IBC and P&C insurers have led these and other initiatives with the goal of increasing consumer and government awareness of the risk of an earthquake in Quebec, and its potential impact on the economy. In Quebec, the population is generally not well informed about earthquake risk. An IBC survey found that 25% of policyholders in the province believed they were covered for an earthquake, when in fact only 3% actually were.
Through IBC, the P&C insurance industry also promotes a culture of preparedness by advocating with governments for increased earthquake readiness and consumer education about earthquake risk.

IBC Facts 2017 47
Smaller businesses without the benefit of risk managers depend more on the advice of insurance representatives to identify risks and help them choose the appropriate insurance to guard against potential losses.
Much like any other business, home-based businesses require coverage for possible business-related losses. For example, a home-based business owner may require commercial liability coverage since business risks may not be covered by the liability section of a home insurance policy.
Types of coverageThere are various types of business insurance policies:
• Commercial general liability covers a business and its employees for actions against them that result in bodily injury, property damage, personal injury, advertising injury, tenant’s legal liability, and other types of loss or damage to third parties.
• Commercial property insurance is designed to protect the physical assets of a business against loss or damage from a broad range of causes. Physical assets include: - Equipment - Inventory and supplies - Office furniture and fixtures - Computers and electronics - Personal property of employees while on-site - Customer property at your business site - Lighting systems - Windows - Outdoor signs
• Directors’ and officers’ insurance covers directors and officers of organizations for actual or alleged errors, errors or omissions, breach of duty, misleading statements and neglect in carrying out their responsibilities for the organization.
• Errors and omissions or professional liability insurance covers individuals and organizations who give professional advice (for example, consultants and financial planners). It protects them if clients claim damages as a result of inaccurate advice, misrepresentation, negligence, or violation of good faith and fair dealing.
• Business interruption insurance can cover against lost earnings during the period of a shutdown due to an event such as a fire or riot. It can cover the time the business needs to resume profitability. Some business owners buy additional insurance to cover extra operating expenses – for example, a new telephone system, extra advertising costs, rentals and moving costs – if the business must carry on at another location or outsource work during the shutdown.
Premiums and claimsIn 2016, private P&C insurers wrote $6.8 billion in net written premiums for commercial property insurance and paid out $5.6 billion in net claims incurred.
Also in 2016, private P&C insurers wrote $5.0 billion in net written premiums for commercial liability insurance and paid out $3.0 billion in net claims incurred.
Operating a business comes with an element of risk and unpredictability. Businesses, including non-profit organizations such as charities, buy insurance as part of an effective risk management plan. In larger enterprises, risk managers evaluate any perils to the business, implement programs to reduce and manage those dangers, and buy insurance to backstop remaining exposures.
Business insurance

48 IBC Facts 2017
Major issues - cyber liability Interest in cyber insurance is growing, and commercial cyber security coverage is one of the fastest growing insurance markets. However, the insurance industry needs better information on the nature of cyber incidents to make it easier to expand its coverage.
Insurers require information on the value of cyber attacks and on the effectiveness of security strategies designed to prevent or minimize loss. These data are not widely available for the majority of cyber events due to a lack of reporting.
While the federal government is implementing mandatory reporting for breach incidents in which personal information has been lost or stolen, P&C insurers and their customers would benefit from disclosure on a wider spectrum of cyber incidents. A secure, anonymous data repository would give insurers the information they need to assign value to loss experiences from cyber incidents.
Growing cyber threats necessitate a coordinated response from governments and stakeholders, including the insurance industry. Such a partnership could promote safe cyber practices and establish an anonymous data repository of cyber
incidents.
Major issues - cargo theft At the request of its members, IBC launched a national cargo theft reporting program in 2014 in partnership with P&C insurers, law enforcement agencies, the trucking industry, retailers and manufacturers. Since the program began, its accomplishments have multiplied.
• In 2016, it sent more than 1,100 alerts about truck, trailer, cargo and heavy equipment losses to members and industry partners, an almost 100% increase over the number of alerts sent in 2015.
• Sixty-nine cargo trailers were searched in 2016, up from 12 in 2015.
• Since 2014, recoveries have grown nearly 10-fold, with $25 million in stolen goods recovered in 2016.
Contributing to the program’s success is its growing data bank that allows IBC to alert insurers of emerging cargo theft patterns.
Major issues - preparing for natural catastrophes and climate change
The P&C insurance industry encourages businesses to have business-continuity and disaster-recovery plans. It also promotes mitigating risks by installing fire alarms, water sprinklers and impact-resistant windows, and having a backup power source.
Large natural disasters have a profoundly negative impact on business, as was seen in Fort McMurray, Alberta. The impact of the wildfires, though, was less on the organizations that had business insurance. The city’s businesses filed about 5,000 insurance claims, averaging $290,000 per claim.

IBC Facts 2017 49
3
Insurance organizations
50 IBC members55 IBC offices56 IBC services57 Superintendents of insurance59 Insurance-related organizations

50 IBC Facts 2017
IBC members IBC services
A Alberta Motor Association Insurance Company A B * Algoma Mutual Insurance Company B * Allianz Global Risks (US) Insurance Company A * Allstate Canada Group of Companies (ACG)
Allstate Insurance Company of Canada A B * Pafco Insurance Company A B * Pembridge Insurance Company A B *
L'Alpha, compagnie d'assurance inc. B * The American Road Insurance Company B Arch Insurance Canada Ltd. A Atradius Credit Insurance N.V. A
IBC member companies – private insurers and reinsurers – can subscribe to the following three IBC services:
IBC members and the IBC services to which they subscribe, as of April 15, 2017
AIssues ManagementThis includes policy development, communications and legal services, and services provided by regional offices.
BInvestigative ServicesThis includes crime ring investigations, auto theft and loss recovery services, information exchange, and communications and legal services, as they pertain to Investigative Services.
*Vehicle Information SuiteThis includes access to web-based business applications, the Canadian Loss Experience Automobile Rating (CLEAR) system, VINlink products, the publication “How Cars Measure Up” and other information related to automobile insurance in Canada.
IBC members

IBC Facts 2017 51
IBC members IBC services
Aviva Canada Inc. Aviva Insurance Company of Canada A B * Elite Insurance Company A B * Pilot Insurance Company A B * S & Y Insurance Company A B * Scottish & York Insurance Co. Limited A B * Traders General Insurance Company A B *
AXIS Reinsurance Company (Canadian Branch) A
B BCAA Insurance Corporation A B The Boiler Inspection and Insurance Company of Canada A B Brant Mutual Insurance Company B *
C CAA Insurance Company A B * Caisse Centrale de Réassurance A La Capitale Financial Group
La Capitale assurances générales inc. A B * Unica Insurance Incorporated A B * L'Unique assurances générales inc. A B *
Chubb Group of Insurance Companies Chubb Insurance Company of Canada A B * Federal Insurance Company of Canada A B * Mitsui Sumitomo Insurance Company Limited A B *
Continental Casualty Company A B * The Co-operators Group Limited
Co-operators General Insurance Company B * COSECO Insurance Company B * The Sovereign General Insurance Company B * CUMIS General Insurance Company B *
CorePointe Insurance Company B
D Desjardins General Insurance Group Inc.
Certas Direct Insurance Company A B * Certas Home and Auto Insurance Company A B * Desjardins assurances générales inc. A B * State Farm Fire & Casualty Company A B State Farm Mutual Automobile Insurance Company A B * The Personal Insurance Company A B *
E Ecclesiastical Insurance Office PLC A B Echelon Insurance A *

52 IBC Facts 2017
IBC members IBC services
Economical Economical Mutual Insurance Company A B * Federation Insurance Company of Canada A B * The Missisquoi Insurance Company A B * Perth Insurance Company A B * Waterloo Insurance Company A B *
Electric Insurance Company A Euler Hermes American Credit Indemnity Company A Everest Insurance Company of Canada A Everest Reinsurance Company A
F Fundy Mutual Fire Insurance Company B
G General Reinsurance Corporation A Gore Mutual Insurance Company A B * Groupe Ledor Inc. Mutuelle d’assurance A Le Groupe Estrie sur Richelieu, compagnie d'assurance * The Guarantee Company of North America A B *
H Hartford Fire Insurance Company A B * Heartland Farm Mutual Inc. A B * HDI Global SE Canada Branch A Howick Mutual Insurance Company B *
I Industrielle Alliance, Assurance auto et habitation inc. A B * Intact Financial Corporation
Belair Insurance Company Inc. A B * Canadian Direct Insurance Incorporated B * Intact Insurance Company A B * JEVCO Insurance Company A B * Metro General Insurance Corporation Ltd. A *The Nordic Insurance Company of Canada A B * Novex Insurance Company A B * Trafalgar Insurance Company of Canada A B *
International Insurance Company of Hannover PLC A Ironshore Insurance Ltd. (Canada Branch) A
L Lawyers' Professional Indemnity Company A Liberty Mutual Insurance Company A B *

IBC Facts 2017 53
IBC members IBC services
M Motors Insurance Corporation B * Munich Re Group
Munich Reinsurance Company of Canada A Temple Insurance Company A
Munich Reinsurance America, Inc. A B The Mutual Fire Insurance Company of British Columbia A
NNational Bank Insurance (InnovAssur, Assurances générales inc.) A B * Northbridge Financial Corporation
Federated Insurance Company of Canada A B * Northbridge Commercial Insurance Corporation A B * Northbridge General Insurance Corporation A B * Northbridge Personal Insurance Corporation A B * Tokio Marine & Nichido Fire Insurance Co., Ltd. A B * Zenith Insurance Company A B *
North Kent Mutual Fire Insurance B *
O Odyssey America Reinsurance Corporation (Canadian Branch) A Old Republic Insurance Company of Canada A B Omega General Insurance Company A
P Partner Reinsurance Company of the U.S. A B Peace Hills General Insurance Company A B * Portage la Prairie Mutual Insurance Company B * Protective Insurance Company A
R RBC General Insurance Company A B * RSA
Ascentus Insurance Ltd. A B * Canadian Northern Shield Insurance Company A B * Québec Assurance Company A B *Royal & Sun Alliance Insurance Company of Canada A B * Unifund Assurance Company A B *L'Union Canadienne, compagnie d'assurances A B * Western Assurance Company A B *

54 IBC Facts 2017
IBC members IBC services
S SCOR Canada Reinsurance Company A * Sentry Insurance, A Mutual Company A Sirius America Insurance Company A SSQ, Société d'assurances générales inc. A B * Starr Insurance and Reinsurance Limited A Swiss Re
Swiss Reinsurance Company Ltd., Canadian Branch A B Westport Insurance Corporation A B
T TD Insurance
Primmum Insurance Company A B * Security National Insurance Company A B * TD General Insurance Company A B * TD Home and Auto Insurance Company A B *
Toa Reinsurance Company of America (Canada Branch) A Travelers Canada
Travelers Insurance Company of Canada A B * Trillium Mutual Insurance B * Trisura Guarantee Insurance Company A Triton Insurance Company A
W Westland Insurance Company Limited A The Wawanesa Mutual Insurance Company A B * Wynward Insurance Group B
X XL Specialty Insurance Company A B *
IBC Facts 2017 55
Head office
Don ForgeronPresident and CEO777 Bay Street, Suite 2400P.O. Box 121Toronto, Ontario M5G 2C8
Tel: 416-362-2031Fax: 416-361-5952
Regional offices
Ottawa Craig Stewart Vice-President, Federal Affairs8 York Street, Suite 200Ottawa, Ontario K1N 5S6
Tel: 613-236-5043Fax: 416-644-4961
Western and PacificWilliam AdamsVice-President, Western and Pacific10104-103 Avenue, Suite 2603Edmonton, Alberta T5J 0H8
Tel: 780-423-2212Fax: 780-423-4796
510 Burrard Street, Suite 901Vancouver, British Columbia V6C 3A8
Tel: 604-684-3635Fax: 604-684-6235
OntarioKim DonaldsonVice-President, Ontario777 Bay Street, Suite 2400P.O. Box 121Toronto, Ontario M5G 2C8
Tel: 416-362-2031Fax: 416-644-4961
QuébecJohanne LamanqueVice-President, Quebec800, rue du Square-Victoria, bureau 2410C.P. 336, succ. Tour de la Bourse Montréal, Québec H4Z 0A2
Tel: 514-288-1563Fax: 514-288-0753
AtlanticAmanda DeanVice-President, Atlantic1969 Upper Water Street, Suite 1706Purdy’s Wharf, Tower IIHalifax, Nova Scotia B3J 3R7
Tel: 902-429-2730Fax: 902-420-0157
IBC offices

56 IBC Facts 2017
Investigative Services
British Columbia34A-2755 Lougheed Highway, Suite 571Port Coquitlam, British Columbia V3B 5Y9
Tel: 604-944-2431Fax: 604-944-1326
Prairies370, 5222-130 Avenue S.E., Suite 400Calgary, Alberta T2Z 0G4
Tel: 403-258-3677Fax: 403-255-9054
Ontario365 Evans Avenue, Suite 501Etobicoke, Ontario M8Z 1K2
Tel: 416-252-3441Fax: 416-252-6940
Québec2000 Peel Street, bureau 530Montréal, Québec H3A 2W5
Tel: 514-933-8953Fax: 514-933-7814
Atlantic1969 Upper Water Street, Suite 1706Purdy’s Wharf, Tower IIHalifax, Nova Scotia B3J 3R7
Tel: 902-429-2730Fax: 902-422-5151
Consumer Information Centres
British Columbia, Saskatchewan and Manitoba 1-844-2ask-IBC (1-844-227-5422)
Alberta1-844-2ask-IBC (1-844-227-5422)
Ontario1-844-2ask-IBC (1-844-227-5422)
Quebec1-877-288-4321
Atlantic1-844-2ask-IBC (1-844-227-5422)
IBC services

IBC Facts 2017 57
CanadaJeremy RudinSuperintendentOffice of the Superintendent of Financial Institutions Canada255 Albert StreetOttawa, Ontario K1A 0H2Tel: 613-990-7788Fax: 613-990-5591www.osfi-bsif.gc.ca
British ColumbiaTara RichardsInterim CEOFinancial Institutions Commission of British Columbia555 West Hastings Street, Suite 2800P.O. Box 12116Vancouver, British Columbia V6B 4N6Tel: 604-660-3555Fax: 604-660-3365Email: [email protected]
AlbertaNilam JethaSuperintendent of InsuranceAlberta Treasury Board and FinanceFinancial Sector Regulation and Policy (FSRP)9515-107 Street, Room 402Terrace BuildingEdmonton, Alberta T5K 2C3Tel: 780-427-8322Fax: 780-420-0752www.finance.alberta.ca
SaskatchewanRoger SobotkiewiczSuperintendent of InsuranceFinancial Institutions DivisionFinancial and Consumer Affairs Authority1919 Saskatchewan Drive, Suite 601Regina, Saskatchewan S4P 4H2Tel: 306-787-6700Fax: 306-787-9006Email: [email protected]
ManitobaScott MooreDeputy Superintendent of Financial Institutions - InsuranceFinancial Institutions Regulation Branch207-400 St. Mary AvenueWinnipeg, Manitoba R3C 4K5Tel: 204-945-2542Fax: 204-948-2268Email: [email protected]://www.mbfinancialinstitutions.ca
OntarioBrian MillsChief Executive Officer and Superintendent of Financial ServicesFinancial Services Commission of OntarioNorth York City Centre5160 Yonge Street, 17th FloorP.O. Box 85Toronto, Ontario M2N 6L9Tel: 416-590-7000Fax: 416-590-7070Toll-free: 1-800-668-0128www.fsco.gov.on.ca
QuébecLouis Morisset President and Chief Executive Officer Autorité des marchés financiers 800, rue de Square Victoria, 22e étageC.P. 246, tour de la BourseMontréal, Québec H4Z 1G3Tel: 514-395-0337Fax: 514-873-3090Toll-free: 1-877-525-0337www.lautorite.qc.ca
Place de la Cité, tour Cominar 2640, boulevard Laurier, bureau 400Québec, Québec G1V 5C1Tel: 418-525-0337Fax: 418-525-9512Email: [email protected] www.lautorite.qc.ca
Superintendents of insurance as of January 1, 2017

58 IBC Facts 2017
New BrunswickAngela MazerolleSuperintendent and Director of InsuranceFinancial and Consumer Services CommissionInsurance Division225 King Street, Suite 200Fredericton, New Brunswick E3B 1E1Tel: 506-453-8959Email: [email protected]
Nova ScotiaWilliam NguActing Superintendent of Insurance Department of Finance and Treasury BoardFinancial Institutions Division1723 Hollis Street, 4th floorP.O. Box 2271Halifax, Nova Scotia B3J 3C8Tel: 902-424-2787Fax: 902-424-1298Email: [email protected]/finance
Prince Edward IslandRobert A. BradleySuperintendent of InsuranceDepartment of Justice and Public SafetyInsurance and Real Estate DivisionShaw Building, 4th Floor, South95 Rochford StreetP.O. Box 2000Charlottetown, Prince Edward Island C1A 7N8Tel: 902-368-6478Fax: 902-368-5283Email: [email protected]
Newfoundland and LabradorJohn O’BrienDirector of Financial Services Regulation DivisionSuperintendent of Insurance, Real Estate, Mortgage Brokers, Securities and Pre-Paid FuneralsDepartment of Service NLFinancial Services Regulation Division2nd Floor West Block, Confederation BuildingPrince Philip ParkwayP.O. Box 8700St. John’s, Newfoundland and Labrador A1B 4J6Tel: 709-729-4909Fax: 709-729-3205Email: [email protected]
YukonJonathan ParkerActing Superintendent Mailing address: P.O. Box 2703 C5Whitehorse, Yukon Y1A 2C6
Physical address: 307 Black StreetWhitehorse, Yukon Y1A 2N1Tel: 867-667-6927Fax: 867-667-3609Email: [email protected]
Northwest TerritoriesLouise LavoieSuperintendent of InsuranceTreasury Division, Department of Finance4922-48th StreetP.O. Box 1320YK Centre, 3rd FloorYellowknife, Northwest Territories X1A 2L9Tel: 867-767-9177Fax: 867-873-0325Email: [email protected]
NunavutDaniel YoungSuperintendent of InsuranceDepartment of FinanceP.O. Box 2260Iqaluit, Nunavut X0A 0H0Tel: 1-800-316-3324Fax: 867-975-5845Email: [email protected]/finance

IBC Facts 2017 59
ADR Institute of Canada, Inc.234 Eglinton Avenue East, Suite 405Toronto, Ontario M4P 1K5Tel: 416-487-4733Toll-free: 1-877-475-4353Email: [email protected]
Appraisal Institute of Canada200 Catherine Street, Suite 403Ottawa, Ontario K2P 2K9Tel: 613-234-6533Toll-free: 1-888-551-5521Email: [email protected]
Canadian Association of Direct Relationship Insurers250 Consumers Road, Suite 301Toronto, Ontario M2J 4V6Tel: 416-773-0101Email: [email protected]
Canadian Association of Financial Institutions in Insurance21 St. Clair Avenue East, Suite 802Toronto, Ontario M4T 1L9Tel: 416-494-9224Email: [email protected]
Canadian Association of Fire Investigators310-1390 Prince of Wales DriveOttawa, Ontario K2C 3N6Tel: 613-228-1934Email: [email protected]
Canadian Association of Insurance Womenwww.caiw-acfa.com
Canadian Association of Mutual Insurance Companies311 McArthur Avenue, Suite 205Ottawa, Ontario K1L 6P1Tel: 613-789-6851www.camic.ca
Canadian Board of Marine Underwriters2233 Argentia Road, Suite 100Mississauga, Ontario L5N 2X7Tel: 905-826-4768Email: [email protected]
Canadian Boiler and Machinery Underwriters’ Associationwww.cbmua.org
Insurance-related organizations

60 IBC Facts 2017
Canadian Council of Insurance RegulatorsCCIR Secretariat5160 Yonge StreetBox 85Toronto, Ontario M2N 6L9Tel: 416-590- 8479Email: [email protected]
Canadian Fire Safety Association2800 14th Avenue, Suite 210Markham, Ontario L3R 0E4Tel: 416-492-9417Email: [email protected]
Canadian Independent Adjusters’ AssociationCentennial Centre5401 Eglinton Avenue West, Suite 100Toronto, Ontario M9C 5K6Tel: 416-621-6222Toll-free: 1-877-255-5589Email: [email protected]
Canadian Institute of Actuaries360 Albert Street, Suite 1740Ottawa, Ontario K1R 7X7Tel: 613-236-8196Email: [email protected]
Canadian Insurance Accountants Associationc/o Base Consulting and Management Inc. 250 Consumers Road, Suite 301Markham, Ontario M2J 2V6Tel: 416-494-1440Email: [email protected]
Canadian Insurance Claims Managers Associationc/o Insurance Bureau of Canada777 Bay Street, Suite 2400P.O. Box 121Toronto, Ontario M5G 2C8Tel: 416-362-2031www.cicma.ca
Canadian Life and Health Insurance Association Inc.www.clhia.ca
TorontoTD South Tower79 Wellington Street West, Suite 2300P.O. Box 99Toronto, Ontario M5K 1G8Tel: 416-777-2221
Ottawa46 Elgin Street, Suite 400Ottawa, Ontario K1P 5K6Tel: 613-230-0031
Montréal1001, boulevard de Maisonneuve ouest, bureau 630Montréal, Québec H3A 3C8Tel: 514-845-9004
Centre for Study of Insurance OperationsCSIO Help DeskTel: 416-360-1773Toll-free: 1-800-463-2746Email: [email protected]
Toronto110 Yonge Street, Suite 500Toronto, Ontario M5C 1T4
Montréal1155, boulevard Robert-Bourassa, bureau 1305Montréal, Québec H3B 3A7
Facility Association777 Bay Street, Suite 2400P.O. Box 121Toronto, Ontario M5G 2C8Tel: 416-863-1750Toll-free: 1-800-268-9572Email: [email protected]
Fire Prevention Canada3332 McCarthy RoadP.O. Box 37009Ottawa, Ontario K1V 0W0Tel: 613-749-3844Email: [email protected]

IBC Facts 2017 61
Fire Underwriters SurveyEmail: [email protected]
Atlantic Canada238 Brownlow Avenue, Suite 300Dartmouth, Nova Scotia B3B 1Y2Tel: 1-877-634-8564
Québec255, boulevard Crémazie Est, 2e étageMontréal, Québec H2M 1M2Tel: 1-800-263-5361
Ontario150 Commerce Valley Drive WestMarkham, Ontario L3T 7Z3Tel: 1-800-268-8080
Western Canada101, 3999 Henning DriveBurnaby, British Columbia V5C 6P9Tel: 1-800-665-5661
General Insurance OmbudService10 Milner Business Court, Suite 701Toronto, Ontario M1B 3C6Tel: 416-299-6931Toll-free: 1-877-225-0446www.giocanada.org
General Insurance Statistical Agency5160 Yonge Street, Box 85, 16th FloorToronto, Ontario M2N 6L9 Tel: 416-590-7526Email: [email protected]
Groupement des assureurs automobiles800, rue du Square-Victoria, bureau 2410C.P. 336, succ. Tour de la BourseMontréal, Québec H4Z 0A2Tel: 514-288-4321Toll-free: 1-877-288-4321Email: [email protected]
Institute for Catastrophic Loss Reduction20 Richmond Street East, Suite 210Toronto, Ontario M5C 2R9Tel: 416-364-8677Email: [email protected]
Insurance Brokers Association of Canada18 King Street East, Suite 1210Toronto, Ontario M5C 1C4Tel: 416-367-1831Email: [email protected]
Insurance Institute of Canada18 King Street East, 6th FloorToronto, Ontario M5C 1C4Tel: 416-362-8586Toll-free: 1-866-362-8585Email: [email protected]
Nuclear Insurance Association of Canada401 Bay Street, Suite 1600Toronto, Ontario M5H 2Y4Tel: 416-646-6232www.niac.biz
Ontario Risk and Insurance Management Society66 Wellington Street WestP.O. Box 1021Toronto, Ontario M5K 1P2ontario.rims.org
Property and Casualty Insurance Compensation Corporation 20 Richmond Street East, Suite 210Toronto, Ontario M5C 2R9Tel: 416-364-8677Email: [email protected]
Reinsurance Research Councilc/o Funnel Communications Inc.189 Queen Street East, Suite 1Toronto, Ontario M5A 1S2Tel: 416-968-0183Email: [email protected]
62 IBC Facts 2017
Surety Association of CanadaHead Office6299 Airport Road, Suite 709Mississauga, Ontario L4V 1N3Tel: 905-677-1353Email: [email protected]
British ColumbiaTel: 778-995-6585
AlbertaTel: 403-612-4070
QuebecTel: 514-389-9595
Traffic Injury Research Foundation171 Nepean Street, Suite 200Ottawa, Ontario K2P 0B4Tel: 613-238-5235Toll-free: 1-877-238-5235Email: [email protected]
Underwriters LaboratoriesCustomer service: 1-866-937-3852Email: [email protected]
Montreal area6505 Trans-Canada Highway, Suite 330St-Laurent, Quebec H4T 1S3Tel: 514-363-5941
Ottawa171 Nepean Street, Suite 400Ottawa, Ontario K2P 0B4Tel: 613-755-2729
Toronto7 Underwriters RoadToronto, Ontario M1R 3A9Tel: 416-757-3611
Vancouver area130-13775 Commerce ParkwayRichmond, British Columbia V6V 2V4Tel: 604-214-9555


ibc.ca@InsuranceBureau @BAC_Quebec @IBC_Atlantic @IBC_Ontario @IBC_West
416-362-2031