marine insurance casualty trends - iumicontents •iumi facts & figures committee •the global...
TRANSCRIPT

ASTRID SELTMANN
Vice chair, IUMI Facts & Figures CommitteeAnalyst/Actuary, The Nordic Association of Marine Insurers (Cefor)
Marine Insurance – Casualty trends

CONTENTS
• IUMI Facts & Figures Committee
• The Global Marine Insurance Market
• Vessel values & fleet trends with impact on casualty trends
• CASUALTY TRENDS
Main data sourcesPremiums: IUMI (Global Marine Insurance Report, September 2018)Fleet data: Lloyds List Intelligence, Clarksons Research, Vessel values: Nordic Marine Insurance Statistics (NoMIS)Casualties: Nordic Marine Insurance Statistics (NoMIS)
p. 21-24: Lloyds List Intelligence

CONTENTS – CASUALTY TRENDS
SHIPOWNERS’ LIABILITY
• Pool claims International Group of P&I Clubs
HULL CASUALTY TRENDS
• Total and major losses
• Trends by type of casualty
• Trends by age group & vessel type
• Cost driving factors
SPECIAL
• Detentions – Indicator of future casualties
• Fires on container vessels

IUMI FACTS & FIGURES COMMITTEE

IUMI FACTS & FIGURES – STATS & PROJECTS
Spring – newest edition March 2019
• Spring statistics & analysis for Hull, Cargo, Offshore energy
Autumn – next publication at IUMI conference 15-18 Sept. 2019 Toronto
• Report on World Merchant Fleet and World Trade (F&F chair)
• Global Marine Insurance Report & data downloads (Astrid Seltmann)
• Fact Sheets Hull, Energy, Cargo
• Cost inflation indices for Hull and Cargo business
• Update on major claims database project
(pilot run 2018, new data collection 2019 from 7 (cargo: 9) associations)
• New 2018: IUMI Stats Report – Market analysis based on conference
publications
Other projects
• Analyse new demands (fishing vessels, yachts, carriers & marine liability, …)
• Cooperation with other maritime forums such as IUMI @ IMO

THE GLOBAL MARINE INSURANCE MARKET

MARINE PREMIUM 2017BY LINE OF BUSINESS
Source: IUMI Global Marine Insurance Report 2018
Total estimate 2017: 28.5 USD billion / Change 2016 to 2017: +2%
NB: Exchange rate effects!
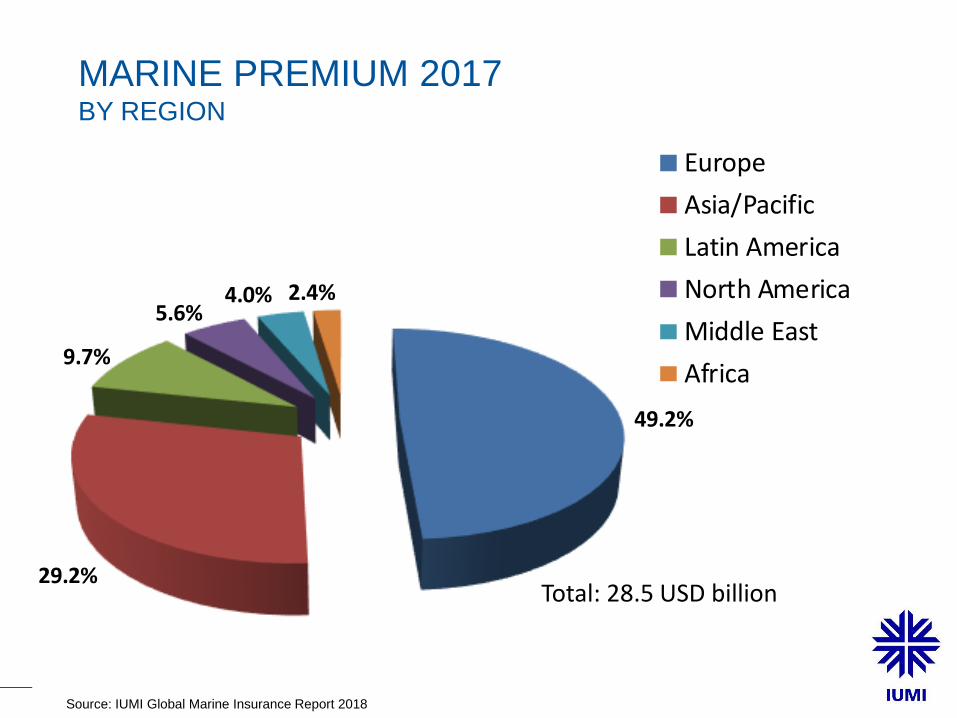
49.2%
29.2%
9.7%
5.6%4.0% 2.4%
2017Europe
Asia/Pacific
Latin America
North America
Middle East
Africa
MARINE PREMIUM 2017BY REGION
Total: 28.5 USD billion
Source: IUMI Global Marine Insurance Report 2018

62%
30%
6% 2%
UK
Nordic
Japan
US
Calls 2017:UK: 1.92 Nordic: 0.92Japan: 0.20US: 0.07
Total: 3.11 (USD billion)
P&I CLUBS INTERNATIONAL GROUPPROTECTION & INDEMNITY = SHIPOWNERS’ LIABILITY
GROSS CALLS (PREMIUM) 2017 – OPERATIONAL LOCATION
by country of registration
Source: IUMI Global Marine Insurance Report 2018

VESSEL VALUES
& WORLD FLEET
Foto: Astrid Seltmann
80%
90%
100%
110%
120%
130%
140%
20
05
20
06
20
07
20
08
20
09
20
10
20
11
20
12
20
13
20
14
20
15
20
16
20
17
20
18
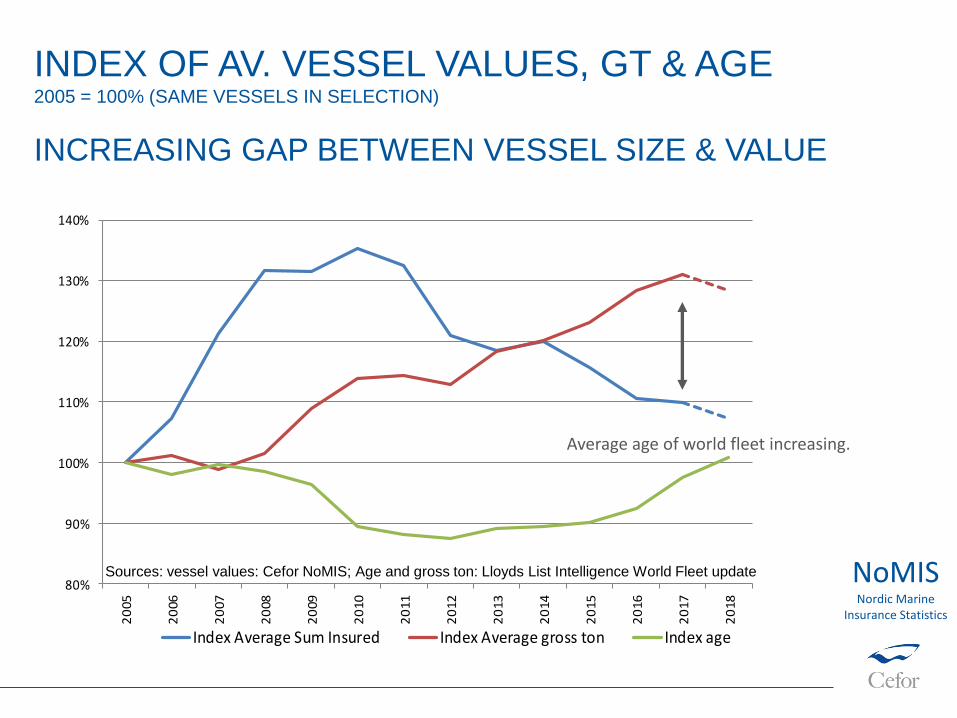
Index Average Sum Insured Index Average gross ton Index age
Sources: vessel values: Cefor NoMIS; Age and gross ton: Lloyds List Intelligence World Fleet update
Average age of world fleet increasing.
INDEX OF AV. VESSEL VALUES, GT & AGE2005 = 100% (SAME VESSELS IN SELECTION)
INCREASING GAP BETWEEN VESSEL SIZE & VALUE
NoMISNordic Marine
Insurance Statistics

0
500
1000
1500
2000
2500
3000
19
80
19
81
19
82
19
83
19
84
19
85
19
86
19
87
19
88
19
89
19
90
19
91
19
92
19
93
19
94
19
95
19
96
19
97
19
98
19
99
20
00
20
01
20
02
20
03
20
04
20
05
20
06
20
07
20
08
20
09
20
10
20
11
20
12
20
13
20
14
20
15
20
16
20
17
20
18
< 5000 gt >= 5000
NEWBUILDS WORLD FLEET –
LESS & LARGER VESSELSVESSELS LESS THAN AND ABOVE 5,000 GROSS TON
Source: Lloyds List Intelligence, World Fleet Update, as of January 2019; Graph: Cefor Annual Report 2018
Less newbuilds =>
Increasing fleet age.
Newbuilds larger in size.
NoMISNordic Marine
Insurance Statistics

ANNUAL CHANGE IN VESSEL VALUESCOMPARING INS. VALUE OF SAME VESSELS IN TWO CONSECUTIVE YEARS
NoMISNordic Marine
Insurance Statistics
6.2%
2.1%
8.8%
2.4%
-15.5%
-7.5%
-4.6%
-6.7% -6.1% -5.9%
-9.2%-7.6%
-6.0%
-3.1%
-20%
-15%
-10%
-5%
0%
5%
10%
15%
20
05
20
06
20
07
20
08
20
09
20
10
20
11
20
12
20
13
20
14
20
15
20
16
20
17
20
18
Source: Cefor Annual Report 2018
Strong reduction 2015/16 mainly connected
to bulk & supply/offshore market challenges.
Bulk signs of recovery in 2017.
2018: Normalisation
(some value reduction
due to aging of vessels).

-20.0%
-15.0%
-10.0%
-5.0%
0.0%
5.0%
10.0%
15.0%
20.0%
25.0%
30.0%
0.00
20.00
40.00
60.00
80.00
100.00
120.00
2005 2006 2007 2008 2009 2010 2011 2012 2013 2014 2015 2016 2017 2018
Change in average sum insured (%) Oil Price, USD (Brent), annual average
Source: Cefor Annual Report 2018
OFFSHORE VESSEL VALUES & OIL PRICE
NoMISNordic Marine
Insurance Statistics
Waiting for recovery in offshore market…

CASUALTY
TRENDS© Astrid SeltmannFoto: Astrid Seltmann

TYPES OF (INSURED) CASUALTIES
• Physical damage – vessels, offshore energy units, cargo
• Third party liability
‐ To object e.g. collision
‐ People (passengers, crew)
‐ Environmental damage (e.g. oil spill)
• Loss of income
• Terror etc.

**Int. Group Excess of Loss Reinsurance
LIABILITY: P&I POOL CLAIMS BY POLICY YEAR
Source: IG P&I Annual Review 2017/18
P&I is a complex business with high liabilities!
Modest claims impact in recent years, but: End of 2018 / 1st quarter 2019 number of severe casualties affecting P&I!
???

HULL CASUALTY TRENDS – FREQUENCY

0.0%
0.1%
0.2%
0.3%
0.4%
in % of Vessels in % of GT
TOTAL LOSSES 2000-2018 (LLI) AS % OF WORLD FLEET, VESSELS > 500 GT
Total losses:
Long-term positive trend.
Sources: Losses: Lloyds List Intelligence; Fleet numbers: Clarksons Research

0.00%
0.05%
0.10%
0.15%
0.20%
0.25%
0.30%
0.0%
5.0%
10.0%
15.0%
20.0%
25.0%
30.0%
35.0%
40.0%
19
96
19
97
19
98
19
99
20
00
20
01
20
02
20
03
20
04
20
05
20
06
20
07
20
08
20
09
20
10
20
11
20
12
20
13
20
14
20
15
20
16
20
17
20
18
partial claims (< 75%SI, left axis) TLO claims (>75% SI, right axis)
Source: Cefor Annual Report 2018 NoMISNordic Marine
Insurance Statistics
CLAIMS FREQUENCY* (NOMIS):
LONG-TERM POSITIVE TREND
Total loss frequency
Partial loss frequency
Pre-financial crisis peak
* = No. of claims divided by no. of insured vessels

HULL CASUALTY TRENDS – COST

0
20,000
40,000
60,000
80,000
100,000
120,000
19
96
19
97
19
98
19
99
20
00
20
01
20
02
20
03
20
04
20
05
20
06
20
07
20
08
20
09
20
10
20
11
20
12
20
13
20
14
20
15
20
16
20
17
20
18
Claim cost per vessel Claim cost per vessel excluding total losses
Source: Cefor Annual Report 2018
CLAIM COST PER VESSEL AS OF 31 DEC 18
STABILIZING AT LOW LEVEL
INCLUDING/EXCLUDING TOTAL LOSSES
Strong total loss impact
2003-08: Strong increasein repair cost per vessel.
Since 2009: repair cost stable;Volatility by major claims impact.
NoMISNordic Marine
Insurance Statistics
16-18: little total loss impact

0
20,000
40,000
60,000
80,000
100,000
120,000
19
96
19
97
19
98
19
99
20
00
20
01
20
02
20
03
20
04
20
05
20
06
20
07
20
08
20
09
20
10
20
11
20
12
20
13
20
14
20
15
20
16
20
17
20
18
20
19
Claim cost per vessel Claim cost per vessel excluding total losses
Source: Cefor NoMIS stats as of 31 March 2019
*
* 1st quarter figures only
CLAIM COST PER VESSEL AS OF 31 MAR 19
STRONG TOTAL LOSS IMPACT 1ST QUARTER 2019!INCLUDING/EXCLUDING TOTAL LOSSES
NoMISNordic Marine
Insurance Statistics
1st quarter 2019: renewed total loss impact

0
20,000
40,000
60,000
80,000
100,000
120,000
19
96
19
97
19
98
1999
2000
2001
2002
2003
2004
2005
20
06
20
07
20
08
20
09
20
10
20
11
20
12
2013
2014
2015
2016
2017
2018
> 50 MUSD
30-50 MUSD
10-30 MUSD
5-10 MUSD
1-5 MUSD
<= 1 MUSD
IBNR
2012/13/15:strong major claims impact
2004: first claim > USD 50 million
2014,16-18:little major claims impact
Claim bands:
CLAIM COST PER VESSEL AS OF DEC 2018:
3 YEARS WITHOUT CLAIMS > USD 30 MILLION
Source: Cefor Annual Report 2018
NoMISNordic Marine
Insurance Statistics

Claim bands:
CLAIM COST PER VESSEL AS OF 31 MARCH 19
MAJOR CLAIMS REVIVAL
NoMISNordic Marine
Insurance Statistics0
20,000
40,000
60,000
80,000
100,000
120,00019
96
1997
1998
1999
2000
2001
2002
2003
2004
2005
2006
2007
2008
2009
2010
2011
2012
2013
2014
2015
2016
2017
2018
2019
> 50 MUSD
30-50 MUSD
10-30 MUSD
5-10 MUSD
1-5 MUSD
<= 1 MUSD
IBNR
Source: Cefor NoMIS stats as of 31 March 2019
*
* 1st quarter figures only
1st quarter 2019:
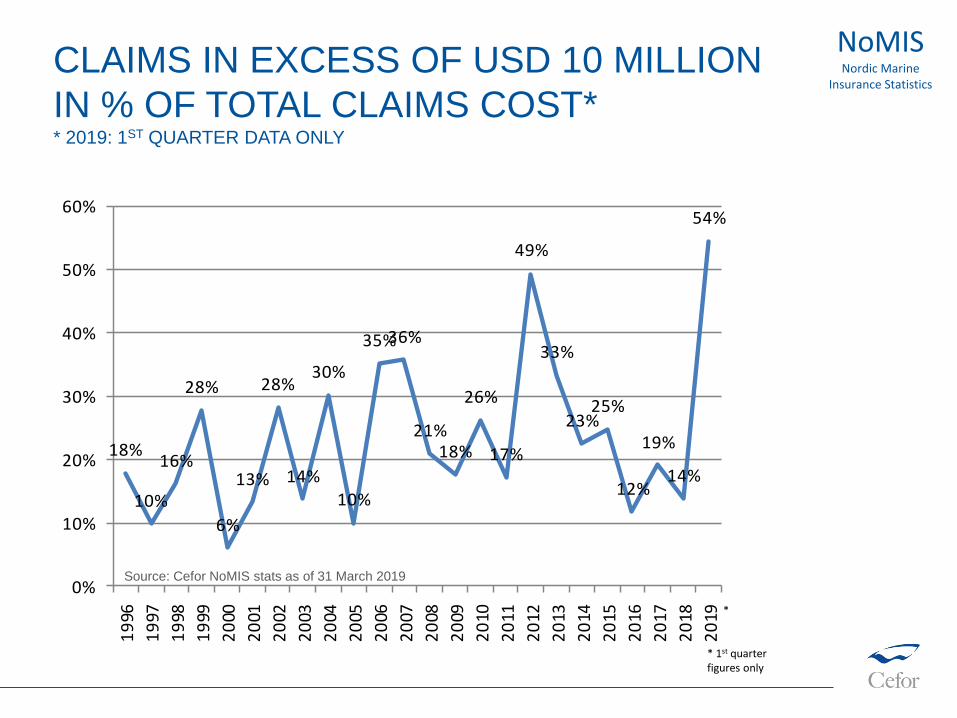
CLAIMS IN EXCESS OF USD 10 MILLION
IN % OF TOTAL CLAIMS COST** 2019: 1ST QUARTER DATA ONLY
NoMISNordic Marine
Insurance Statistics
18%
10%
16%
28%
6%
13%
28%
14%
30%
10%
35%36%
21%18%
26%
17%
49%
33%
23%25%
12%
19%
14%
54%
0%
10%
20%
30%
40%
50%
60%
19
96
19
97
19
98
19
99
20
00
20
01
20
02
20
03
20
04
20
05
20
06
20
07
20
08
20
09
20
10
20
11
20
12
20
13
20
14
20
15
20
16
20
17
20
18
20
19
Source: Cefor NoMIS stats as of 31 March 2019
*
* 1st quarter figures only

HULL CASUALTIES – BY TYPE OF CASUALTY

TOTAL LOSSES 2004 – 2018by cause, all vessel types, vessels > 500 GT
(Lloyds List Intelligence categories)
0% 10% 20% 30% 40% 50% 60%
Other
Machinery
Hull Damage
Collision/contact
Fire/explosion
Grounding
Weather
Frequency ( % of all total losses for the period)
2004 -2008
2009-2013
2014-2018
Source: LLI, total losses as reported by Lloyds List

41.2%
2.3%11.5%
20.1%
8.5%
1.9%
14.5%
2013-2017
Machinery
Fire/Explosion
Collision
Contact
Grounding
Heavy weather
Other / unknown
44.7%
1.9%9.2%
19.6%
7.5%
2.4%
14.7%
2018
Machinery
Fire/Explosion
Collision
Contact
Grounding
Heavy weather
Other / unknown
NoMISNordic Marine
Insurance Statistics
NUMBER OF CLAIMS – BY TYPE OF CASUALTY(CEFOR NOMIS CATEGORIES)
Total number of claims:
2013-2017: 17,208 2018: 3,096
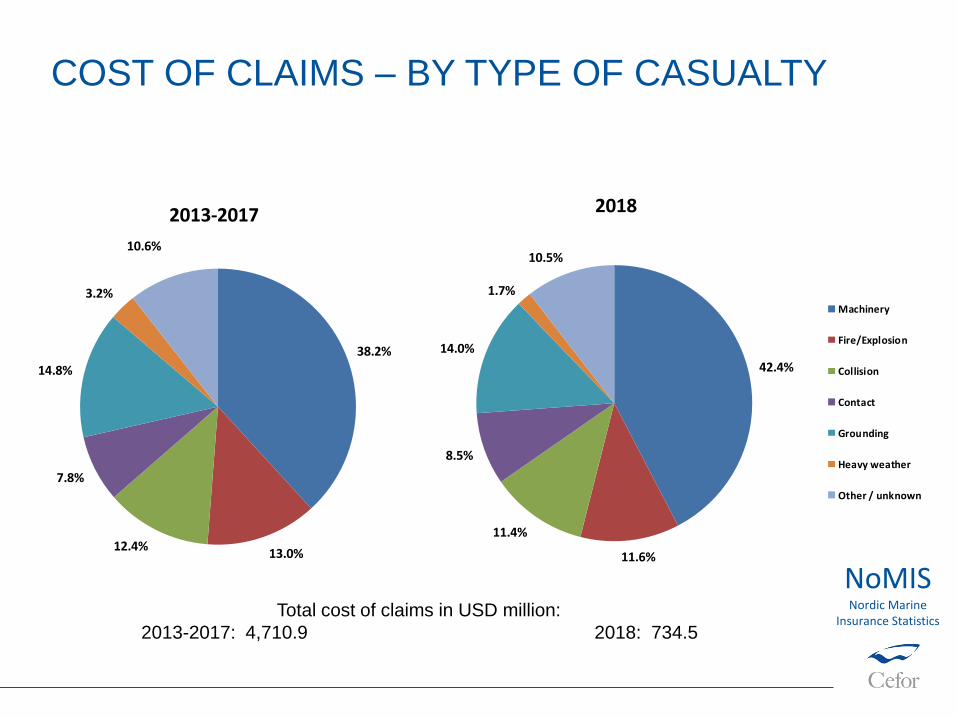
38.2%
13.0%12.4%
7.8%
14.8%
3.2%
10.6%
2013-2017
Machinery
Fire/Explosion
Collision
Contact
Grounding
Heavy weather
Other / unknown
42.4%
11.6%
11.4%
8.5%
14.0%
1.7%
10.5%
2018
Machinery
Fire/Explosion
Collision
Contact
Grounding
Heavy weather
Other / unknown
NoMISNordic Marine
Insurance Statistics
COST OF CLAIMS – BY TYPE OF CASUALTY
Total cost of claims in USD million:
2013-2017: 4,710.9 2018: 734.5

0.00%
0.20%
0.40%
0.60%
0.80%
1.00%
1.20%
1.40%
1.60%
1.80%
19
96
19
97
19
98
19
99
20
00
20
01
20
02
20
03
20
04
20
05
20
06
20
07
20
08
20
09
20
10
20
11
20
12
20
13
20
14
20
15
20
16
20
17
20
18
Machinery
Collision, Contact,Grounding
Other
Fire/Explosion
Heavy weather
FREQUENCY OF CLAIMS > USD 500,000BACK TO PRE-BOOM LEVEL
NoMISNordic Marine
Insurance Statistics
Source: Cefor Annual Report 2018

0
500
1,000
1,500
2,000
2,500
3,000
3,500
4,000
1996
1997
1998
1999
2000
2001
2002
2003
2004
2005
2006
2007
2008
2009
2010
2011
2012
2013
2014
2015
2016
2017
2018
Fire/Explosion
Collision, Contact,Grounding
Machinery
Heavy weather
Other
AVERAGE CLAIM COST AS OF DEC 2018STRONG VOLATILITY OF FIRE/EXPLOSION COST
USD 1,000
NoMISNordic Marine
Insurance Statistics

AVERAGE CLAIM COST AS OF MARCH 2019 1ST QUARTER 2019: NEW STRONG IMPACT ON COST BY SEVERE
FIRE/EXPLOSION AND NAVIGATIONAL-RELATED CASUALTIES
USD 1,000
0
500
1,000
1,500
2,000
2,500
3,000
3,500
4,000
19
96
19
97
19
98
19
99
20
00
20
01
20
02
20
03
20
04
20
05
20
06
20
07
20
08
20
09
20
10
20
11
20
12
20
13
20
14
20
15
20
16
20
17
20
18
20
19
Fire/Explosion
Collision, Contact,Grounding
Machinery
Heavy weather
Other
*
* 1st quarter figures only

CLAIMS TRENDS
BY AGE GROUP AND VESSEL TYPE
NoMISNordic Marine
Insurance Statistics
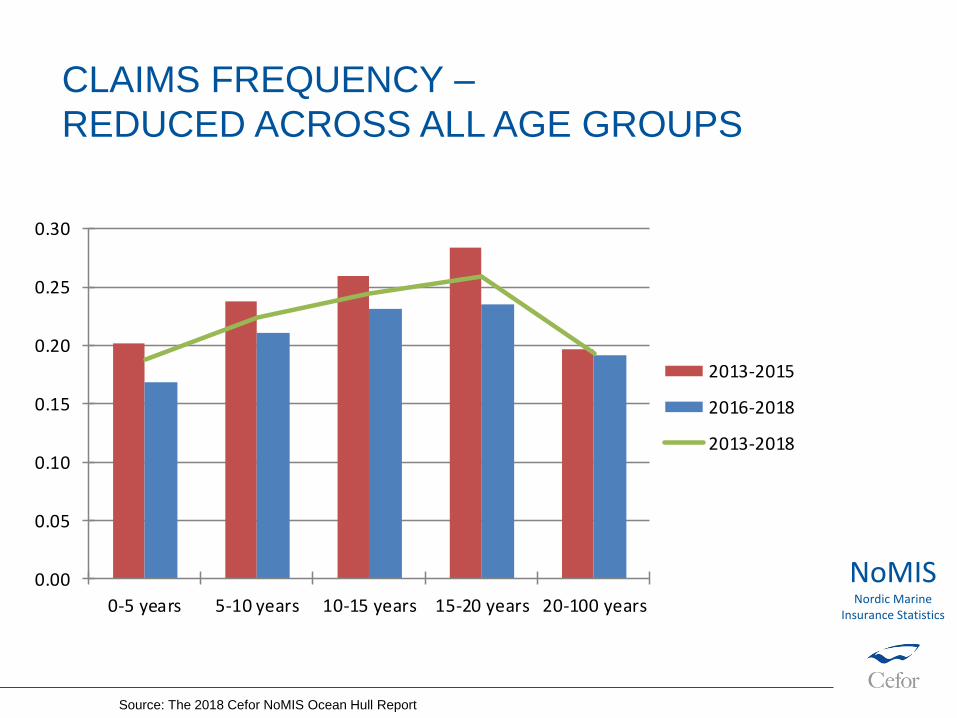
Source: The 2018 Cefor NoMIS Ocean Hull Report
CLAIMS FREQUENCY –
REDUCED ACROSS ALL AGE GROUPS
0.00
0.05
0.10
0.15
0.20
0.25
0.30
0-5 years 5-10 years 10-15 years 15-20 years 20-100 years
2013-2015
2016-2018
2013-2018

0
10,000
20,000
30,000
40,000
50,000
60,000
70,000
80,000
90,000
100,000
0-5 years 5-10 years 10-15 years 15-20 years 20-100 years
2013-2015
2016-2018
2013-2018
CLAIM COST PER VESSEL –
REDUCED ACROSS ALL AGE GROUPS
NoMISNordic Marine
Insurance Statistics
Source: The 2018 Cefor NoMIS Ocean Hull Report

0.00
0.05
0.10
0.15
0.20
0.25
0.30
0.35
Bulk Cargo Cont./Car/RoRo Passenger Tank Supply/Off
2013-2015
2016-2018
2013-2018
CLAIMS FREQUENCY, BY VESSEL TYPE
NoMISNordic Marine
Insurance Statistics
Source: The 2018 Cefor NoMIS Ocean Hull Report

0
20,000
40,000
60,000
80,000
100,000
120,000
140,000
160,000
180,000
Bulk Cargo Cont./Car/RoRoPassenger Tank Supply/Off
2013-2015
2016-2018
2013-2018
CLAIM COST PER VESSEL BY VESSEL TYPE
NoMISNordic Marine
Insurance Statistics
Source: The 2018 Cefor NoMIS Ocean Hull Report

Sources: Claim indices: Cefor NoMIS data as of 31.12.2018; Exchange rates: Norges Bank, Ship operation costs: Moore Stephen’s, Steel: CRU Steel Price Index
COST DRIVING FACTORS
NoMISNordic Marine
Insurance Statistics

CASUALTY TRENDS – FREQUENCY
• Total loss frequency
‐ Long-term positive trend
‐ Stabilizing around the probably minimum achievable level.
‐ Result of increased focus on safety measures?
• Overall claims frequency
‐ Long-term positive trend
‐ Low volatility since 2012, stabilizing around 23%.
• Many influencing factors
‐ Vessel utilization (type of trade, overcapacity, maintenance, lay-ups)
‐ Younger & bigger vessels
‐ Change in insurer deductibles (higher deductibles = less claims reported)
‐ Exchange rates
(strong dollar may ‘reduce’ claims cost -> less claims exceed insurer
deductibles)
‐ …

CASUALTY TRENDS – REPAIR COST
• Down after financial crisis peak
• Stabilization at modest level in recent years.
• Reduced last 3 years over all age groups and nearly all vessel types.
• Various drivers (correlation with certain parameters)
‐ Steel price
‐ USD exchange rate
(Strong USD may have kept cost down, as repairs often paid in other
currencies).
‐ Labour cost
‐ Maintenance routines
‐ …

MAJOR (= COSTLY) LOSSES
• More expensive single claims – increasing vessel sizes, more complex objects
• Increasing Volatility - strong impact in some years, little in others
• Strong influence on the cost also in years with few major losses – The 1%
most expensive claims account for minimum 30% of the claims cost in any year.
• Random occurrence – Difficult to estimate major claims impact for a specific year
• Fires on container vessels are a concern.
• 1st quarter 2019 casualties demonstrate all of the above
Terminology: ‘Serious’ casualties versus ‘major’ losses
IMO, LLI etc. define casualty ‘seriousness’ related to the nature of the event.
Insurers are impacted by ‘major’ claims = extraordinary costly casualties.
The majority of ‘serious’ casualties are no ‘major’ claims in terms of cost. For details on the comparison, check
https://cefor.no/globalassets/documents/statistics/nomis/2017/2017-half-year-claims-trends_250817.pdf

DETENTIONS – INDICATOR OF FUTURE CLAIMS

SCOPE/DESIGN OF DETENTION ANALYSIS
• ‘Vessels with detentions’ defined as:
Vessels with at least one detention in a 3-year period prior to the underwriting
year, i.e. prior to the year of the insurance coverage to which the analyzed
claims attach.
• Scope of analysis / Test groups:
‐ Vessels with detentions against vessels without detentions in same period.
‐ All vessels, and vessels < 10,000 gross ton
(Vessels < 10,000 gross ton are a more homogenous group. Smaller and older vessels are more
prone to total losses, thus this group is of special interest when analysing the correlation between
total losses and detentions)
• Casualty trends compared:
‐ Claims frequency
‐ Total loss frequency
‐ Claim cost per vessel
NoMISNordic Marine
Insurance Statistics

CLAIMS FREQUENCY – HIGHER FOR ALL
VESSELS WITH DETENTIONS
NoMISNordic Marine
Insurance Statistics
Source: Cefor Annual Report 2018
0%
5%
10%
15%
20%
25%
30%
35%
<= 5 years 5-10 years 10-15 years 15-20 years > 20 years
Vessels without detentions Vessels with detentions
Vessels all sizes Vessels < 10,000 gross ton
0%
5%
10%
15%
20%
25%
30%
35%
40%
45%
50%
<= 5 years 5-10 years 10-15 years 15-20 years > 20 years
Vessels without detentions Vessels with detentions

TOTAL LOSS FREQUENCY – HIGHER FOR
VESSELS WITH DETENTIONS EXCEPT YOUNGEST
NoMISNordic Marine
Insurance Statistics
Source: Cefor Annual Report 2018
0.00%
0.10%
0.20%
0.30%
0.40%
0.50%
0.60%
0.70%
<= 5 years 5-10 years 10-15 years 15-20 years > 20 years
Vessels without detentions Vessels with detentions
0.00%
0.10%
0.20%
0.30%
0.40%
0.50%
0.60%
0.70%
0.80%
0.90%
<= 5 years 5-10 years 10-15 years15-20 years > 20 years
Vessels without detentions Vessels with detentions
Vessels all sizes Vessels < 10,000 gross ton

CLAIM COST PER VESSEL (USD) – HIGHER FOR
VESSELS WITH DETENTIONS EXCEPT YOUNGEST
NoMISNordic Marine
Insurance Statistics
Source: Cefor Annual Report 2018
0
20,000
40,000
60,000
80,000
100,000
120,000
<= 5 years 5-10 years 10-15 years15-20 years > 20 years
Vessels without detentions Vessels with detentions
0
20,000
40,000
60,000
80,000
100,000
120,000
<= 5 years 5-10 years 10-15 years 15-20 years > 20 years
Vessels without detentions Vessels with detentions
Vessels all sizes Vessels < 10,000 gross ton

DETENTIONS –
INDICATOR OF FUTURE CASUALTIES
• Claims frequency
‐ was generally higher for vessels across all age groups.
• Total loss frequency
‐ Higher for vessels with detentions except the youngest vessels
‐ The gap in the total loss frequency widens with age
‐ Strong increase already from 5 years for vessels with detentions.
Vessels without detentions only show a substantial increase in the total
loss frequency after 15 (20) years.
‐ Vessels younger than 5 years become seldom total losses.
‐ When checking the reason for detentions (Equasis), these clearly
indicated a causal connection with the type of total loss incurred later
(i.e. not only an incidental statistical correlation).
• Claim cost
‐ Generally higher for vessels with detentions except the youngest.
NoMISNordic Marine
Insurance Statistics

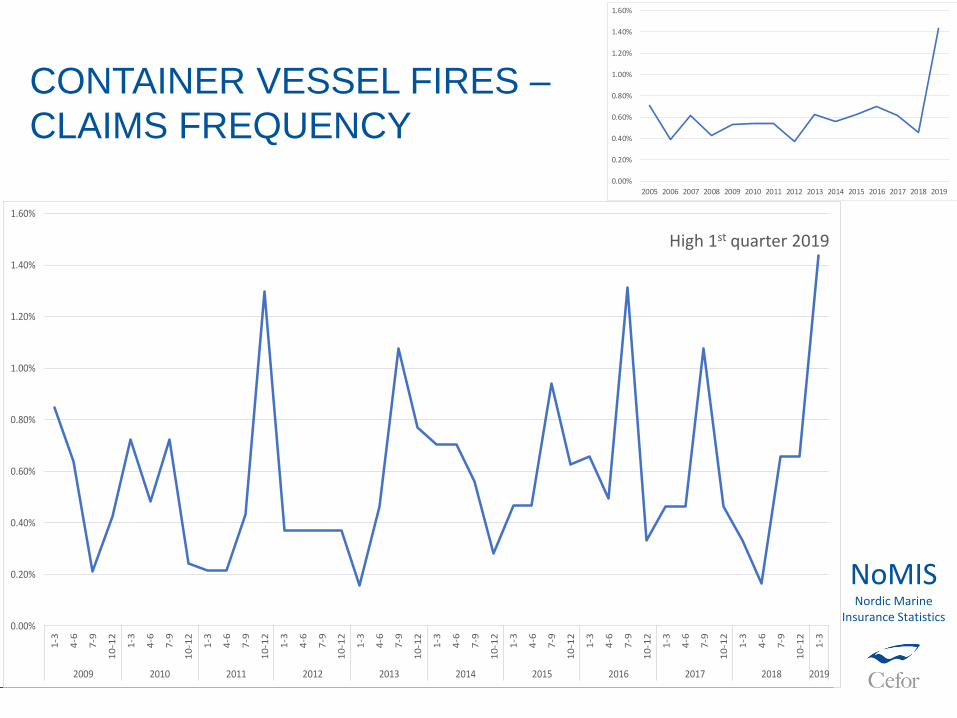
FIRES ON CONTAINER VESSELS

CONTAINER VESSEL FIRES –
NO. OF OCCURRENCES
IN NOMIS DATABASE
0
1
2
3
4
5
6
7
8
9
10
1-3
4-6
7-9
10
-12
1-3
4-6
7-9
10
-12
1-3
4-6
7-9
10
-12
1-3
4-6
7-9
10
-12
1-3
4-6
7-9
10
-12
1-3
4-6
7-9
10
-12
1-3
4-6
7-9
10
-12
1-3
4-6
7-9
10
-12
1-3
4-6
7-9
10
-12
1-3
4-6
7-9
10
-12
1-3
2009 2010 2011 2012 2013 2014 2015 2016 2017 2018 2019
High 1st quarter 2019
NoMISNordic Marine
Insurance Statistics
0
2
4
6
8
10
12
14
16
18
2005 2006 2007 2008 2009 2010 2011 2012 2013 2014 2015 2016 2017 2018 2019
vessels <= 100,000 gross ton vessels > 100,000 gross ton
Increasing Number of fires on large container vessels -> *
*
* 1Q
figures
only
0.00%
0.20%
0.40%
0.60%
0.80%
1.00%
1.20%
1.40%
1.60%
1-3
4-6
7-9
10
-12
1-3
4-6
7-9
10
-12
1-3
4-6
7-9
10
-12
1-3
4-6
7-9
10
-12
1-3
4-6
7-9
10
-12
1-3
4-6
7-9
10
-12
1-3
4-6
7-9
10
-12
1-3
4-6
7-9
10
-12
1-3
4-6
7-9
10
-12
1-3
4-6
7-9
10
-12
1-3
2009 2010 2011 2012 2013 2014 2015 2016 2017 2018 2019
0.00%
0.20%
0.40%
0.60%
0.80%
1.00%
1.20%
1.40%
1.60%
2005 2006 2007 2008 2009 2010 2011 2012 2013 2014 2015 2016 2017 2018 2019
CONTAINER VESSEL FIRES –
CLAIMS FREQUENCY
High 1st quarter 2019
NoMISNordic Marine
Insurance Statistics
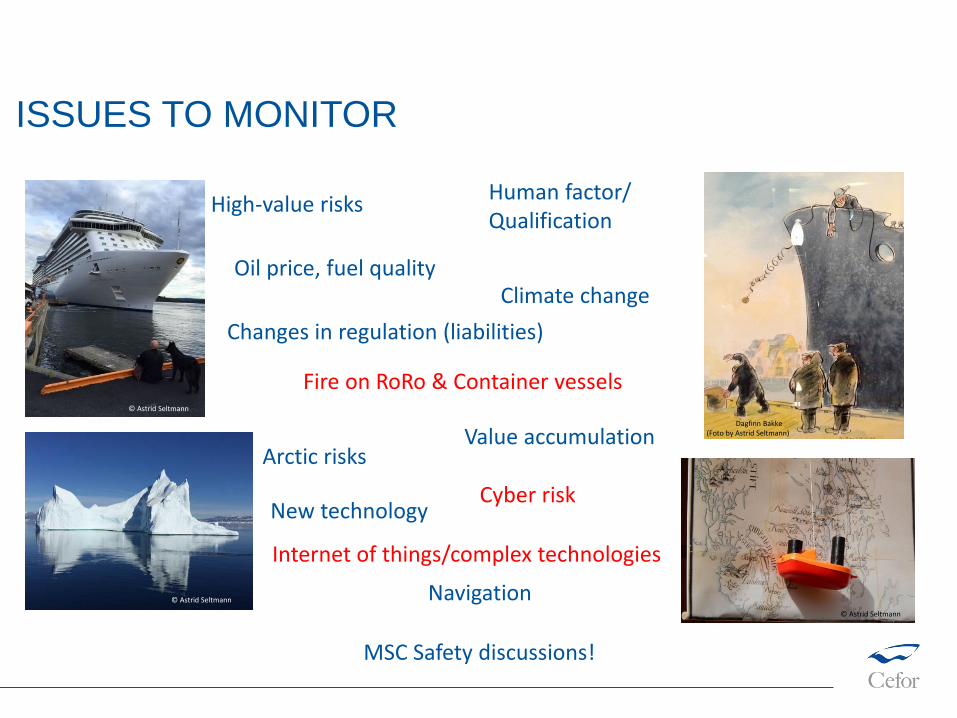
ISSUES TO MONITOR
High-value risks
Arctic risks
© Astrid Seltmann
© Astrid Seltmann
© Astrid Seltmann
Navigation
Oil price, fuel quality
New technology
Climate change
Changes in regulation (liabilities)
Human factor/Qualification
Dagfinn Bakke(Foto by Astrid Seltmann)Value accumulation
MSC Safety discussions!
Cyber risk
Fire on RoRo & Container vessels
Internet of things/complex technologies

NEW IUMI STATS REPORT 2018 (PUBLIC)
IUMI Statistics: https://iumi.com/statistics

OTHER IUMI REPORTS 2017/18
and:
• Cargo, Hull and Energy Fact Sheets
• Hull and Cargo inflation indices
• Data downloads
IUMI Statistics: https://iumi.com/statistics
Conference publications: Spring statistics on Cargo, Hull, Offshore energy:

+ half-year trend updates
Cefor NoMIS Statistics at http://cefor.no/Statistics/NOMIS/
CEFOR PUBLICATIONS 2019
NORDIC MARINE INSURANCE STATISTICS (NOMIS)
Published 11 April 2019
