facts at a glance 2016/17 - horticulture innovation australia · north quee vsla vd nq cetral quee...
TRANSCRIPT

Facts at a Glance
2016/17 for the Australian avocado industry
Key statistics of the Australian avocado industry
Data current at August 2017
Facts at a Glance for the Australian avocado industry—2016/17
www.avocado.org.au Compiled by Avocados Australia. Data source is Infocado unless otherwise stated.
This report has been produced as part of the strategic levy investment project Avocado industry market data capture and analysis (AV16006), part of the Hort Innovation Avocado Fund. It is funded by Hort Innovation, using the avocado research and development levy and contributions from the Australian Government. Hort Innovation is the grower-owned, not-for-profit research and development corporation for Australian horticulture.
Avocados Australia
Phone: (61) 07 3846 6566 or toll free 1300 303 971
Fax: (61) 07 3846 6577 or toll free 1300 303 972
General enquiries: [email protected]
Media enquiries: [email protected]
Online
www.avocado.org.au
www.facebook.com/AvocadosAustralia
https://twitter.com/AvocadosAu
Copyright © Hort Innovation 2017
Horti ulture I o atio Australia Li ited Hort I o atio akes o represe tatio s a d e pressl dis lai s all arra ties to the e te t per itted la a out the a ura-
, o plete ess, or urre of i for atio i Avocado industry market data cap-ture and analysis (AV16006). Relia e o a i for atio pro ided Hort I o atio is e tirel at our o risk. Hort I o atio is ot respo si le for, a d ill ot e lia le for, a loss, da age, lai , e pe se, ost i ludi g legal osts or other lia ilit arisi g i a a , i ludi g fro a Hort I o atio or other perso ’s eglige e or other ise fro our use or o -use of Avocado industry market data capture and analysis (AV16006), or fro relia e o i for atio o tai ed i the aterial or that Hort I o atio pro ides to ou a other ea s.
Report notes
Export values are calculated using Free on Board (FOB) price.
Gross Value of Production (GVP) for annual Australian avocado production is estimated by combining: local wholesale value of fresh volume; local wholesale value of processing volume; and export value (FOB) of exported volume.
Consumer market value is estimated using average retail prices (Coles and Woolworths online price data) multiplied by Australian avocado volumes (fresh and processed) that are supplied to the Australian consumer market. The consumer market is broadly defined as both retail and foodservice channels.
Farmgate value is estimated by multiplying the Australian avocado production volume by the local wholesale price minus estimated marketing/supply chain costs.
Data source is Infocado unless otherwise stated. Infocado is the data collection platform from which avocado supply and forecast volumes are reported. The production of these reports is currently funded through AV16006. See http://www.avocado.org.au/our-programs/supply-chain-data/infocado/ for more information.
Consumption is estimated using total supply volume divided by Australian population (based on ABS data .
Report version updated 09 March 2018.

Facts at a Glance for the Australian avocado industry—2016/17
www.avocado.org.au Compiled by Avocados Australia. Data source is Infocado unless otherwise stated.
Australian avocado production
Year Production
volume
(tonnes) Number of 5.5kg trays
Gross value of
production (GVP) (AUD
million)
Farmgate value
(AUD million)
Consumer market value of Australian
fruit sold domestically
(AUD million)
Export value (AUD
million)
2007/08 39,394 7,162,546 $ 127 $ 108 $ 326 $ 4.2
2008/09 46,446 8,444,728 $ 174 $ 152 $ 462 $ 6.0
2009/10 39,641 7,207,501 $ 182 $ 167 $ 426 $ 6.2
2010/11 49,612 9,020,281 $ 202 $ 180 $ 498 $ 7.3
2011/12 51,113 9,293,315 $ 178 $ 155 $ 461 $ 8.1
2012/13 54,877 9,977,567 $ 296 $ 276 $ 661 $ 8.1
2013/14 48,715 8,857,217 $ 313 $ 297 $ 668 $ 5.6
2014/15 57,595 10,471,887 $ 356 $ 331 $ 750 $ 6.4
2015/16 66,716 12,130,207 $ 438 $ 412 $ 899 $ 9.2
2016/17 65,992 11,998,467 $ 398 $ 374 $ 755 $ 12.5
Avocado production and value
Sources: Infocado, IHS Global Trade Atlas, and Avocados Australia analysis using Ausmarket Consultants data and Freshlogic assumptions
Australia produced almost 66,000 tonnes of avocados in 2016/17, which was slightly less (1%) than the previous year. The gross value of production (GVP) for Australian avocados was estimated at $398 million.
Australia a ual a o ado produ tio a d alue
Facts at a Glance for the Australian avocado industry—2016/17
www.avocado.org.au Compiled by Avocados Australia. Data source is Infocado unless otherwise stated.
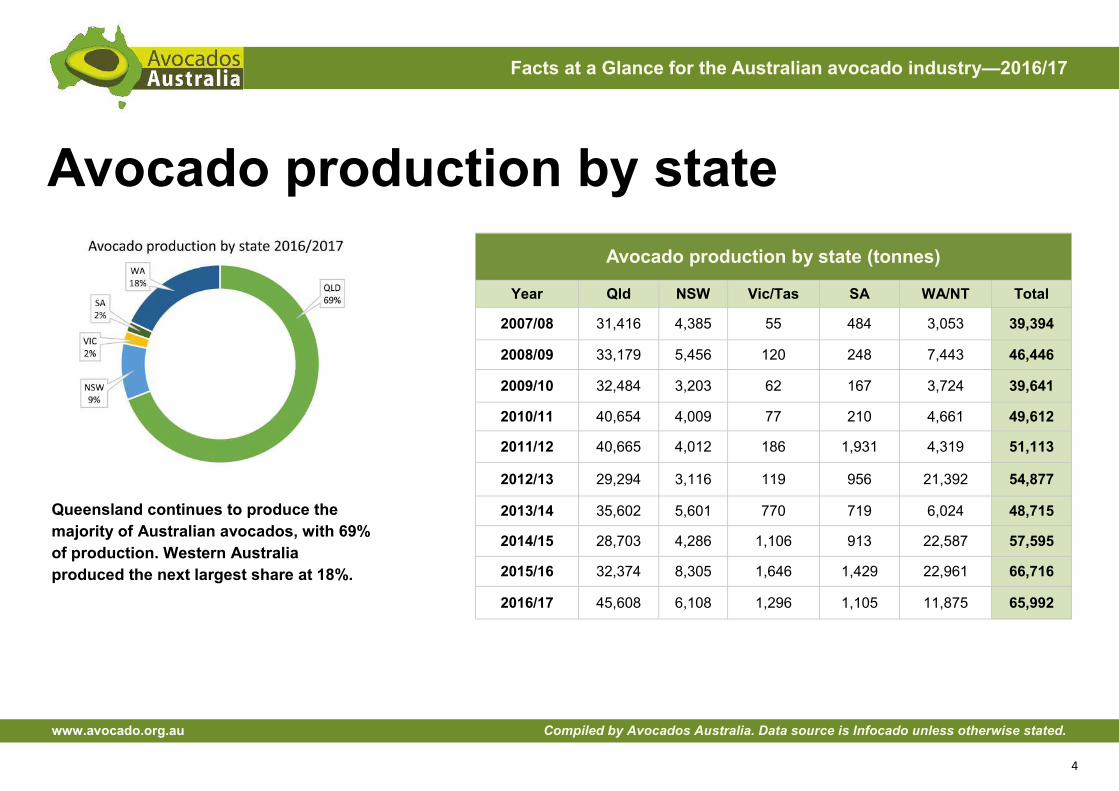
Queensland continues to produce the majority of Australian avocados, with 69% of production. Western Australia produced the next largest share at 18%.
Avocado production by state (tonnes)
Year Qld NSW Vic/Tas SA WA/NT Total
2007/08 31,416 4,385 55 484 3,053 39,394
2008/09 33,179 5,456 120 248 7,443 46,446
2009/10 32,484 3,203 62 167 3,724 39,641
2010/11 40,654 4,009 77 210 4,661 49,612
2011/12 40,665 4,012 186 1,931 4,319 51,113
2012/13 29,294 3,116 119 956 21,392 54,877
2013/14 35,602 5,601 770 719 6,024 48,715
2014/15 28,703 4,286 1,106 913 22,587 57,595
2015/16 32,374 8,305 1,646 1,429 22,961 66,716
2016/17 45,608 6,108 1,296 1,105 11,875 65,992
Avocado production by state

Facts at a Glance for the Australian avocado industry—2016/17
www.avocado.org.au Compiled by Avocados Australia. Data source is Infocado unless otherwise stated.
Avocado regions in Australia
Australia’s avocado production is divided into regions which have similar growing conditions and seasons. Some regions cross state boundaries. On average across 2015/16 and 2016/17, production has mostly come from the Queensland regions (59%) and Western Australia (26%).
Annual tonnes produced in each region averaged over two years*: 2015/16 and 2016/17
* A two-year average is used to compare production by region, because some regions have irregular bearing years, meaning crop load may vary significantly from year to year.
State/s Region
Quee sla d
North Quee sla d NQ
Ce tral Quee sla d CQ
Su shi e Coast SC
South Quee sla d SQ
Quee sla d &
Ne South Wales Ta ori e / Norther Ri ers TNR
Ne South Wales Ce tral Ne South Wales CNSW
Ne South Wales, Vi toria, South Australia & Tas a ia
Tristate Tri
Wester Australia & Norther Territory
Wester Australia & Norther Territory WA/NT

Facts at a Glance for the Australian avocado industry—2016/17
www.avocado.org.au Compiled by Avocados Australia. Data source is Infocado unless otherwise stated.
Avocado production by region

Facts at a Glance for the Australian avocado industry—2016/17
www.avocado.org.au Compiled by Avocados Australia. Data source is Infocado unless otherwise stated.
Avocado production by region
Year North Qld
Central Qld
Sunshine Coast
South Qld
Tamborine
Northern Rivers
Central NSW
Tristate Western Australia
Total
2007/08 6,205 14,757 4,082 4,841 1,509 3,309 1,180 3,510 39,394
2008/09 6,227 14,783 3,160 7,456 2,567 4,475 710 7,069 46,446
2009/10 6,667 17,105 2,766 4,779 1,220 2,914 394 3,797 39,642
2010/11 6,211 20,210 3,000 4,864 890 3,748 974 9,715 49,612
2011/12 6,378 20,870 3,337 6,738 1,743 3,462 4,668 3,917 51,113
2012/13 10,399 13,164 2,603 4,027 533 2,843 2,734 18,575 54,877
2013/14 10,859 13,668 2,131 7,243 1,586 4,208 2,857 6,163 48,715
2014/15 12,310 10,054 1,782 3,848 781 3,815 3,182 21,824 57,595
2015/16 12,285 13,857 1,421 5,301 1,737 4,752 3,592 23,771 66,716
2016/17 17,599 15,882 1,401 6,964 1,500 5,645 3,517 13,483 65,992
2016/17 % by region
27 % 24 % 2 % 11 % 2 % 9 % 5 % 20 %
Past 2yr average % by
region
23 % 22 % 2 % 9 % 2 % 8 % 5 % 28 %
Production in Central Queensland shows continued signs of recovery from the flooding events of 2011 and 2013, producing 24% of the nation’s avocados in 2016/2017. Western Australian production has continued to increase significantly, albeit with some ‘off years’. North Queensland production continues to grow steadily.
Facts at a Glance for the Australian avocado industry—2016/17
www.avocado.org.au Compiled by Avocados Australia. Data source is Infocado unless otherwise stated.
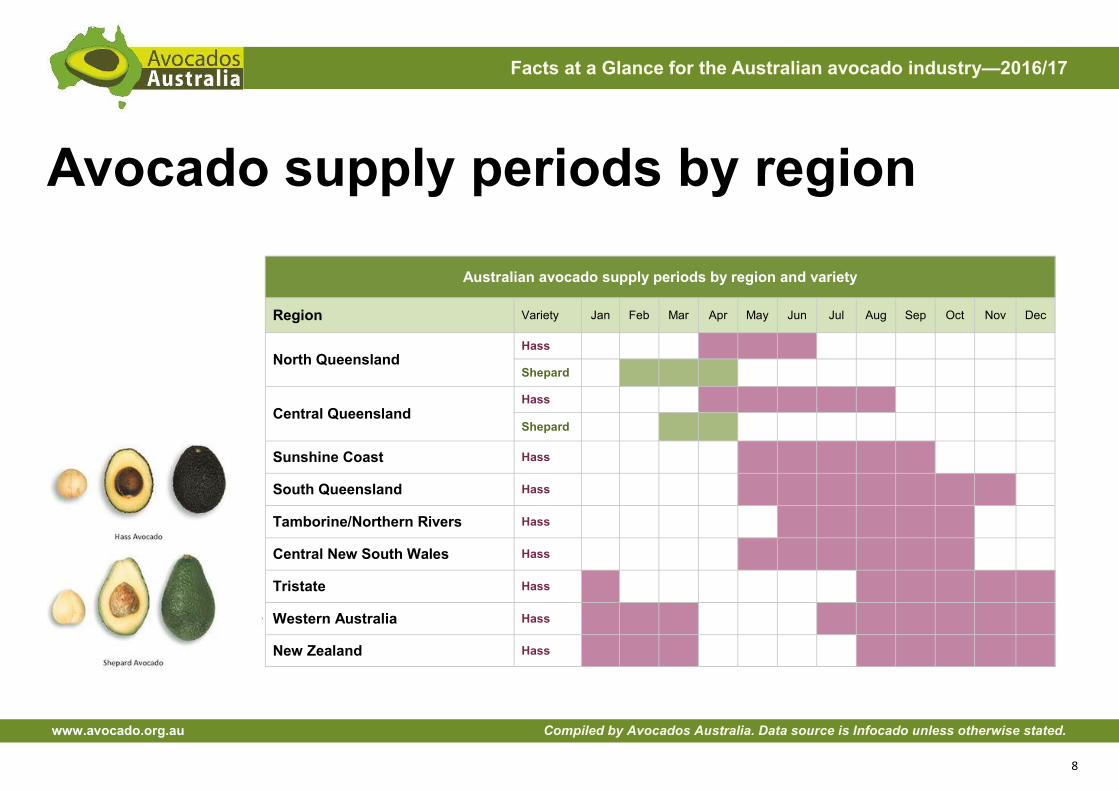
Avocado supply periods by region
Australian avocado supply periods by region and variety
Region Variety Jan Feb Mar Apr May Jun Jul Aug Sep Oct Nov Dec
North Queensland
Hass
Shepard
Hass
Central Queensland
Shepard
Sunshine Coast Hass
South Queensland Hass
Tamborine/Northern Rivers Hass
Central New South Wales Hass
Tristate Hass
Western Australia Hass
New Zealand Hass

Facts at a Glance for the Australian avocado industry—2016/17
www.avocado.org.au Compiled by Avocados Australia. Data source is Infocado unless otherwise stated.
In Australia, avocados are produced almost all year round due to the range of climates and conditions in our eight major avocado growing regions. Hass is the main avocado variety, and is produced almost all year round. In 2016/17 Hass represented 87% of production. Shepard, which is grown in Queensland through late Summer and Autumn, made up 10% of production, and at that time of year, is the dominant Australian variety on the market.
Avocado production by variety

Facts at a Glance for the Australian avocado industry—2016/17
www.avocado.org.au Compiled by Avocados Australia. Data source is Infocado unless otherwise stated.
Production by Variety (tonnes)
Year Hass Shepard Other Total
2007/08 31,578 5,933 1,883 39,394
2008/09 36,669 7,450 2,327 46,446
2009/10 29,790 8,353 1,498 39,641
2010/11 39,913 6,418 3,280 49,612
2011/12 43,155 4,923 3,035 51,113
2012/13 41,398 9,923 3,556 54,877
2013/14 37,513 8,882 2,320 48,715
2014/15 46,540 9,090 1,966 57,595
2015/16 53,965 10,281 2,470 66,716
2016/17 52,962 10,860 2,169 65,992
Avocado production by variety
Production by variety in 2016-2017
Variety Production (%)
Hass 87.270%
Shepard 10.499%
Lamb Hass 0.678%
Reed 0.638%
Sharwil 0.244%
Gwen 0.220%
Wurtz 0.201%
Fuerte 0.123%
Unnamed 0.098%
Pinkerton 0.013%
Gem 0.012%
Bacon 0.004%
Edrinol 0.001%
Facts at a Glance for the Australian avocado industry—2016/17
www.avocado.org.au Compiled by Avocados Australia. Data source is Infocado unless otherwise stated.
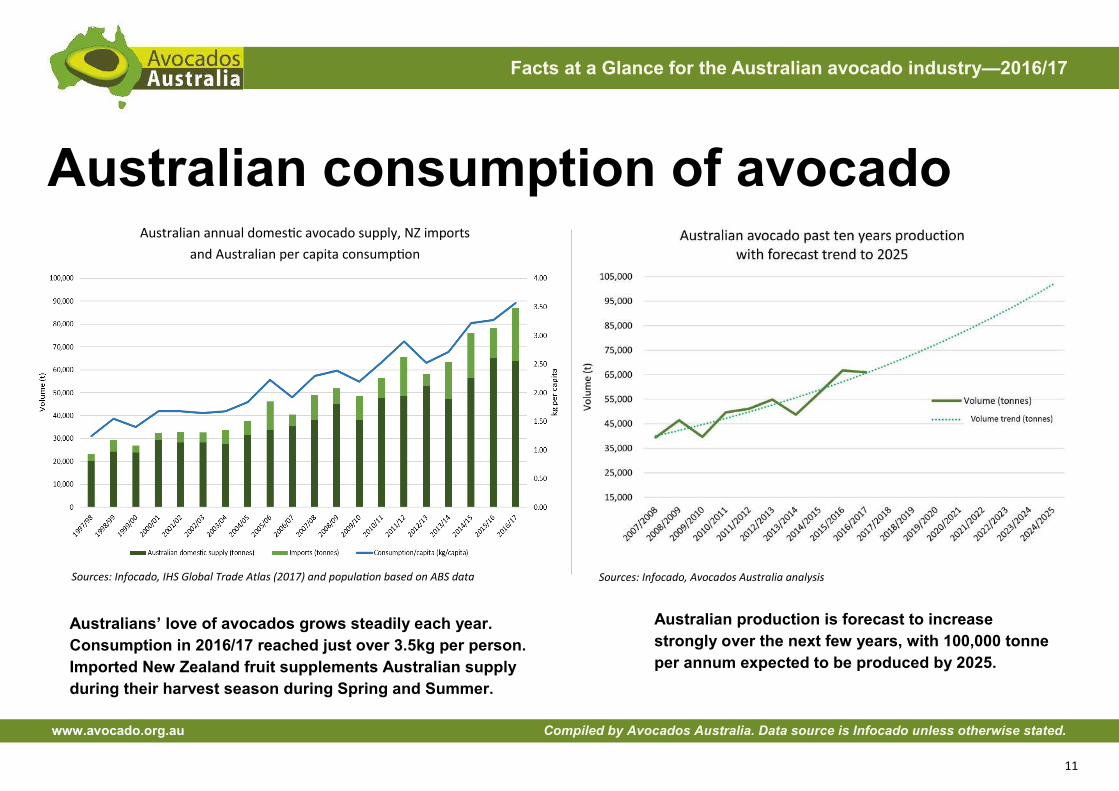
Australian consumption of avocado
Australian production is forecast to increase strongly over the next few years, with 100,000 tonne per annum expected to be produced by 2025.
Australians’ love of avocados grows steadily each year. Consumption in 2016/17 reached just over 3.5kg per person. Imported New Zealand fruit supplements Australian supply during their harvest season during Spring and Summer.
Australia a ual do esti a o ado suppl , NZ i ports a d Australia per apita o su ptio
Sour es: Info ado, IHS Glo al Trade Atlas 7 and population ased on ABS data Sour es: Info ado, Avo ados Australia analysis

Facts at a Glance for the Australian avocado industry—2016/17
www.avocado.org.au Compiled by Avocados Australia. Data source is Infocado unless otherwise stated.
In both production and exports, Australia is currently a small player in the world avocado market. Ongoing activity is underway targeting Australia’s growth in export markets with Malaysia and Singapore currently Australia’s main avocado export markets. In 2016/17 Australia exported over 2,300 tonnes of avocados, a one-third increase on the previous year, approaching the highest exports previously recorded in 2011/12.
Australian avocado export markets