factors influencing transition of pupils’ from primary to
TRANSCRIPT
1
FACTORS INFLUENCING TRANSITION OF PUPILS’ FROM
PRIMARY TO SECONDARY SCHOOLS IN MERU CENTRAL
DISTRICT IN KENYA
BY
DOMINIC MUTHURI KIRERA
A RESEARCH PROJECT SUBMITTED IN PARTIAL FULFILMENT
FOR THE DEGREE OF MASTER OF EDUCATION IN
EDUCATIONAL PLANNING
UNIVERSITY OF NAIROBI
2013

2
DECLARATION
This is my original work and has not been submitted for award of degree in any
other University
____________________________________
DOMINIC MUTHURI KIRERA
REG: E55/70285/2011
This project has been submitted for examination with my approval as University
supervisor
_______________________________________
MR. FERDINAND MBECHE
LECTURER
Department of Educational Administration and
Planning, University of Nairobi
________________________________________
DR. ANDREW R. RIECHI
SENIOR LECTURER
Department of Educational Administration and planning
University of Nairobi.

3
DEDICATION
This work is dedicated to my wife Gladys N. Muthuri and children Shem
Murithi, Sharlen Kanana, and Christine Muthoni.
4
ACKNOWLEDGEMENTS
I am grateful to God Almighty from where I draw my strength, intellect and
inspiration. I wish to acknowledge the following people for their unwavering
and inspiring efforts and support in ensuring my completion of the project. This
work would not have been completed without the advice, counsel, and patience
accorded me by my supervisors Mr. Ferdinand Mbeche and Dr. Andrew Riechi
of the University of Nairobi, Kenya.
I would like to thank the Meru central district education officer for allowing me
to conduct the study in the district. Special thanks go to Mr. Gichuru in charge
of examinations for giving me all the required information, the head teachers,
school committee and area education officers, for their cooperation during the
study.
My sincere heartfelt gratitude goes to my wife Gladys N. Muthuri, and children
Shem Murithi, Sharlen Kanana and Christine Muthoni who were very
inspirational,supportive and understanding during the course of my studies. Not
forgetting my father and mother Mr. and Mrs. Kirera my pillars of strength and
comfort.

5
TABLE OF CONTENTS
pages
Title page----------------------------------------------------------------------------------- i
Declaration---------------------------------------------------------------------------------ii
Dedication --------------------------------------------------------------------------------iii
Acknowledgement----------------------------------------------------------------------iv
Table of contents-------------------------------------------------------------------------v
List of tables------------------------------------------------------------------------------xi
List of figures--------------------------------------------------------------------------xiii
List of abbreviations--------------------------------------------------------------------xiv
Abstract----------------------------------------------------------------------------------xv
CHAPTER ONE
INTRODUCTION
TABLE OF CONTENTS pages
1.1 Background of the study-------------------------------------------------------------1
1.2 Statement of the problem -----------------------------------------------------------6
1.3 Purpose of the study------------------------------------------------------------------8
1.4 Objectives of the study -------------------------------------------------------------8

6
1.5 Questions of the study---------------------------------------------------------------9
1.6 Significance of the study------------------------------------------------------------9
1.7 Limitations of the study------------------------------------------------------------10
1.8 Delimitations of the study---------------------------------------------------------10
1.9 Basic assumptions of the study----------------------------------------------------11
1.10 Definition of significant terms ------------------------------------------------- 11
1.11 Organization of the study---------------------------------------------------------12
CHAPTER TWO
2.0 LITERATURE REVIEW
2.1Introduction ------------------------------------------------------------------------13
2.2 Background of transition from primary to secondary-------------------------13
2.3 Academic performance of pupils at Kenya certificate primary education--18
2.4 Education level of parent’s of pupils completing primary education--------19
2.5 Tuition fees charged pupils when joining form one class in secondary
school------------------------------------------------------------------------------------21
2.6 Availability of form one vacancies for pupils in secondary schools---------23
2.7 Summary of literature review---------------------------------------------------24
2.8 Theoretical framework ------------------------------------------------------------25

7
2.9 Conceptual framework-------------------------------------------------------------28
CHAPTER THREE
RESEARCH METHODOLOGY
3.1 Introduction ------------------------------------------------------------------30
3.2 Research design-------------------------------------------------------------------- 30
3.3 Target population-------------------------------------------------------------------31
3.4 Sample size and sampling techniques--------------------------------------------31
3.5 Research instruments--------------------------------------------------------------32
3.6 Instruments validity-----------------------------------------------------------------33
3.7 Instruments Reliability-------------------------------------------------------------33
3.8 Data collection procedures---------------------------------------------------------34
3.9Data analysis techniques------------------------------------------------------------34
CHAPTER FOUR
DATA ANALYSIS, PRESENTATION AND INTERPRETATIONS
4.1 Introduction ---------------------------------------------------------------------- - 36
4.2 Questionnaire return rate-----------------------------------------------------------37
4.3Influence of KCPE performance on transition to secondary school---------37
4.3.1 Relationship between admission to secondary school and KCPE score--38

8
4.4 Influence of level of education of parents on transition to secondary schools-
---------------------------------------------------------------------------------------------43
4.4.1 Level of education of parents------------------------------------------------43
4.4.2 Value of education as a way of alleviating poverty by parents----------45
4.4.3 Parents allow children to be employed instead of schooling------------46
4.4.4 Parents assist their children with school work-----------------------------48
4.4.5 Parents attend school meetings promptly-----------------------------------50
4.4.6 Effects of parents level of education on transition--------------------------52
4.5 Influence of tuition fees charged on students when transiting to secondary
school------------------------------------------------------------------------------------53
4.5.1 Failure to join secondary schools due to lack of school fees--------53
4.5.2 Adequacy of government funding in education---------------------------54
4.5.3 Difficulties in raising fees-----------------------------------------------------55
4.6 Availability of form one vacancies in secondary schools-------------------56
4.6.1 The influence of distance between home and school---------------------56
4.6.2 Qualified students missing opportunity to join secondary school-------58
4.6.3 Adequacy of secondary schools in the district-----------------------------59

9
CHAPTER FIVE
SUMMARY, CONCLUSIONS AND RECOMMENDATIONS
5.1 Introduction--------------------------------------------------------------------------62
5.2 Summary of the research findings-----------------------------------------------62
5.2.1 Academic performance in KCPE examination------------------------63
5.2.2 Education level of the parents------------------------------------------------64
5.2.3 Tuition fees charged students when joining form one--------------------64
5.2.4 Availability of form one vacancies in secondary schools----------------65
5.3 Conclusion---------------------------------------------------------------------------66
5.4 Recommendations------------------------------------------------------------------67
5.5 Suggestions for further research--------------------------------------------------68
REFERENCES-------------------------------------------------------------------------69
APPEDICES
Appendix I: Letter of introduction------------------------------------------------- 75
Appendix II: Questionnaire for the Head teachers-------------------------------- 76
Appendix III: Interview schedule for officials of school committee------------ 82
Appendix VI Research Authorization letter-----------------------------------------84
Appendix VII Research Permit-----------------------------------------------85

10
LIST OF FIGURES pages
Fig1.1 Conceptual framework--------------------------------------------------------28
Fig 4.1 Education level of parents----------------------------------------------------45
Fig 4.2 Parents value education as a way of alleviating poverty----------------46
Fig 4.3 parents allowing children to be employed instead of schooling ---------47
Fig 4.4 Parents assist their children with school work-----------------------------48
Fig 4.5 Parents attend school meetings promptly-----------------------------------52
Fig 4.6 Adequacy of secondary schools in the district-----------------------------59
11
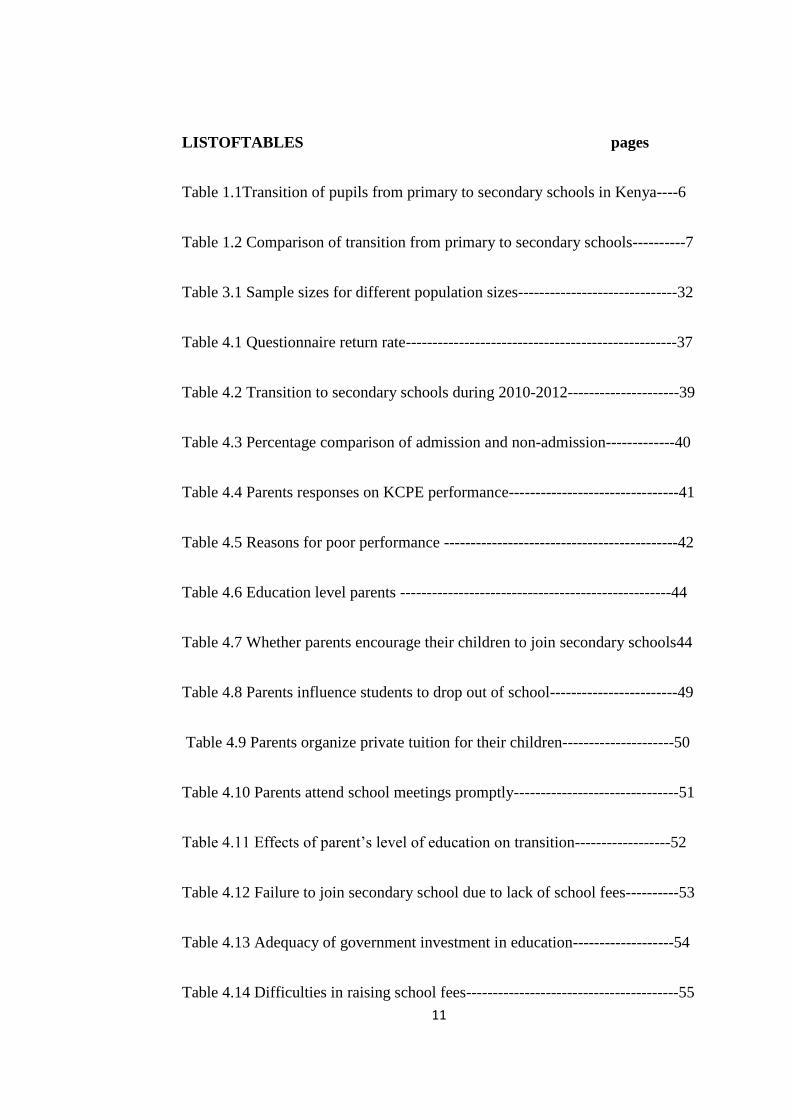
LISTOFTABLES pages
Table 1.1Transition of pupils from primary to secondary schools in Kenya----6
Table 1.2 Comparison of transition from primary to secondary schools----------7
Table 3.1 Sample sizes for different population sizes------------------------------32
Table 4.1 Questionnaire return rate---------------------------------------------------37
Table 4.2 Transition to secondary schools during 2010-2012---------------------39
Table 4.3 Percentage comparison of admission and non-admission-------------40
Table 4.4 Parents responses on KCPE performance--------------------------------41
Table 4.5 Reasons for poor performance --------------------------------------------42
Table 4.6 Education level parents ---------------------------------------------------44
Table 4.7 Whether parents encourage their children to join secondary schools44
Table 4.8 Parents influence students to drop out of school------------------------49
Table 4.9 Parents organize private tuition for their children---------------------50
Table 4.10 Parents attend school meetings promptly-------------------------------51
Table 4.11 Effects of parent’s level of education on transition------------------52
Table 4.12 Failure to join secondary school due to lack of school fees----------53
Table 4.13 Adequacy of government investment in education-------------------54
Table 4.14 Difficulties in raising school fees----------------------------------------55

12
Table 4.15 Influence of distance between home and school-----------------------57
Table 4.16 Qualified students miss opportunity to join secondary school-------58
Table 4.17 Other Factors influencing transition of pupils-------------------------60

13
LIST OF ABBREVIATIONS AND ACRONYMS
EFA-Education for all
FGM- Female genital mutilations
FPE-Free primary Education
GER-Gross Enrolment Ratio
GOK-Government of Kenya
K.C.P.E-Kenya certificate of primary Education
KIPPRA-Kenya institute for public policy Research and analysis
LAC-Latin American countries
MDG-Millennium development goals
MoE-Ministry of Education
NER-Net Enrolment Ratios
SSA-Sub-Saharan Africa
UPPA-Uganda Participatory poverty Assessment
UNICEF-United Nations International Children Educational Fund
UNESCO-United Nations Educational and Socio Cultural Organization
VSLA-Village Savings and Loans Associations

14
ABSTRACT
The study was on factors influencing transition of pupils’ from primary to
secondary schools in Meru central district in Kenya. Education is a fundamental
human right because it empowers individuals with the knowledge and skills
needed to increase production and income, as well as enabling individuals take
advantage of employment opportunities in order to reduce poverty. It is one of
the smartest economic and human development investments that any country
can make. Secondary education plays a vital role in ensuring a country’s
development through training, as pre-requisites to economic growth and Social
development. Transition from one level of education to another has been
affected by various factors which include academic performance at the end of
each grade, education level of parents, tuition fees charged by secondary
schools when joining form one and availability of vacancies in the next level.
Secondary school enrolments in Sub-Saharan Africa continued to be the lowest
in the world. The study wanted to find out why the secondary school
enrolments do not match the primary school enrolments.
The study was guided by the following objectives; to establish how academic
performance of pupils’ at Kenya certificate of primary education (K.C.P.E),
influences transition from primary to secondary schools ,to determine the
relationship between education level of parents and transition of pupils’ from
primary to secondary schools, to establish how tuition fees charged students’
when joining form one affects transition of pupils’ from primary to secondary
schools and to determine how availability of form one vacancies in secondary
schools, affects transition of pupils’ from primary to secondary schools in Meru
central district. The second chapter looked at literature review on how those
variables have influenced transition in other parts of the world, theoretical
framework and conceptual framework. The study was based on systems theory
that was originally proposed by a biologist Ludwing von Bertalanffy in in
1928who said that a system is a self- contained unit, and a part of a wider higher
order, and is organized in a series such that the output of one, is the input for
another subsystem, therefore, alteration of part requires alterations in other sub-
subsystems.
The study used descriptive survey design because it administered questionnaires
and interviewed people. It targeted 25 schools and 25 members of school
committees in the district. Questionnaires were issued and interview schedules
conducted with school committees and data was analyzed using spss. Chapter
four looked at data analysis and used tables and charts, to present information.
The study concluded that the district was performing poorly in KCPE, education
level of parents was affecting transition, tuition fees was hindering students
transition to secondary schools and limited vacancies in secondary schools was
influencing transition of pupils from primary to secondary schools in the
district. The study made recommendations that should be put in place in order to
improve transition levels in the district that government should provide
qualified teaching personnel to meet the needs of learners in order to improve
KCPE performance, District Education office should come up with practical
15
measures to sensitize the parents on the importance of education in order to
change their attitudes and efforts should be made to ensure even distribution of
secondary schools with relevant and adequate infrastructures.

16
CHAPTER ONE
1.0 INTRODUCTION
1.1Background to the study
Education is a fundamental human right because it empowers individuals with
the knowledge and skills needed to increase production and income, as well as
enabling individuals take advantage of employment opportunities in order to
reduce poverty (UNESCO, 2010). Supporting education is one of the smartest
economic and human development investments that any country can make
(World Bank, 2009). Secondary education plays a vital role in ensuring that a
country’s development through training, are pre-requisites to economic growth
and Social development (World Bank, 2008). This is why governments all over
the world are committed to the provision of education to their citizens.
The Republic of Korea, which in the 1950s was among the world’s poorest
countries, managed to achieve nearly 100% transition in secondary education in
just four decades. This rapid expansion was attributed to a pragmatic policy
framework emphasizing different levels of education overtime. In the 1960s, the
top priority was universal primary education; in the 1970s policy emphasis
shifted to secondary education, and in 1980s, to the tertiary level. In 1968, the
government abolished the entrance examination for middle schools, increased
government spending in education, and encouraged private provision of

17
education at all levels. Korea’s success story provides a vital lesson for African
governments on how political commitment and pragmatic education planning
can turn around an education system (APHRC, 2007).
In order for countries to develop and compete well in a globalized economy, it
is important for labor markets to have high caliber of school graduates with
relevant skills and knowledge. Secondary education is very important for many
individuals, because it improves their standards of living when they get jobs,
and determines their future life chance sand mobility out of poverty (Lewin,
2007).Transition to secondary education is beneficial in more than economic
and social development because it promotes active citizenship as well as
enhances social cohesion by increasing trust and tolerance amongst individuals
(World Bank, 2005)
According to universal declaration of Human Rights Article 28 of 1979,
education should be free at least at the elementary level and accessible to all
on basis of merit at higher levels. In order to realize these aspirations, the
united Nations introduced the Education for All (EFA) as an international
initiative first launched in Jomtien, Thailand in 1990 to bring the benefits of
education to every citizen in every society (EFA Global monitoring Report
UNESCO, 2009). Education is a major catalyst for human development hence
its accessibility is very important. Access to schooling in developing countries

18
has improved since 1990 some 47 out of 163 countries have achieved universal
primary education (MDG 2) and an additional 20 countries are estimated to be
on track to achieve this goal by 2015. However, challenges on transition remain
in 44 countries, 23 of which are in Sub-Saharan Africa, and Kenya is among
them (World Bank, 2009).
In Latin America, Brazil has the highest secondary gross enrolment ratios at
almost 100% compared to Guatemala where only 51% of students enroll
beyond primary education. Only a handful of Sub-Saharan African countries,
such as Botswana, Cape Verde, Mauritius and South Africa, have achieved rates
of access to secondary education as high as 80% for junior secondary while
Kenyan transition levels currently stands at around 73%. Countries such as
Burundi, Burkina Faso, and Rwanda have not even achieved rates of 20%
(SEIA, 2007). Secondary education is important because it provides students
with the technical, academic and life skills to contribute to the economic
prosperity of their countries yet, transition to secondary education remains low
throughout the developing world with stark regional differences especially in
Africa (World Bank, 2005).
The attainment of EFA by 2015 is a major commitment of the Government of
Kenya, in line with the right to education for all Kenyans as it is enshrined in
the Constitution of Kenya (2010). Access to education in Kenya has not

19
been evenly distributed across sexes, regions and social groups ( Orodho,
2002). According to EFA monitoring Report (2012), Kenya is one of the
countries where the secondary enrollment has significantly increased
together with Burkina Faso, Burundi, Chad, Congo, Niger, Tanzania among
others.
Financing secondary education is a great challenge to both governments and
households. Secondary education in most African countries tends to be the most
neglected, receiving on average 15-20% of state resources. In Kenya, whereas
households meet only 20% of primary and 8% of university education costs,
they shoulder 60% of secondary education costs. Thus, tuition fee is a key
barrier to transition to secondary school for the poor, who form the majority in
sub-Saharan Africa (APHRC, 2007). According to World Bank (2008),
Tanzania is one of the poorest countries of the world; hence parents are unable
to pay tuition fees for their children in schools.
It is generally agreed by scholars that the most important manifestations of
schooling quality (however defined) are literacy, greater cognitive abilities and
better student performance in examinations. Internationally, pupils’ scores have
been accepted and used as a proxy of achievement. This performance is
important to transition to secondary schools in many countries of the world
(UNESCO 2004; Deolalikar, 1999). In Eritrea, transition to secondary school is
very low because many pupils repeat primary school due to poor performance in

20
final examinations (World Bank, 2008). In Kenya, good performance at KCPE
Examination enhances pupil’s transition to good public secondary schools.
According to Ngware et al (2006), transition from primary to secondary
school in Kenya is usually pegged on the number of available spaces in
secondary schools. According to World Bank, (2008) Senegal secondary
education enrolls only 25 percent of the student who complete primary cycle to
lower secondary education due to the limited number of schools; hence about
half of the pupils completing primary schools lack opportunities to enroll in
secondary education. In addition, secondary schools are unevenly distributed
making it more difficult to access secondary education in some areas.
According to World Bank, (2008) Namibia has primary schools spread over
rural areas, while secondary schools are concentrated in towns and cities, and
this hinders transition of pupils from interior parts of the country. Parents’ level
of education may be positively correlated with student ability, which may in
turn result into higher education attainment for the child. Moreover educated
parents are likely to provide a more conducive learning environment for their
children at home and also encourage their transition to secondary schools
(Ngware et al, 2006). Where parents have low levels of education, they may
not see the need to encourage their children to transit to secondary schools.
Table 1.1 shows that transition from primary to secondary schools in Kenya has
been increasing gradually over the years.

21
Table 1.1: Transition from primary to secondary schools in Kenya from
2003-2011
Years 2003 2004 2005 2006 2007 2008 2009 2010 2011
Transitio
n Rates
46.4
%
45.8
%
56.0
%
56.3
%
59.6
%
59.9
%
66.9
%
72.5
%
73.3
%
Source : MoE, 2012.
Table 1.1 shows the progression in transition of pupils’ from primary schools to
secondary schools in Kenya since 2003. Progression of learners from one level
of education to another is a measure of a system’s internal efficiency as well as
its physical capacity (Otieno & Colcloughn 2009). However, transition from
primary to secondary schools in Meru central has remained low over the years.
It is in the interest of this study to find out the factors that influence transition of
pupils from primary to secondary schools in Meru central district.
1.2 Statement of the problem
Secondary school enrolments in Sub-Saharan Africa continue to be the lowest
in the world. Of approximately104 million secondary school-age children in the
region, only one in four (25%) were enrolled in secondary school in 2006

22
(UNESCO, 2008). The world average on secondary NERs shows that slightly
more than half (58%) of the secondary school-age children were enrolled in
secondary schools in 2006 (ibid, 2008). Statistics provided by UNESCO (2008)
show that children, in SSA have the lowest opportunity to enroll in secondary
school at their official age. In Kenya education at primary level, as a result of
the introduction of universal primary education net enrolment rates are 81.5%,
while net enrolment at secondary school is 69.1% despite the government’s
efforts of introducing free day secondary schools in 2008,(EFA Global
Monitoring, 2010).
The transition from primary to secondary schools in Meru central district has
remained low over the years as shown in Table 1.2.
Table 1.2: Comparisons of transition from primary to secondary schools
YEARS 2007 2008 2009 2010 2011
National 59.6% 59.9% 66.9% 72.5% 73.3%
M/ central 37.8% 39.3% 38.6% 39.1% 38.3%
Source: MoE (2012) and DEO Meru Central: 2012.
This trend has persisted and has been raising concern of educationists. For
instant in 2011, 38.3% of the pupils who sat KCPE joined secondary schools.
This left out over 60% whose continuity in education could not be explained
(Meru central district education office, 2012).There could be a host of factors

23
that are responsible for this transition gap. It was therefore in the interest of this
study to establish the factors that influence transition from primary to secondary
schools in Meru central District
1.3 Purpose of study
The purpose of the study was to investigate the factors that influence transition
of pupils’ from primary to secondary schools in Meru central district in Kenya.
1.4 Objectives of the study
The following specific objectives guided the study:
i. To establish how academic performance of pupils’ at Kenya
certificate of primary education (K.C.P.E),influences transition from
primary to secondary schools in Meru Central district.
ii. To determine the relationship between education level of parents
and transition of pupils’ from primary to secondary schools in Meru
central district.
iii. To establish how tuition fees charged students’ when joining form
one affects transition of pupils’ from primary to secondary schools in
Meru central district.
iv. To determine how availability of form one vacancies in secondary
schools, affects transition of pupils’ from primary to secondary
schools in Meru central district.

24
1.5 Questions of the study
The study attempted to answer the following questions:
i. What is the relationship between academic achievement in Kenya
certificate of primary education and, transition of pupils’ from
primary to secondary schools in Meru Central District?
ii. Does the highest level of education of parents influence transition of
pupils’ from primary to secondary schools in Meru central district?
iii. To establish how the tuition fees charged students’ when joining
form one affects transition of pupils’ from primary to secondary
schools in Meru central district?
iv. Explain how availability of form one vacancies in secondary
schools, affects transition of pupils’ from primary to secondary
schools in Meru Central District?
1.6 Significance of the study
The research provides up to date information on current factors
influencing transition’s in Meru central district. This information may be
useful to educational planners, administrators, parents, pupils, donors,
community, and other stakeholders, to device measures that could ensure that
student join secondary schools after completing primary school cycle. The
ministry of education can use findings of this study to address factors that
hinder transition even in other parts of the country. Moreover this study adds to

25
the growth of knowledge on the factors that influence transition of pupils from
primary to secondary schools. The educational administrators can address the
problems that pupils experience when transiting to secondary schools and
influence their participation in secondary education. The findings of this study
can be used as a basis of research in other parts of the country.
1.7 Limitations of the study
In this study it was not be possible to control the attitudes of the respondents
which may affect the validity of the responses. This is because respondents may
give socially acceptable answers to please the researcher. During the study it
was not possible to adequately measure the factors that influence students
transition to secondary schools, because there were factors that influenced
student transition which were beyond the scope of the study.
Some respondents were afraid to reveal information they considered intimate to
them. The study did not involve dropouts though they are best placed to reveal
the reasons that hindered them from transiting to secondary schools, because it
was difficult to find them.
1.8 Delimitations of the study
The study covered only 124 primary schools in Meru Central District, in
the Meru County in Kenya. The study considered the views of head
teachers of those pupils who dropped out after standard eight, and the
views school committees. The generalizations made in this study only
applies to Meru central district and can be replicated in other districts with

26
similar characteristics. The study focused on specific factors influencing
transition to secondary schools which included; performance at Kenya
certificate of primary education, Education level of parents, tuitions fees
required when joining form one and availability of form one vacancies in
secondary schools.
1.9 Basic assumptions of the study
i) The study assumed that the sampled schools experienced low transitions of
pupils from primary to secondary schools, in the district.
ii) It is also assumed that the data obtained from the respondents was
accurate and formed the basis of the findings of this study.
1.10 Definition of significant terms
Access refers to the right of entry, admission to secondary school.
Enrolment refers to the number of students’ registered in a school at a given
time
Drop out refers to a person who leaves school after completing the designated
eight years of primary school cycle and does not proceed to secondary school.
Influence refers to the capacity to have an effect on the character,
development, or behavior of someone or something.
Participation refers to taking part in school or being in the school

27
Pupil’s background refers to home based factors affecting transition of a
pupil from primary school to secondary school.
Secondary education refers to the stage of education after completing
primary school. In Kenya, it is generally the final stage of ordinary
education level (O-Level).
Transition refers to moving from primary school to secondary school.
1.11 Organization of the study
The study is organized into five chapters. Chapter one presents the
background of the problem, statement of the problem, purpose of the
study, objectives of the study, research questions, significance of the
study, limitations of the study, delimitation, basic assumptions of the
study, definition of significant terms and organization of the study.
Chapter two deals with review of related literature on factors influencing
transition like Academic performance at Kenya certificate of primary
education, Education level of parents, tuition fees required when joining form
one and availability of form one vacancies. It also has a theoretical and
conceptual framework. Chapter three deals with research methodology
which includes research design, target population, sample sizes and
sampling techniques, research instruments, the data collection procedures
and data analysis techniques. Chapter four presents the data analysis, and

28
interpretations, and discussions on the findings. Chapter five contains the
summary of the findings, conclusions and recommendat
CHAPTER TWO
2.0 LITERATURE REVIEW
2.1 Introduction
This section reviewed the factors influencing transition of pupils from
primary to secondary schools which includes; Academic performance at
Kenya certificate of primary education, Education level of parents, tuition fees
charged pupils when joining form one, and availability of form one vacancies
in secondary schools. Lastly, it looks at the theoretical and conceptual
framework.
2.2 Background of transition from primary to secondary
The improvement in transition from primary to secondary education in
American, constituted a shift in education policy. The shift necessitated more
investment in secondary school education by increasing public funding, non-
selective with no early specialization or academic segregation, a practical
curriculum, numerous small-fiscally independent school districts, and secular
control of schools and school funds (World Bank, 2005).This decentralized
nature of the US secondary school system increased access and transitions in to

29
secondary education (World Bank, 2005). However, Sweden and the UK had
relatively high secondary school participation rates, though below 50 per cent
(World Bank, 2005).
In Asian countries, public investments were made in primary and secondary
education after the Second World War. For instance, Singapore and South
Korea adopted policies aimed at increasing quality and access to secondary
education. Yet such policies did not guarantee increased access to secondary
education as participation rates in vocational secondary education remained
below 50 per cent (Mundle, 1998; Gill et al., 2000; World Bank, 2005).
However, countries such as Japan that took urgent measures to increase
transition to secondary education through increased public investment are now
enjoying economic benefits.
The education systems inherited by the African nations at the time of
independence were quite inadequate to meet the needs of the new
countries for self- governance and rapid economic growth. For example in
1960, the GER in primary schools in Sub-Saharan Africa was still only
36%, about half the levels then found in Asia (67%) and Latin America
(73%). Many African countries, including the Gambia, Cote D’Voire, and
Senegal in West Africa, Tanzania and Somalia in East Africa, had
literacy rate below 10% at the time of independence, (World Bank, 1988).
Enrollment rates in secondary schools among Sub-Saharan African countries
vary between less than 10 and more than 90 percent, with Tanzania and South

30
Africa representing the extremes. Obviously, the Challenges of making
transitions more efficient and equitable are accordingly different. In Low-
participation countries, the main aim is to open up for increased enrollment,
especially in lower secondary education (World Bank, 2008).
The belief that educations holds the key in promoting social and economic
progress played an important role in the growth and spread of education in
Kenya mainly as a means of providing qualified persons for the growing
economic and administrative institutions left behind by the colonial government
(Court and Ghai,74). In addition several commissions were founded to address
the challenges facing the education sector and to seek out a more responsive
educational system; these included the commissioning of the Kenya Education
Commission Report of 1964, the report proposed an education system that
would foster national unity and African Socialism; the report of the national
committee on education objectives and policies of 1976, the commission of
higher education report that saw the removal of A-level and the adoption of
8.4.4 system in 1985, the Kamunge report of 1988, the Koech report of 2000
and more recent, the Sessional paper No 1of 2005 on policy framework for
education, training and research.
Secondary school education is characterized by dropout rates ranging from 10
to 50% and factors such as poverty, insecurity and geographical disparities have
been attributed to this trend (Achoka et al, 2007). To mitigate against the low
levels of transition from primary to secondary levels of education, Free

31
Secondary Education was introduced in 2008. This directive though, is limited
in its capacity to ensure that all students have access to secondary education, its
benefits are few. This aspect of low transition rates is quite common in
Meru central district.
Kenya’s educational system prior to independence was controlled by the
colonial government and missionaries. Reading was introduced to spread
Christianity and practical Subjects were meant to prepare the indigenous
African communities for blue and technical jobs. The colonial education
system was based on a model of segregation, this saw the establishment of
separate educational systems for Europeans, Asians and Africans, a factor that
perpetuated inequalities in accessing education more so for the African
population. After independence in 1963, the African post-independent
government sought to rectify the anomalies created by the colonial education
structure through increasing opportunities for the Kenyan African population.
The Kenyan educational system has witnessed several changes in structure and
in curriculum. In the prevailing 8-4-4 system, primary education is supposed to
start at the age of 6 and run for 8 years. This is followed by 4 years of secondary
education. Secondary education paves the way for higher education, which is
imparted through technical institutes, polytechnics or universities. University
education for most degrees is a 4-year program. The data collected in 1997 on
the educational pyramid reveal that 44% of the working-age population had not
completed primary school while 21% had attained at least 8 years of schooling,
completing primary school. About 17% had begun but had not completed lower

32
secondary education (forms 1 and 2) while 13.7% had completed it. (Kimalu et
al. 2001). This has made some scholars to view the current 8-4-4 system as
being a wasteful system. Things have not changed even with the introduction of
FPE in 2003, an initiative that has seen more children go to school. However,
not all school going children have been able to access education. At secondary
level, cost sharing which forces parents to pay for school uniform and utilities,
has raised the cost of hiring teachers and recurrent and capital expenditure
(GOK, 1999). Access to secondary school education still remains limited
despite the rapid expansion of the sector only 47% of pupils securing entry into
the secondary level; this percentage represents only 27% of those eligible for
secondary education (GoK, 2003).
According to EFA monitoring Report (2012), Kenya is one of the
countries where the secondary enrollment has significantly increased but
has not matched the primary school enrolments which has pushed the demand
for secondary education higher. In Kenya, it is estimated that the transition
reached 60% in 2006/07. This suggests that six in every 10 children enrolled in
the last grade of primary school in 2006 became enrolled in secondary school in
2007. There is a strong correlation between the increase in standard 8
enrolments and transition to secondary school. As the enrolment of primary
pupils in the last grade increases, so does the number of pupils entering into the
first grade of secondary education. This suggests that the increase of enrolments
in the secondary sector also depends on the increase in pupils completing the
last grade of primary education (Lewin, 2005). Despite the challenges

33
associated with it, transition to secondary education is beneficial in more than
economic and social development because it promotes active citizenship as well
as enhances social cohesion by increasing trust and tolerance amongst
individuals (World Bank, 2005).
2.3 Academic performance of pupils at Kenya certificate of primary
education
Kenya certificate of primary Education is a high-stakes examination, which has
profound consequences for candidate’s life chances. Kenyan secondary schools
are formally stratified into a three-tier hierarchy on the basis of their catchment
areas and KCPE results determine which tier candidates are entitled to enter
(Kimalu, et al ,2001). National schools which are currently 78 in number forms
the top tier. They are highly selective and only about 1% of KCPE candidates,
recruited from all over the country will win these places. The national schools
include among them the earliest secondary schools in the country, some dating
back to the 1920s or 1930s. The KCPE performance level needed to qualify for
a national school varies from district to district, and some national schools are
more selective than others. In general, however, a total score of at least 380 (out
of a maximum of 500) is required; often 400 or higher for the most prestigious
schools (MOE, 2009).
Provincial schools form the middle tier. They recruit from within the province
where the school is located. Provincial schools are moderately selective in that
about 20% of KCPE candidates qualify. Recruitment requirements vary widely,

34
but for an established secondary school a KCPE score of at least 320 is likely to
be needed (Kimalu, et al ,2001). District schools constitute the broad base of the
secondary education pyramid such that the bottom of the status hierarchy they
make up about 70% of all public secondary schools in Kenya. District schools
may not have boarding facilities and as a result they recruit local pupils, living
for the most part within walking distance hence most of them operate as day
secondary schools. Some district schools set a minimum KCPE score for entry
while others are virtually non-selective. It is clear, then, that for primary-school
leavers with aspirations to continue their education, performance in the KCPE
examination is crucial. One major initiative to improve performance in the years
ahead is the recent launch of the Kenya Education Sector Support Program
(KESSP) which will support the government in strengthening management and
delivery of education services and improve access to and the quality and
relevance of education and training GoK, (2007).
2.4Education level of parents of pupils completing primary education
The parent’s level of education has a lot of impact on schooling of children
because the more educated parents are, the more likely they are to enroll their
children and push them through school (Holmes, 2003). Parental decisions
affect children retention in a school system such that students whose parents
monitor and regulate their activities, provide emotional support, encourage
independent decision making and are generally more involved in their schooling
are less likely to drop out of school (UNICEF, 1999).

35
High academic attainment of a mother and father significantly reduce chances
of primary school dropout for both girls and boys in rural and urban areas. For a
mother, this phenomenon could perhaps be attributed to the fact that educated
mothers reduce the time spent doing household chores while increasing the time
spent with their children than their uneducated counterparts. Also, educated
mothers are more effective in helping their children in academic work and also
monitor and supervise their children’s academic progress (Holmes, 2003).
While for fathers, it’s attributed to the fact that educated fathers are also
interested in the academic progress of their children thus they would be willing
to spend more time helping their children in academic problems.
As suggested by Leclercq (2001), educated parents are more aware of the
possible returns to their children's education and they are more likely to have
access to information and social networks necessary for their children to engage
into relatively human capital intensive activities yielding high returns to
education. This also goes a long way in motivating their children to aim
higher in education because they can look at their parents as role models.
Educated parents are likely to hire private tuition and offer rewards for their
children so that they can do well in school. The academic attainment of
parents enhances positive attitudinal change towards children’s education. In
Kenya, parents who are not educated or have just the basic education, do
not see the benefits of education hence do not encourage their children to
transit to high school (CREATE, 2009).
36
2.5 Tuition fees charged pupil’s when joining form one class in secondary
schools
Financial requirements for joining secondary school influences transition from
primary to secondary schools and are one of the greatest challenges of access to
secondary education in SSA. This is because secondary education in majority of
the countries is part of a fee-paying sector. This means that parents are required
to meet some operational costs such as tuition and maintenance fees and may be
required to pay for many other things including food, uniforms, learning
materials, and special equipment (Lewin, 2007). State investment in secondary
education tends to be the most neglected of the education sector, receiving on
average between 15% and 20% of total education resources from the
government (World Bank, 2007). Such a low investment in secondary education
has direct implications on transitions to secondary schools which is a challenge
for many individuals particularly in rural regions of Africa, with many children
unable to attend due to the remoteness of location of secondary schools.
In countries such as Kenya and Uganda which have introduced universal
primary education there was necessary tradeoff between implementing this
policy and investing in building new schools and improving school
infrastructure (CREATE, 2007). Furthermore, even in secondary schools
located near primary feeder schools, there may be other problems restricting the

37
intake of pupils. Underfinancing has led to inadequacy of teaching staff and
classrooms, both of which pose major obstacles to many secondary schools
enrolling more children. This makes schools to charge high fees in order to meet
the cost of running secondary schools. Governments need to be prepared to
invest in secondary education if they want to improve transition and
subsequently see an increase in economic growth and social progress. Without
such investment it will become increasingly hard to compete in today’s
knowledge based global economy (World Bank, 2008).
In Kenya before the introduction of subsidized secondary education households
were expected to meet 60% of secondary education costs, compared to 20% of
primary and 7% of university (World Bank, 2007). Even after the government
moved to create free day secondary education system, the cost of education to
households in Kenya continues to remain high for many to attend secondary
school. A study of 109 school leavers found only 17 progressed to secondary
school, while 20 of those who would have liked to attend sighted auxiliary costs
as the greatest hurdle (Obua, 2011).
Initiatives such as the Village Savings and Loans Associations (VSLA) have
proved to be effective methods to increase incomes of some of the poorest
families. An evaluation of VSLA groups in Uganda found that people were
prepared to spend a significant amount of money on education if they could
afford it and in fact spent more money on school fees than anything else
(Anguria et al, 2008). This observation is also supported by case studies from

38
Build Africa’s income program indicating that as household income increases
so does spending on education. For transition to improve it is imperative that
poor families are able to afford the cost of secondary education. Programs
geared towards increasing incomes of the poor are therefore critical if access to
and benefits of secondary education are to be extended more widely.
2.6Availability of form one vacancies for pupils in secondary schools
A significant number of studies have observed the uneven distribution of
educational opportunities between poor and non-poor regions, both in urban and
rural environments. A lack of schools within a reasonable walking distance for
those in poor regions is a serious barrier to transition, especially in rural and
remote parts of countries (World Bank, 2007). A lack of infrastructure is also a
serious challenge to existing schools and as the numbers of pupils completing
primary education continues to grow, teaching staff amongst other resources
will become an increasing problem (USAID, 2008). In addition the transition
from primary to secondary schools in Kenya is pegged on the number
of available spaces in secondary schools (Bedi et al, 2004). This results
from the limited number of schools, in Kenya to absorb the pupils who
are completing standard eight.
However according to research that has been carried out in Kenya, the
number of secondary schools per square kilometer has a positive impact
on access to secondary education (Alston and Kent, 2006). If physical

39
infrastructure exists at secondary school level, transition will increase to
between 65% and 70% over the next 5 to 10 years. In order to meet the
70% transition rates by 2008 as envisioned by the government, about
12,000 new classrooms are required (Chimombo, 2005).
2.7 Summary of the literature reviewed
From the literature reviewed it is clear that in order for transition to be improved
a number of issues have to be addressed at different levels by the government
and the private sector, in order to address the barriers children face when
transiting to secondary schools. The world average on secondary NERs shows
that slightly more than half (58%) of the secondary school-age children were
enrolled in secondary schools in 2006 (UNESCO, 2008). Statistics provided by
UNESCO (2008) show that children, in SSA have the lowest opportunity to
enroll in secondary school at their official age. In Kenya, primary schools net
enrolment rates are 81.5%, after introduction of Universal primary education;
while net enrolment at secondary school is 69.1% despite the government’s
efforts of introducing free day secondary schools in 2008, (EFA Global
Monitoring, 2010).
New schools must be built and improvements to infrastructure and facilities of
existing ones must be undertaken. At the primary school level it is imperative
that everything is done to ensure that pupils perform well at KCPE. However,
40
not all school going children have been able to transit to secondary education in
Kenya. CREATE (2009) detailed some of the factors responsible for transition
trends which included; KCPE performance by pupil’s at the primary school
level, education level of the parents of these pupils, tuition fees, and availability
of form one vacancies in secondary schools among others, as the biggest
hindrance to transition to secondary education. Data from Meru Central District
education office, shows that transition from primary to secondary schools in the
district has remained low over the years, despite the growing concern, no
studies have been carried out to establish the pertinent factors affecting
transition to secondary schools in the district (Meru central district education
office 2012). This study therefore sought to establish factors that influence
transition from primary to secondary education in the district.
2.8 Theoretical framework
This study was based on systems theory that was originally proposed by a
biologist Ludwing von Bertalanffy in in 1928. He said that a system can be
broken down into individual components, which interact with others, and that
the components could be added in a linear fashion to describe the totality of the
system. He proposed that one part of the system enables us to know something
about another part. A system can be controlled or non- controlled, and in a
controlled system information is sensed, and changes are effected in response to
the information. He further said that systems share general characteristics that
enable them to function as systems regardless of their type or level and must

41
have ways of self-organizing and directing behavior as well as being purpose
driven.
Though a system is a self- contained unit, it is part of a wider higher order, and
is organized in a series such that the output of one is the input for another
subsystem, therefore, alteration of part requires alterations in other sub-
subsystems. A system must be strongly goal directed, governed by feedback and
have the ability to adapt to changing circumstances. This means that the output
of primary school level is the input of the secondary school level because a
school is a system. A system has some predictability and this is also similar to a
school since those who enter standard one are expected to exit after standard
eight. The functioning of a system is affected by its environment. Parents are
key players and form part of the environment of an education system, because
they influence or motivate the pupils to continue with school or not to, and they
meet the cost of schooling for their children and especially when transiting to
form one. A system is governed by feedback. The KCPE performance provides
this feedback on how the system is fairing. A system is a self-contained unit, but
part of a wider higher order. The primary schools are part of education system
in Kenya. Secondary schools form part of the higher order in the system and
have rules of admissions to their subsystem based on performance at the
primary school level, availability of form one vacancies and charges (tuition
fees) levied as a condition of admission. These are some of the factors that
hinder transition of pupils from primary level to secondary school level of
education.

42
According to Reigeluth, Bathany, and Olson (1993) a system is based on the
following assumption in terms of design: A systems view suggests that essential
quality of a part resides in its relationship to the whole. The systems design
notion requires both coordination and integration. There is therefore need to
design all parts operating at a specific system level of the organization
interactively and simultaneously (Griffiths, 1964). This is because a system
cannot operate in isolation. Education is an Open System if there is a continual
input and output of both energy and matter in it. The environment is also made
up of social, economic and political institutions, which are constantly
interacting and inter-dependent and the same is true of the school system.
Schmuch (1977), advanced that schools are essentially living systems and that
without people they are nothing but concrete and paper. Hanson (1977), Owens
(1981) and Obilade (1989), examined education as a process involving the
following five forms of inputs: Human resources such as students; materials
resources such as buildings, desks, books, equipment; financial resources such
as money; constraints, such as requirements of the law and policy; expectations
of parents, values and goals. The output or products of the educational system
are students in the form of educated people now better equipped to serve
themselves and society. Progression of learners from one level of education to
another is a measure of a system’s internal efficiency as well as its physical
capacity.

43
2.9 Conceptual Framework
Fig 1.1Factors influencing transition of pupils from primary to secondary
schools
The conceptual framework relates independent variables to dependent variable.
It considers variables that are of great influence to transition of pupils from
primary to secondary schools and these have been treated as independent
variables such as academic performance of pupils at Kenya certificate of
primary education, education level of parents of these pupils, tuition fees
FACTORS INFLUENCING
TRANSITIONS OF PUPILS
TRANSITION TO SECONDARY SCHOOLS
Educated individuals who will benefit themselves
and the society through improved literacy levels
Academic
performance of
pupils at KCPE
level
KCPE grades
attained.
Lack of
motivation
Poor aspirations
in life
Education level of
parents of pupils
Uninformed parents
on benefits of
education
Parental decisions
towards schooling
Large family
Early marriages
FGM
Availability of
form one
vacancies for
pupils in
secondary schools
Criteria of form
one admissions
Availability of
schools
Distance between
home and school
Tuition fees
charged pupils’
joining form one
Cost of school
instructional
materials
Lack of
teach/learning
materials
Cost of uniforms
and books
44
required when pupils are joining form one and availability of form one
vacancies in secondary schools. The output or dependent variable is the
transitions of pupils from primary to secondary schools and increased literacy
levels in the society at large.

45
CHAPTER THREE
3.0 RESEARCH METHODOLOGY
3.1 Introduction
This section presents the methodology used to carry out the study. Specifically
the chapter focuses on the research design, target population, sample and
sampling techniques, research instruments, instruments validity, instrument
reliability, data collection procedures, and data analysis techniques. The chapter
also discusses how validity and reliability were established.
3.2 Research design
In this study a qualitative and quantitative techniques using descriptive survey
research design were used. According to Orodho (2005) descriptive survey is a
method of collecting information by interviewing and administering
questionnaire to a sample of individuals. Therefore this method was chosen for
this study because it enabled the use of questionnaires and interview schedules
for collection of data on respondents’ attitudes and opinions. Data was collected
from the respondents in the sampled primary schools on their attitudes and
opinions on factors affecting transition from primary to secondary schools in the
district.

46
3.3 Target Population
The target population for this study consisted of head teachers from 124
primary schools and one committee official from those schools in Meru Central
district.
3.4 Sample sizes and sampling techniques
According to Wiersma (1995), a sample is a small proportion of a target
population that has been selected using some systematic procedures for
the study. A sample is a smaller group obtained from the accessible
population selected for study ( Mugenda & Mugenda, 2003). Kothari (1985),
states that by observing the characteristics of a carefully selected and
representative sample, one can make certain inferences about
characteristics of the population from which it is drawn. According to Gay
(1992) & Sekaran (2007), a researcher can take samples of 10% of a bigger
population and at least 20% for a smaller population and that a sample of above
30 to 500 is a good representation of the population. Mugenda & Mugenda
(2003), suggests that 10% sample of the accessible population is adequate
to serve as a study sample. Since this district has 124 primary schools which
is a small population, a sample of 20% that is 25 primary schools was used in
this study. At least six primary schools were selected from each division. This
study administered questionnaires to 25 head teachers and interviewed one
executive committee official from the sampled schools in the district. The
population and sample sizes are indicated in Table 3.1.
47
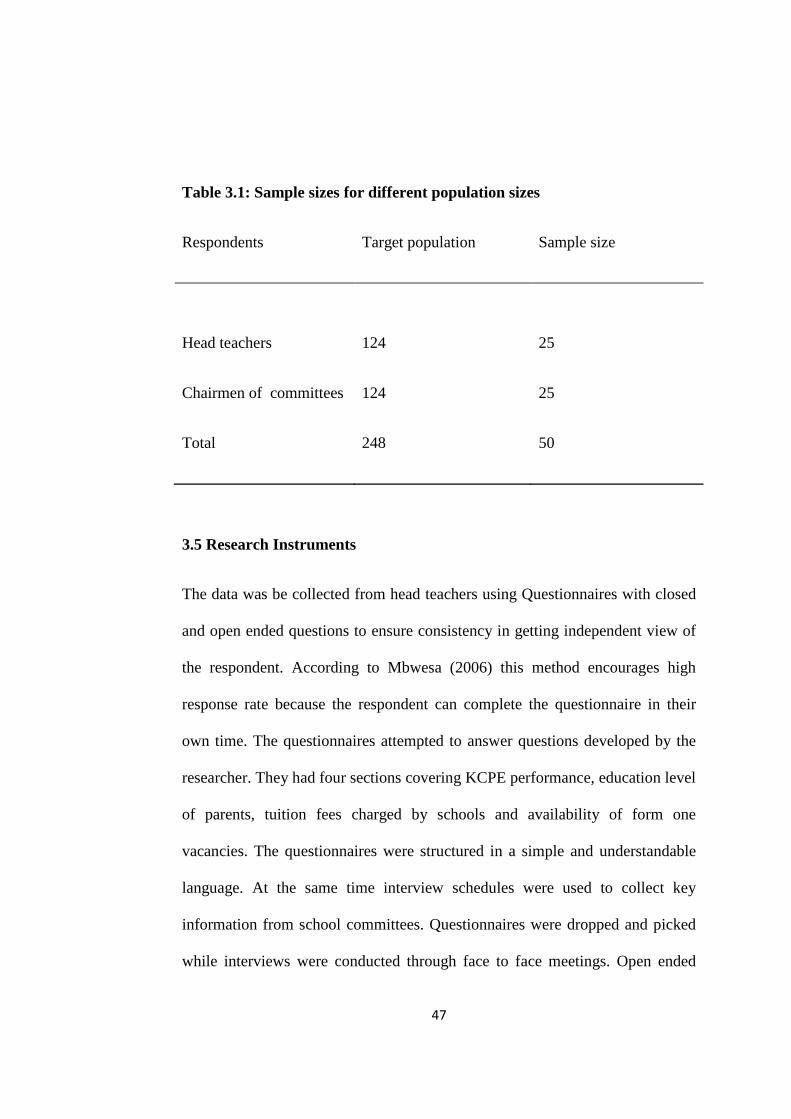
Table 3.1: Sample sizes for different population sizes
Respondents Target population Sample size
Head teachers 124 25
Chairmen of committees 124 25
Total 248 50
3.5 Research Instruments
The data was be collected from head teachers using Questionnaires with closed
and open ended questions to ensure consistency in getting independent view of
the respondent. According to Mbwesa (2006) this method encourages high
response rate because the respondent can complete the questionnaire in their
own time. The questionnaires attempted to answer questions developed by the
researcher. They had four sections covering KCPE performance, education level
of parents, tuition fees charged by schools and availability of form one
vacancies. The questionnaires were structured in a simple and understandable
language. At the same time interview schedules were used to collect key
information from school committees. Questionnaires were dropped and picked
while interviews were conducted through face to face meetings. Open ended

48
questions were included which allowed respondents to give an in-depth
response to subject of study.
3.6Instruments validity
The concept of validity ordinarily refers to the notion that an idea is
well grounded and well supported and thus one can have confidence in
it. The validity of the instruments used in this study was established by
ensuring that they are based on the objectives and then were appraised by an
expert’s in the area of educational administration and planning at the
University of Nairobi. Their ratings and comments helped in ensuring content
validity during the investigation.
3.7 Instruments Reliability.
Reliability refers to the degree of consistency with which instances are
assigned to the same category by different observers or by the same
observer on different occasions (Hammersley, 1992). The researcher used
test-retest technique in order to test the reliability of the instruments. The
instruments was given to similar subjects for the study but not used in the final
study. The same instruments were administered to the same group of subjects
after two weeks. A comparison between the responses obtained in the two tests
was made using Pearson’s correlation co-efficient formulae (r) as indicated
below.

49
r = N∑XY- ∑X ∑Y)
√[N∑X2 – (∑X)
2][N∑Y
2 – (∑Y)
2]
1/2
Where ∑xy= sum of the gross product of the values of each variables
(∑X) (∑y)=product of the sum of x and the sum of y and N= total number of
items. If the reliability of the instrument is above 0.8, it is considered to have a
very good reliability. The pilot study obtained a coefficient correlation of 0.75.
This means that the research instruments could be relied upon for the study.
3.8 Data collection procedures
The researcher sought a permit from the ministry of Higher Education,
Science and Technology through an introduction letter from the University of
Nairobi. Subsequent clearance to carry out the research was obtained from the
district commissioner and the district education officer of Meru central district.
The researcher then sought permission from the head of the target primary
schools. He personally visited each school and administered the questionnaires
after explaining to the respondents their expected roles in the research.
3.9Data analysis techniques
According to Platton (1990), one should be able to construct a framework
for communicating the sense of what the data reveals. The data collected
was verified in line with the research objectives so as to answer research
questions in a relevant manner. Data analysis started with editing and inspection
of the instruments in order to identify any wrongly responded to or un-

50
responded to items. Tables and charts were used to record information from
questionnaires. Descriptive statistics such as mean, percentages and frequency
distribution were mainly used to analyze demographic data. Descriptive
statistics were used on items on the rating scale while non-ranked was arranged
to identify the frequency. Qualitative data was gathered in non- numeric form
and the results presented descriptively. Categories containing high number of
responses were shown using the mode. The analysis was accomplished using
frequencies, tables, pie charts and graphs generated by use of the statistical
package for social sciences (SPSS). The data was then used to create frequency
and percentage tables and charts. The data was then analyzed in line with
the research questions, and objectives of the study. The study findings were
then discussed and relevant conclusions and recommendations made.
51
CHAPTER FOUR
DATA ANALYSIS, PRESENTATION AND INTERPRETATIONS
4.1 Introduction
The purpose of the study was to investigate factors that influence transition of
pupils from primary schools to secondary in Meru central district in Kenya.
This section presents the analyzed data on factors influencing transition of
pupils’ from primary to secondary schools in Meru central districts. The factors
include how academic performance of pupils’ at Kenya certificate of primary
education (K.C.P.E), influences transition from primary to secondary schools, to
determine the relationship between education level of parents and transition of
pupils’ from primary to secondary schools, to establish how tuition fees charged
students’ when joining form one affects transition of pupils’ from primary to
secondary schools and to determine how availability of form one vacancies in
secondary schools, affects transition of pupils’ from primary to secondary
schools in Meru central district. Information is presented in tables, pie-charts
and graphs according to the study objectives. Interpretation of the findings has
also been done to answer the research questions. The presentation of the
findings is organized around the key variables such as academic performance of
pupils at Kenya certificate of primary education, education level of parents of
these pupils, tuition fees required when pupils are joining form one and
availability of form one vacancies in secondary schools. The bio- data has also
been analyzed and presented to provide relevant characteristics of the
respondents.
52
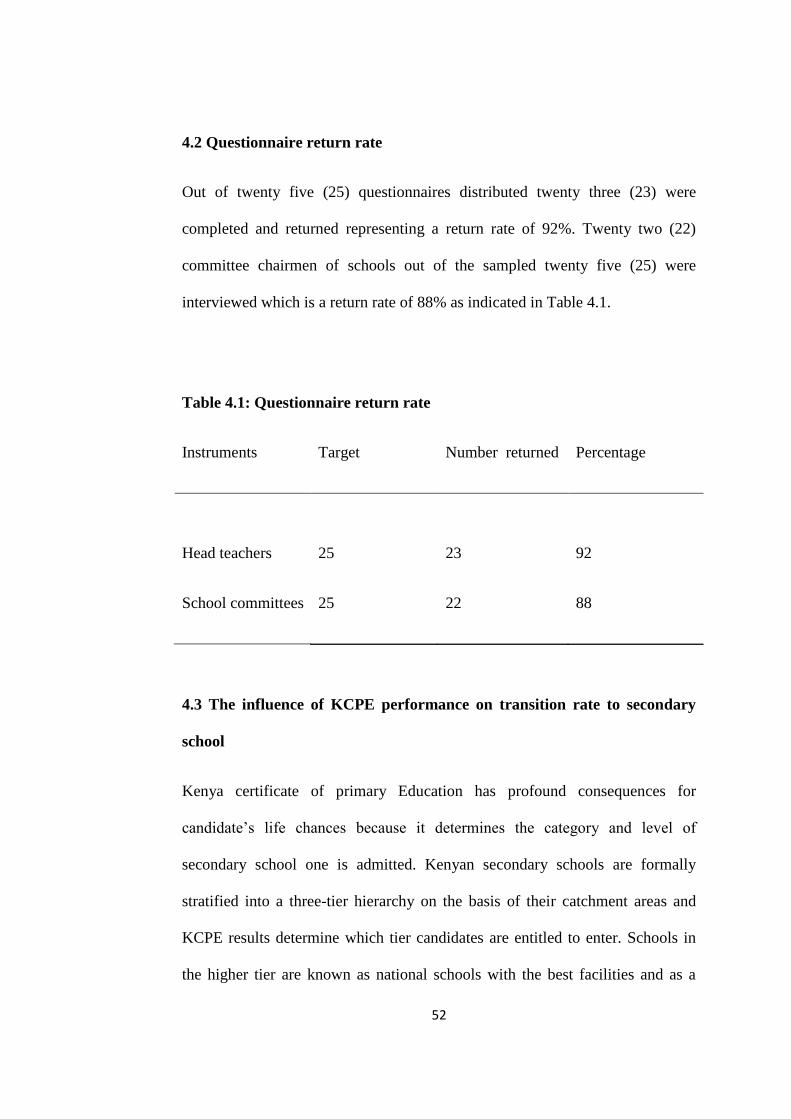
4.2 Questionnaire return rate
Out of twenty five (25) questionnaires distributed twenty three (23) were
completed and returned representing a return rate of 92%. Twenty two (22)
committee chairmen of schools out of the sampled twenty five (25) were
interviewed which is a return rate of 88% as indicated in Table 4.1.
Table 4.1: Questionnaire return rate
Instruments Target Number returned Percentage
Head teachers 25 23 92
School committees 25 22 88
4.3 The influence of KCPE performance on transition rate to secondary
school
Kenya certificate of primary Education has profound consequences for
candidate’s life chances because it determines the category and level of
secondary school one is admitted. Kenyan secondary schools are formally
stratified into a three-tier hierarchy on the basis of their catchment areas and
KCPE results determine which tier candidates are entitled to enter. Schools in
the higher tier are known as national schools with the best facilities and as a
53
result require high qualifications for admission. The second tier is made up of
provincial secondary schools which are equally competitive and require high
KCPE scores for admission. The district secondary schools form the lowest
category and so are their facilities. When the pupils’ sit KCPE, this marks the
last level of primary education system and it ushers them to the next level in the
education system. Though a system is a self- contained unit, it is part of a wider
higher order, and is organized in a series such that the output of one is the input
for another subsystem.
4.3.1Relationship between admission to secondary school and KCPE score
The secondary school students are admitted to have direct relationship with the
KCPE score attained. This means that the students who score high marks are
admitted to national or provincial schools while the low academic performers
are admitted to district schools in the neighborhood. Information on Table 4.2
and 4.3 illustrates this relationship.
54
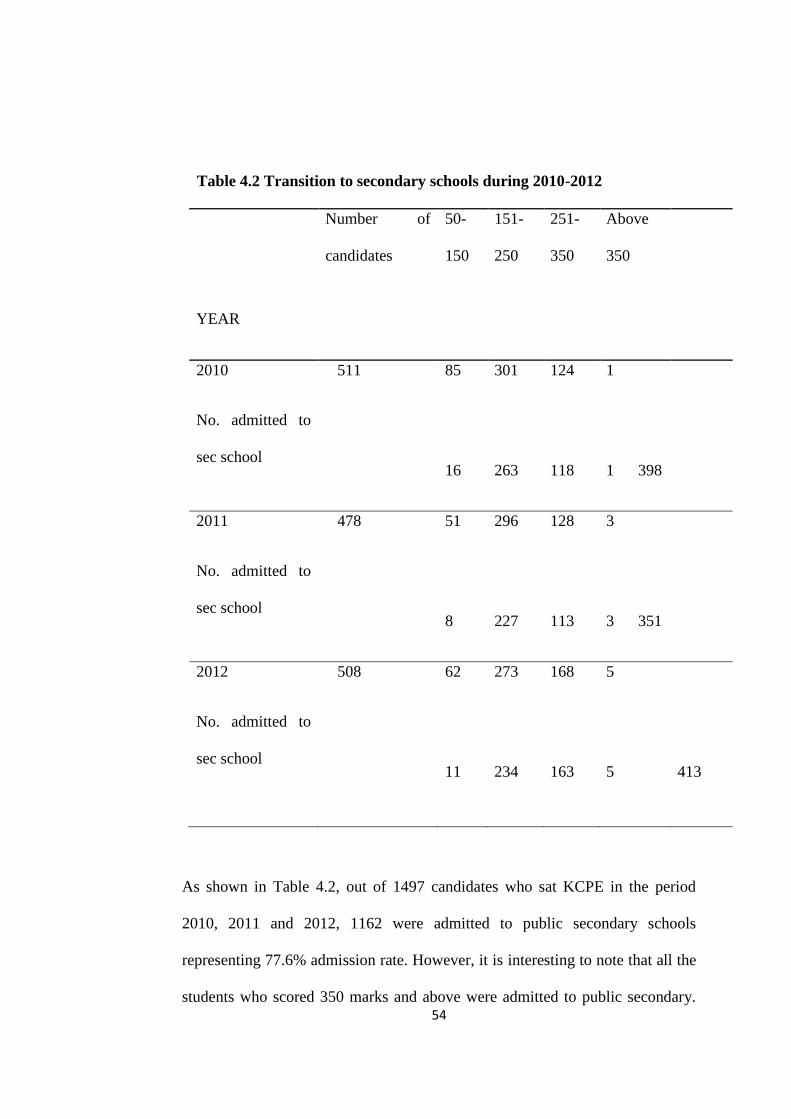
Table 4.2 Transition to secondary schools during 2010-2012
YEAR
Number of
candidates
50-
150
151-
250
251-
350
Above
350
2010
No. admitted to
sec school
511 85
16
301
263
124
118
1
1 398
2011
No. admitted to
sec school
478
51
8
296
227
128
113
3
3 351
2012
No. admitted to
sec school
508
62
11
273
234
168
163
5
5
413
As shown in Table 4.2, out of 1497 candidates who sat KCPE in the period
2010, 2011 and 2012, 1162 were admitted to public secondary schools
representing 77.6% admission rate. However, it is interesting to note that all the
students who scored 350 marks and above were admitted to public secondary.

55
The category that registered the lowest admission during the period in question
was 50-150 where only 35 were admitted out of 198 leaving out 163. Table 4.3
indicates admissions in percentages in each category.
Table 4.3 Percentage comparison of admissions and non-admission
Year %
admission
50-150
%
admission
151-250
%
admission
251-350
%
admission
Above 351
2010 Admitted 18.8 87.4 92.8 100
Not/adm 81.2 12.6 7.2 0
2011 Admitted 15.7 76.7 88.3 100
Not/adm 84.3 23.3 11.7 0
2012 Admitted 17.7 84.8 97.0 100
N/adm 82.3 15.2 3.0 0
The category of 351 and above registered 100% admission to secondary schools
during the three years studied. This was followed by 251-350 that had 92.8 % in
2010, 88.3% in2011 and 97% in 2012.The lower score of 151-150 also
registered an impressive rate of admission with 87.4% in 2010, 76.7% in 2011

56
and 84.8% in 2012. The lower category of 50-150 increase in the reverse where
those not admitted made 81.2 % in 2010, 84.3% in 2011 and 82.3% in 2012. In
addition the committee members were asked to comment on whether there is a
relationship between KCPE performance and admission to form one and their
responses are presented in Table 4.4.
Table 4.4: Parents responses on KCPE performance
Responses Yes No
Relationship between
KCPE and form one
admission
18 4
If all students are
admitted
6 14
In addition the school committees interviewed agreed that there is a strong
relationship between KCPE score and form one admission. Out of the 22
committee members interviewed 18 agreed that there is a strong relationship
between form one admission and KCPE scores student attained. On the
question of whether all candidates who sits KCPE transit to secondary schools,
14 of the committees’ members disagreed meaning that not all candidates
manage to join secondary school. This response may have been made in

57
reference to the candidates scoring below 150 marks who registered the lowest
rate of admission.
School committee members and head teachers were asked to give reasons that
contribute to poor performance in the district. Their responses are indicated on
Table 4.5.
Table 4.5 Reasons for poor performance
Reasons on KCPE
performance
Frequency Percentage
Negative attitude of
students
31 70.5
Illiteracy levels of
parents
21 47.7
Lack of role models 13 29.5
Inadequate teachers in
school
37 84.1
Societal attitudes 18 40.9
Lack of community
support
24 54.5
Chronic absenteeism of 17 37.8

58
pupils
Teachers’ contribution is of paramount significance in the learning process and
this may be the reason why majority (85.1%) of the respondents attributed poor
to poor performance in KCPE in the district. This is because schools lacked
enough teachers hence parents had employed untrained teachers (school
leavers), to help the children. This is followed by negative attitude of students
towards education which was cited by 70.5% of the respondents. Good
performance is a collective initiative of teachers and parents. This may explains
why the study established that some students opt to seek informal employment
instead of continuing to secondary schools. Things are not made better by the
fact that community does not support education, illiteracy of parents, and lack
of role models among others hence education is left to the teachers only.
4.4 Influence of level of education of parents on transition to secondary
schools
The parent’s level of education has a lot of influence on schooling of children
because the more educated parents are, the more likely they are to enroll their
children and push them through school (Holmes, 2003).Questions were asked in
this regard and the findings are as follows.
4.4.1. Level of education of parents

59
The committee members were requested to indicate the education level of
parents in their schools. The findings are shown on Table 4.6
Table 4.6 Education level of parents
Responses Frequencies
None
Primary
2
15
Secondary
Total
4
21
The responses show that majority of parents have primary education, with some
having none at all. This is likely to have a relationship with the high number of
candidates scoring low marks, as most parents lack the ability to assist their
children with school work. Parents with such levels of education may not
precisely know the importance of education.
To establish how education level influenced transition rates the respondents
were asked to indicate whether they agreed if the parents in the district were
educated and the findings are shown in Figure 4.1.
60
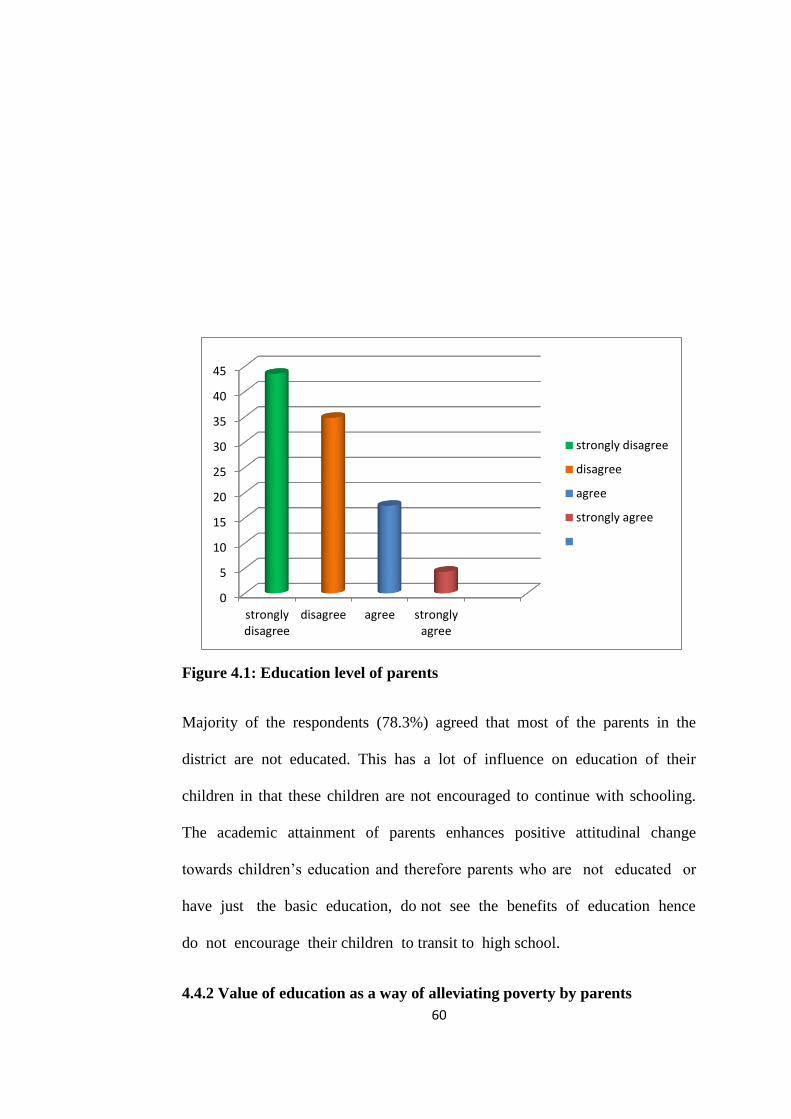
Figure 4.1: Education level of parents
Majority of the respondents (78.3%) agreed that most of the parents in the
district are not educated. This has a lot of influence on education of their
children in that these children are not encouraged to continue with schooling.
The academic attainment of parents enhances positive attitudinal change
towards children’s education and therefore parents who are not educated or
have just the basic education, do not see the benefits of education hence
do not encourage their children to transit to high school.
4.4.2 Value of education as a way of alleviating poverty by parents
0
5
10
15
20
25
30
35
40
45
stronglydisagree
disagree agree stronglyagree
strongly disagree
disagree
agree
strongly agree
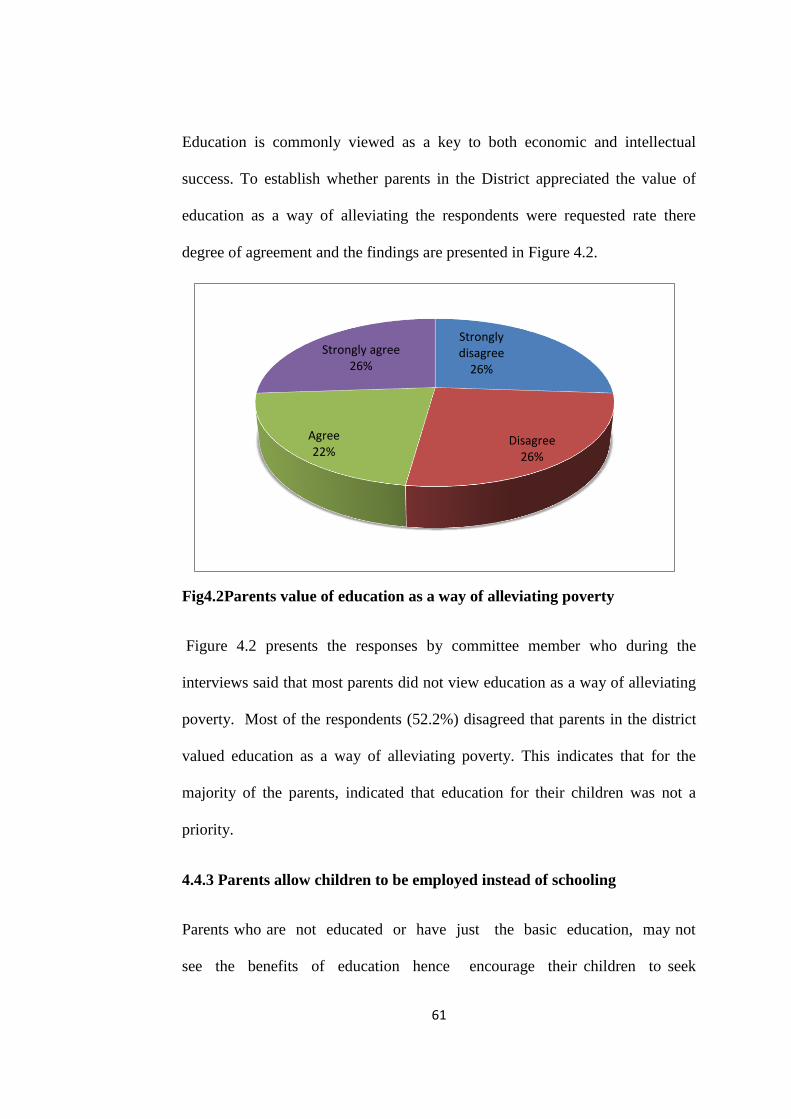
61
Education is commonly viewed as a key to both economic and intellectual
success. To establish whether parents in the District appreciated the value of
education as a way of alleviating the respondents were requested rate there
degree of agreement and the findings are presented in Figure 4.2.
Fig4.2Parents value of education as a way of alleviating poverty
Figure 4.2 presents the responses by committee member who during the
interviews said that most parents did not view education as a way of alleviating
poverty. Most of the respondents (52.2%) disagreed that parents in the district
valued education as a way of alleviating poverty. This indicates that for the
majority of the parents, indicated that education for their children was not a
priority.
4.4.3 Parents allow children to be employed instead of schooling
Parents who are not educated or have just the basic education, may not
see the benefits of education hence encourage their children to seek
Strongly disagree
26%
Disagree 26%
Agree 22%
Strongly agree 26%

62
employment instead of transiting to secondary school. To establish if education
was a priority for parents in Meru Central the respondents were requested to
indicate their degree of agreement with the statement whether parents allow
children to be employed instead of schooling. The findings are presented on
Table 4.7, and Fig 4.3
Table 4.7 Whether parents encourage their children to join secondary
school
Responses Yes sNo
Parents encourage
their students to
join secondary
school
9 12
0
5
10
15
20
25
30
35
40
45
50
stronglydisagree
disagree agree stronglyagree
strongly disagree
disagree
agree
strongly agree

63
Fig 4.3 Parents allowing children to be employed
Interviews held with school committee members revealed that parents do not
encourage their children to join secondary schools as shown in Table4.7. As
indicated in fig4.3, significant percentage (47.8%) agreed that some parents in
the district would allow their children to seek employment after KCPE instead
of continuing to secondary school.
4.4.4 Parents assisting their children with school work
Parents are effective in helping their children in academic work and also
monitor and supervise their children’s academic progress as established in the
literature review. To establish whether parents in the district assisted their
children with school work, the respondents were requested to indicate their
degree of agreement with the statement and the findings are presented in Fig
4.4
Strongly disagree
22%
Disagree 52%
Agree 22%
Strongly agree 4%

64
Fig4.4 Parents assisting their children with school work
Majority of the respondents ( 73.9%) indicated that parents in the district were
not keen in assisting their children with school work.This may be attributed to
the revelation by the study that most parents in the district were not educated
and that education for their children was not a priority. Findings on whether
parents influence their children to drop out of school are indicated in Table 4.8.
Table 4.8 Parents influence students to drop out of school
Frequenc
y
Percent
strongly
disagree
8 13.0
Disagree 6 26.1
Agree 6 26.1
strongly agree 3 34.8
Total 23 100.0
The study established from 60.9% of the respondent that, parents encourage
their children to drop out of school. This explains why there are children who
complete standard eight and do not transit to secondary school. This was
supported by reports from parent’s interview that parents engage their children
in farm work at the expense of education; hence children do not attend holiday
and weekend free tuition that teachers are willing to offer them. Questions were

65
asked on whether parents organize private tuition for their children and results
are indicated in Table 4.9.
Table 4.9 Parents organize private tuition for their children
Frequency Percent
strongly disagree 11 47.8
Disagree 5 21.7
Agree 3 13.0
strongly agree 4 17.4
Total 23 100.0
Majority of the respondent (69.5%) agreed that parents do not organize private
tuition for their children as indicated in table 4.9. This serves to explain why
performance in the district has been poor, because children are not encouraged
to achieve even from home by their parents. Parent’s level of education has a lot
of impact on schooling of children because the more educated parents are, the
more likely they are to enroll their children and push them through school.
Parental decisions affect children retention in a school system such that
students, whose parents monitor and regulate their activities, provide them with
emotional support and encourage independent decision.
4.4.5 Parents attend school meetings promptly
Questions were asked to find out whether parents attend school meeting
promptly as a way of measuring their commitment to education of their
children. Their responses are indicated in Table 4.10, and Fig 4.5.
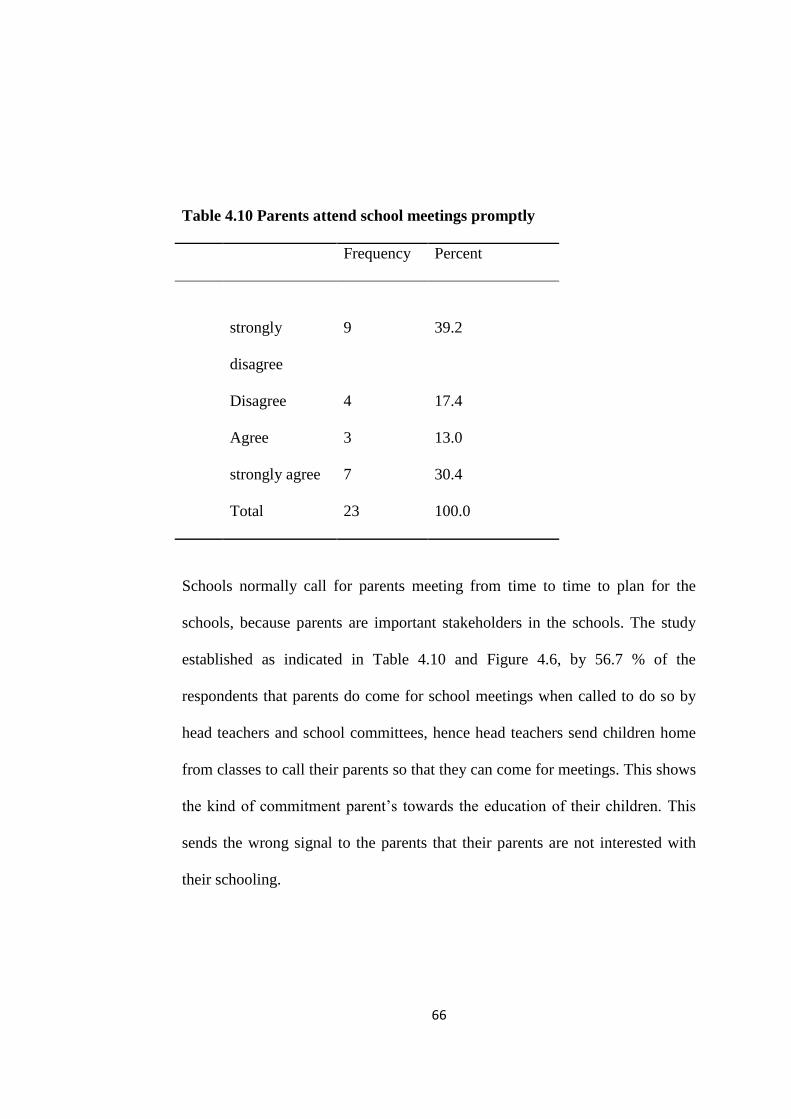
66
Table 4.10 Parents attend school meetings promptly
Frequency Percent
strongly
disagree
9 39.2
Disagree 4 17.4
Agree 3 13.0
strongly agree 7 30.4
Total 23 100.0
Schools normally call for parents meeting from time to time to plan for the
schools, because parents are important stakeholders in the schools. The study
established as indicated in Table 4.10 and Figure 4.6, by 56.7 % of the
respondents that parents do come for school meetings when called to do so by
head teachers and school committees, hence head teachers send children home
from classes to call their parents so that they can come for meetings. This shows
the kind of commitment parent’s towards the education of their children. This
sends the wrong signal to the parents that their parents are not interested with
their schooling.

67
Fig 4.5 Parents attend school meetings promptly
4.4.6 Effects of parents level of education on transition
Questions were asked to find out whether parents attend school meeting
promptly as a way of measuring their commitment to education of their
children. Their responses are indicated in Table 4.11
Table 4.11 Effects of parents’ level of education on transition
Effects of parents education level
on transition of pupils
Frequency Percentage
33.3
Lack of parental motivation 15
Frequent absenteeism 29 64.4
Child labor 18 40.0
The interviews conducted among the committee members indicated in Table
4.11 showed that student absenteeism was very common among the students
strongly disagree
39%
Disagree 18%
Agree 13%
Stongly agrr 30%

68
standing at 64.4% followed by child labor at 40% meaning that parents to a
large extent allowed their children to provide labor instead of schooling. This in
return affected the performance of the students in school as well.
4.5 Influence of tuition Fees charged on transition to secondary schools
Parents are required to meet some operational costs such as tuition and
maintenance fees and may be required to pay for many other things including
food, uniforms, learning materials, and special equipment when their children
are joining form one.
4.5.1 Failure to join secondary school due to lack of school fees
To establish whether this requirement influences transition to secondary
education, the respondents were asked to indicate whether there were students
admitted to secondary schools and failed to join due to lack of fees. The
findings are recorded in Table 4.12.
Table 4.12 Failure to join secondary school due to lack of school fees
Responses Frequency Percent
Yes 19 82.6
No 4 17.4
Total 23 100.0

69
Most of the respondents (82.6%) indicated that there were students in the
district who fail to join secondary school due to lack of school fees. This relates
with the revelation by the study that there were parents willing to allow their
children take up employment other than joining secondary school.
4.5.2 Adequacy of government investment in education
Even after the government moved to provide free day secondary education
system, the cost of education to households in Kenya continues to remain high
for many to attend secondary school. This is evident from the findings shown on
Table 4.13.
Table 4.13 Adequacy of government investment in education
Frequency Percent
Yes 1 4.3
No 22 95.7
Total 23 100.0
Majority (95.7%) of the respondents indicated that the government investment
in education was not adequate. This may explain why some students whose
parents could not raise school requirements, did not join form one since the
government intervention to assist them was inadequate and at times not
available.

70
4.5.3 Difficulties in raising fees
Parents and guardians are expected to raise fees and other requirements for their
children to join secondary school and some households may find difficulties in
doing this as established in the literature reviewed. To find out if this was
experienced in Meru Central the respondents were requested to indicate whether
parents had difficulties in raising fees and the findings are shown on Table 4.14.
Table 4.14 Difficulties in raising fees
Frequency Percent
Yes 19 82.6
No 4 17.4
Total 23 100.0
It is evident that most parents and guardians had difficulties raising school fees
for their children to join form one as indicated by 82.6% of the respondents and
only 17.4% had no difficulties in raising fees for their children. This may be one
of the reasons why some did not attend school though admitted in secondary
schools.

71
4.6 Availability of form one vacancies in secondary schools
A significant number of studies have observed that, the uneven distribution of
educational opportunities between regions, both in urban and rural
environments. This wanted to establish whether distance between home and
school as well as availability of equipped schools influenced transition from
primary to secondary schools.
4.6.1 The influence of distance between home and school
The study wanted to establish whether distance between home and school
affected transition from primary to secondary schools in Meru Central and the
findings are indicated in Table 4.15.

72
Table 4.15 Influence of distance between home and school
Frequency Percent
strongly disagree 12 52.2
Disagree 3 13.0
Agree 5 21.7
strongly agree 3 13.0
Total 23 100.0
Majority of the respondents (65.5 %) tended to disagree with the possibility of
distance between school and home being of significant influence on transition to
secondary schools. This may be as a result of construction of day secondary
schools in most rural areas in the country making secondary schools available
within walking distances. This is also confirmed the findings from interviews
from school committee representatives. However where education is not a
priority the CDF funds that other areas have used to increase secondary schools
are used for other development agenda and this explains why a significant
number of respondents (34.7%) agreed that distance between home and school
affected transition from primary to secondary schools in in some parts of Meru
Central.
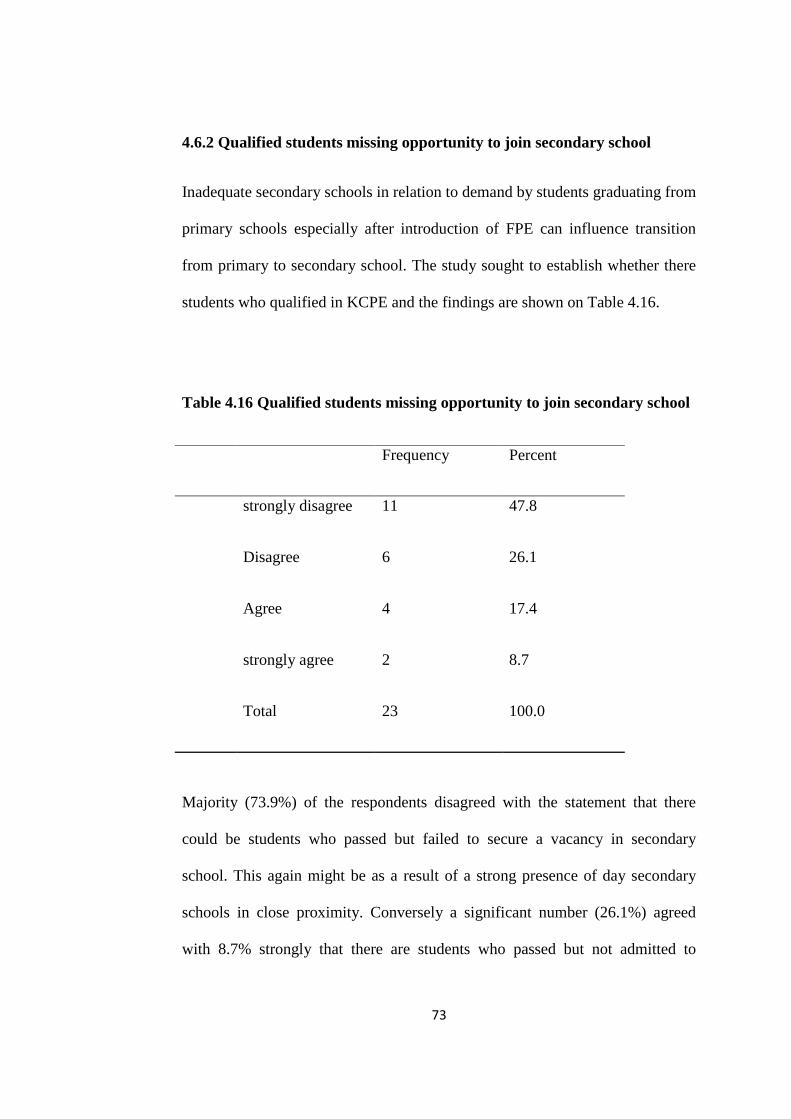
73
4.6.2 Qualified students missing opportunity to join secondary school
Inadequate secondary schools in relation to demand by students graduating from
primary schools especially after introduction of FPE can influence transition
from primary to secondary school. The study sought to establish whether there
students who qualified in KCPE and the findings are shown on Table 4.16.
Table 4.16 Qualified students missing opportunity to join secondary school
Majority (73.9%) of the respondents disagreed with the statement that there
could be students who passed but failed to secure a vacancy in secondary
school. This again might be as a result of a strong presence of day secondary
schools in close proximity. Conversely a significant number (26.1%) agreed
with 8.7% strongly that there are students who passed but not admitted to
Frequency Percent
strongly disagree 11 47.8
Disagree 6 26.1
Agree 4 17.4
strongly agree 2 8.7
Total 23 100.0

74
secondary schools. This is likely to be the group that felt that the form one
selection criteria was not fair to all students.
4.6.3 Adequacy of secondary schools in the district
Lack of schools within a reasonable walking distance for those in poor regions
is a serious barrier to transition, especially in rural and remote parts of
countries. The study sought to establish whether there were enough secondary
schools in the district to guarantee transition of learners to secondary school. To
establish this, the respondents were requested to indicate whether there are
enough secondary schools in the district and the findings are indicated in Fig
4.6.
Fig 4.6 Adequacy of secondary schools in the district
Most (60.8%) of the respondents agreed that there were enough schools in the
district while significant percentage (39.1%) felt that the schools where not
enough. This may be the reason why some students lacked form one vacancies
despite the fact that they had passed in KCPE. The head teachers and school
Strongly disagree
13%
Disagree 26%
Agree 39%
Strongly agree 22%
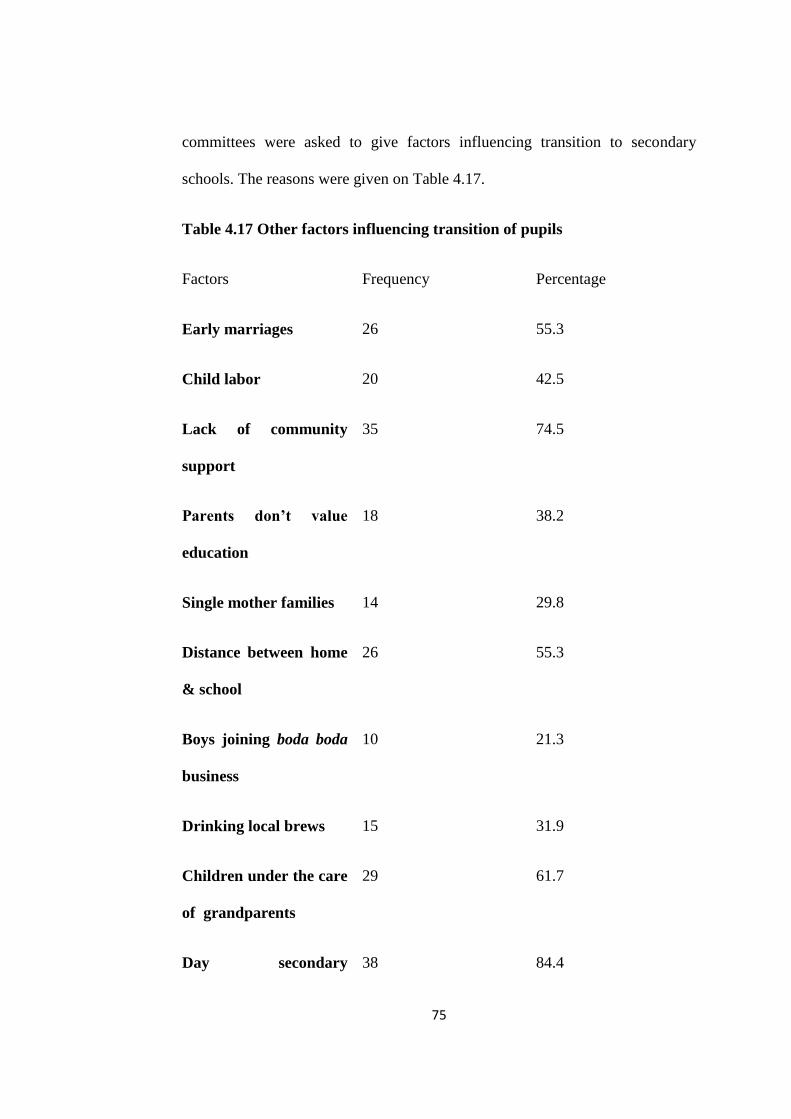
75
committees were asked to give factors influencing transition to secondary
schools. The reasons were given on Table 4.17.
Table 4.17 Other factors influencing transition of pupils
Factors Frequency Percentage
Early marriages 26 55.3
Child labor 20 42.5
Lack of community
support
35 74.5
Parents don’t value
education
18 38.2
Single mother families 14 29.8
Distance between home
& school
26 55.3
Boys joining boda boda
business
10 21.3
Drinking local brews 15 31.9
Children under the care
of grandparents
29 61.7
Day secondary 38 84.4

76
education
Though there are many factors affecting transition of pupils’ from primary
schools to secondary schools in the district, as cited by the respondent, those
with greatest influence include, lack of community support (74.5%), children
under the care of grandparents (61.7%), distance between home and school
(55.3%) and early marriages (55.3%). This explains why many students are not
able to join secondary schools because grandparents may not afford to raise
school fees. Education is lacking adequate support in the district because many
parents are not educated therefore they do not value education as a way of
alleviating poverty, hence they encourage their children to take up employment
instead of transiting to secondary.

77
CHAPTER FIVE
SUMMARY, CONCLUSIONS AND RECOMMENDATIONS
5.1 Introduction
This chapter covers the summary of the findings of the study on factors
influencing transition of pupils from primary to secondary schools in Meru
central district; conclusions made from the findings and the recommendations
derived from the study respectively.
5.2 Summary of the study and research findings
The purpose of the study was to establish the factors influencing transition of
pupils’ from primary to secondary schools in Meru central district. The study
established that a system has some predictability and this is also similar to a
school since those who enter standard one are expected to exit after standard
eight. The functioning of a system is affected by its environment. Parents are
key players and form part of the environment of an education system, because
they influence or motivate the pupils to continue with school or not to, and they

78
meet the cost of schooling for their children and especially when transiting to
form one. A system is governed by feedback. The KCPE performance provides
this feedback on how the system is fairing. The study established that during
the period 2010 - 2012 out of the 1497 students who sat KCPE, 335 were not
admitted to any secondary school. This shows that there are students in the
district who were not benefiting from secondary education. Specific factors
influencing transition from primary to secondary schools investigated in the
study included academic performance in KCPE, Education level of parents,
tuition fees charged students when joining form one and availability of form one
vacancies in secondary schools as discussed in this chapter.
5.2.1 Academic performance in KCPE examinations
In Kenya, good performance at KCPE Examination enhances pupil’s transition
to good public secondary schools. The study established that KCPE
performance had a great influence on the opportunities and the kind of schools
candidates are admitted to. In line with this, the study established that those
who scored 350 and above in KCPE in the period 2010-2012 were all admitted
to public secondary schools, however these were only 9(0.006%) out of 1497.
Those who scored 251-350 were not badly off since out of 420 candidates, only
26 (0.06%) failed to obtain a vacancy in public schools. On the contrary those
that scored 151-250, out of 870 candidates 146 (16.8%) were not admitted to
any secondary school. The worst hit category was that which scored 50-150
marks because out of 198 candidates 163 (82.3%) were not admitted to any

79
public secondary school. The study established that candidates in the district
were performing poorly in KCPE and this affected their chances of securing
admission in national and provincial schools.
5.2.2 Education level of the parents
Educated parents are likely to provide a more conducive learning environment
for their children at home and also encourage them to transit to secondary
schools. The study established that most parents in the district have just primary
education as their highest level of academic attainment, according to
information given by the school committees. As a result parents do not value
education hence education of their children is not a priority as indicated by
52.2% of the respondent. They also allow their children to get employed instead
of schooling.
At the same time the study established that parents were not keen in assisting
their children with school work as indicated by 73.9% of the respondent.
Interviews conducted among school committees also revealed that the
community does not support education and most children are under the care of
grandparents who are likely to have no education at all. The study has
established that the level of education of the parents is affecting transition of
students from primary to secondary school in the district in that they lack

80
capacity to play their role effectively as far as education of their children is
concerned.
5.2.3 Tuition fees charged students when joining form one
Households shoulder a large portion of secondary education costs and for poor
households, this can be a challenge. The study established that there were
students who failed to join secondary schools due to lack of tuition fees as
indicated by 82.6% of the respondents. The governments investment in
education was not enough as established from 95.7% of the respondents, hence
the schools charge high tuition fees to cater for various school cost. This
explains why some of the students admitted to secondary schools, after passing
KCPE did not proceed. It was further established from the committees that the
student who lack school fees end up taking the less demanding alternatives like
boda boda business, child labor and drinking local brews. The study therefore
established that, lack of tuition fees is a key barrier to transition to secondary
school and especially for children from the poor households.
5.2.4 Availability of form one vacancies in secondary schools
Transition from primary to secondary schools is pegged on the number of
available vacancies in secondary schools. The study established from 65.5%
of the respondent that the distance between home and school had little influence
on transition of students probably due to provision of many day secondary
schools in the district since the introduction subsidized secondary education. A

81
substantial 34.8% of the respondents agreed that there were students who passed
KCPE but lacked form one vacancies. A further 39.1% of the respondents
indicated that the secondary schools in the district were not enough. This helps
to explain why there are students who pass KCPE and lack form one admission
in secondary schools.
5.3 Conclusions
Progression of learners from one level of education to another is a measure of a
schooling system internal efficiency as well as its physical capacity. However,
transition from primary to secondary schools in Meru central has remained low
over the years despite the introduction of day secondary education. This study
concluded that many students completing primary education are not progressing
to secondary school due to poor performance in KCPE, and therefore measures
should be taken to improve KCPE performance, since many candidates are
scoring below 250 marks. Poor performance leads many students to be left out
of schooling system, leading to early marriages, drinking liquor, child labor
among others. Furthermore, low levels of parent’s education were found to be a
hindrance to transition in that, besides not encouraging their children to
continue with secondary education, they did assist them with school work,
motivate them to continue with education and on the contrary encouraged them
to join informal employment. Therefore there is need to take measures that will
lead to change of attitude of parents in favor of education.

82
The study established that tuition fees prohibited students who passed KCPE
from proceeding with secondary education. Many poor households had
difficulties meeting the requirements for joining form one hence their children
end up taking other less progressive alternatives shown in the summary. There
need for more government support of education targeting the poor households
because education is the most effective way of breaking the vicious cycle of
poverty. The study further established that not all students who passed with at
least 200 marks and above were admitted in secondary schools due limitation in
vacancies. Measures should be put in place to expand secondary school learning
infrastructure to accommodate all qualified candidates in the school system.
5.4 Recommendations
Secondary education is very important for many individuals, because it
improves their standards of living when they get jobs, and determines their
future life chances and mobility out of poverty. Transition to secondary
education is beneficial in more than economic and social development because
it promotes active citizenship as well as enhances social cohesion by increasing
trust and tolerance amongst individuals. In order to obtain these benefits of
secondary education in Meru Central, a lot of deliberate measures need to be
taken to overcome the existing challenges.
Based on the findings of the study, the following recommendations were made;
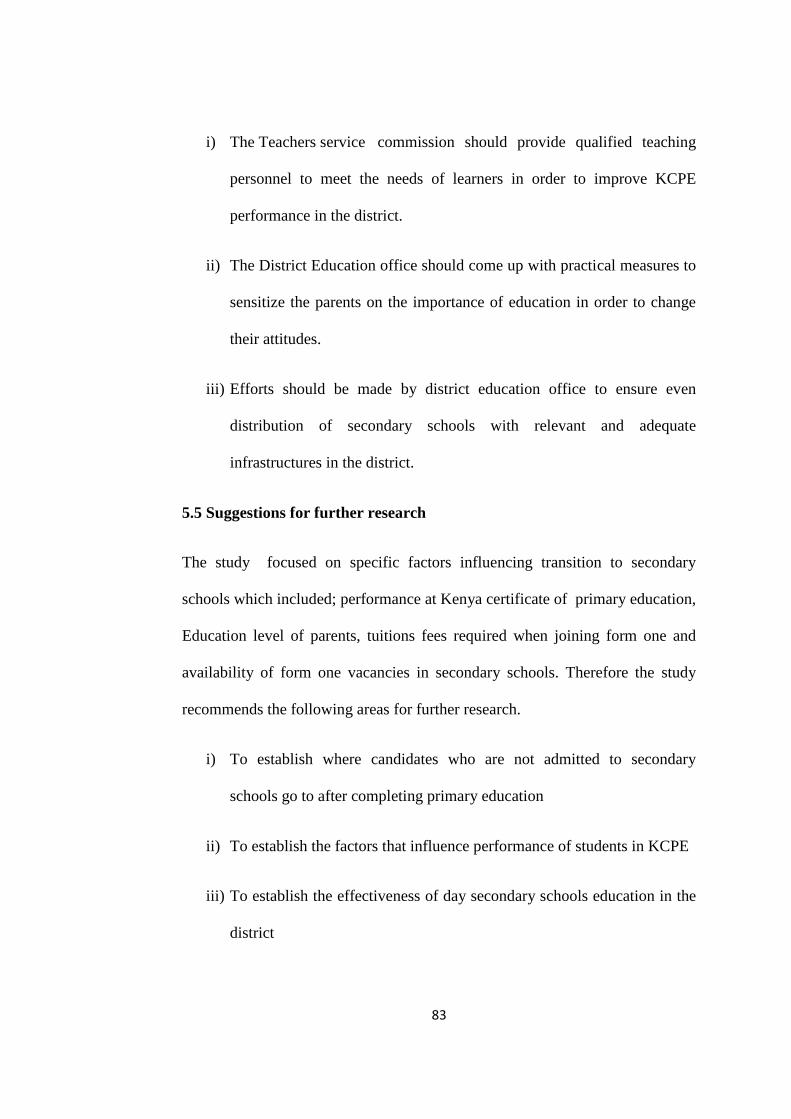
83
i) The Teachers service commission should provide qualified teaching
personnel to meet the needs of learners in order to improve KCPE
performance in the district.
ii) The District Education office should come up with practical measures to
sensitize the parents on the importance of education in order to change
their attitudes.
iii) Efforts should be made by district education office to ensure even
distribution of secondary schools with relevant and adequate
infrastructures in the district.
5.5 Suggestions for further research
The study focused on specific factors influencing transition to secondary
schools which included; performance at Kenya certificate of primary education,
Education level of parents, tuitions fees required when joining form one and
availability of form one vacancies in secondary schools. Therefore the study
recommends the following areas for further research.
i) To establish where candidates who are not admitted to secondary
schools go to after completing primary education
ii) To establish the factors that influence performance of students in KCPE
iii) To establish the effectiveness of day secondary schools education in the
district

84
REFERENCES
African population and Health research, (2007), factors affecting transition
to secondary education in Africa. Nairobi. Kenya.
Alston, M, Kent, K.(2006) The impact of drought on secondary
education access in Australia‟s rural and remote areas. Report
to Dest and the Rural Education Programme of FRRR, centre
for rural Social Research (ILWS), Charles sturt
UniversityWaggaWaggaAustralia
Bedi, A.s, Kimalu, P.K. Manda, D.K. Nafula, N.N(2004), The decline in
Primary School enrollment in Kenya”. Journal of African
Economies, volume 13 No.1
Chimombo, JPG.(2005), Issues in basic education in developing
countries, an exploration of policy options for improved
delivery.Journal of international cooperation in Education
volume 8 No. 1:

85
Cohen, L. &Manion, L (1989), Research Methods in Education (3rd
edition) London, RouthedgecoomsP.h . The world Education
crisis. New York: Oxford University press
CREATE (2009),Dropping Out From School, Policy Brief No 8,CREATE,
University of Sussex, Brighton, UK
DeStefano, J.etal( 2006). Meeting EFA: Reaching the Underserved through
Complementary Models of Effective Schooling. Washington
D.C. Academy for Educational development and
USAID-funded EQUIP2.
Di Gropello, E.( 2006). Meeting the Challenges of Secodnary Education in
Latin America and East Asia: Improving Efficiency and Resource
Mobilization. Washington D.C.: The International Bank for
Reconstruction and Development.
EFA Global Monitoring Report (2010) Reaching the Marginalized:
Education for All, Oxford University Press, Oxford, UK
Gentler, P.Glewwe, p. (1989), The Willingness to pay for Education in
Developing Countries Evidence from Peru. The
worldBank,Washington, Dc. LMS WP/5
Government of Kenya. (2005). Sessional paper No 1 of 2005 on policy
Framework for Education, Training and Research. Nairobi:
Government printer.

86
Government of Kenya( 2007), republic of Kenya –European community
country strategy paper for 2008-2013.
Hammersley,M. (1992), What‟s wrong with Ethnography:
Methodological explorations. London: Routledge.
Holmes, J. (2003), Measuring the Determinants of School Completion in
Pakistan: Analysis of Censoring and Selection Bias.Economics of
Education Review 22.
Horn, L., (1992). A Profile of Parents of Eighth Graders: National Education
Study of 1988. Statistical Analysis Report.Washington, National Center for
Longitudinal Educational Statistics, Office of Education Research and
Improvement, U.S. Department of Education, July 1992
Keriga, L. & prof. AbdallaBujra(2009), Social policy, Development and
governance in Kenya. An evaluation and profile of Education in
Kenya: by Development policy Management forum (Dpmf).
Nairobi.
Kimalu, P.K.N. et al (2001), Education Indicators in Kenya.Kippra
Working paper No. 4 Nairobi: Kenya Institute of public policy
Research and Analysis.
Kombo, M.K.& Tromp, E.A (2006) proposal and thesis writing. An
introduction , Pauline‖spublication Nairobi

87
Kakuru, D. Muhwezi (2003).: Gender Sensitive Educational Policy and
Practice Uganda Case study. International Bureau of Education
Kasente, D. (2003). Gender and Education in Uganda: A Case Study for
Monitoring Report.Makerere University
Ngware et al, (2006), Improving access to secondary education in Kenya:
what can be done? Emerald group publishing LTD.
Leclercq, F. (2001).“Patterns and Determinants of Elementary School
Enrolment in RuralNorth India‖, Working paper, TEAM-CNRS,
Universite de Paris 1, Paris.
Lewin, K. & Francoise Cailloids.( 2001). Financing Secondary Education
in Developing Countries: Strategies for Sustainable Growth. Paris,
France: International Institute for Educational Planning/UNESCO.
Lewin, K.M. (2007) Expanding Access to Secondary Schooling in Sub-
Saharan Africa: Key Planning and Finance Issues. CREATE
Pathways to Access Research Monograph No.
8.Brighton:University of Sussex.
Mann, D. (1989)"Effective Schools as a Dropout Prevention Strategy."
NAASP Bulletin
Mbwesa J.K (2006) , Introduction to Management Research. A student
Hand Book, Basic Modern Management Con Nairobi Kenya

88
Meru central district education, (2012) KCPE Examinations office result
analysis
Ministry of education, (2012) KCPE National result analysis
Mugenda, N.O.&Mugenda, A,G.(2003). Research Methods: Quantitative and
qualitative approaches.Nairobi:Acts press.
Obua, A. (2011) „The abolition of secondary school fees in Kenya: Responses
by the poor‟,International Journal of Educational Development, Vol.
31(4),
Otieno and Colclough, (2009), Financing Education in
Kenya.Expenditures, outcomes and the role of international aid.
Kenyatta university and University of Cambridge.
Orodho, J .A(2005), Techniques for writing Research proposals and
Reports .New York; Prentice Hall
Psacharopoulos,G.(1985). Education for Development.An Analysis of
Investment Choices.Oxford University Press
Rumberger, W. R., (2001). Who Drops Out of School and Why? Paper
prepared for theNational Research Council, Committee on Educational
Excellence and Testing Equity Workshop. Washington DC.
SEIA.(2007). At the Crossroads: Choices for Secondary Education in Sub-
Saharan Africa. Washington D.C.: The World Bank.
89
Scott, F.( 2001).―Developing Human Resources for Effective School
Management in Small Caribbean States.”International Journal of
Educational Development.vol.
Swada Y., &Lokshin M., (2001).―Household Schooling Decisions in Rural
Pakistan”.Policy Research Working paper series no.2541.The World
Bank, Washington Weitzman E.A. (2003), “School Supply background
and gender specific school senrollment and attainment in
sudan”. Eastern African social science research reviewvolume 10.
No 2,
World Bank, (2005).World Development Report: Investment, Climate,
Growth, and Poverty. World Bank
World Bank.( 2006). Global Monitoring Report: MDG: Strengthening
Mutaul Accountability, Air, Trade, and Governance. Washington D.C.:
The International bank for Reconstruction and Development.
World Bank, A. H. D. D.( 2007). Secondary Education in Africa: At the
Cross Roads: Choices for Secondary Education and training in Sub-
Saharan Africa. Washington D.C.: SEIA and the World
World Bank (2008), Transitions in Secondary Education in Sub-Saharan
Africa Equity and Efficiency Issues, Working Paper No125, World
Bank, Washington DC,
World Bank (2011) World Bank Support to Education Since 2001, The
World Bank, Washington DC, USA

90
Zeedyk, M.S., et al. (2003)Negotiating the Transition from Primary to
Secondary School: Perceptions of pupils,parents and
teachers.School Psychology International, Vol. 24, No. 1.

91
APPENDIX I
Letter of introduction
Dominic Muthuri Kirera,
P.o. Box 74929-00
Nairobi
Date----------------------
Dear sir/Madam,
Re: Permission to collect data
I am a post graduate student at University of Nairobi undertaking a master course
in Educational Administration and Planning. I am carrying out research project on
Factors influencing students transition of pupils’ from primary to secondary
schools in Meru central district, in fulfillment of my degree. I wish to seek your
approval to collect the necessary data for this project. This shall entail
administering questionnaires to the Head teachers, in selected institutions and
interview schedules for sampled members of school committees and education
officers. This information shall be used for the purpose of this research only.
Thanks in advance.
Yours faithfully,
Dominic Muthuri Kirera.
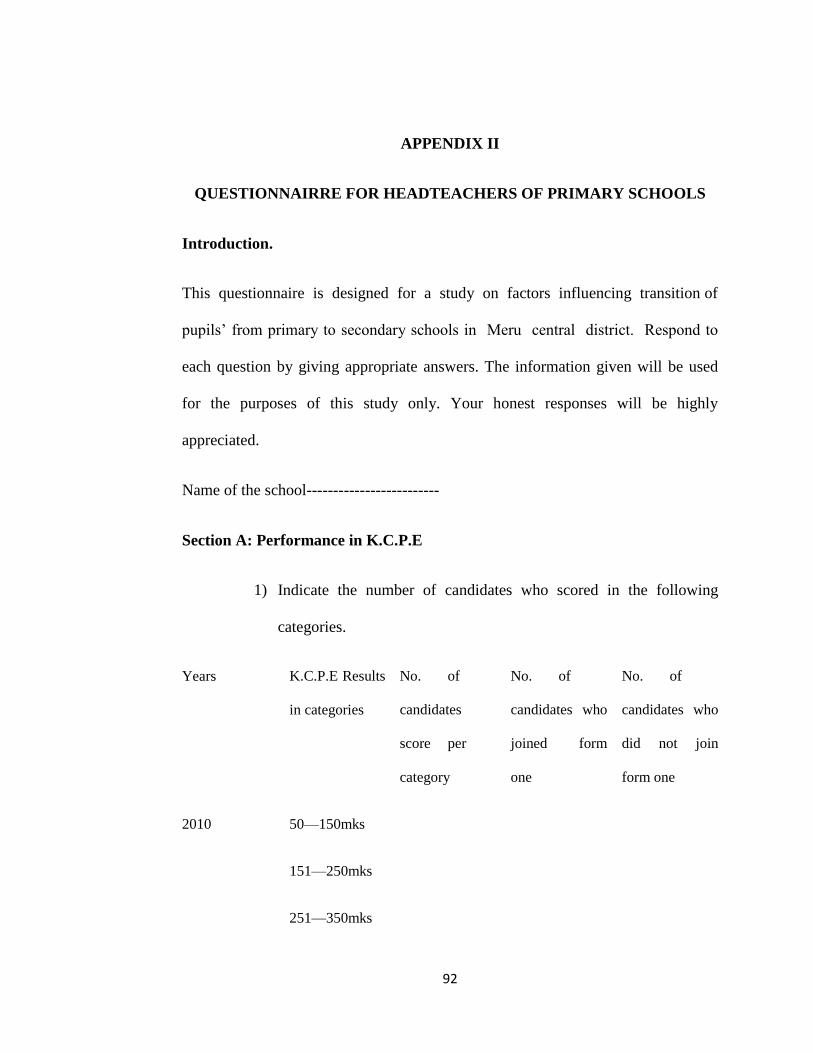
92
APPENDIX II
QUESTIONNAIRRE FOR HEADTEACHERS OF PRIMARY SCHOOLS
Introduction.
This questionnaire is designed for a study on factors influencing transition of
pupils’ from primary to secondary schools in Meru central district. Respond to
each question by giving appropriate answers. The information given will be used
for the purposes of this study only. Your honest responses will be highly
appreciated.
Name of the school-------------------------
Section A: Performance in K.C.P.E
1) Indicate the number of candidates who scored in the following
categories.
Years K.C.P.E Results
in categories
No. of
candidates
score per
category
No. of
candidates who
joined form
one
No. of
candidates who
did not join
form one
2010 50—150mks
151—250mks
251—350mks
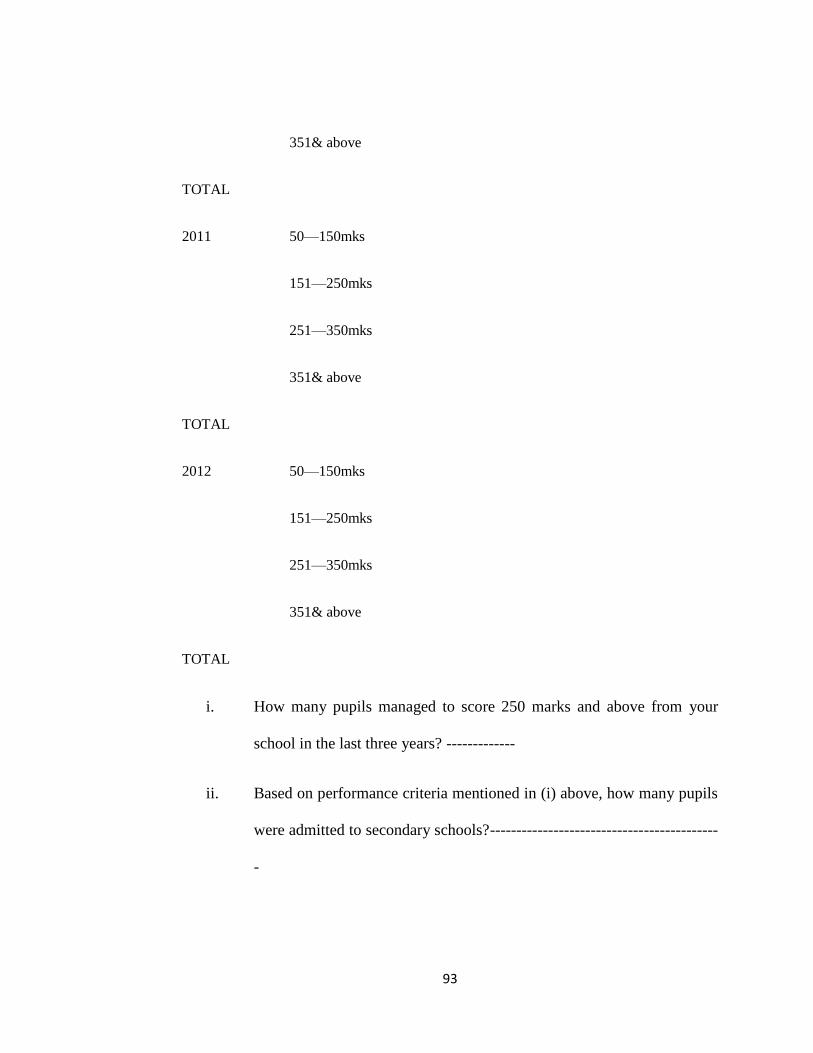
93
351& above
TOTAL
2011 50—150mks
151—250mks
251—350mks
351& above
TOTAL
2012 50—150mks
151—250mks
251—350mks
351& above
TOTAL
i. How many pupils managed to score 250 marks and above from your
school in the last three years? -------------
ii. Based on performance criteria mentioned in (i) above, how many pupils
were admitted to secondary schools?-------------------------------------------
-

94
iii. How many among those admitted were able to proceed to form one
based on the above performance 2010------------------2011-----------------
2012-----
iv. Are there students who had passed but were not admitted to any
secondary school? Yes-----No----
v. Is it true that KCPE performance was used as basis of discrimination
during form one admissions in the district? Yes-------No--------
vi. Are there pupils who were not admitted to any secondary schools
because of poor performance? Yes------- No-------
vii. Are pupils of this school motivated to continue with education to
secondary schools Yes-------No------
Section B: Education level of parents of the pupils’.
i) To what extent do the parents of your school value education (
mark or tick the scores as indicated in each category).

95
Scores are in a scale of 1-4
Strongly
disagree
1
Disagree
2
Agree
3
Strongly
agree
4
All parents of this school are educated
Parents spend a reasonable amount of
income on Education
Parents allow their children to be employed
instead schooling
Parents value education as a way of
alleviating poverty
Parents Influence the student to continue
with schooling
Influence the students to drop out of school
Meet the financial burden of schooling
Attend school meetings promptly
Assist their children with school work

96
Organize private tuition for their children
Section C: Tuition fees requirements for joining form one
a) Are there pupils in your school who were admitted to secondary schools but
failed to join as a result lack of;
i) School fees--------------------------------------------------
ii) Other requirements----------------------------------------
b) Does your school have any policy of assisting needy pupils to join form one?
Yes_______ No______
c) If yes give the fund raising method used_______________________
d) Is the government investment in education enough to enhance good
pupils’transition to secondary schools Yes----No-----
e) Do parents find any difficulties when raising school fees for their children to join
form one? Yes ---- No-----
Section D: Availability of form one vacancies in secondary schools.
4) In a scale of 1-4, to what extent do you agree or disagree with the following
statements.
Strongly
disagree
Disagree Agree Strongly

97
agree
Distance between home and school hinders
transition to secondary school
pupils who pass and are not admitted to any
sec school
Schools in the district have enough
infrastructure for form one admission
There are enough secondary school in the
district
KCPE performance is a good criterion of
form one admission

98
APPENDIX III
INTERVIEW SCHEDULE FOR OFFICIALS OF SCHOOL COMMITTEE
Section A: performance in K.C.P.E
i) Is there a relationship between K.C.P.E score attained and form one
admission? Yes----- No----
ii) Are pupils generally motivated to learn in this? Yes--------No----------
iii) Do all the pupils in this school join form one after completing secondary
school? Yes---------No----------
iv) Is KCPE used as criteria for form one admission in the district? --------
Section B: Education level of parents
i) Generally what is the highest level of parent’s education in your school?
ii) Do parents have children in more than one secondary school? Yes/No-

99
iii) Are there other members of the family who can help parents in paying
the fees for their children Yes---No---
iv) Is education valued by parents in this school? Yes ---------No-----------
v) Do parents encourage their children to join secondary schools Yes/No
vi) .Do parents attend all school meetings without coercion? Yes—No--
Section C: Tuition fees requirements when joining form one
i) Did you have any difficulties in raising money to buy form one
requirements?
ii) Are there people or organizations that assist parents in raising funds for
form one admission requirements? Yes-----No------
iii) Would the availability/in availability of funds hinder children from
going to secondary School? Yes--------No---------
v) Would you prefer your child to acquire employment rather than go to a
secondary school? Yes-------No---------
Section D: Availability of form one vacancies
i) Did you secure a form one vacancy for your child or was admitted?---
ii) What was the criterion of form one admissions [District selection]
[Provincial selection] [National selection]. Tick appropriate responses.
100
iii) Does the distance between home and school affect your attendance to
secondary school? Yes----No-----
iv) Are there enough secondary schools in the area? Yes-----No------