factors influencing the successful adoption of
TRANSCRIPT

FACTORS INFLUENCING THE SUCCESSFUL ADOPTION OF
TECHNOPRENEURSHIP IN THE FOOD PROCESSING SECTOR IN ZIMBABWE
by
Nicholas Zivengwa Kakava
213574125
A thesis submitted in partial fulfilment of the requirements for the degree of
Doctor of Philosophy
School of Management, IT and Governance
College of Law and Management Studies
Supervisor: Prof Ziska Fields
2015

Page ii
DECLARATION
I Nicholas Zivengwa Kakava declare that:
(i) The research reported in this thesis, except where otherwise indicated, is my original research.
(ii) This thesis has not been submitted for any degree or examination at any other university.
(iii) This thesis does not contain other persons’ data, pictures, graphs or other information unless
specifically acknowledged as being sourced from other persons.
(iv) This thesis does not contain other persons’ writing unless specifically acknowledged as being
sourced from other researchers. Where other written sources have been quoted, then:
a) their words have been re-written but the general information attributed to them
has been referenced;
b) where their exact words have been used, their writing has been placed inside
quotation marks and referenced.
(v) Where I have reproduced a publication of which I am an author, co-author or editor, I have
indicated in detail which part of the publication was written by myself alone and have fully
referenced such publications.
(vi) This thesis does not contain text, graphics or tables copied and pasted from the Internet, unless
specifically acknowledged, and the source being detailed in the thesis and in the Bibliography
sections.
Signature: _________________________________
Date: 18 January 2016

Page iii
ACKNOWLEDGEMENTS
I acknowledge the guidance I received from my supervisor Dr Ziska Fields who was so patient with me
during the studies. In addition, Professor Ziska Fields gave financial support through the facilitation of a
research grant. May the good Lord bless her so much.
I wish to thank the University of KwaZulu-Natal for affording me the opportunity to study. I also would
like to acknowledge the passionate administrative support from Deborah Cunynghame and the University
of KwaZulu-Natal as a whole for their unfailing academic support. Also, special mention is hereby made
for Mrs Gill Hendry for assistance in questionnaire design and statistical data analysis assistance.
I would want to extend my sincere gratitude to Chinhoyi University of Technology (IT department) who
tirelessly assisted with IT skills and knowledge with special mention to Mr Mandishonha who
continuously assisted with document scanning services; Mr Edlight Maguvu for endnote coaching and Mr
Miti for model design. I also wish to appreciate the Chinhoyi University of Technology Library for library
resources.
I also wish to appreciate Antoinette Bisschoff for a passionately executed editing, proofreading and
technical advice on my thesis.
I lastly wish to thank the tireless formatting services offered by Mrs Gamuchirai Chasara nee Gudu. May
her efforts be rewarded.

Page iv
DEDICATIONS
This thesis is dedicated to Him Who does not die, my family: Eunah, Abide, Obey and Ordain; the Church
of Christ.
Page v
GLOSSARY OF ACRONYMS
AEO – African Economic Outlook
AfDBG – Africa Development Bank Group
CZI – Confederation of Zimbabwe Industries
FTLRP – Fast Track Land Reform Program
GNU – Government of National Unity
GPA – Global Political Agreement
IDP – Industrial Development Policy
IEEA – Indigenisation and Economic Empowerment Act [Chapter 14:33]
IPR – Intellectual property rights
MIC – Ministry of Industry and Commerce
NERP – National, Economic Revival
R&D – Research and Development
SIRDC – Scientific and Industrial Research and Development Centre
STERP – Term Emergency Recovery Programme
SADC – South African Development Community
Zanu-PF – Zimbabwe African National Union – Patriotic Front
ZESA – Zimbabwe Electricity Supply Authority
Zim – Zimbabwe
ZIMASSET – Zimbabwe Agenda for Sustainable Socio-Economic Transformation
ZIMPREST – Zimbabwe Program for Economic and Social Transformation
ZIMSTAT – Zimbabwe National Statistics Agency

Page vi
ABSTRACT
Technopreneurship has been found to be one of the modern approaches to lead economic development in
such success stories like the Asian upcoming economies. From such a background, the study endeavoured
to determine the factors which influence technopreneurship in such a developing nation as Zimbabwe.
From theory and practice, technopreneurship is found to be the key to knowledge-based economies that
can assist most developing countries that may struggle to industrialise. Zimbabwe as an economy is well
positioned to produce food products for the domestic and other regional and international economies. The
objectives of the study were: to examine factors that influence the adoption of technopreneurship in the
food processing sector in Zimbabwe; to assess the importance given to technopreneurship by the food
processing sector in Zimbabwe; to examine the feasibility of technopreneurship, and to test the
relationship between factors that influence technopreneurship in the food processing sector in Zimbabwe.
Current literature on technopreneurship addresses issues in developed countries and success stories of
other upcoming economies like India and China. The study contributed to the context of
technopreneurship in developing countries and especially in sub-Saharan Africa. The issues of a lack of
development in such nations like Zimbabwe which may have natural endowments and what could be seen
as good economic policies were addressed. A model of a technopreneurship system was proposed to
contextualise the Zimbabwean technopreneurship situation and this could apply to most regional and
global situations.
The research onion was adopted to guide the research methodology and methods. The positivist research
philosophy and a quantitative research approach were adopted to gather data through a questionnaire from
the major industrial food processing technopreneurs in Harare. Nine companies were contacted to get a
final sample of 147 respondents who included management, administrative and technical staff. SPSS was
used for data management and quantitative data analysis techniques which included descriptive and
inferential statistics adopted.
Findings suggest that technopreneurship plays an important developmental role in the food processing
sector and while several factors influenced technopreneurship such as internal processes; human factors;
global factors; venture capital; partnerships, and government support was found to be the most important
factor influencing all other factors. The major and determining factor influencing technopreneurship in
the industrial food processing factor in Zimbabwe was Government support. A contribution to new
knowledge and respective stakeholders in technopreneurship was made.
Key Terms: Technopreneurship, Innovation, Food processing, Entrepreneurship, Technology
Page vii
TABLE OF CONTENTS
DECLARATION ................................................................................................................................... ii
ACKNOWLEDGEMENTS .................................................................................................................. iii
DEDICATIONS .................................................................................................................................... iv
GLOSSARY OF ACRONYMS ..............................................................................................................v
ABSTRACT .......................................................................................................................................... vi
LIST OF TABLES ............................................................................................................................... xii
LIST OF FIGURES ............................................................................................................................. xiv
CHAPTER 1: NATURE AND SCOPE OF THE STUDY
1.1 Introduction ..................................................................................................................................1
1.2 Definition of terms .......................................................................................................................2
1.3 Clarification of the title of the study ............................................................................................4
1.4 Background of the study ..............................................................................................................5
1.5 Research problem ........................................................................................................................9
1.6 Problem statement .....................................................................................................................12
1.7 Industrialisation .........................................................................................................................12
1.8 Research questions .....................................................................................................................13
1.9 Research objectives ...................................................................................................................14
1.10 Type of study .............................................................................................................................15
1.11 Delimitation of the study ...........................................................................................................18
1.12 Significance of the study............................................................................................................18
1.13 The conceptual framework ........................................................................................................19
1.14 Outline of study .........................................................................................................................21
1.15 Summary ....................................................................................................................................23
CHAPTER 2: ZIMBABWE AND THE FOOD PROCESSING SECTOR
2.1 Introduction ................................................................................................................................25
2.2 The Zimbabwean economy ........................................................................................................25
2.3 Level of democracy and economic development .......................................................................27
2.4 Contribution of Zimbabwe in the SADC region ........................................................................27
2.5 Distribution of the economic activities ......................................................................................28
2.6 Zimbabwe economic system historically ...................................................................................31
Page viii
2.7 General overview of the industrial background .........................................................................33
2.8 Industrial Development Policy .................................................................................................34
2.9 Food processing sector...............................................................................................................34
2.10 Challenges of the food processing sector...................................................................................35
2.11 Importance of the food processing sector ..................................................................................36
2.12 Summary ....................................................................................................................................37
CHAPTER 3: TECHNOPRENEURSHIP
3.1 Introduction ................................................................................................................................39
3.2 Entrepeneurship versus Technopreneurship ..............................................................................39
3.3 Entrepreneurship ........................................................................................................................40
3.4 Technology ................................................................................................................................42
3.5 Innovation ..................................................................................................................................45
3.6 Technopreneurship defined ........................................................................................................47
3.7 Technopreneurship as a behaviour ............................................................................................50
3.8 Technopreneurship as a process ................................................................................................51
3.9 Determinants of technopreneurship ...........................................................................................52
3.10 The conceptual framework ........................................................................................................59
3.11 Internal processes .......................................................................................................................61
3.12 Human factors ............................................................................................................................62
3.13 Venture capital ...........................................................................................................................63
3.14 Partnerships ................................................................................................................................63
3.15 Government support ..................................................................................................................64
3.16 Global factors .............................................................................................................................65
3.17 Summary ....................................................................................................................................65
CHAPTER 4: PERSPECTIVES OF TECHNOPRENEURSHIP
4.1 Introduction ................................................................................................................................67
4.2 Revisiting the definition of technopreneurship ..........................................................................67
4.3 The Theories / Models of technopreneurship ............................................................................68
4.3.1 Knowledge spillover theory ...................................................................................................... 68
4.4 Innovation theories ....................................................................................................................70
4.5 Technology transfer ..................................................................................................................71
4.6 Academic entrepreneurship .......................................................................................................72
4.7 Foreign direct investments ........................................................................................................74
4.8 Technology sourcing..................................................................................................................75

Page ix
4.9 Value addition ...........................................................................................................................77
4.10 Technological parks (Technoparks) ...........................................................................................78
4.11 Business clusters ........................................................................................................................80
4.12 Summary ....................................................................................................................................82
CHAPTER 5: RESEARCH METHODOLOGY
5.1 Introduction ................................................................................................................................83
5.2 The research onion .....................................................................................................................83
5.3 Research philosophy ..................................................................................................................86
5.4 Role of theory ............................................................................................................................86
5.5 Research design .........................................................................................................................88
5.6 Research approaches ..................................................................................................................90
5.7 Survey research strategy ............................................................................................................91
5.8 Time horizons ............................................................................................................................91
5.9 Population of the study ..............................................................................................................93
5.10 Sample design ............................................................................................................................94
5.11 Inclusive/Exclusive criteria ........................................................................................................98
5.12 Data collection instruments .....................................................................................................100
5.13 Data collection process: fieldwork ..........................................................................................106
5.14 Data management ....................................................................................................................107
5.15 Data analysis ............................................................................................................................111
5.16 Reliability and validity.............................................................................................................119
5.17 Ethical considerations ..............................................................................................................120
5.18 Summary ..................................................................................................................................121
CHAPTER 6: RESEARCH RESULTS
6.1 Introduction ..............................................................................................................................123
6.2 Response rate ...........................................................................................................................123
6.3 Internal reliability test and face validity ..................................................................................124
6.4 Demographic details ................................................................................................................125
6.4.1 Area of specialisation.............................................................................................................. 125
6.4.2 Gender..................................................................................................................................... 127
6.4.3 Educational level .................................................................................................................... 128
6.4.4 Positions at work ..................................................................................................................... 129

Page x
6.4.5 Respondent’s department ........................................................................................................ 130
6.5 One sample t-tests ................................................................................................................... 132
6.6 The importance of technopreneurship in the food processing sector .......................................133
6.7 Factors influencing the adoption of technopreneurship in the food processing sector ............135
6.7.1 Internal processes .................................................................................................................... 135
6.7.2 Human factors ......................................................................................................................... 137
6.7.3 Venture capital ........................................................................................................................ 139
6.7.4 Partnerships ............................................................................................................................. 141
6.7.5 Government support ............................................................................................................... 143
6.7.6 Global factors .......................................................................................................................... 145
6.7.7 Critical success factors that influence technopreneurship in the food processing sector. ...... 147
6.8 Feasibility of technopreneurship in the food processing sector ...............................................150
6.9 The relationship between factors that influence technopreneurship and the role of
technopreneurship in the company ..........................................................................................154
6.10 The relationship between area of specialisation and feasibility of technopreneurship in the
food processing sector .............................................................................................................157
6.11 Representation of areas of specialisation .................................................................................159
6.12 Summary ..................................................................................................................................160
CHAPTER 7: DISCUSSION
7.1 Introduction ..............................................................................................................................161
7.2 Demographic details ................................................................................................................161
7.2.1 Gender..................................................................................................................................... 162
7.2.2 Area of specialisation.............................................................................................................. 162
7.2.3 Respondent’s department ........................................................................................................ 163
7.2.4 Educational level .................................................................................................................... 163
7.2.5 Positions at work ..................................................................................................................... 164
7.3 The importance of technopreneurship in the food processing sector .......................................164
7.4 Factors that influence successful adoption of technopreneurship in the food processing
sector ........................................................................................................................................166
7.4.1 Internal processes .................................................................................................................... 167
7.4.2 Human factors ......................................................................................................................... 169
7.4.3 Venture capital ........................................................................................................................ 170
7.4.4 Partnerships ............................................................................................................................. 171
7.4.5 Government support ............................................................................................................... 172
7.4.6 Global factors .......................................................................................................................... 174

Page xi
7.5 Critical success factors that influence the adoption of technopreneurship in the food
processing sector ......................................................................................................................175
7.6 Feasibility of technopreneurship in the food processing sector ...............................................177
7.7 The relationship between factors that influence technopreneurship and the importance of
technopreneurship in the company ..........................................................................................181
7.8 Relationship between area of specialisation and feasibility of technopreneurship ..................183
7.9 Summary ..................................................................................................................................184
CHAPTER 8: CONCLUSIONS AND RECOMMENDATIONS
8.1 Introduction ..............................................................................................................................186
8.2 Restating the research problem ................................................................................................186
8.3 Limitations ...............................................................................................................................187
8.4 Conclusions ..............................................................................................................................187
8.5 Conclusion 1: The role of technopreneurship ..........................................................................187
8.6 Conclusion 2: Factors influencing technopreneurship ............................................................188
8.7 Conclusion 3: Critical success factors of technopreneurship...................................................188
8.8 Conclusion 4: Feasibility of Technopreneurship .....................................................................188
8.9 Recommendations ....................................................................................................................189
8.10 Recommendation 1: New knowledge ......................................................................................189
8.11 Recommendation 2: For policymakers ....................................................................................192
8.12 Recommendation 3: For industrialists .....................................................................................194
8.13 Recommendation 4: For universities .......................................................................................195
8.14 Future research .........................................................................................................................197
8.15 Summary ..................................................................................................................................197
BIBLIOGRAPHY ...............................................................................................................................198
APPENDIX 1: THE QUESTIONNAIRE ...........................................................................................228
APPENDIX 2: DATA ANALYSIS TABLES AND GRAPHS ..........................................................235
ETHICAL CLEARANCE ...................................................................................................................269

Page xii
LIST OF TABLES
Table 1.1: Capacity constraints 2015 6
Table 1.2: Manufacturing industry challenges 8
Table 1.3: Independent, dependent and intervening variables of the study 20
Table 2.1: Challenges faced by some industrial food processing technopreneurs
in Zimbabwe 35
Table 3.1: Factors influencing technopreneurship 57
Table 3.2: Factors influencing technopreneurship at the micro level perspective 59
Table 5.1: Table for determining minimum returned sample size for a given
population size for continuous and categorical data 97
Table 5.2: Sample size 98
Table 5.3: Comparison of MS Excel, SPSS and SAS 108
Table 6.1: Sampling data 122
Table 6.2: Internal validity of factors influencing technopreneurship 124
Table 6.3: Frequency distribution table showing responses for area of specialisation 125
Table 6.4: A frequency distribution showing gender composition of the respondents 126
Table 6.5: A frequency distribution table showing highest educational levels for respondents 127
Table 6.6: Level of position at work 129
Table 6.7: A frequency distribution table showing categories of departments of respondents 130
Table 6.8: One sample test statistics for the importance of technopreneurship 134
Table 6.9: One sample t-test statistics for key success factors 148
Table 6.10: Ordered average score from most important to least important of
the critical success factors 149
Table 6.11: Correlation analysis between internal processes and the importance of
technopreneurship 153
Table 6.12: A table showing correlation analysis between human
factors and the role of technopreneurship 154
Table 6.13: A table showing correlation analysis between government support
and the importance of technopreneurship 155
Table 6.14: A table showing correlation analysis between global factors
and the importance of technopreneurship 156
Table 6.15: Cross tabulation for area of specialisation and the company having
the capacity to satisfy the demand 157
Table 6.16: A cross tabulation for the relationship between area of specialisation
and the company having the capacity to acquire new processing technology 158
Table 6.17: Chi-Square tests for whether the areas of specialisation are equally represented 159

Page xiii
Table 6.18: Test statistics the Chi-Square test 164
Table 7.1: A comparison of food processing sector findings and Malaysian animation sector 175

Page xiv
LIST OF FIGURES
Figure 1.1: A three-stage tobacco processing 10
Figure 1.2: The conceptual framework 21
Figure 2.1: Effects of deflation on the economy 25
Figure 2.2: The general map of Zimbabwe 29
Figure 2.3: Harare area map 30
Figure 2.4: Zimbabwe manufacturing sector capacity utilisation (2008 - 2013) 33
Figure 3.1: A technological entrepreneur continuum 51
Figure 3.2: Conceptual framework of the effective key factors influencing in
corporate technopreneurship in active knowledge base firms in
nanotechnology industry 54
Figure 3.3: A systematic view of technopreneurship 55
Figure 3.4: A theoretical framework for factors influencing the adoption
of technopreneurship 60
Figure 4.1: The knowledge spillover theory of entrepreneurship 68
Figure 4.2: Aspects of economic policy in cluster development 80
Figure 5:1 Research onion 83
Figure: 5.2: Research onion for the study 84
Figure 5.3: Data analysis decision tree 112
Figure 6.1: A pie chart showing responses of areas of specialisation 126
Figure 6.2: Gender composition and educational levels for respondents 128
Figure 6.3: Position levels and categories of departments 131
Figure 6.4: Importance attached to three elements 133
Figure 6.5: Percentage responses to agreement scales of internal processes 135
Figure 6.6: Average agreement scores of internal processes as they compare to the
mean score of 3 136
Figure 6.7: Percentage responses to questions on the ‘human factors’ 137
Figure 6.8: Mean scores for human factors questions 138
Figure 6.9: Percentage responses to the two ‘venture capital’ questions 139
Figure 6.10: Mean scores for venture capital 141
Figure 6.11: Percentage responses to the two ‘partnerships’ questions 146
Figure 6.12: Mean scores for partnerships 142
Figure 6.13: Percentage responses of the four questions on ‘government support’ 143
Figure 6.14: Mean scores for government support questions 144
Figure 6.15: Percentage responses to ‘global factors’ questions 145

Page xv
Figure 6.16: Average agreement scores for ‘global factors’ questions as they compare to the
mean score of 3 146
Figure 6.17: Percentage responses to ‘critical success factors’ questions 147
Figure 6.18: Percentage responses to ‘feasibility of technopreneurship’ questions 150
Figure 6.19: Average scores for ‘feasibility of technopreneurship’ questions 151
Figure 8.1: The technopreneurship system 189

Page 1
CHAPTER 1: NATURE AND SCOPE OF THE STUDY
1.1 Introduction
Economic development happens in an ever evolving economic order characterised by nations engaging in
a technological race with regions and countries competing on such fronts as technological innovation,
industrialisation, income per capita and living standards (Szirmai, 2013). The essence of
technopreneurship is a driving force steering economic growth and development. Most policy failure in
Africa (including in Zimbabwe) could be attributed to institutional weakness and implementation failure
leading to African nations relegating to the league of least developed countries and focusing on the trade
of primary commodities and vulnerability to volatile terms of trade (Soludo et al., 2004).
Food security in Africa has been considered an urgent global challenge to meet the required quantities and
nutritional quality that free trade is encouraged since food is a basic human right despite situations and
circumstances (Sasson, 2012). The United Nations (2015; 2014) Millennium Development Goals progress
report shows that there was insufficient progress in Sub-Saharan Africa to reach the target if prevailing
trends persisted. Thus extreme poverty and hunger remained critical in the region. Farming methods to
include horticulture have been researched to enhance food security in KwaZulu-Natal, South Africa
(Modi, 2015). Urban farming was upheld as a source of food security in the copper belt of Zambia (Smart
et al., 2015). In either case, modern farming skills and knowledge are adopted to improve productivity.
Agricultural produce is seasonal in most cases unless backed by irrigation. In order to ensure a continuous
food supply, there would be a need for food preservation for future and out of season supplies.
Zimbabwe experienced food insecurity since the adoption of the Fast Track Land Reform Programme
(FTLRP) which is classified as one of the policy failures (Murphy, 2013; Munangagwa, 2009). The
FTLRP marked the beginning of the worst economic policy ever and buttressed by the controversial
Indigenisation Act of 2008 which is still effective in Zimbabwe’s Agenda for Sustainable Socio-Economic
Transformation (ZIMASSET) and which condemns economic development through Foreign Direct
Investments (FDIs) thus heading for failure (Murphy, 2013). That is so, especially in the current globalised
economy. According to Murphy (2013), economic policy failure is characterised by social suffering,
economic crisis and political instability. Hungwe (2015) reported that President Robert Mugabe on his
91st birthday admitted that the controversial land reform programme was a failure when he was quoted
saying, “I think the farms we gave to people are too large. They cannot manage them.” This was a
reflective statement by some aged man who has had some long experience with several economic
programmes hat had also failed. In any case, food security is critical in Zimbabwe to such an extent that
it was captured on the current economic programme, ZIMASSET as one of the key result areas.

Page 2
Food preserving through processing also ensures food security. All agricultural food produce require value
addition for it to be made available on the market and preservation. The Zimbabwean economic crisis has
seen massive deindustrialisation taking place for the past 15 years. Musonza (2015) looks at
industrialisation, de-industrialisation, and re-industrialisation as referring to some changes happening in
the contribution of the manufacturing industry to Gross Domestic Product (GDP) or employment. In
particular, Musonza (2015) refers to deindustrialisation as the reduction of the contribution of the
manufacturing industry to GDP or employment. This is characterised by operating below capacity,
retrenchment, downsizing and company closures in the Zimbabwean manufacturing industry. According
to Kariati (2015) within a period of six weeks after a Supreme Court ruling, 30000 people lost their
employment in July and August 2015. Mataranyika (2015) indicated that about 150 companies closed in
2014. That covers the manufacturing sector and the food processing sector in particular.
Modern economic development and growth theory have a strong bearing on entrepreneurship (Stull, 2014;
Ferreira et al., 2015) or technopreneurship (Rostamnezhad et al., 2014; Brem and Borchardt, 2014) and
this is owing to the merits and facets of the subject. The current trend is a shift from managerial economies
to entrepreneurial economies (Drucker, 2014). However entrepreneurship may be viewed as not an
effective economic development concept without a technological emphasis (Drucker, 2014). This is
largely true when examining developing economies that are to some extent unable to exploit their natural
endowments for industrialisation. While acknowledging that high-performing entrepreneurial sectors
include Science, Engineering and Technology (SET), McAdam (2012), explores how a high-technology
entrepreneur fits into the prevailing culture of the business incubator where her business is located.
Industrial food processing is important as a value addition activity for all agricultural produce. Its value is
found in improving the health and taste of food (Lee et al., 2015); enhancing food safety (Goddard, 2015);
and nutritional and dietary purposes (Green, 2015). Therefore, industrial food processing is key to
geographical distribution of food stuff, nourishment, and storage and food safety. This chapter introduces
the topic of the study background of the study; the research problem; research objectives; questions; type
of study; justification; and the outline of the whole thesis documentation.
1.2 Definition of terms
In this study, the following terms are regularly used and need to be put in perspective. It has to be
appreciated that the terms may have different meanings in other usage and meanings are determined by
the context. However, current context has references to other usages.

Page 3
Technopreneurship is viewed as consisting of innovation, technical science and knowledge applied to
the creation and management of a business at some financial risk so as to achieve own goals and
perspectives (Dolatabadi and Meigounpoory, 2013). In most cases, technopreneurship is viewed as
business venturing through the compounding of entrepreneurial skills and technological prowess (Pujanis
et al., 2015; Dutse et al., 2013; Harlanu and Nugroho, 2015).
Technology – “is a set of tools designed to manipulate the natural world and to extend human intentions”
(Wagner et al., 2015:4). Or, technology is a set of tools and procedures designed to make human life
convenient through the application of acquired knowledge to the day-to-day individual, domestic and
industrial activities.
Science –“is a way of knowing things – it is a widely accepted, adaptable, and transferable set of
assumptions about how to understand the world in which we find ourselves.” (Wagner et al., 2015:3-4)
Entrepreneurship – Shane and Venkatraman (2000) hold that entrepreneurship is the exploration and
exploitation of profitable business opportunities. Entrepreneurship can be seen as a process of perceiving
market opportunities as well as organisational resources to exploit the opportunities so as to attain results
in the long term (Nacu and Avasilcăi, 2014). It can also be viewed as the business approach that perceives
business opportunities and adopts an innovative way to create a new venture or revive an existing one.
Innovation –is viewed as the utilisation of new technology in an organisation (Jonsson, 2015).
“Innovation consists of the generation of a new idea and its implementation into a new product, process
or service, leading to the dynamic growth of the national economy and the increase in employment as well
as to a creation of pure profit for the innovative business enterprise.” (Urabe et al., 1988:3).
Industrial food processing– refers to the practices used by food and beverage industries to transform raw
plant and animal materials, such as grains, produce, meat and dairy, into products for consumers (John
Hopkins Bloomberg School of Public Health, 2015).
Economic Development –“Economic development is concerned with quality improvements, the
introduction of new goods and services, risk mitigation and the dynamics of innovation and
entrepreneurship. Economic development is about positioning the economy on a higher growth trajectory.
It is within the purview of government.” (Feldman et al., 2014:1).
Economic growth – “is simply an increase in aggregate output” (Feldman et al., 2014:1).
Developed countries – OEED (2015) view developed countries as those that qualify to be members of
OECD. Nielsen (2011) looks at developed countries as countries that are affluent enough to participate in
assisting other poor countries.
Developing countries / Least Developed Countries (LDC) – OECD (2015) adopted the United Nations’
definition of LDC which are countries that are poor and weak in the international community based on
their GNP per capita, “weak institutional and human capacities, low and unequally distributed income and
scarcity of domestic financial resources, often suffer from governance crisis, political instability and, in

Page 4
some cases, internal and external conflicts”. Nielsen (2011) examines developing countries as countries
that are still so poor that they cannot assist other countries who need help to develop.
Technopreneur – “A technopreneur means an entrepreneur who involves and deals with technology in
their business. A technopreneur believes that technology would increase efficiency, productivity, product
quality, broaden the market and helps to market the developed product widely” (Harlanu and Nugroho,
2015:148). The term 'technopreneur' emanates from the notion of an entrepreneur, who makes use of
technology to come up with a new invention and innovation and thereby being competitive on the market
(Mohannak and Matthews, 2015). A technopreneur “is an individual who successfully uses talent and
ventures capital, innovative ideas, and managerial skills for either commercial production of effective and
viable technological innovations or effective leverage of innovations using technology” (Memon et al.,
2015:5).
1.3 Clarification of the title of the study
The title of this thesis is “Factors Influencing the Successful Adoption of Technopreneurship in the food
processing sector in Zimbabwe”. Two concepts to be noted in the title are Technopreneurship and the
food processing sector in Zimbabwe. In this study, Technopreneurship refers to Technological
Entrepreneurship (Satria et al., 2014; Velikova et al., 2014; Venkataraman, 2004), that is, the use of
technology to exploit new business opportunities for wealth creation.
Kwa et al. (2014:66) give a Nigerian perspective that equally applies to the Zimbabwean situation as they
view technopreneurship as “the process of organisational creativity is a process of mainstreaming
innovation or continually finding important corporate problems, solving those problems, and,
implementing the solutions to satisfy the global market.” As it were, industrial food processing
technopreneurs and other manufacturing organisations in Zimbabwe have corporate problems that require
creativity and innovation to solve those problems. Such a process is the one being referred to as
technopreneurship. Dolatabadi and Meigounpoory (2013:140) define technopreneurship as, “innovative
application of technical science and knowledge individually or by a group of persons, who create and
manage a business and take its financial risk to achieve their goals and perspectives”. The definition has
initially defined technology and then added the entrepreneurship part to come up with a complete
definition of the compounded concept. As can be appreciated, the term is a compounded term that is
relatively new in academia (Pujanis et al., 2015; Dutse et al., 2013; Harlanu and Nugroho, 2015).
The other term used in the topic is, ‘sector’, which in this study refers to an area or portion of the
manufacturing industry that is distinguished from others through its concentration on food processing.
While the manufacturing industry in Zimbabwe covers a wide range of processing and value addition of
primary products some of which are non-food stuff, this thesis focuses on the food processing sector. The

Page 5
logic behind it is that since the economy of Zimbabwe is agriculturally based, an industrial food processing
technologies study can be utilised to produce food products in the nation. The noted situation is that most
basic food products such as snacks, biscuits, cereals and beverages are imported from other economies
such as Singapore and South Africa (Chinamasa, 2015). Primary resource endowments require
technological backing to create wealth for the natives (Kwa et al., 2014).
The chapter introduces the thesis regarding the subject matter and its scope. The section introduces the
research by the clarification of the topic as well as the background of the study. It also covers the research
problem, research objectives, questions and research hypotheses.
1.4 Background of the study
According to Petti (2009) development agencies such as the United Nations Development Programme
(UNDP) and World Bank (WB), as well as politicians of late, called for economic policies that are
entrepreneurial, especially in poor societies to reduce the gap between developed and developing or
underdeveloped economies. As of June 2013, available statistics indicate that the majority of people in
Sub-Saharan Africa are still living in extreme poverty with less than $1 per day per capita, meaning there
is still high levels of poverty and hunger as well as a large deficit in decent work in Sub-Saharan Africa
(United Nations, 2014). Thus, from this perspective, progress is insufficient to reach the United Nations
2015 Millennium Development Goals (MDGs) target, unless prevailing trends improve significantly.
Heng et al. (2012) confirm that in most countries, to achieve productivity and growth, economies are now
not relying much on the endowment of natural resources but the intellectual capacity and quality of human
capital. Developing economies in sub-Saharan Africa can achieve greater results if a paradigm shift takes
place from relying on trading primary resources to rather processing the resources before trading. This is
so, especially with insights from Bihar (India) according to Minten et al. (2013) who asserted that local
brands in developing countries are rapidly gaining agricultural market share. The blend of technology and
innovation that lead to technopreneurship in entrepreneurial activities is, according to Dutse et al. (2013),
known to be the key drivers of enterprise growth in modern economies. Technopreneurship is seen as the
best to foster competitive advantage in Small and Medium Enterprises (SMEs) (Pakrad et al., 2012).
Therefore, with the economic and industrial challenges in developing countries like Zimbabwe, the aspect
of technopreneurship makes sense since it fosters value addition to the natural endowments and
agricultural produce thereby creating and wealth enhancing sustainability. Also, the macro-economic level
success of a country depends on the success of the industrial level activities which in turn depends on the
micro level, that is, the organisational level activities. About the organisational level, Harlanu and
Nugroho (2015) assert that technopreneurship enhances the competitiveness of organisations in the

Page 6
international market, and thus a competitive advantage in modern error is not based on only the abundance
of natural endowments. No economy can make itself immune to external forces such as globalisation and
the rising competition therein.
In Zimbabwe, the manufacturing industry capacity utilisation reduced in 2013 by 5.3% to 39.6% (CZI,
2013). In the Zimbabwean scenario, statistics shows that the nation went through a deindustrialisation
process that was characterised by a constant and massive economic meltdown of about 40% (CZI, 2011).
Most manufacturing organisations closed, and the remaining few are operating below capacity (CZI,
2011). The 2011 statistics have recorded average capacity utilisation at the end of the first half of 2010
standing at 43.7% (CZI, 2011), and 2015 capacity utilisation dropped from 36.5% in 2014 to 34.3% in
2015 (CZI, 2015).
The Zimbabwean industrial food processing technopreneurs have since been stating importation of cheap
food products from neighbouring countries as one of the factors influencing business operations in the
nation (CZI, 2014). In 2015, as shown in Table 1.1, low local demand and capital constraints are the major
constraints while aged equipment and competition from imports follow up. That could point to the notion
that economic development happens in an ever evolving economic order that is characterised by nations
engaging in a technological race with regions and countries competing on such fronts as technological
innovation, industrialisation, income per capita and living standards (Szirmai, 2013).
Table 1.1: Capacity constraints 2015
Major Capacity Constraints Percentage
Low local demand 28.4
Capital constraints 18.6
Antiquated machinery and machine breakdowns 12.3
Competition from imports 10.3
High cost of doing business 8.3
Cost/Shortage of raw materials 6.9
Power and water shortages 6.4
Drawbacks from current economic environment 2.0
Other 6.9
Source: CZI (2015:13)
The above could point to the fact that industrial food processing technopreneurs are failing to be
competitive globally. Protective measures by authorities may not work in this case since the nation needs
to have trade relations with other economies. Adopting modern business models and operations like

Page 7
technopreneurship could have a lasting solution to such developing economies that is relying on natural
endowments to have economic leverage that is no longer a prudent approach to developing nations. As
argued by Kim et al. (2015) who asserted that scientific knowledge (publications) is not developmental
but technological knowledge (patents). The current situation in Zimbabwe is that there is a high literacy
rate of 98% (ZIMSTAT, 2015) but there is no application of the education. Thus, there is a need for
application of acquired knowledge in the developing nations for development purposes. That is the essence
of technology as equipment, techniques and procedures designed to exploit the natural world so as to
satisfy day-to-day working and living requirements (Wagner et al., 2015).
A Knowledge-Based Economy (KBE) rely on the application of knowledge and information for economic
development (Mortazavi and Bahrami, 2012; Popescu and Crenicean, 2012; Martini et al., 2012). Heng et
al. (2012) also confirm that, in most countries, to achieve productivity and growth, economies are now
not relying much on the endowment of natural resources but the intellectual capacity and quality of human
capital. Developing economies in sub-Saharan Africa can achieve greater results if a paradigm shift takes
place from relying on trading primary resources to rather processing the resources before trading (Kwa et
al., 2014). That is so, especially with insights from Bihar (India) according to Minten et al. (2013) who
asserted that local brands in developing countries are rapidly gaining agricultural market share. There is
ethnocentrism in the Zimbabwean local food market. Hence local food products could be preferred by the
local people (Makanyeza, 2014).
As of June 2013, available statistics indicate that the majority of people in Sub-Saharan Africa are still
living in extreme poverty with less than $1 per day per head, There are still high levels of poverty and
hunger, as well as a large deficit in decent work in Sub-Saharan Africa (United Nations, 2014). Thus, from
this perspective, progress is insufficient to reach the United Nations 2015 Millennium Development Goals
(MDGs) target unless prevailing trends improve significantly. The prevailing trends are that sub-Saharan
African countries are either stagnant or deteriorating economically.
Entrepreneurs are venturing into trading or other service provision ventures and not manufacturing. Most
of the manufacturing organisations are still closed or are still operating below capacity, and there are very
few or no new upcoming manufacturing entities, despite entrepreneurial opportunities in the form of
industrial operations (CZI, 2014). According to CZI (2011), capacity constraints are being cited by most
organisations, and these include low product demand, machine breakdowns, lack of working capital and
lack of raw materials while CZI (2012) identified these as factors having the greatest negative impact on
capacity utilisation and doing business in Zimbabwe. According to CZI (2014) economic challenges that
influence business operations in Zimbabwe were: tight liquidity conditions; company closures; rising
formal unemployment; low production levels; non-performing loans; and a disproportionate trade balance
while CZI (2011-2014) annual surveys focus on the general manufacturing industry, and industrial food

Page 8
processing technopreneurs make up almost 50% of the participating companies in Zimbabwe. A summary
of the findings of the CZI (2011-2012) annual surveys is shown in Table 1.2.
Table 1.2: Manufacturing industry challenges
Year Challenges
2011 Low product demand, machine breakdowns, lack of working capital and lack of raw materials
2012 Availability and cost of funding; infrastructure, in particular, power shortages and cost;
economic policy instability; and high labour cost and rigid labour laws;
2013 Working capital constraints; infrastructure, in particular, power shortages; water shortages
and power costs; ageing equipment and machine breakdowns; low domestic demand
2014 Tight liquidity conditions; company closures; rising formal unemployment; low production
levels; non-performing loans; disproportionate trade balance.
Source: Own compilation extracted from CZI (2011-2014) annual surveys
The challenges faced by the manufacturing industry in Zimbabwe in Table 1.2 above are equally
applicable to the industrial food processing sector. There is demand for domestically produced food
products in Zimbabwe given the ethnocentrism of the Zimbabwean food consumers (Makanyeza, 2014).
More than 60% of the consumer goods in the Zimbabwean retail outlets is imported from other countries
like South Africa and Zambia (Nyakazeya, 2013). Mabuwa (2014) acknowledges that the exportation of
raw agricultural commodities added to the negative effect on the economy of the nation; since employment
is exported and potential income is lost to economies that adopted innovation and value addition policy
priorities in manufacturing models.
Modern socio-economic problems require modern economic policies to alleviate the impact of such
problems on the society. Newfarmer and Pierola (2015) highlight that even nations with an abundance of
natural resources face policy competitiveness with Zimbabwe as an example. Devendra et al. (2015:146)
also indicated the effects of climate change especially on developing countries regarding droughts and
food shortages. That leads to the need for advanced solutions to such challenges and technopreneurial
strategies to deal with such problems. Success stories of Asian Tiger economies (for example, Singapore,
Indonesia, Hong Kong, Malaysia, South Korea, Taiwan) can be found to be anchored on technology and
wealth creation (Wong, 2011; Goh and Wong, 2012). Other world records of technology and
entrepreneurship lead economic developments and include the Silicon Valley (Adams, 2011) and Taiwan
Hsin Chu Industrial Science Park (Sun, 2011). Given these successes in different countries, it is important
to ask what factors are influencing technopreneurship in the Zimbabwean food processing sector. The
study aims to understand if manufacturing technology with an entrepreneurial thrust can assist the
Zimbabwean food processing sector to capitalise on the local brand preference and agricultural food
production opportunities.

Page 9
1.5 Research problem
According to Creswell (2009:18), a research problem “is an issue or concern that needs to be addressed”.
The manufacturing sector of Zimbabwe is among the economic sectors that contribute to wealth creation,
such as the agricultural sector and mining sector. Sectors that are into services are said to be active in the
role of distributing the wealth (CZI, 2010). Mining and Agricultural sectors are said to contribute less to
economic development since they have less returns to labour and more returns to capital; that is, they
create less employment than the manufacturing sector (Newfarmer and Pierola, 2015). Without a viable
manufacturing sector, the Zimbabwean nation is caught in a developmental trap or vicious cycle of
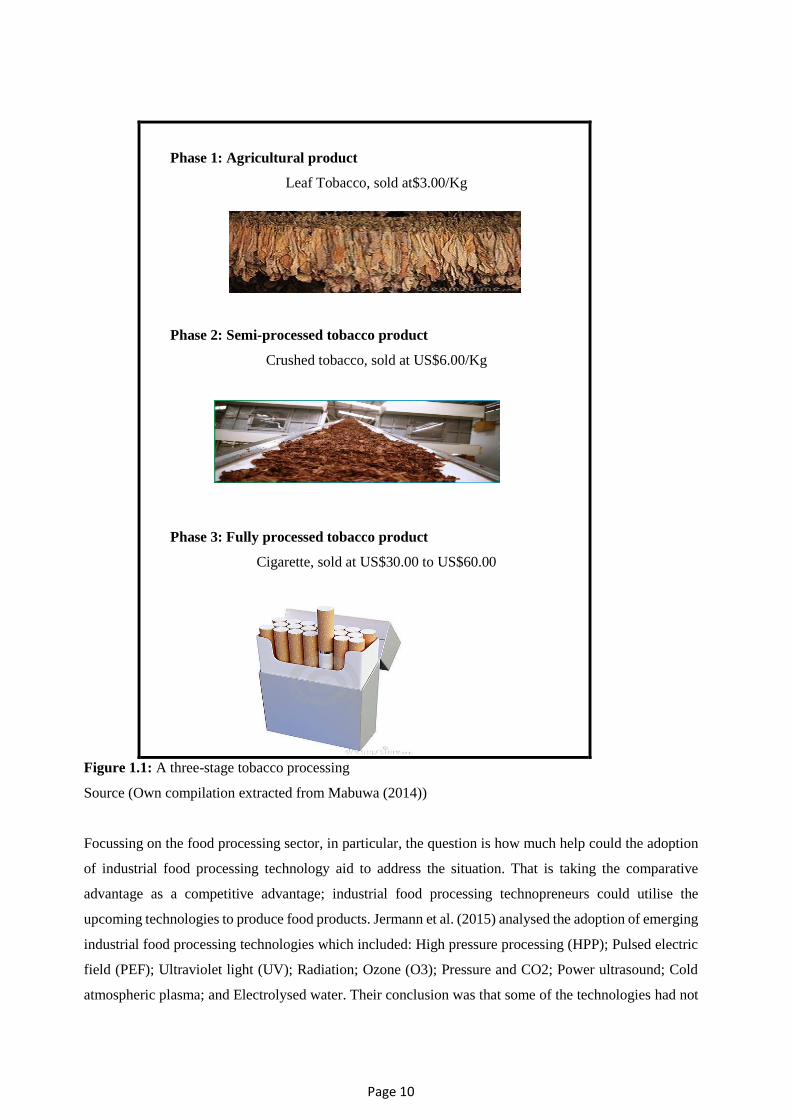
poverty, as illustrated by Mabuwa (2014). From Figure 1.1, it can be appreciated that if a nation
concentrates on trading raw material, it loses in several ways that include: income from value addition,
employment creation, disposable income, government income tax and protection from unstable raw
material prices. Economies that rely on exporting raw material remain poor while those who engage in
value addition become more affluent and thus escape the concept of the poverty trap.
The latter is where an economy has a developmental dilemma and has no hope of growth and development.
Focusing on low-income commodity-dependent sub-Saharan African countries like Zimbabwe,
Sindzingre (2012) argues that the impact of the 2008-2009 crisis, and more generally, these countries'
growth trajectories, can be explained by the concept of the poverty trap. What may be lacking is the
application of scientific knowledge to transform the natural resources to finished products (technological
knowledge) thereby benefiting the nations (Kim and Yun, 2015).
Page 10
Figure 1.1: A three-stage tobacco processing
Source (Own compilation extracted from Mabuwa (2014))
Focussing on the food processing sector, in particular, the question is how much help could the adoption
of industrial food processing technology aid to address the situation. That is taking the comparative
advantage as a competitive advantage; industrial food processing technopreneurs could utilise the
upcoming technologies to produce food products. Jermann et al. (2015) analysed the adoption of emerging
industrial food processing technologies which included: High pressure processing (HPP); Pulsed electric
field (PEF); Ultraviolet light (UV); Radiation; Ozone (O3); Pressure and CO2; Power ultrasound; Cold
atmospheric plasma; and Electrolysed water. Their conclusion was that some of the technologies had not
Phase 1: Agricultural product
Leaf Tobacco, sold at$3.00/Kg
Phase 2: Semi-processed tobacco product
Crushed tobacco, sold at US$6.00/Kg
Phase 3: Fully processed tobacco product
Cigarette, sold at US$30.00 to US$60.00

Page 11
been adopted as large-scale industrial technologies and those adopted were not uniformly distributed
across the developing world (Jermann et al., 2015). From the regions mentioned such as in the US and
Europe, no African country such as Zimbabwe was indicated to have adopted these emerging
technologies. That has an implication on the innovativeness of such economies and as a result, the
economies are found to be not competitive in the international market. Other novel technologies in
industrial food processing are based on nanotechnology (Momin and Joshi, 2015; Neves et al., 2015; Var
and SagLam, 2015; Keshwani et al., 2015). According to Var and SagLam (2015:101), “Nanotechnology
is a field of applied sciences and technologies involving the control of matter on the atomic and molecular
scale, below 100 nanometers”. Nanotechnology is said to have the potential to impact the food processing
industry by: “improved taste, flavour, colour, texture and consistency of foodstuffs, better absorption, the
bioavailability of nutraceuticals and health supplements, food antimicrobials development, innovative
food packaging materials” (Momin and Joshi, 2015:3). It can also enhance innovation in the food sector
by aiding the introduction of new food products and packaging (Siegrist et al., 2008; Var and SagLam,
2015). Combined with the entrepreneurial aptitude, how could industrial food processing technopreneurs
in Zimbabwe explore and exploit opportunities vested in these emerging industrial food processing
technologies. Any organisation that may pursue the possibilities becomes an international competitor and
may seize to cry foul. This could be calling for policies and behavioural models to create wealth,
employment and reduce hunger considerably. Technopreneurship as a potential policy guide and
behavioural model has received some advocacy from academia and developmental policies (Pereira, 2007;
Bulsara et al., 2009; Pei et al., 2010; Dolatabadi and Meigounpoory, 2013) in both developed and
developing countries. But the question could be, “What factors affect technopreneurship in the nation?”
The deindustrialisation challenge, subsequent lack of capacity utilisation and low investment in
manufacturing that the nation face implies that there is a need for a developmental model to guide potential
manufacturing participants in the economy of Zimbabwe. From this perspective, the study seeks to break
the vicious cycle by promoting the development of food manufacturing ventures, by both corporate and
upcoming entrepreneurs if they could embrace the upcoming industrial food processing technologies.
The arguments cited by current manufacturers in the nation that there is a low product demand, machine
breakdowns, lack of working capital and lack of raw materials (CZI, 2011), are subject to testing given
the aspect of technopreneurship. In June 2012, one of the leading retailers in Zimbabwe indicated that it
imported between 60 and 65 percent of all its retail products from South Africa due to depressed capacity
utilisation in the domestic manufacturing sector (CZI, 2013). According to CZI (2013), failure to utilise
capacity by Zimbabwean manufacturers is owing to mainly liquidity challenges and costs of producing
goods locally which are above costs of importing finished goods. While these may be found to be true to
some extent, this study proposes that all these are symptoms of causes which can be revealed by analysing
factors which influence Technopreneurship in the food processing sector, especially the manufacturing
production technologies (MPT) (Szirmai, 2012).

Page 12
The culture of innovation can change the face of the Zimbabwean manufacturing sector. This argument
is in agreement with the literature on knowledge-based economies (Mortazavi and Bahrami, 2012;
Popescu and Crenicean, 2012; Martini et al., 2012), but these have been seen to be successful mostly in
the Western and Eastern economies. There is a knowledge gap in this area in Sub-Saharan Africa and in
particular in Zimbabwe where development in the manufacturing sector is still lagging behind. The
situation is somewhat unusual in Zimbabwe, where there is high knowledge base but no commensurate
industrial development. Employing the inductive approach (Neuman, 2012) the research question here is,
“Which factors influence the successful adoption of technopreneurship in the food processing sector in
Zimbabwe?”
1.6 Problem statement
The study has two issues to deal with: the examination of factors influencing the successful adoption of
technopreneurship in the food processing sector in Zimbabwe and the theoretical gap in technopreneurship
as an area of study and as it applies to developing nations. The food processing sector in Zimbabwe
suffered massive shrinkage since the year 2000. The advent of technopreneurship in the global
environment seems to be working in other economies than others. There could be some determining
factors influencing the success of technopreneurship in a nation. The study endeavours to establish the
factors influencing the adoption of technopreneurship in the Zimbabwean scenario. The impact of such
factors could vary from nation to nation depending on the levels of democracy. Theoretically, the study
contributes to the literature in technopreneurship which is a relatively new area of study, especially in a
developing economy like Zimbabwe. The theoretical contribution could be made in the form of a model
of factors influencing the adoption of technopreneurship in a developing nation.
1.7 Industrialisation
The food processing sector in Zimbabwe is a subsector of the manufacturing industry. The literature on
industrialisation equates it to the expansion of the manufacturing sector (Szirmai, 2012; Xin and Weiguo,
2011). Guo (2012) holds that industry can be defined as the material production sector that engages in the
extraction of natural resources and the processing and reprocessing of natural resources and agricultural
products. In this study, while industry can be subdivided into primary, secondary and tertiary industries,
industry refers to the secondary industry, that which processes raw materials to consumer products. That
is, the sector that will be used to study the factors influencing technopreneurship.
In addition, Szirmai (2012), argues for manufacturing by asserting that: there is an empirical correlation
between the degree of industrialisation and per capita income in developing countries; productivity is
higher in the manufacturing sector than in the agricultural sector; the transfer of resources from agriculture
to manufacturing provides a structural change bonus, a dynamic version of the structural change bonus

Page 13
argument is that manufacturing has higher rates of productivity growth than other sectors. The argument
for manufacturing ventures is based on the Prebisch and Singer Hypothesis, which states that real
commodity prices decline in the long run and this cannot be rejected for most commodities other than oil,
according to Arezki et al. (2012). Therefore, a nation may not rely outrightly on trading primary
commodities like minerals.
A case in point was the situation in Zimbabwe in 1998 where the sharp depreciation in the Zimbabwean
dollar was mainly attributed to the reduction of Zimbabwe’s major minerals on the international market
and low tobacco international prices which led to a reduction in foreign exchange earnings (Bonga, 2014).
Thus, economies cannot rely on the trade of raw commodities for sustainable economic development.
Another latest case in point is the September 2015 case of the Zambian currency (Kwacha) which fell by
17% against the dollar, which according to Mfula and Strohecker (2015), represents its greatest recorded
one-day fall. According to Backman (2015), the Kwacha had gone down by 45% against the US$ from
August to October 2015, because of the nation’s heavy dependence on the copper trade that, in turn, is
dependent on China, which at the time devalued its currency and dropping the prices of copper. These are
the hazards of relying on the primary industrial activities and overlooking the secondary activities and
supporting the Prebisch and Singer Hypothesis.
Focusing on the manufacturing production technologies impacts on developing economies, Szirmai
(2012), indicates that manufacturing has been important for growth in developing countries. Szirmai
(2012), further indicates that not all expectations of the ‘engine of growth hypothesis’ are borne out by
the data; the more general historical evidence provides more support for the industrialisation hypothesis.
Modern theories of industrialisation have put across two basic theories of industrialisation, that is, the
export promotion (EP) and import substitution (IS) (Ottaviano et al., 2015). Prebisch and Singer (1950),
quoted in Hadass and Williamson (2001) advocated (moderate) import substitution (IS) and recommended
having it interwoven with export promotion (EP) (Sai-Wing Ho, 2012). The researcher agrees with this
recommendation but does not segregate manufacturing technologies. All technologies, whether foreign or
domestic, which promote productivity could be adopted. Thus, an entrepreneur capitalises on any
technology to create a viable venture or revitalise an existing one.
1.8 Research Questions
Research questions are inquisitive statements that express what the researcher wants to explore (Bryman
and Bell, 2015). These questions point to gaps of knowledge in literature, as well as in practice that a
research study seeks to answer. In this study, there are four research questions which are listed as follows:

Page 14
1. How much importance is given to technopreneurship in the food processing sector in Zimbabwe?
2. What are the most important factors influencing the successful adoption of technopreneurship in the
food processing sector in Zimbabwe?
3. To what extent is the feasibility of the adoption of technopreneurship viable in the food processing
sector of Zimbabwe?
4. What is the relationship between factors influencing the successful adoption of technopreneurship and
the employee characteristics?
1.9 Research objectives
Research objectives assist the study to be focussed and avoid the gathering of unnecessary data. Well
formulated research objectives help to structure the research process into clearly defined categories or
phases. Research objectives lay the foundation on which the research methodology, data collection,
analysis, interpretation and utilisation are developed. In this study, all the objectives are actioned in the
industrial food processing sector in Zimbabwe. The industrial food processing sector of Zimbabwe is a
portion of the general manufacturing industry of the nation. Thus, the objectives aim to gather data that
will be valuable to the industrial food processing sector in particular and the manufacturing industry of
Zimbabwe in general. The objectives sought to specify what the study would do, where and for what
purpose. The research objectives of this study were:
1. To assess the importance given to technopreneurship by the food processing sector of Zimbabwe.
The knowledge and application of technopreneurship is an important issue since it helps the research to
note how far the food processing sector is aware and adopted technopreneurship. It is assumed that if the
food processors value technopreneurship they are likely to adopt it to capitalise on its merits in the modern
environment.
2. To examine the most important factors which influence the successful adoption of
technopreneurship in the food processing sector in Zimbabwe.
This is one of the objectives of the research which contributes towards the examination of the factors
influencing the successful adoption of technopreneurship. The examination of such factors assists
stakeholders such as industrialists and policy makers to anticipate such factors and contribute to new
knowledge in technopreneurship. If technopreneurship is adopted, the adoption can be limited by some
elements whose negative impact need to be minimised and positive impact maximised.
Technopreneurship could be widely applied in the industrial food processing sector, but the feasibility of
such an application is important. Such issues as demand in the domestic market, organisational capacity

Page 15
and organisational competence, food processing technology, technopreneurial knowledge and skills could
determine.
3. To examine the feasibility of technopreneurship in the food processing sector in Zimbabwe.
Industrial food processors in Zimbabwe can be limited in their adoption of technopreneurship if other
elements like demand and competition are not considered. Apart from other determinants of the adoption
of technopreneurship, such elements need to be examined so as to achieve the goal of the research.
4. To test the relationship between factors that influence the adoption of technopreneurship and
employee demographic characteristics in the industrial food processing sector in Zimbabwe.
One of the key elements to technopreneurship is innovation. Innovativeness of an individual may be
aligned to the area of specialisation. Most employees may be specialised in either: business, engineering
or both and as such this may have an implication on the innovativeness of the individual.
Further to the feasibility of technopreneurship in the industrial food processing sector, there is a need to
determine the critical success factors. A technopreneurial organisation should have such attributes as
innovativeness and flexibility to make it an enabling environment. The noting off such critical success
factors would also assist stakeholders to be informed and respond accordingly.
1.10 Type of Study
The study adopted the positivism research philosophy, which believes that the truth exists and can be
discovered (Hepper et al., 2015). In fact, the research was guided by a postpositivism philosophy which
shares the same beliefs as the positivism but goes on to say that, the truth cannot be fully discovered, but
we can only make probabilistic statements about the truth (Creswell, 2009; Hepper et al., 2015). That is,
the research endeavours to examine determinants of the successful adoption of technopreneurship but will
not make absolute statements of these factors but probabilistic statements of the determinants. According
to Sekaran and Bougie (2009:126) investigations can either be causal or correlational; where causal
research is suitable “when it is necessary to establish a definitive cause-and-effect relationship”; while
“correlational study is when there is need for “a mere identification of the important factors associated
with the problem” at hand (adoption of technopreneurship). In this study, it was realised that it was
difficult to establish the absolute cause and effect relationship. This was so given the fact that there are
numerous variables (independent variables) that influence the dependent variable (adoption of
technopreneurship) other than the ones explored from literature. As such, the study focused on identifying
the crucial factors associated with the adoption of technopreneurship and did not establish a cause-and-
effect relationship (Sekaran and Bougie, 2009). Therefore, a descriptive research design was adopted in

Page 16
the study. That is, the researcher described what was observed (Maxfield, 2015). Thus, the researcher
deduced, from the responses, factors influencing technopreneurship and described these factors. The
design is compatible with the phenomenological philosophy, quantitative research strategy and survey
method. Regarding the research strategy, the study adopted the quantitative research. In quantitative
research, the emphasis is made on quantifying when gathering and analysing data (Bryman and Bell,
2015). The strategy provides straightforward quantified data that can answer questions through deduction.
Quantified data can be gathered through a standardised questionnaire. To achieve the goal of the study,
the researcher collect data using the survey research method. According to Denscombe (2010), a survey
is a research strategy that aims at measuring some aspect of a social phenomenon through gathering facts
by asking questions. The subject of technopreneurship combines two areas of study, that is,
entrepreneurship and technology to gather the desired information, questions about entrepreneurship,
technology and technopreneurship specifically.
A survey gathers data by asking questions to the target respondents. Mustafa (2010) indicates merits and
demerits of survey research as:
Merits:
Widely use the method and has universal application
It is based on actual observation
Useful in leading to hypothesis formulation
Gives the researcher an opportunity to personally experience realities of life
Can be used to test the validity of many theories
Avoids the possibility of personal biases
Time effective
Makes a calculation of the sampling error possible
De-Merits:
It demands resources, both financially and human
Lacks uniformity during data collection
Time-consuming
Many challenges during field work
Lacks flexibility
Cannot be done on historical retrospect studies
The researcher obtained a sample of 147 respondents from the population of employees of nine industrial
food processing technopreneurs in Zimbabwe after administering a standardised questionnaire to the
Page 17
selected companies. A mainly purposive sampling approach was employed to come up with the desired
sample. Purposive sampling was used to select the employees who met the criteria of being an
administrator, manager, technician, scientist, technologist or engineer. Such employees were taken to have
the desired information sought in the study. It then follows that the research is mainly quantitative.
Quantitative research is a means for testing objective theories by examining the relationship among
variables (Ingham-Broomfield, 2014).
It has to be noted that the initial intention was a sample of at least 200 workers from ten companies, but
the researcher could only get 147 respondents from nine companies which were not equally represented.
Circumstances and situation in the country made the attainment of the sample size not feasible. During at
least three months of field data collection through hand deliveries in Harare industries, it was discovered
that:
1. Other gatekeepers who had previously signed consent letters reversed their previous decisions and
refused access to their employees. They stated reasons of the researcher being late and required a new
arrangement that proved difficult as they could continuously postpone to the frustration of the
researcher. Some could indicate that they only allow access to researchers that they sponsor. In fact,
there is hostility between Universities and industry in Zimbabwe. This points to the lack of knowledge
and management principles crucial for innovation in an economic system.
2. In companies in which access was allowed, the response rate was overwhelming in other companies
while very low in others. Where there was a low response, the reason was mainly staff’s low morale.
2015 was marked with massive retrenchment owing to the companies facing viability challenges (CZI,
2015) as well as some Supreme Court rulings which saw an estimated number of 30000 people being
retrenched in August 2015 (Kariati, 2015). Therefore, workers felt insecure and feared that their
employment was at stake. As such they had no motivation to respond to issues which seemed not to
address their immediate problems.
3. The mentioned main causes of a smaller sample size were strengthened by the required ethical
standards of University of KwaZulu-Natal ethical requirements. According to the ethical standards,
gatekeepers and respondents are at liberty to cooperate or not. As such the researcher maintained high
ethical standards to meet the University requirements and used strategies such as snowballing to
secure cooperation from respondents in companies whose gatekeepers had allowed access.
The research is guided by the postpositivism philosophy that refers to the belief that causes probably leads
to the effects (Creswell, 2009). The study concentrates on industrial food processing technopreneurs in
Harare which are representative of all industrial food processing technopreneurs in Zimbabwe. Most of
the industrial food processing activity takes place in Harare. Hence the sample would be representative of

Page 18
the population. The research covers the period from 2009 to 2015 since in 2009 the economic trend turned
from a recession to a revival. That is, 2009 has all the qualities of being the base year.
1.11 Delimitation of the study
Geographically, the study took place in Harare which houses all the industrial food processors of
Zimbabwe. The targeted organisations are the industrial food processors which are organisations and part
of the manufacturing industry in Zimbabwe. Within the industrial food processing companies, respondents
who were deemed to be rich in organisational information would be targeted as respondents such as
managers, technicians, administrators and scientists. Technopreneurship would be taken as the area of
study but included aspects of entrepreneurship as the broader area of study and innovation as an important
aspect of technopreneurship.
1.12 Significance of the study
The original contribution of this study is considered to be the analysis and examination of the factors
influencing technopreneurship in the industrial food processing sector. Technopreneurship is considered
in the form of corporate entrepreneurship or intrapreneurship; that is, entrepreneurship in an existing
business operation. This is an important branch of entrepreneurship since it ensures sustainability,
survival, development and growth of existing organisations. The study contributes to both theory and
practice of technopreneurship in the industrial food processing sector in Zimbabwe and other developing
economies. It has an input to mainly existing industrial food processing operations. However, existing
business operations can be diversified and expanded by introducing new operations. Much input is at the
micro-economic level and to some extent also at the macro-economic level as an upcoming concept and
area of study. At the macro level, technopreneurship is one of the policy guides to modern economic
policy makers.
Technopreneurship is viewed as a process through which technopreneurs go through to achieve their
objectives. The view is discussed in Section 3.7 of Chapter 3 and materialise in the conclusions and
recommendations, mainly in Figure 8.1, the new knowledge accumulated in the study. The process is
taken to involve perceiving a technopreneurial opportunity, pursuing the opportunity and exploiting the
opportunity. The technopreneurial process is however taken to be taking place in an environment which
impact on it. The technopreneurial process is impacted by environmental forces and this enhances the
process perspective to a systematic perspective. Thus, technopreneurship is a process influenced by
internal and external factors. The broader picture of technopreneurship is also clarified in theory and
practice as different concepts are analysed and related to the subject area. These include such concepts in
theory and practice as knowledge spillover theories, innovation theories, value addition, academic
entrepreneurship, technology parks, technology transfer and technology sourcing. The understanding of

Page 19
these concepts in perspective broadens the understanding of technopreneurship as a subject area. A model
is proposed to simplify the understanding of factors influencing technopreneurship especially in a
developing country like Zimbabwe in sub-Saharan Africa. Mostly factors influencing technopreneurship
were researched before, but in developed countries and, therefore, this study initiates the closing of a
critical gap in theory and practice. The conclusions and recommendations of the study also contributed to
practice in other manufacturing sectors. Thus, the research has an influence on organisational policies,
sectoral or industrial policies, national policies, regional policies as well as global policies. It assists
organisations and economies to be competitive in the current globalised market.
1.13 The conceptual framework
To guide the study, Figure 1.3 represents a conceptual framework or theoretical framework. Sekaran and
Bougie (2009) define a theoretical framework as consisting of the researcher’s beliefs about the
relationship between certain phenomena and the explanation of the belief. There are two variables: Factors
influencing technopreneurship is the independent variable and the technopreneurial performance in
industrial food processing is the dependent variable.
Bhattacherjee (2012) defined different forms of variables in a conceptual framework as follows:
Independent variable – the variable that determine other variables
Dependent variable – the variable that is determined by another variable
Mediating variables – the variable determined by the independent variable but also determines
the dependent variable
Moderating variables – variables are influencing the relationship between the independent and
dependent variable
The variables can be presented as follows (Table 1.3):

Page 20
Table 1.3: Independent, dependent and intervening variables of the study
Independent Variable Moderating and Mediating
Variables
Dependent Variable
Factors influencing
technopreneurship
Internal processes
Human factors
Venture capital
Partnerships
Government support
Global factors
Macro environmental
factors
Political environment
Economic environment
Social environment
Technological
environment
The degree of adoption of
technopreneurship in the Industrial
food processing sector
Entrepreneurship
Innovation
Foreign direct investment
Technology transfer
Technology sourcing
Technoparks
Industrial clusters
Source: Own compilation
From Pakrad et al. (2012) the framework will take internal processes as it is and will consider individual
factors under the theme Human factors; institutions will be considered under venture capital, and
external networks will be dealt with under private and public partnerships. Lastly, the framework will
concentrate on the theme that looks at factors that influence the growth and formation of a technological
(food processing) firm (Bailetti, 2012). The study focuses on existing manufacturing projects, that is,
those who are already operational (corporate entrepreneurship). However, it still touches new industrial
food processing projects given that the corporate sector can start new industrial food processing projects.
The framework investigates technopreneurship as a system that is influenced by other variables which in
turn impacts on food processing. The variables include internal processes, human factors, venture
capital, partnerships, government support and global factors.

Page 21
Figure 1.2: The conceptual framework
Source: Own compilation
1.14 Outline of study
This study is reported in eight chapters. This chapter is the first one and chapter two covers the economic
situation and the industrial food processing sector in Zimbabwe. Chapter three deals with the content of
technopreneurship as an area of study. Chapter four discusses the perspectives of technopreneurship and
their application in Zimbabwe. Chapter five covers the research methodology and methods. Chapter six
presents the research findings. Chapter seven discusses the research findings and Chapter eight covers the
research conclusions and recommendations. The chapters can be outlined as follows:
The degree of adoption of
technopreneurship in the
Industrial Food processing
sector
Corporate Technical
entrepreneurship
Knowledge spillovers
New technological projects
Innovation theories
Foreign direct investment
Technology sourcing
Value addition
Technology parks
Industrial clusters
Technopreneurship process
Factors influencing
the successful
adoption of
Technopreneurship
Internal processes
Human factors
Venture capital
Partnerships
Government
Support
Global factors

Page 22
Chapter 1: Nature and scope of the study
This part covered the clarification of the topic and background to the study. It further encompasses the
research problem, objectives of the study and research questions.
Chapter 2: Zimbabwe and the food processing sector
The chapter investigates Zimbabwe as an economy, the manufacturing industry in general and the food
processing sector in particular. A description of Zimbabwe, a map, the various sectors and elaboration of
industrial food processing regarding importance, challenges, benefits and the role of technology. The
international situation of industrial food processing business is also reviewed.
Chapter 3: Technopreneurship. The chapter deals with empirical and theoretical literature in
technopreneurship. It identifies international trends; implementation and lessons learnt regarding
technopreneurship; then move to Zimbabwe and the state of technopreneurship in general in the country
– focus more specifically on the industrial food processing sector; identify variables/ factors with sources.
Other related areas covered include entrepreneurship, technology, innovation, industrialisation and
knowledge-based economies. The conceptual framework is further amplified.
Chapter 4: A Theoretical framework for the study
This chapter covers the theoretical framework of technopreneurship. Different perspectives and
approaches of technopreneurship are discussed and its application in practice. The perspectives covered
include knowledge spillovers, innovation theories; the technology transfer theory; University spin-off
theory; the cluster approach; the technological parks perspective; the foreign direct investment theory and
the value addition perspective. It explores how the perspectives are linked to the objectives and research
instrument.
Chapter 5: Research methodology
Chapter five clarifies such methodological issue like research philosophies and designs in detail. These
are dovetailed by issues like data collection approaches, research instruments, types of data to be gathered,
contact methods, sampling procedures and data analysis techniques.
Chapter 6: Results
This section captures all the findings from the study, to include data presentation and analysis from the
statistical packages. Tables, graphs and inferential statistics were also used to satisfy the research
objectives.

Page 23
Chapter7: Discussion
The data analysis in Chapter six is further discussed to derive the solid meaning of the findings. The
ultimate aim is to develop a technopreneurial model to guide manufacturing companies, technologists and
scientists in developing countries to venture in the manufacturing business.
Chapter 8: Conclusions and Recommendations
Lastly, the thesis summarises the discussion and makes relevant conclusions from the findings that lead
to recommendations for further research and potential investors in developing economies.
1.15 Summary
The thesis aims to study the factors that influence technopreneurship in the food processing sector of
Zimbabwe. The Zimbabwean food sector, like the whole manufacturing industry in Zimbabwe, has been
characterised by massive de-industrialisation. Companies are operating below capacity and most of these
were retrenching, downsizing and closing down. The world economic development programmes are
technologically and entrepreneurially driven. Zimbabwe is not an exception and in the endeavour to
develop has technological and entrepreneurial policies that seem not to address the economic and
industrial dilemma. The research emphasised manufacturing given the weaknesses brought about by
economic policies that relied on trading of raw commodities thereby losing out on employment creation,
income per capita and government income through taxes that gain through manufacturing and trading of
finished products.
The objectives of the study include, to: examine factors that influence the successful adoption of
technopreneurship in the food processing sector in Zimbabwe; assess the importance given to
technopreneurship in the food processing sector in Zimbabwe; examine the feasibility of
technopreneurship in the food processing sector in Zimbabwe and test the relationship between factors
that influence the adoption of technopreneurship and employee area of specialisation in the industrial food
processing sector in Zimbabwe. The data collected has a bearing on the innovativeness of the industrial
food processing technopreneurs about the adoption of upcoming industrial food processing technologies
and exploiting the technopreneurial opportunities in the national and global environment.
The study assumes a positivist philosophy and descriptive research design to gather quantitative data on
the factors that influence the successful adoption of technopreneurship in the food processing sector
through a survey method. This was achieved through a survey questionnaire circulated in the food
processing companies who cooperated. Some cooperated, but some declined to participate leading to a
smaller sample of 147 respondents that the researcher adopted given the ethical standards of the study.

Page 24
The chapter introduced the topic and area of study. Issues such as the background of the study, problem
statement, research questions, objectives, type of the study, the significance of the study, the definition of
terms as well as the outline of the study were covered. Some insight of the Zimbabwean economic and
industrial situation may be required. The next chapter sheds some light on Zimbabwe and the food
processing sector.
Page 25
CHAPTER 2: ZIMBABWE AND THE FOOD PROCESSING
SECTOR
2.1 Introduction
According to Monyau and Bandara (2015), the Zimbabwe 2014 economy had estimated indicators which
were: real GDP growth of 3.1%; Real GDP per capita growth of 0%; CPI inflation of -0.1%; Budget
balance % GDP of -2.4% and Current account balance % GDP of -23.1%. By August 2015, it was
expressed that the government was moneyless and struggling to raise its monthly civil service wage bill
(Mutenga, 2015). This is only one of the symptoms of an economic crisis in the nation. Other indicators
are a high unemployment rate of 80% (Ndlela, 2015); year-to-year deflation rate of -2.77% (Financial
Gazette, 2015); too old infrastructure leading to power shortages (Financial Gazette, 2015). These are
symptoms of a declining economy which analysts indicate that a contracting economy leads to shrinking
organisational operations; severe unemployment and reduction in income per capita (Ndlela, 2015). It is
a vicious cycle of each indicator pointing to the other. The other economic indicators of interest in 2015
were government external debt and budget deficit. Trading Economics (2015) indicated that the
Zimbabwean 2014 budget deficit was pegged at 2.40% of GDP. According to Chinamasa (2015) in his
2015 midterm fiscal policy review statement, the nation had a domestic debt amounting to US$1.7 Billion
and an external debt to the tune of US$6.7 billion which was 47% of the gross domestic product. By June
2015, the country’s public and publicly guaranteed debt was reported to be US$8.4 billion (Chinamasa,
2015). The chapter examines Zimbabwe as an economy, the manufacturing industry in general and the
food processing sector in particular. A description of Zimbabwe, a map, the various sectors and
elaboration of industrial food processing regarding importance, challenges, benefits, and the role of
technology are discussed. The international situation of food processing business is also reviewed.
2.2 The Zimbabwean Economy
According to African Development Bank Group (ADBG, 2014) the Zimbabwean economy is fragile;
marked by deindustrialisation, high external debt and formalisation. These have been mainly driven by
liquidity challenges, ageing technologies, shortages, infrastructure deficits, corruption and a volatile
global financial environment. Other factors adversely affecting the business environment include
constrained fiscal policy; lack of some monetary policy because of a multicurrency system; “policy
inconsistency, funding constraints, corruption, inefficient government bureaucracy and inadequate
infrastructure” (ADBG, 2014). Monyau and Bandara (2015) summarise the economic situation by their
statement:
“The economic recovery in recent years has been underpinned by the mining and agriculture sectors,
which accounted for 93.5% of export revenues between 2009 and 2013. Mining, which made up 65.2% of

Page 26
export earnings over the same period, is a typical enclave sector, with weak linkages to the rest of the
economy. It is also capital intensive, with limited employment creation opportunities. The manufacturing
sector saw a drop in activity between 2011 and 2014: at least 4 610 companies closed down, resulting in
a loss of 55 443 jobs (2015 Budget Statement). On top of this, more than 80.0% of workers are employed
in the informal sector”.
Zimbabwe is experiencing deflation with prices decreasing by an average of -2,65% between April 2014
and April 2015; with “the year-on-year Food and Non-Alcoholic beverages standing at -2,93 percent”
(Financial Gazette, 2015). One would wonder what effect that has on the economic activity. Figure 2.1
models the scenario. It means lower product prices that lead to smaller cash flow and profits that lead to
low production. Reduced production means reduced unemployment and reduced expenditure on
commercial products and leading to oversupply and back to reduced prices.
Figure 2.1: Effects of deflation on the economy
Source: Financial Gazette (2015)
According to Techfin Research quoted in Financial Gazette (2015) analysis indicates that the deflation
situation can be interpreted as:
The nation is experiencing slow economic growth.
There is a weakening of aggregate demand.
There is the promotion of high unemployment.
There is tight liquidity.
There are increased loan defaults.

Page 27
There is reduced lending by banks to productive sectors.
The August 2015 year-on-year Zimbabwean inflation was reported to be -2.77% showing a further
downward trend (Financial Gazette, 2015).
2.3 Level of Democracy and economic development
Zimbabwe attained its independence in 1980 and, to date, the leader of the nation has been President
Robert Mugabe who is the leader of the ruling party Zanu-PF which has mainly a socialist ideology
(Sichone, 2003). That is, political ideologies determine the economic policies advocated by the
government and are mainly determined by the ideology of the ruling party. After the 2013 harmonised
elections in which Zanu-PF worn through the use of state power, the elections for the 35th time, President
Robert Mugabe has been described as a dictator (Southall, 2015). Discussions are on to analyse the effects
of levels of democracy on economic activity (McChesney, 2015). Henrekson and Jakobsson (2001)
indicated that experiences in Eastern Europe highlight the incompatibility of the full-fledged socialist
system and a democratic system. On the other hand, Crouch (2015) comments that capitalism and
democracy can be antagonistic systems as well as complementary systems, and extremes of either system
are detrimental – however, the detriments of a democratic system are better than the detriments of a
capitalistic system. That leaves democracy with superiority over other systems. McChesney (2015) asserts
that democratic infrastructure is the foundation of effective economic activity and enables entrepreneurs
to invest without much inference as well as empowering the citizens. Thus, the lack of democracy in
Zimbabwe leads to ineffective economic activity. In this thesis, Zimbabwe is compared to different
economies that some may have better levels of democracy while other may have the same levels of
democracy relatively. In general, developed countries / 1st world countries are relatively more democratic
than developing countries / 3rdworld countries. That means technopreneurship can be seen to be more
successful in more democratic nations than those under a dictatorship like Zimbabwe.
2.4 Contribution of Zimbabwe in the SADC region
The South African Development Community (SADC) region is composed of 15 countries, in alphabetical
order: Angola, Botswana, Democratic Republic of Congo, Lesotho, Madagascar, Malawi, Mauritius,
Mozambique, Namibia, Seychelles, South Africa, Swaziland, Tanzania, Zambia and Zimbabwe. The
major focus of SADC is to achieve political and economic integration but this has been hampered by
different economic development levels in the nations (Moyo, 2014).
Zimbabwe contributes in the SADC region mainly through imports and exports. Nyoni (2014) indicated
that Zimbabwe exports to SADC countries though dominated by commodities, increased from 2009 to
2013 by 113%. It has to be noted that, this period was a period of relatively political stability brought by
Page 28
a Government of National Unity (GNU) through a Global Political Agreement between the Zimbabwean
political parties. A different scenario can be noted after the 2013 elections where ZANU-PF used state
machinery to win the elections. The Zimbabwean balance of trade in December 2014 was pegged at –
USD$290.99 million, which shows a serious deficit because of decreased local industrial activity and
increased imports (Trading Economics, 2016).
The exports to SADC were mainly Minerals (diamonds, nickel, iron and steel), tobacco, cotton, sugar,
cement, raw hides and skins, and wood products while the nation’s imports included fertilizers, petroleum
oils, nickel matte, maize, animal feeds, motor vehicles and electrical energy. Of interest to this study are
the food products which Zimbabwe is importing instead of producing. Moyo (2014) indicated that
Zimbabwe and other SADC countries are mainly consumers of an industrialised South African economy.
Despite the issues of global warming and climate change which has caused persistent drought and food
shortages in the nation, as well as the dictatorship system in the political situation in Zimbabwe, industrial
food processing technopreneurs can still capitalise on other opportunities brought by the global
technological trends.
2.5 Distribution of economic activities
The major economic activities in Zimbabwe are:
Mining – This is the leading income generating activity for the government with exports of minerals
such as platinum, gold and diamonds.
Agriculture – Is also one of the pillars of economic sustenance with the industrialised produce like
tobacco, sugar cane and cotton generating income for the government and maize/corn sustaining
families.
Manufacturing – After recording the highest decrease of 73.3% between 2006 and 2008 (Ministry of
Industry and Commerce, 2012), the manufacturing activity witnessed a further decrease between 2011
and 2014 with about 4 610 companies closing down and resulting in a loss of 55 443 jobs according
to Monyau and Bandara (2015) quoting the Zimbabwe 2015 Budget Statement.
Services – these cover banking and finance, tourism and communications.
All industries especially the mining and services sector employ more than 80.0% of workers in the
informal sector (Monyau and Bandara, 2015) leading to an informalised economy. Zimbabwe covers an
area of 390 757 square kilometres with a population of 13 061 239 according to the 2012 population
census (ZIMSTAT, 2015). Figure 2.2 presents the general map of Zimbabwe. Zimbabwe is an African
nation that is in Sub-Saharan Africa; landlocked and surrounded by four countries – Mozambique,
Zambia, South Africa and Botswana. The location of the study was Zimbabwe, particularly in Harare.
Zimbabwe is in Southern Africa and within the South African Development Community (SADC).

Page 29
The major economic activities, mining and agriculture, are found all over the nation, however with head
offices housed mainly in Harare, which is the capital. This is the situation with other sectors like tourism
and the financial sector. The situation is a bit different for the manufacturing industry, where production
is concentrated in Harare with head offices in the capital Central Business District (CBD).
Figure 2.2: The general map of Zimbabwe
Source: World Atlas (2015)

Page 30
Harare was chosen since it is the location of most industrial food processing technopreneurs; in fact, most
of the manufacturing companies are headquartered in Harare with smaller branches in other smaller cities.
Industrial food processing is concentrated in the Harare heavy and light industrial areas.
Figure 2.3: Harare Area Map
Source: Harare City Council (2015)
In Harare, industrial food processing technopreneurs are located in different industrial areas with offices
in the city centre. The industrial areas include Ardbenie, Graniteside, Willowvale, Ruwa, Chitungwiza,
Workington, Southerton and others. The industries cover approximately a 40km radius. The industries
with other companies having sub-branches in other towns, produce for the whole nation and some for
other neighbouring countries.

Page 31
2.6 Zimbabwe economic system historically
The current Zimbabwe has its background traceable from 1980 when it attained its independence from
Britain or Great Britain or United Kingdom. According to Soludo et al. (2004) Zimbabwe inherited by
then one of the economies with one of the strongest industrial bases in Sub-Saharan African nations north
of the Limpopo River. From 1980 to 1990 the government adopted a corporatist economic programme
that was dropped and replaced by a liberal programme that ended in an economic crisis in around 1997
(Bonga, 2014; Brett, 2005). The corporatist economic system involved subsidies, price controls, licening,
redistributive transfers and control of economic activity and the private sector with the government being
the sole operator in a significant part of the economy (Brett, 2005). In 1990, the policy maker adopted a
liberal economic programme known as Economic Structural Adjustment Programme (ESAP) which
involved the removal of controls in trade, investments, credit, foreign exchange and labour (Brett, 2005;
Davies, 2004; Davies and Rattsø, 2000). That is, it involved the government relinquishing some of its
burdens to the private sector with other players coming in previously government monopolised activities.
ESAP could not last for a decade because of policy failure and was replaced by the Zimbabwe Programme
for Economic and Social Transformation (ZIMPREST) in 1996 to 2000 (Bonga, 2014; Brett, 2005;
Sichone, 2003). The major goal of ZIMPREST was to correct the shortfall of ESAP through creating a
stable macro-economic system that promote higher investments and improved livelihood (Bonga, 2014;
Sichone, 2003). ZIMPREST was succeeded by the Millennium Economic Recovery Programme (MERP)
in 2001 to 2002. At the end of ZIMPREST in 2000, there was Fast Track Land Reform Program (FTLRP)
which supported land acquisition by indigenous black people from white commercial farmers. Since the
introduction of ESAP, the Zimbabwean economic performance was continuously retreating so the major
objective of MERP was to enhance economic performance by protectionism and stabilisation of prices
(Bonga, 2014). MERP lasted only for two years because of the political disaster of farm invasions and
was replaced by the National Economic Revival (NERP) in February 2003 (Bonga, 2014). NERP mainly
was put in place to save people from long-term drought and redistribution of land through a land reform
programme (Bonga, 2014).
NERP lasted for some time with the government unable to launch a well-defined economic policy up to
2008 when the Government of National Unity (GNU) was put in place. NERP marked the end a
sustainable economy that was described by Moyo and Basada (2008:7) as:
“Economic turmoil, caused by failed land reforms and inflation, combined with increased malnutrition,
and evaporating access to education, health care, and employment have only exacerbated unrest,
particularly for constituencies who receive few benefits from President Robert Mugabe's regime.”

Page 32
The birth of the GNU through the Global Political Agreement (GPA) saw the launch of the Short Term
Emergency Recovery Programme (STERP) in 2009 to 2012. STERP was part of the implementation of
GPA. Bonga (2014:9-10) states that:“The key priority areas of STERP were Political and Governance
Issues constitution and the constitution-making processes, media and media reforms, legislations reforms)
intended at strengthening governance and accountability, promoting governance and the rule of law and
promoting equality and fairness, including gender equality.”
From 2013 to 2018 there is the Zimbabwe Agenda for Sustainable Socio-Economic Transformation
(ZIMASSET) whose goal can be summarized by a quotation of Bonga (2014:10) from the speech of the
president on the launching ceremony as:
“In pursuit of a new trajectory of accelerated economic growth and wealth creation, my Government has
formulated a new plan known as the Zimbabwe Agenda for Socio-Economic Transformation (ZIMASSET):
October 2013 to December 2018. ZIMASSET was crafted to achieve sustainable development and social
equity anchored on indigenisation, empowerment and employment creation that will be largely propelled
by the judicious exploitation of the country’s abundant natural and human resources.”
Thus, this study took place during the era of ZIMASSET, where the controversial indigenisation
programme is being implemented. Bonga (2014) warns that without the collaboration of economic agents
and all sectors and stakeholders, the programme will once again be a failure and proposed that the business
community and the government work together to eliminate sabotage. That is without proper governance,
coordinated effort and management of internal and external relationships the programme will be a failure.
The Fast Track Land Reform Programme (FTLRP) is classified as one of the policy failures (Murphy,
2013; Munangagwa, 2009). The FTLRP marked the beginning of the worst economic policy ever and
buttressed by the controversial the Indigenisation Act of 2008 which is still effective in ZIMASSET and
which condemns economic development through Foreign Direct Investments (FDIs) thus heading for
failure (Murphy, 2013), especially in the current globalised economy.
According to Murphy (2013), economic policy failure is characterised by social suffering, economic crisis
and political instability. Hungwe (2015) reported that President Robert Mugabe on his 91stbirthday
admitted that the controversial land reform programme was a failure when he was quoted saying, “I think
the farms we gave to people are too large. They can't manage them.” This was a reflective statement by
some aged man who has had some long experience with several economic programmes that all failed.
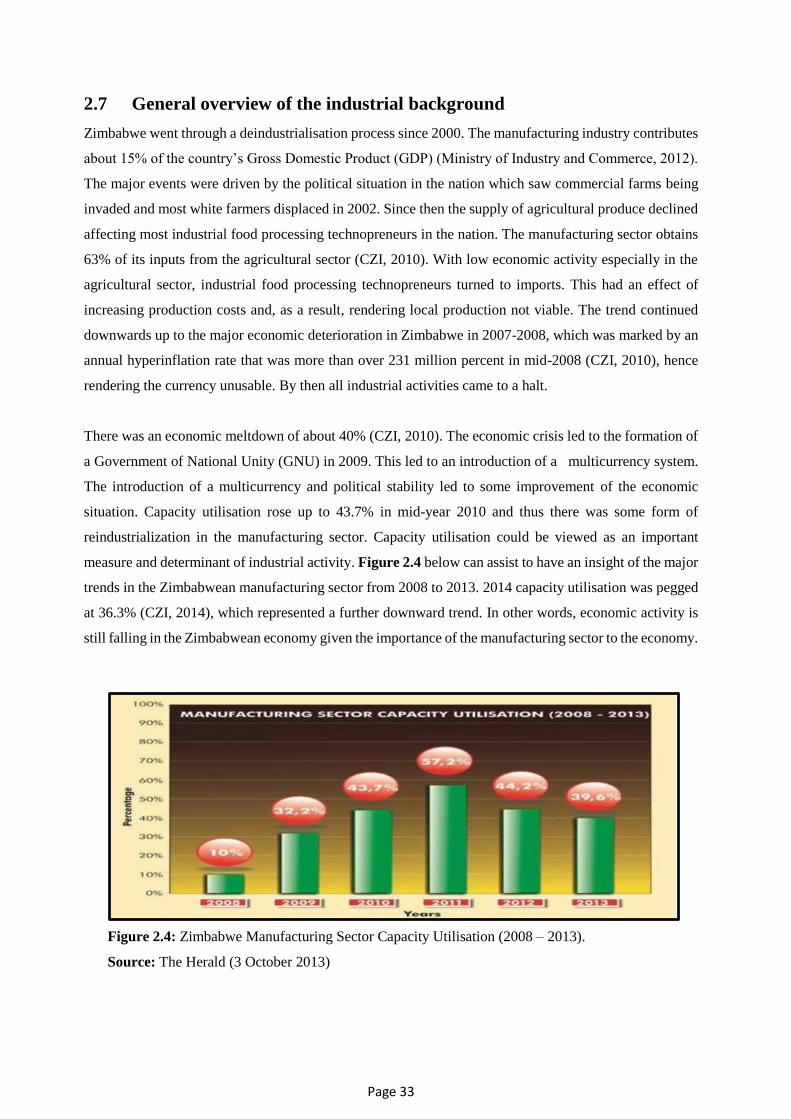
Page 33
2.7 General overview of the industrial background
Zimbabwe went through a deindustrialisation process since 2000. The manufacturing industry contributes
about 15% of the country’s Gross Domestic Product (GDP) (Ministry of Industry and Commerce, 2012).
The major events were driven by the political situation in the nation which saw commercial farms being
invaded and most white farmers displaced in 2002. Since then the supply of agricultural produce declined
affecting most industrial food processing technopreneurs in the nation. The manufacturing sector obtains
63% of its inputs from the agricultural sector (CZI, 2010). With low economic activity especially in the
agricultural sector, industrial food processing technopreneurs turned to imports. This had an effect of
increasing production costs and, as a result, rendering local production not viable. The trend continued
downwards up to the major economic deterioration in Zimbabwe in 2007-2008, which was marked by an
annual hyperinflation rate that was more than over 231 million percent in mid-2008 (CZI, 2010), hence
rendering the currency unusable. By then all industrial activities came to a halt.
There was an economic meltdown of about 40% (CZI, 2010). The economic crisis led to the formation of
a Government of National Unity (GNU) in 2009. This led to an introduction of a multicurrency system.
The introduction of a multicurrency and political stability led to some improvement of the economic
situation. Capacity utilisation rose up to 43.7% in mid-year 2010 and thus there was some form of
reindustrialization in the manufacturing sector. Capacity utilisation could be viewed as an important
measure and determinant of industrial activity. Figure 2.4 below can assist to have an insight of the major
trends in the Zimbabwean manufacturing sector from 2008 to 2013. 2014 capacity utilisation was pegged
at 36.3% (CZI, 2014), which represented a further downward trend. In other words, economic activity is
still falling in the Zimbabwean economy given the importance of the manufacturing sector to the economy.
Figure 2.4: Zimbabwe Manufacturing Sector Capacity Utilisation (2008 – 2013).
Source: The Herald (3 October 2013)

Page 34
2.8 Industrial Development Policy (IDP)
Industrialisation is taken to be critical to economic development in Zimbabwe. Aiming to show the
importance of industrialisation, the government developed an IDP. The previous IDP addressed 2004-
2010. According to The Ministry of Industry and Commerce (MIC, 2012), the major drawback to the
success of the IDP 2004-2010 was viewed as the absence of a mechanism for institutional funding with
enough resources that was specifically targeted to help the manufacturing sector. The IDP 2012-2016 has
a particular emphasis on promises to design a plan to harness resources for the manufacturing sector.
Furthermore, it also includes other policy strategies like plant, equipment and skills audit; import
substitution; value addition; tariff regime; technology transfer, and research and development. Cluster
initiative is also taken as an industrialisation strategy that succeeded in other economies like the Republic
of Korea, Malaysia and Pakistan. The IDP 2012-2016 is in full support of the Indigenisation and Economic
Empowerment Act [Chapter 14:33] (IEEA) which holds that at least 51% of ownership of all public
companies or all other businesses should be owned by indigenous Zimbabweans (IEEA, Chapter 14:2004).
2.9 Food processing sector
The food processing sector is a sub-sector of the manufacturing sector in Zimbabwe. Like the general
manufacturing sector, the food processing sector was equally affected by the political and economic
challenges in the nation. Perhaps owing to the political and economic challenges, there is not enough
formal information, readily available for use by researchers and other users. The study obtained
information of the food processing sector from records of CZI, annual reports and the stock exchange. In
addition to the different sources of data, availability of food products on the retail market could also point
to the existence of the food processing company. Generally, 64 companies were registered on the
Zimbabwe Stock Exchange (ZSE) on 1 September 2015, and only three companies were classified as in
the food sector and two in the beverage sector. Other sectors included the agricultural sector, mining
sector, technology sector, banking and finance, and tourism. Therefore, it can be concluded that 5 out of
64 companies listed on the ZSE are the food and beverage sector, which is about 8%. The implication of
such an issue is the low performance of the industry. The industry was not spared by the global economic
meltdown, which was characterised by companies’ downsizing, retrenching and others closing in great
numbers. The CZI has a membership of companies in the general manufacturing sector. While at least 50
companies are members of CZI, seven are from the food processing sector. Companies that are members
of CZI are mostly from the private sector. Multinationals and parastatals are not members of the
organisation. The food and beverage sector used to have their own sub-association to cater for their unique
needs but it dissolved owing to the rampant political and economic sectors. In general, the food processing
sector in Zimbabwe specialises in different food stuff. The specialisations cover meat processing, dairy
products, beverages, cereals and snacks, mealie meal production, rice processing and packaging, cooking
oil and others. About 15 companies, some of which are subsidiaries of others are still operational in the

Page 35
industrial food processing sector in Zimbabwe. In Harare, industrial food processing technopreneurs are
located in different industrial areas with offices in the city centre. The industrial areas include Ardbenie,
Graniteside, Willowvale, Ruwa, Chitungwiza, Workington, Southerton and others. The industries cover
approximately a 40km radius. The industries with other companies that have sub-branches in other towns
produce for the whole nation and some for other neighbouring countries.
2.10 Challenges of the food processing sector
The challenges faced by the food processing sector are not unique but those are affecting the whole
manufacturing industry and the economy at large. According to the CZI (2014), such challenges include
unchanged economic policy, low local demand, liquidity crunch and lack of capital inflow. Table 2.1
summarises challenges gathered from six food processing companies’ reports. The challenges highlighted
in Table 2.1 have led to continuous shrinkage of the food processing sector with some of the companies
closing and the remaining retrenching as survival strategies. The industry is marked by a floodgate of
litigations.
Table 2.1: Challenges faced by some industrial food processing technopreneurs in Zimbabwe
Company Highlighted challenges
1
Shortage of locally produced raw materials; Lack of supplies; Competition from finished
imports; Power supply; Overhead costs; Reduced disposable incomes; Regional competitor
activity
2 The environment turbulent, challenging and unpredictable; regional competition
3
Shortage of supply of raw materials; lower disposable income, declining consumer
purchasing power; competition from imported finished food products; cheaper South African
imports
4 Compromised control and governance environment, ceuipment failures – operating an ageing
facility
5 Shortage of inputs; power and water outages; labour disputes; high cost of Utilities; high price
competition; deflation – retail price index of -2.81% and -3.32% for food and beverages
6
Inadequate capital financing; declining capacity utilisation; high cost and unreliable supply
of utilities such as energy and water; increasing costs of key raw materials; competition from
cheaper imports; limited lines of credit and the high cost of capital.
Source: Own compilation from annual reports of food processing companies in Zimbabwe

Page 36
Looking at the local supply side of the industrial food processing sector, Mutenga (2015) indicated major
factors affecting the agricultural sector as:
the successive droughts,
poor investment in production,
lack of cheaper lines of credit,
lack of equipment, and
the high cost of inputs.
Mutenga (2015) went on to assert that the factors had “taken a toll on Zimbabwe’s agricultural sector,
which has failed to ensure food security and also feed the country’s agriculture-based industries.” This is
supported by the fact that shortage of inputs is a pertinent factor affecting the industrial food processing
sector and shortage of inputs leads to increased cost of inputs and production. The latest development was
the 17th July 2015 Supreme Court ruling that led to about 30 000 workers being retrenched within 30 days
on no package (Martel, 2015). This was replaced by the Labour Amendment Act 5, 2015 which was
launched in retrospect in August 2015. The scenario has brought workers to work under fear and
uncertainty. The workers feel they have no job security; as a result, they are hostile.
Other factors include the infrastructural challenges. According to Financial Gazette (2015), the 3rd point
of the 25 August 2015 Ten Point Plan for sustained economic growth reads, “Focusing on Infrastructure
development, particularly in the key Energy, Water, Transport and ICTs subsectors.” The statement could
be out of the realisation that infrastructure is a key element in industrial production. In June 2015, reports
were that, “ZESA Holdings is already faced with a 400 megawatts (MW) plunge in generation capacity
at Kariba Power Station occasioned by the fall in water supplies in Kariba Dam” (Mlanga, 2015). In
September 2015, the Financial Gazette (2015) reported that electricity generation had fallen to below 1
000MW. In October 2015, Mhlanga (2015) indicated that the situation could worsen given insufficient
rainfall forecasts for the region in the 2015-2016 rain season. The electricity shortage also leads to the
shortage of water supply since water is pumped by electric motors.
2.11 Importance of the food processing sector
Access to food is not a privilege but a basic human right for all people and most advocated and enshrined
in international laws as well as most advocated by most human rights activists and organisations; however,
is the most infringed (Clover, 2003). Food is a basic requirement for human life sustenance that it is always
a priority for most governments where the people may be vulnerable to food shortages because of political
and economic crises due to natural disasters. Food security concerns three aspects, that is, food access,
food adequacy and food availability (Mwaniki, 2006). Achieving outright food security is a challenge for

Page 37
not only developing economies but also for developed economies (Mwaniki, 2006). Societies obtain their
food to sustain themselves from subsistence production, the market or donations from the government or
non-governmental organisations (Baiphethi and Jecobs, 2009). Subsistence works well in primitive
unurbanised societies while the market is the major source of urbanised societies. Donations are most
pertinent in the case of natural disasters or political and economic crisis and in most cases these have no
assurance for continuous sustenance. Given the urbanised situation of the Zimbabwean communities
(Potts, 2015), it can be concluded that the major source of food for individuals, households and societies
is the market. When the market fails to supply enough food for the communities, it means disaster. Thus,
food production and processing are of paramount importance to Zimbabwe and all other economies.
According to ZIMSTAT (2015), the poverty datum line measured regarding food requirements per capita
in July 2015 was US$31.41. Given the population of 13 061 239, it means food production to sustain the
population should be valued at US$410 353 517. This could be compared with total food production from
agriculture and industrial food processing technopreneurs. Given the agricultural, industrial and industrial
food processing situation, the result is that regarding food requirements to satisfy the population there is
a need to supplement the deficit by importing food products.
The Zimbabwe Agenda for Sustainable Socio-Economic Transformation (ZIMASSET 2013 to 2018) is
the current economic policy for the nation. The policy and its supporting documents like the IDP 2012-
2016 place the agricultural sector and value addition (food processing) as some of the prioritised economic
activities. ZIMASSET 2013-2018 places food security and nutrition as the first cluster of monitoring
implementation of the economic policy (Zimbabwe Government, 2013). Thus, the agricultural sector is
on the supply side of the food processing sector. In turn agricultural input manufacturing sector is on the
supply side of the agricultural sector. The viability of the food processing sector is derived from the
agricultural sector, which in turn is derived from the agricultural input manufacturing sector.
2.12 Summary
Zimbabwe is a landlocked country in southern Africa between Zambia, Mozambique, South Africa and
Botswana. The nation relies mainly on mining and agriculture and to some extent manufacturing. The
Zimbabwean economy is currently dominated by a massive economic meltdown, characterised by
company closures, massive retrenchment and downsizing. The nation has its economic policy,
ZIMASSET, which has other economic policy documents like the Industrial Development Policy (IDP)
which have a direct bearing on the food processing sector. The economic policy seems not to yield much
regarding boosting the food processing sector. Major challenges facing the food processing sector are not
unique to the sector but common to the Zimbabwean manufacturing sector. The challenges include
competition from imported foodstuff; load shedding; policy instability; electricity costs and corruption

Page 38
(CZI, 2015). The latest challenges emanate from the economic situation; characterised by year-on-year
September 2015 inflation rate of -3.11% (Mangudhla, 2015). This research addresses these challenges by
analysing the factors influencing technopreneurship in the sector and recommending strategic and policy
guidelines for the sector. The chapter has covered the overview of the Zimbabwean economic situation
with emphasis on the food processing sector. The next chapter covers technopreneurship as an area of
study and its application globally, locally and in the Zimbabwean food processing sector.

Page 39
CHAPTER 3: TECHNOPRENEURSHIP
3.1 Introduction
Technopreneurship determines the national and organisational competitiveness that not only is based on
the availability of cheap labour and abundance of natural endowments but scientific, technological and
business innovations (Harlanu and Nugroho, 2015).This has been studied and advocated for such nations
as Indonesia (Harlanu and Nugroho, 2015); India (Sahoo, 2015); Nigeria (Kwa et al., 2014); Namibia
(Dana, 1993) Mozambique (Dana, 1996) and Lesotho (Dana, 1997). In this study, technopreneurship is
applied to industrial food processing in Zimbabwe. Industrial food processing technologies, the
innovativeness of Zimbabwean industrial food processing technopreneurs and entrepreneurial skills and
knowledge of industrial food processing technopreneurs in the turbulent Zimbabwean business
environment are the areas of concentration of this study. Reference is given to the global, international,
national and industrial application of technopreneurship in food processing.
The main focus of this chapter is the discussion of the content of the subject matter of the study –
technopreneurship. This chapter deals with empirical and theoretical literature in technopreneurship and
factors that influence it. According to Boell and Cecez-Kecmanovic (2014), the process involved consist
of, “literature searching, classifying and mapping, critical assessment, and argument development”. The
reviewed literature and discussion will assist in the development of the body of knowledge thatis needed
in technopreneurship as an area of study and practically especially by developing economies in the Sub-
Saharan Africa and worldwide. Other related areas to be covered include; entrepreneurship, technology,
innovation, industrialisation. The area of technopreneurship is relatively new, with known peer reviewed
literature dating as new as the new millennium. Known theories and models of technopreneurship are
covered and in this study so as to establish factors that influence technopreneurship in the Zimbabwean
food processing sector.
3.2 Entrepreneurship versus Technopreneurship
Malakh-Pines and Èzbilgin (2010) look at entrepreneurship as a broad discipline or field of study which
has different versions one of which is technopreneurship. Thus technopreneurship is entrepreneurship
which is technologically based. The perspective is shared by Venkataraman (2004); Antoncic and Prodan
(2008); Urban (2010); Lakitan (2013); Van der Lingen and Van Niekerk (2015); Harlanua and Nugrohob
(2015). Liu (2008) view technopreneurship as analogous to knowledge-based innovation which is seen as
the ‘super star’ of entrepreneurship. This study adopts the view that entrepreneurship is the broader area
of study and technopreneurship is narrower subject area. That is entrepreneurship is the discipline while
technopreneurship is the subject area.

Page 40
3.3 Entrepreneurship
Literature shows that citations between Entrepreneurship and Technology Studies as fields of discussion
are scarce, as compared to citations within each of the fields (Bhupatiraju et al., 2012). It is at this
intersection that this study is positioned. Greater integration between the fields of entrepreneurship and
innovation studies is yet to be well documented (Landström et al., 2012). The three areas of
entrepreneurship, innovation studies and science and technology have been taken as drivers of economic
development in the knowledge-based economies (Wong et al., 2007). Nacu and Avasilcăi (2014) had to
point out that:
“Entrepreneurship is seen as a process of searching for market opportunities and organisational
resources necessary to exploit these opportunities to gain results on a long term. This is a process of
planning, organising opportunities and risk taking. Thus, it is considered a business risk. It can be
distinguished as independent risk-taking theability to achieve the biggest gains in the market. This is a
creative and innovative ability and an adaptation response to the real business environment”.
Entrepreneurship is one of the cornerstones of technopreneurship. Audretsch et al. (2015) define
entrepreneurship as a term that has different meanings to different people such as scholars, industrialists
and policy makers with several different implications to include: innovation, creativity, new venture
development, and economic growth. This is an open view of the subject area as opposed to a narrower
view that will reduce the scope. Given this, it has to be appreciated that entrepreneurship is a broad term
that may be viewedin different angles, however, touches all main categories of stakeholders to include
industrialists, society, academics and policy makers. Gries and Naudé (2011:216) define entrepreneurship
as, “the resource, process and state of being through and in which individuals utilise positive opportunities
in the market by creating and growing new business firms”. The definition overlooks the issue of
innovation: not all new businesses are innovative. From this perspective, it has to be appreciated that most
African societies have a tendency of being traditional in their beliefs, attitudes and even business activities.
Entrepreneurs do not create human needs but create and innovate new ways of satisfying those needs.
Traditional ways of satisfying human needs or problems are equivalent to traditional non-innovative
business efforts that in most cases fall short of the competitiveness required surviving in modern business
environments. The dominant empirical definition of entrepreneurship in economic geography is the
formation of a new firm by (an) individual(s); these individuals are called entrepreneurs or an
entrepreneurial team when a collective starts a firm (Ünay and Zehir, 2012). The definition is taken to suit
also the context of this study. However, the type of the new firm has to meet additional criteria for it to be
classified as a product of technopreneurship. That is the essence of this study. Nasution et al. (2011:336)
define entrepreneurship as “a process of enhancement of wealth through innovation and exploitation of
opportunities, which requires the entrepreneurial characteristics of risk-taking, autonomy, and

Page 41
proactiveness”. The definition identifies important facets of entrepreneurship that include that it: is a
process; involves wealth creation; is innovative; exploits business opportunities; involves risk-taking; self-
governing and timeous. It is important to identify the major determinants of entrepreneurship since it is a
field thatis mistaken in most cases.
This study adopts the process approach to determining the role of a technopreneur. According to Bygrave
(2004), cited in Moroz and Hindle (2012:788), the entrepreneurial process involves “all the functions,
activities, and actions associated with perceiving opportunities and creating organisations to pursue them”.
From this perspective, this study investigates functions, activities and actions required to exploit perceived
opportunities in the food processing industry. It is believed that if entrepreneurship is understood from a
process perspective, all the stages could have enough attention for the success of the whole process. Most
developing economies fail to go through the whole process. They may succeed in realising the need to be
entrepreneurs, identify the opportunities but may fail to pursue them or may pursue the opportunities but
fail to create viable ventures. That may be owing to lack of skill or support.
Naude´ (2011), identifies three elements of a definition of entrepreneurship – resource coordination, new
businesses creation, and innovation. The issue of new businesses, creativity and innovation, were
discussed above. Zimbabwe like most African countries is endowed with some natural resources that are
supposed to be coordinated through entrepreneurial skills to create new ventures to enhance economic
development. This points to a shortfall among the skills required to develop such economies through
entrepreneurial skills and aptitude. Furthermore, coordination of resources may not be enough without the
application of knowledge to industrial operations. This brings in the notion of technology added to the
entrepreneurial skills and thus the essence of technopreneurship in industrialisation.
Ünay and Zehir (2012) argue that the literature on entrepreneurship recognizes a variety of entrepreneurial
roles in economic change, as the person who assumes the risk associated with uncertainty; an innovator;
a decision maker; an industrial leader; an organiser and coordinator of economic resources; an arbitrageur;
and an allocator of resources among alternative uses. The roles could be taken to fit a technopreneur but
the question that remains unanswered is at which stage of the entrepreneurial process to assume which
role. Li et al. (2012) concluded that entrepreneurship has a positive impact on economic growth and this
finding is robust even after controlling for some demographic and institutional variables. Lastly De Beer
et al. (2014:40), assert that one of the most referenced definitions of entrepreneurship in development
literature is: “the manifest ability and willingness of individuals, on their own, in teams within and outside
existing organizations, to perceive and create new economic opportunities (new products, new production
methods, new organizational schemes and new product-market combinations) and to introduce their ideas
in the market, in the face of uncertainty and other obstacles, by making decisions on location, form and
the use of resources and institutions”.

Page 42
According to Bygrave and Zacharakis (2009:2), the entrepreneurial process involves “all the functions,
activities, and actions associated with perceiving opportunities and creating organisations to pursue them”.
From this perspective, this study investigates functions, activities and actions required to exploit perceived
opportunities in the region. The dominant empirical definition about entrepreneurship in economic
geography has to with the formation of a new business venture by an individual or group who constitute
an entrepreneurial team (Ünay and Zehir, 2012). This study is in agreement with this perspective.
However, the type of the new firm has to meet additional criteria for it to be classified as a product of
technopreneurship. This is the essence of this study.
In this study entrepreneurship is defined as a behavioural process of perceiving and exploiting an
innovative business opportunity and creating wealth against all odds. In this perspective, the emphasis is
that a definition which does not capture the issues of innovation, behavioural processes and wealth
creation is not sufficient. However, it is also imperative that the subject areas emanating from
entrepreneurship are also looked into. Entrepreneurship can be viewed from the perspective of whether it
involves creating a new entity (Nascent entrepreneurship or entra-preneurship) or an existing organisation
(corporate entrepreneurship or intra-preneurship). It can also be viewed from the perspective of the initial
drive in the entrepreneur, that is, whether for commercial purpose or social purposes (social
entrepreneurship).
3.4 Technology
Technology is also one of the key elements of technopreneurship and also one of the loosely used by many
academics. The context of each use should be stated in each case. Wagner et al. (2015:4) define technology
as “a set of tools designed to manipulate the natural world and to extend human intentions”.This makes
sense since it captures the notion of solving day to day problems but may require further clarification of
two terms; science and mechanics. Wagner et al. (2015:3) distinguish technology from science as they
define science as “a way of knowing things - it is a widely accepted, adaptable, and a transferable set of
assumptions about how to understand the world in which we find ourselves.”
The International Technology Education Association (2007:12) holds that “broadly speaking technology
is how people modify the natural world to suit their purpose.” The definition implies a diverse set of
processes, procedures and knowledge that people utilise to improve continuously their ability to meet their
needs and wants. It is broad enough but needs some explanation to point to these processes, knowledge
and needs. Originally, according to Funk (1999), the word “technology” comes from two Greek words,
transliterated “techne” and “logos”. “Techne” means art, skill, craft, or the way, manner, or means by
which a thing is gained. “Logos” means word, the utterance by which inward thought is expressed, a

Page 43
saying, or an expression. So, technology means words or discourse about the way things are gained. Funk
(1999), went on to give five different definitions of technology to illustrate the different perspectives:
1. First, technology is the rational process of creating means to order and transform matter, energy,
and information to realise certain valued ends.
2. Second, technology is the set of means (tools, devices, systems, methods, procedures) created by
the technological process. Technological objects range from toothbrushes to transportation
systems.
3. Third, technology is the knowledge that makes the technological process possible. It consists of
the facts and procedures necessary to order and manipulate matter, energy, and information, as
well as how to discover new means of such transformations.
4. Fourth, technology is a subset of related technological objects and knowledge. Computer
technology and medical technology are examples of technologies.
5. Finally, technology is asystem consisting of atechnological process, technological objects,
technological knowledge, developers of technological objects, users of technological objects, and
the worldview (that is, the beliefs about things and the value of things that shape how one views
the world) that has emerged from and drives the technological process.
Technology is so pervasive that it influences social life on a day-to-day basis (Kim and Lee, 2015). Most
definitions of technology are myopic and lack a full understanding of the phenomenon. Another definition
which can be seen as providing a full meaning of technology, apart from Funk’s fifth definition (1999), is
by Rebentisch and Ferretti (1995:2), who consider technology as, “any form, material or social, into which
knowledge has been embodied; to include hardware, software, products, rules, procedures, organizational
structure, and knowledgeor technical expertise.” The list of issues that are covered by technology is
endless, but the common thread is that they are all aimed at solving day-to-day industrial and domestic
problems in a community through the application of knowledge to human activities. In practice,
technology covers all disciplines and industries, that is, there is technology in all science and engineering
disciplines, as there is also technology in business sciences, humanities and social sciences. There is also
mining technology (Wang et al., 2015), farming technology (Holbreich et al., 2015), manufacturing or
production technology (Milián and Kamen, 2015) and business technology (Strumickas and Valanciene,
2015), medical technology (Murray et al., 2015) and education technology (Schwendimann et al., 2015).
Each field has its technology aimed at solving problems and making life convenient in each area. Other
technologies cut across disciplines and industries such as information technology and nanotechnology.
Sociopreneurs should appreciate that most social challenges are solved through the application of
knowledge to human activities. Modern economies are knowledge based and, given that entrepreneurship
is innovation based, there is a need to realise that sociopreneurship is made effective by fusing it with
technological innovation (Technovation) and technopreneurship.

Page 44
In this study, as such, by the same understanding, it can be concluded that technology is the application
of scientific knowledge (natural or social) to solve industrial or domestic day-to-day operational
problems. Thus, technology can be equated to applied science or scientific knowledge endowed with
purpose and interactive tools such as technical expertise, rules, policies and procedures, strategies,
hardware and software.It can also be viewed as an application of knowledge to human life. Day-to-day
living standards here refer to the very idea that there is a need for continuous discovery of ways to make
life more convenient. The purpose of technology is to enhance continuously the quality of human life. The
definition is comprehensive and all are encompassing, assisting people understand the diversity of
technology. The definition and the accompanying explanations are combined with the concept of
entrepreneurship to propose industrial food processing start-ups.
Kim and Lee (2015:43) had wonderful results that can be quoted as:
“ … it is not scientific knowledge (academic articles) but technological knowledge (patents) that matters
for economic growth, and that generating scientific knowledge does not automatically lead to the
generation of technological knowledge. We find that technological knowledge is primarily determined by
corporate research and development efforts, which used to be more lacking in Latin American countries,
compared with East Asia. This finding sheds new light on the question of why Latin American and East
Asian countries have shown such divergent economic performances.”
Latin America is not the only one affected by this mistake, the problem is rampant and one ruining most
African countries, especially sub-Saharan Africa. In particular Zimbabwe, which is viewed as having the
highest level of literacy in the region, is lacking development because of concentrating on acquiring
scientific knowledge without application (technology).
The Second Science, Technology and Innovation (STI) Policy of Zimbabwe has as its goals:
To strengthen capacity development in STI.
To learn and utilise emergent technologies to accelerate development.
To accelerate thecommercialisation of research results.
To search for scientific solutions to global environmental challenges.
Mobilise resources and popularise science and technology.
Foster international collaboration in STI.
If the STI goals could be pursued earnestly through the collaboration of all stakeholders with the
government being the captain; it could take the nation somewhere. However, it could require the blending
of the STI policy with the entrepreneurial facet to make it a technopreneurial policy. The argument being
that science, technology and innovation may not function well without an entrepreneurial thrust.

Page 45
Jakšić et al. (2014) identified six technologies which they took to be pivotal and behind the development
and introduction of new products in future and impacting on the socio-economic systems to include:
Advanced material technology.
Nanotechnology
Industrial biotechnology
Photonics
Micro and nanoelectronics
Advanced manufacturing systems
The technologies are said to be cutting across industries. In Zimbabwe, these could have been known but
not yet applied
Industrial food processing technologies vary greatly to include: High-pressure processing (HPP); Pulsed
electric field (PEF); Ultraviolet light (UV); Radiation; Ozone (O3); Pressure and CO2; Power ultrasound;
Cold atmospheric plasma; and Electrolysed water (Jermann et al., 2015). Several different factors
determine Their rate of adoption. Energy requirements can be the major determining factor of whether to
adopt or not to adopt anindustrial food processing technology (Rodriguez‐Gonzalez et al., 2015). On the
other hand, Ibarz et al. (2015) state factors such as emission power and stability, long life, adequate
physical dimensions, ease of use and low cost as factors influencing the adoption of industrial food
processing technology for industrial use. Jermann et al. (2015) indicate such factors as thecost of the
equipment; lack of variety of equipment available; and lack of clear benefits of utilising the novel
technology. Also, communication supports the adoption of novel technology (Dossick and Neff, 2011;
Jermann et al., 2015).
3.5 Innovation
Jonsson (2015) view innovation as the utilisation of new technology in an organisation. In most cases
scholars discuss innovation in conjunction with entrepreneurship as both are believed to influence
technological development in designing, production and marketing of goods and services (Jonsson, 2015).
Innovation can be categorised as either: business innovation (Kanter, 2015); industrial innovation
(Mowery et al. 2015); financial innovation (Laeven et al., 2015); process innovation (Prajogo, 2015),
product innovation (Prajogo, 2015) and technological innovation (Camisón and Villar-López, 2014).
Innovation is, also, an essential term to be understood in this study. Ünay and Zehir (2012:316) hold that
“innovation is also about new processes and new ways of doing things that may not be obvious to
customers but add significant value in delivering the services and products that customers require”.

Page 46
Urabe et al. (1988:4) holds that:
‘‘Innovation consists of the generation of a new idea and its implementation into a new product, process
or service, leading to the dynamic growth of the national economy and the increase of employment as well
as to a creation of pure profit for the innovative business enterprise. Innovation is never a one-time
phenomenon, but a long and cumulative process of a great number of the organisational decision-making
process, ranging from the phase of generation of a new idea to its implementation phase. New idea refers
to the perception of a new customer need or a new way to produce. It is generated in the cumulative
process of information-gathering, coupled with an ever-challenging entrepreneurial vision. Through the
implementation process, the new idea is developed and commercialised into a new marketable product or
a new process with attendant cost reduction and increased productivity’’.
The definition is comprehensive and is enhanced by the accompanying explanation. Afuah (1998) refers
to innovation as, “new knowledge incorporated in products, processes, and services”. The definition is
short and to the point. Caggese (2012) holds that “entrepreneurial firms are an engine of innovation and
technological progress, and they are likely to be responsible for a substantial portion of productivity and
employment growth”. Again, according to Caggese (2012), the entrepreneurial firm has access to a
technology that produces output using capital and is subject to exogenous idiosyncratic shocks to its
revenues. Innovation can be categorised into sub-areas that include technological innovation, product
innovation, process innovation and business innovation. Innovation can be confused with creativity –
creativity is the generation of new ideas while innovation is the application of new ideas.
The definition of innovation as proposed by Afuah (1998) and Garcia and Calantone (2002), cited in
Pullen et al. (2012), is invention plus commercialization further aligned as “an iterative process initiated
by the perception of a new market and/or new service opportunity for a technology-based invention which
leads to development, production, and marketing tasks striving for the commercial success of the
invention”.This is the essence of technopreneurship in this study. Caggese (2012), holds that
entrepreneurial firms are an engine of innovation and technological progress, and they are likely to be
responsible for a substantial portion of productivity and employment growth. Again according to Caggese
(2012), the entrepreneurial firm has access to a technology that produces output using capital and is subject
to exogenous idiosyncratic shocks to its revenues. Innovation is pivotal in technopreneurship. Lee and
Narjoko (2015) look at innovation as a process or system of introducing products, businesses or processes
in organisations. It can be classified into four categories namely, product innovation, process innovation,
organisational innovation and marketing innovation (Lee and Narjoko, 2015). The relationship between
innovation and economic development can be demonstrated by a systems perspective where research and
development are input, the innovation output is patented and these enhance productivity and hence
develop the economy (Lee and Narjoko, 2015).

Page 47
In analysing the effects of firm size on Research and Development (R&D) productivity, for each different
technological regime Damanpour (2010) discovered that the relation between firm size and innovation
depends on the technological regime. Furthermore, where smaller firms are favoured by regimes
characterised by the proximity to the science system, the use of intellectual property rights is a means of
appropriation, or by low knowledge cumulativeness. Lastly, the innovation performance of larger firms is
comparatively better in regimes with limited use of intellectual property rights and where the relationships
with clients and suppliers are important sources of opportunities for innovation (Revilla and Ferna´ndez,
2012).
Although the focus is much on technopreneurship (Technological Entrepreneurship), it has to be noted
that innovation is a key concept in both fields. Fusari and Reati (2013), extend the traditional macro and
micro economic analysis by presenting a behavioural model in which innovation, entrepreneurship and
radical uncertainty play an important role in determining the dynamics of technological revolutions.
Clausen and Korneliussen (2012), indicated that entrepreneurship assists the development and
commercialization of technology and products through venture incubation; and this was after realising
that entrepreneurial orientation proved to have a positive effect on bringing technology and products
quickly to the market.
3.6 Technopreneurship defined
The concept of technopreneurship is considered as a real source of economic power in modern knowledge-
based as well as developing economies and furthermore a significant value driver of national competitive
advantage (Dutse et al., 2013). Technopreneurship in most cases is viewed as business venturing through
the compounding of entrepreneurial skills and technological prowess (Pujanis et al., 2015; Dutse et al.,
2013; Harlanu and Nugroho, 2015). It is also mostly known as technological entrepreneurship (Satria et
al., 2014; Velikova et al., 2015; Venkataraman, 2004). This gives the notion of a hybrid entrepreneurship
management and engineering aptitude. That is organisational leadership that is not specialised but is based
on both entrepreneurial competence and technological prowess. The technological thrust of
technopreneurship is the element that distinguishes technopreneurship from entrepreneurship. However,
entrepreneurship is the broader subject area of study and technopreneurship is the sub-sector of
entrepreneurship. Dolatabadi and Meigounpoory (2013) view technopreneurship as consisting of
innovation, technical science and knowledge applied to the creation and management of a business at
some financial risk so as to achieve own goals and perspectives. From this perspective, the application of
innovation, scientific knowledge can simply be interpreted as technology, while the creation of businesses
and assuming risk to achieve own goals are entrepreneurship. Also, technology is not limited to technical
science and knowledge but also covers products, policies, procedures, rules, organisational structure and
strategies.

Page 48
One of the leading proponents of technopreneurship Petti (2012) investigates technological
entrepreneurship as encompassing all the activities concerning the identification of opportunities
emanating from technological developments and the exploitation of the opportunities by successfully
commercialising innovative products. It has to be appreciated that the innovative products include goods,
services, ideas, places, people and anything of value that can be commercialised. Three basic issues can
be observed in the definition that are: the identification of potential technological opportunities; the
exploitation of such opportunities and the materialisation of the technological breakthroughs through
products on the market. The principles of commercialisation of technology as a perspective of
technopreneurship could be analysed regarding their application to different political leadership styles;
that is, different levels of democracy.
Petti (2012) further explains that technological entrepreneurship is all about the transformation of
technological developments, technological research, scientific breakthroughs and related investments into
value. That createseconomic value in the form of return on investment for the investor, entrepreneurs as
well as employment creation, contribution to gross domestic product and government taxes; societal value
in the form of employability; enhancement of livelihood andincome per capita. Technopreneurship can be
viewed differently on three dimensions according to Petti (2012) such as:
Different names.
Different perspectives: a system, a policy, a strategy, a process or individual attitude.
Different souls: entrepreneurial soul, Technological soul and strategic management soul.
However, the aspect remains the same that of the endowment of technovation with value thereby creating
wealth for the communities. As an emerging area of study and policy guide in knowledge-based
economies, technopreneurship is attracting a lot of discussions. Websites have some coverage in the
definition of technopreneurship. Cereijo (2002) views technopreneurship as a combination of technology
ability and entrepreneurial aptitude and looks at it as not an event but a process to influence the future of
an individual, organisation or nation, or the universe thus having connotations to economic development
and the welfare of people. An important element added by this definition is the issue of determining the
future of people in an economy. There is no technopreneurship if an activity does not contribute to
sustainable economic development. The concept of sustainable economic development as aired by Kakava
et al. (2013), as they evaluated corporate social responsibility activities in developing countries. Also, the
process view to technopreneurship is also introduced. The principles of technopreneurship require analysis
regarding their application to the Zimbabwean situation of deindustrialisation and political dictatorship.
Toral (2012) introduces some trait approach to viewing a technopreneur, viewing him to be: a technology
savvy, creative, dares to be different, innovative, dynamic, takes the unexplored path, and passionate about

Page 49
his work. The definitions give a focus on the issues analysed in this study as factors that influence
technopreneurship. According to Beckman et al. (2012) cited in Judge (2013), technological
entrepreneurship exists when developments in science or technology constitute a core element of the
opportunity that enables the emergence of a venture, market, cluster, or industry. Bailetti (2012) defines
technology entrepreneurship as dealing with individuals or groups and different sophisticated tools and
specialised scientific and technological know-how to create and manage a business venture. Once more
the definition has connotations to two specialised area of study, that is, technology and entrepreneurship
harmonised to create or enhance value. Perhaps the only weakness is the issue of the use of the term
‘specialised’. It can be appreciated that a technopreneur is not specialised but has compounded knowledge
and skills. These definitions make some sense when focusing on industrial food processing projects that
lead to food products on the market.
Beckman et al. (2012) and Petti and Zhang (2013) view technological entrepreneurship from a
commercialisation perspective, holding that scientific and technological breakthroughs are the primary
opportunity to create a venture, industry, cluster or market. That makes sense to some extent but limits the
source of technopreneurial opportunities. While the definition represents most scholars’ perspective, it is
to some extent narrow in that the notion of technological breakthroughs is not the only source of a
technopreneurial opportunity to create a business venture. An economic crisis or developmental need can
be an opportunity for a technopreneurial venture and thus several phenomena are sources of technological
venture creation to include social or industrial problems, scientific knowledge (social or natural science).
The definitions confirm that technopreneurship and technology entrepreneurship or technological
entrepreneurship are synonymous. Several nomenclatures have been used in literature to include:
technological entrepreneurship, technology entrepreneurship, techno-entrepreneurship or techno-
preneurship (Jakšić et al., 2014). In this study, the term technopreneurship is in main use. For the purpose
of the study, technopreneurship is defined as the process of perceiving and pursuing a sustainable
opportunity in the form of a technological or scientific breakthrough, economic crisis, developmental
need, domestic, social or industrial problem and establishing a sustainable and competitive business
venture. The definition agrees with other definitions in their context, however, combines the issues of
contribution to the sustainable economic development and various sources of technopreneurial
opportunities. Thus, for an activity to be technopreneurship it should contribute to sustainable economic
development apart from combining entrepreneurship and technology.

Page 50
3.7 Technopreneurship as a Behaviour
Pandey and De (2015:150) take entrepreneurial behaviour to consist in such traits as “innovativeness, firm
decision-making, achievement motivation, knowledge of farming enterprises, risk taking ability,
leadership ability and cosmopoliteness.” The traits will determine how an individual responds to the
environment. In practice, people tend to behave differently in response to the same situation in the same
circumstances. According to Kuratko et al. (2015:24), “entrepreneurial behaviour is any newly fashioned
set of actions through which companies seek to exploit entrepreneurial opportunities rivals have not
noticed or exploited”. The important element of the definition is the issue of a set of actions taken by an
organisation to take advantage of opportunities. Alternatively, strategy (ies) adopted to exploit the
opportunities points to the behavioural pattern of the organisation. How does an organisation respond to
developments in the environment? Is the organisation proactive or reactive? As asserted by Sabouri and
Safarpour (2015) idea application, opportunism and innovation are of the essence in entrepreneurship
management. An opportunistic and innovative organisation view environmental threats positively, that is
turn threats into opportunities. According to Lau et al. (2012), four dimensions of entrepreneurial
behaviour inventory can be identified as consisting of innovativeness, risk taking, change orientation, and
opportunism. It can be noted that the four dimensions can be viewed as both traits and behaviours. One of
the most important dimension which can be all-encompassing when looking at technopreneurship as
behaviour is innovativeness. As noted organisations in the food processing sector in Zimbabwe were
facing such threats as cheap imports of food products flooding the local market especially from South
Africa and Zambia. Organisational responses to this arena vary. Some feel there is no way out so it is wise
to leave local production and start to import. Some find it as an opportunity to adopt new and efficient
production technologies so as to be competitive, which is the essence of technovation in entrepreneurship.
This perspective applies to entrepreneurial behaviour in corporate entrepreneurship.
Gartner (1989) discusses the behavioural approach to the study of entrepreneurship as a set of activities
involved in organisational creation while the trait approach consists of a set of personality traits and
characteristics. The definition pertains to nascent entrepreneurship. The main focal point here is the set of
activities engaged by the individual to create a new venture. Thus, the person also should have internal
processes that are cognitive and effective which act as motivators and drivers to lead to the desired
activities of new venture creation. Thus, when motivators become strong enough to push someone to act,
they become drivers. Apart from simple nascent entrepreneurship, the issue of entrepreneurship training
also touches the issue of behaviour change. Marques (2012) concluded that entrepreneurial intentions of
secondary students is determined by personal attitude, subjective norm and perceived behavioural control.
The behaviour here is determined by attitudes, personal norms and perceived autonomy. Although this
pertains to new practitioners, it is equally applicable to corporate entrepreneurs / technopreneurs, because
the organisational entrepreneurial behaviour is a result of individual behavioural patterns. Personal attitude

Page 51
is towards the behaviour or technopreneurial process; subjective norm pertains to the approval and support
from others, and lastly perceived behavioural control consists of the belief that the technopreneur will
succeed.
In this study, it is taken that the behavioural concept covers both the behavioural approach and the trait
approach to understanding the technopreneurial behaviour. It is shared with the view that the traditional
theories of human behaviour hold that psychological, sociological and economic factors (Kets de Vries,
1977) determine the actions taken by a person in response to the external stimuli. Behaviour in this study
means the set of actions adopted by a technopreneur in response to the developments in the economic
environment.
3.8 Technopreneurship as a Process
In this study, to have a simpler understanding of the subject area, technopreneurship is viewed as a process.
It is also appreciated that processes take place within an environmental setup where other forces impact
on the process, hence the essence of factors influencing technopreneurship.
The general new product development process requires some improvements to suit what can be called a
technopreneurial process. Thus, the idea generation, idea screening and concept development and testing
can be viewed as the opportunity perception where opportunity receptors are of the essence. The
technopreneurs are distinguished from ordinary business managers by the ability to identify opportunities.
Business analysis, prototyping and test marketing can be summarised as the persuasion of the opportunity.
In this case, it means the technopreneur is making further investments into the project. Lastly the
commercialisation, monitoring and evaluation constitute the development of a viable and sustainable
business venture. Maglana (2007), proposed a technopreneur continuum. An analysis of the continuum
shows a gap between products and the markets, which can be closed by technopreneurship. The
continuum, as shown in Figure 3.1, implies that the technopreneurship process moves products from
discovery through invention, innovation, entrepreneurship to the markets. The weakness of the model
perhaps rests in the starting point which seems to be products. In practice, this could be applicable in other
cases, but the issue of other opportunities as the starting point should be emphasised. It can be said that
products are the result of a problem-solving process. Life problems could be the major source of
technopreneurial opportunities.
Figure 3.1 is a fairly elementary figure without considerable contribution in the understanding of
technopreneurship. Scientific and technological breakthroughs are not supposed to end up in there without
reaching the market. It is the concept once advocated by The Ministry of Science and Technological
development in Zimbabwe in 2010 which was entitled, “From lab to village” (Kakava, 2010). The idea of

Page 52
linking products to the market was also pursued by Bulsara et al. (2009), as they moved the notion that
there is a need to move further to techno-entrepreneurship from techno-innovation as an approach to
Technology Business Incubation. Thus technological innovation alone is not as effective; neither is
entrepreneurship alone but technopreneurship.
P M
R Discovery A
O Invention R
D Innovation K
U Entrepreneurship E
C T
T S
S
Figure 3.1: A Technological Entrepreneur Continuum
Source: Adapted from Maglana (2007)
However, the continuum also needs to include the issue of contribution to economic development by
whatever moves through the continuum. Also, it has to be noted that the technopreneurial process can start
from the entrepreneurial extreme or technological extreme or even from a challenge that may be within a
different perspective such as an economic crisis as being faced by the nation under consideration. With
the economic meltdown, the Zimbabwean economy needed to adopt the technopreneurship process to
industrialise. In this research, Technopreneurship is viewed as the process of capitalising on a
technological or scientific breakthrough to establish a business venture which contributes to sustainable
economic development. However the thrust of this study is on corporate technopreneurship which is
defined by Dolatabadi and Meigounpoory (2013) as “an intra- organizational process in which a
technological entrepreneur or group of them create and manage an enterprise by research, development,
innovation, and technology where this process is followed by venture (risk taking).”
3.9 Determinants of Technopreneurship
Technopreneurship as a subject of entrepreneurship may in most cases be influenced by factors that also
influence entrepreneurship. As can be observed from Nacu and Avasilcăi (2014:1072) who indicated that:
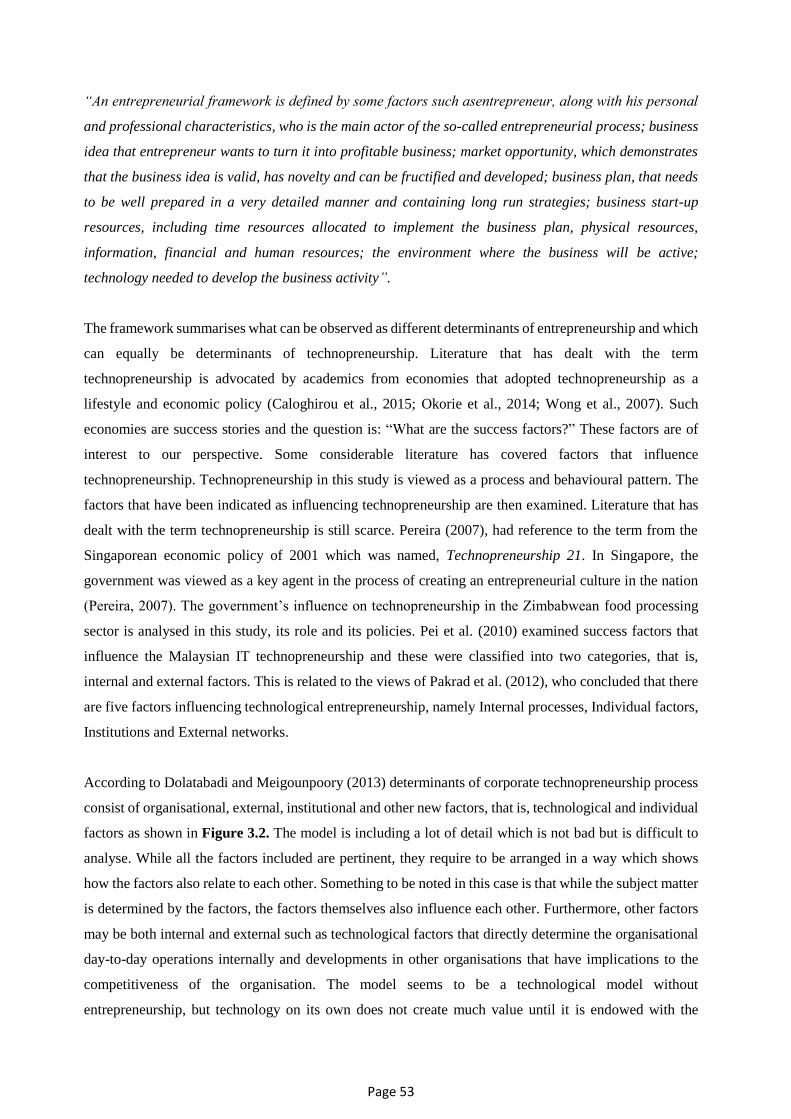
Page 53
“An entrepreneurial framework is defined by some factors such asentrepreneur, along with his personal
and professional characteristics, who is the main actor of the so-called entrepreneurial process; business
idea that entrepreneur wants to turn it into profitable business; market opportunity, which demonstrates
that the business idea is valid, has novelty and can be fructified and developed; business plan, that needs
to be well prepared in a very detailed manner and containing long run strategies; business start-up
resources, including time resources allocated to implement the business plan, physical resources,
information, financial and human resources; the environment where the business will be active;
technology needed to develop the business activity”.
The framework summarises what can be observed as different determinants of entrepreneurship and which
can equally be determinants of technopreneurship. Literature that has dealt with the term
technopreneurship is advocated by academics from economies that adopted technopreneurship as a
lifestyle and economic policy (Caloghirou et al., 2015; Okorie et al., 2014; Wong et al., 2007). Such
economies are success stories and the question is: “What are the success factors?” These factors are of
interest to our perspective. Some considerable literature has covered factors that influence
technopreneurship. Technopreneurship in this study is viewed as a process and behavioural pattern. The
factors that have been indicated as influencing technopreneurship are then examined. Literature that has
dealt with the term technopreneurship is still scarce. Pereira (2007), had reference to the term from the
Singaporean economic policy of 2001 which was named, Technopreneurship 21. In Singapore, the
government was viewed as a key agent in the process of creating an entrepreneurial culture in the nation
(Pereira, 2007). The government’s influence on technopreneurship in the Zimbabwean food processing
sector is analysed in this study, its role and its policies. Pei et al. (2010) examined success factors that
influence the Malaysian IT technopreneurship and these were classified into two categories, that is,
internal and external factors. This is related to the views of Pakrad et al. (2012), who concluded that there
are five factors influencing technological entrepreneurship, namely Internal processes, Individual factors,
Institutions and External networks.
According to Dolatabadi and Meigounpoory (2013) determinants of corporate technopreneurship process
consist of organisational, external, institutional and other new factors, that is, technological and individual
factors as shown in Figure 3.2. The model is including a lot of detail which is not bad but is difficult to
analyse. While all the factors included are pertinent, they require to be arranged in a way which shows
how the factors also relate to each other. Something to be noted in this case is that while the subject matter
is determined by the factors, the factors themselves also influence each other. Furthermore, other factors
may be both internal and external such as technological factors that directly determine the organisational
day-to-day operations internally and developments in other organisations that have implications to the
competitiveness of the organisation. The model seems to be a technological model without
entrepreneurship, but technology on its own does not create much value until it is endowed with the
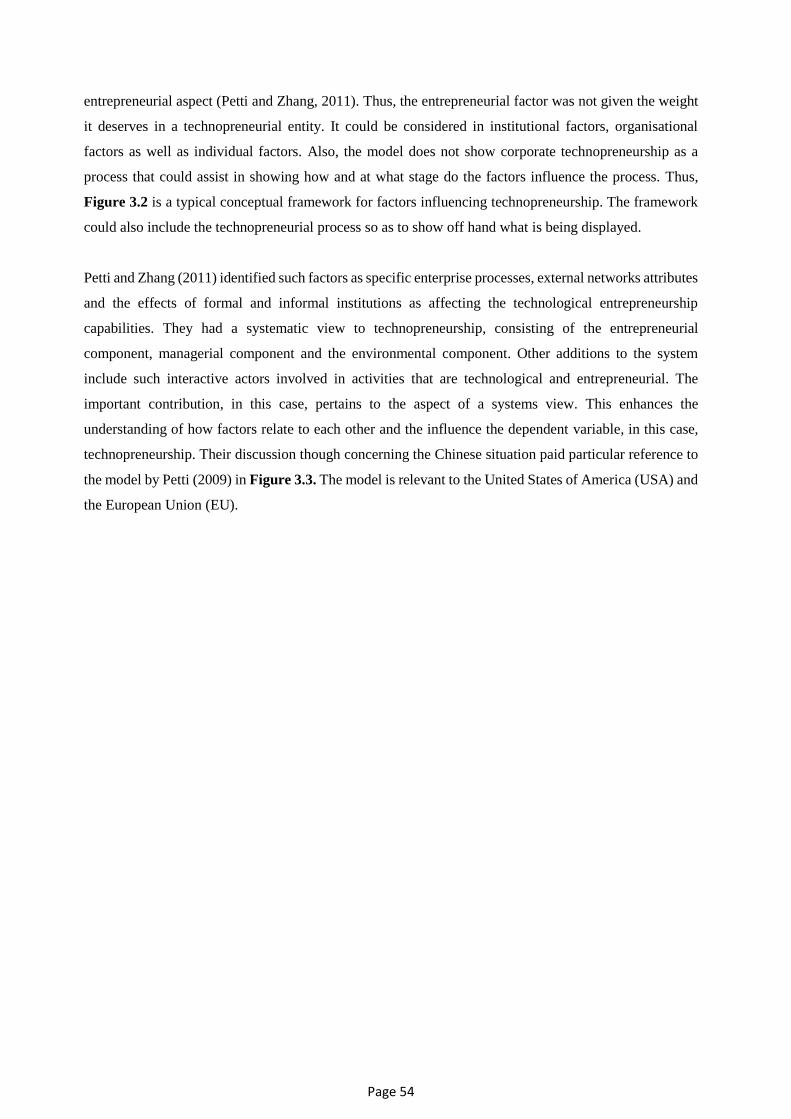
Page 54
entrepreneurial aspect (Petti and Zhang, 2011). Thus, the entrepreneurial factor was not given the weight
it deserves in a technopreneurial entity. It could be considered in institutional factors, organisational
factors as well as individual factors. Also, the model does not show corporate technopreneurship as a
process that could assist in showing how and at what stage do the factors influence the process. Thus,
Figure 3.2 is a typical conceptual framework for factors influencing technopreneurship. The framework
could also include the technopreneurial process so as to show off hand what is being displayed.
Petti and Zhang (2011) identified such factors as specific enterprise processes, external networks attributes
and the effects of formal and informal institutions as affecting the technological entrepreneurship
capabilities. They had a systematic view to technopreneurship, consisting of the entrepreneurial
component, managerial component and the environmental component. Other additions to the system
include such interactive actors involved in activities that are technological and entrepreneurial. The
important contribution, in this case, pertains to the aspect of a systems view. This enhances the
understanding of how factors relate to each other and the influence the dependent variable, in this case,
technopreneurship. Their discussion though concerning the Chinese situation paid particular reference to
the model by Petti (2009) in Figure 3.3. The model is relevant to the United States of America (USA) and
the European Union (EU).

Page 55
Figure 3.2: Conceptual framework of the effective key factors influencing in corporate
technopreneurship in active knowledge base firms in nanotechnology industry.
Source: Adapted from Dolatabadi and Meigounpoory (2013)
Factors in Figure 3.2 are considered in this study with further dimensions as applicable to the food
processing sector in Zimbabwe. Petti (2009) adopted a systematic view of technological entrepreneurship
as shown in Figure 3.3.

Page 56
Figure 3.3: A systematic view of technopreneurship
Source: Adapted from Petti (2009)
The model in Figure 3.3 is to some extent comprehensive, however, requires some improvements
regarding how the three components namely entrepreneurial component, managerial component and
environmental are related. Further, to that positioning, an entrepreneur or technopreneur in an organisation
is also critical and this could be missing in the model. The technopreneurial process needs a conclusion,
especially with the fact that there is not yet an agreed theoretical framework for technopreneurship. The
represented technopreneurial process is represented as starting by developing and identifying
technologies. This couldbe considered as just but one of the starting points since technopreneurship can
start at any other points like social problems or economic challenge. Thus, the development of
technologies can be the second or third phase.
Chittithawom et al. (2011:180), examined eight factors that influence the SMEs business success as:
“SMEs characteristic; management and know-how; products and services; customer and market; the way
of doing business and cooperation; resources and finance, strategy; and external environment. Aracid
(2011), identified factors affecting open technology business incubation as influence from previous work;
experience; the opportunity to develop a product or service; the presence of a skilled workforce to create
the product or service and frustration or negative experience with the previous company and desire for

Page 57
self-employment. From the factors, the most influential factors were: the opportunity to develop a product
or service; experience; desire for self-employment; self-initiated but not influenced by my previous work;
and the presence of a skilled workforce to create the product or service (Aracid, 2011). Although in the
creative art industry, Kamarudin and Sajilan (2013), view marketing, technology, entrepreneurship and
management as success factors in technopreneurs. This canbe viewed as a typical study of
technopreneurship at the micro level. However, it overlooked other factors at the macro level. One of the
modern organisational performance evaluation is absorptive capacity. Duchek (2013:312) look at
absorptive capacity “as the ability of a firm to recognise the value of new external information, assimilate
it, and apply it to commercial ends and it is regarded as an important factor in both corporate innovation
and general competitive advantage”. This is an important factor that also requires consideration in this
study since business attitude is a fundamental determinant of a successful technopreneur. The factors can
be summarised on as shown in Table 3.1.

Page 58
Table 3.1: Factors influencing technopreneurship
Factor Authors
1 The Government Pereira (2007)
2 Internal Factors, External factors Pei et al.(2010)
3 Internal processes, individual factors, institutions and external
Networks
Pakrad et al.(2012)
4 Human Resources Components, Environment Component, Laws
and Policies Components and Financial Resources Components
Ilao (2013)
5 Organisational, external, institutional and other new factors, that is,
technological and individual factors.
Dolatabadi and
Meigounpoory (2013)
6 Specific enterprise’s process, external networks attributes and the
effects of formal and informal institutions
Petti and Zhang, Sh.
(2011)
7 Enterprises’ internal characteristics; enterprise’s external network
attributes; and environmental/institutional factors
Petti and Zhang (2011)
8 SMEs characteristic, management and know-how, products and
services, Customer and Market, the way of doing business and
cooperation, resources and finance, Strategy, and external
environment
Chittithawom et al.
(2011)
9 Opportunity to develop a product or service; experience; desire for
self-employment; self-initiated but not influenced by my previous
work; and the presence of a skilled workforce to create the product
or service
Aracid (2011)
10 Absorptive capacity Petti and Zhang (2013)
11 Marketing, Technology, Entrepreneurship and Management Kamarudin and Sajilan
(2013)
12 Support policies, IPR enforcement, personal relationships, internal
characteristics, external networks, institutional environment,
innovation practices and competitiveness
Petti and Zhang (2014)
13 Knowledge management, business model innovation,
organisational culture, strong ties, personal relationship and IPR
enforcement
Claudio and Shujun
(2011)
14 Internal process capabilities, external networks characteristics,
institutional, regulatory, normative and cultural factors
Mohammadi et al.
(2014)
15 Environmental change, Networks, Strategy, systems, skills, style,
staff
Brem and Borchardt
(2014)
Source: Own compilation from literature

Page 59
The factors summarised in Table 3.1, can be harmonised into clearer categories with the aim of combining
such factors on the macro-level and micro-level. There is need to link the macro and the micro level since
there are such gaps in entrepreneurship research. Deeds (2014) identify four questions not yet addressed
by current researchers at the micro level:
What action increase or reduce a venture’s odds of success?
What type of environment nurtures ventures?
How do ventures emerge?
How do we prepare entrepreneurs for their career?
The questions are pertinent and need some consideration by researchers in entrepreneurship and this study,
a concentration on the micro level is done although the micro level is to a greater extent influenced by the
macro forces.
3.10 The conceptual framework
In this study the factors dealt with by these scholars were regrouped and a proposal for a synchronised
model of these factors was designed. The proposed regrouping focuses on corporate organisations. The
rationale being that industrial food processing is technologically intensive and entrepreneurially oriented
as well as at the centre of economic revival in the nation. Utilisation of the agricultural based economy,
industrial food processing technology and the need for locally produced food products becomes an
opportunity for technopreneurs.

Page 60
Table 3.2: Factors influencing technopreneurship at the micro level perspective
Factor Influencing
Technopreneurship
Related Literature
Internal processes Petti and Zhang (2011); Pakrad et al. (2012) Petti and Zhang (2014);
Mohammadi et al. (2014); Brem and Borchardt (2014); Claudio and Shujun
(2011)
Human factors Ilao (2013); Gilsing et al. (2010); Aracid (2011); Mohammadi et al. (2014);
Brem and Borchardt (2014); Nacu and Avasilcăi (2014);
Venture capital Ilao (2013); Chittithawom et al.(2011); Nacu and Avasilcăi (2014); Gilsing et
al. (2010); Mustar and Wright (2010); Gompers and Lerner (2001)
Partnerships Petti and Zhang (2014); Mohammadi et al. (2014); Brem and Borchardt
(2014); Gilsing et al. (2010); Drucker (2014)
Government Support Pereira (2007); Gilsing et al. (2010); Mohammadi et al. (2014); Brem and
Borchardt (2014); Nacu and Avasilcăi (2014); Mustar and Wright (2010)
Global factors Petti and Zhang (2014); Dolatabadi and Meigounpoory (2013); Brem and
Borchardt (2014); Nacu and Avasilcăi (2014); Cabrita et al. (2015) Jakšić et
al. (2014); Colovic and Lamotte (2015).
Source: Own compilation from literature
Having observed the discussions and arguments in the literature about factors that can influence
technopreneurship, a conceptual framework was proposed to model the understanding of such factors so
as to guide the research. The conceptual framework is represented in Figure 3.4.

Page 61
Figure 3.4: A theoretical framework for factors influencing adoption of technopreneurship
Source: Own compilation
3.11 Internal processes
Internal processes here refer to the managerial, administrative, logistical and operational processes that
are formulated and executed within an organisation. From Table 3.2, although Petti and Zhang (2011)
and Pakrad et al. (2012) have discussed internal processes as a factor influencing technopreneurship, it
has to be noted that they were dealing with different industries in developed nations. This study concerns
internal processes as they influence technopreneurship in the food processing industry in a third world
country. Petti and Zhang (2014); Claudio and Shujun (2011) looked at factors influencing
technopreneurship and included internal processes but in a Chinese setup while Mohammadi et al. (2014)
included internal processes as a factor looking at assistive technologies of people with disabilities in
Tehran, Iran. Brem and Borchardt (2014) itemised internal process factors and gave applications to
developed countries such as United States of America (USA), Germany and Japan. There is a need for
Technopreneurship
Opportunity Identification
Developing and Identification of
Technologies
Venture Establishment
Entrepreneurship Management and
Continuos Adaptation
Internal
processes
Global
factors
Partnerships Human
factor
Venture
capital
Government
Support

Page 62
research in developing countries at the organisational level regarding how they establish, manage and
administer manufacturing organisations thatare rarely established in Zimbabwe and those which are
established are continuously underperforming and eventually fold up. These further concerns need to look
at strategic formulation and implementation, how entrepreneurial vision is shared with other
organisational members.
3.12 Human factors
The International Association of Oil and Gas producers define human factors as “the application of
scientific information concerning humans to the design of objects, systems and environment for human
use”. It encompasses people, workplaces and management. The human factor in this study consists of
human skills, entrepreneurial skills, technical skills and business attitudes. Brem and Borchardt (2014)
emphasised such factors such as skills, style and staff as factors influencing technopreneurship although
in a developed country setup. It is essential to position properly an entrepreneur in the performance of the
three basic organisational functions, that is, strategic, organisation and finance (Petti, 2009) as developing
a technopreneurial culture in an organisation. Ilao (2013) looked at factors influencing technopreneurship
including a human resources component analysed as covering: research-thinker, idea generator, innovator,
developer-implementer and technical people, marketing people and financiers. The approach could
streamline the component further so as to indicate how it relates to other components. Kenney et al. (2013),
suggest that after a developing nation experiences a brain drain, the next phase may see these expatriates
then returning home, and igniting a virtuous circle of technological entrepreneurship leading to rapid
economic development. This was the case with Taiwan, China and India (Kenney et al., 2013) and could
apply to Zimbabwe, nevertheless under specific conditions that have yet to be determined. Also, it was
discovered that in Egypt, even after controlling for the endogeneity of the temporary migration decision,
an overseas returnee is more likely to become an entrepreneur than a non-migrant (Wahba and Zenou,
2012). That is, although migrants may lose their social capital, they accumulate savings and experience
overseas that increase their chances of becoming entrepreneurs (Wahba and Zenou, 2012). Such
conclusions may need testing in the Zimbabwean scenario, where the economy faced some brain drain
and currently some of it are returning from overseas. This contributes to the human capital.
It has to be also noted that the levels of democracy in a nation determine how much contribution can be
made by individuals and groupsregarding involvement and participation. Musso et al. (2000) indicates
that there is there is a coercive hierarchical relationship between government and individual in an
autocratic system like the Zimbabwean situation and this has a bearing on the “entrepreneurial” and
“participatory” models. Thus, an autocratic system limits citizens’ entrepreneurial efforts, involvement
and participation in the economic activities.

Page 63
3.13 Venture capital
Ilao (2013) included financial resources as one of the major component influencing technopreneurship
and itemised them as consisting of investor, business Sector, funding agencies and financial services
although, in a lecture set-up, the further application could be requiredto gather empirical evidence. On the
other hand Chittithawom et al. (2011) considered resources and finance as part of the factors influencing
the business success of SMEs in Thailand. This is also related to Nacu and Avasilcăi (2014) argument that
stipulated that financial resources are part of the resources that determine the difference between business
ideas and successful businesses as they describe resources as an engine for business.
According to Gompers and Lerner (2001), “Venture capital has developed as an important intermediary
in financial markets, providing capital to firms that might otherwise have difficulty attracting financing.
These firms are typically small and young, plagued by high levels of uncertainty and large differences
between what entrepreneurs and investors know. Moreover, these firms typically possess few tangible
assets and operate in markets that change very rapidly. Venture capital organisations finance these high-
risk, potentially high-reward projects, purchasing equity or equity-linked stakes while the firms are still
privately held”.
Along with venture capital, banks, individual investors (or "angels"), and corporations are among the other
providers of capital for these firms. Petti and Zhang (2011) indicate investors as one of the factors
influencing technopreneurship in the Chinese setup. Thus, if investors are not attracted to a nation and
particular organisation, technopreneurial operations may not succeed. In this study, venture capital shall
mean all funds are flowing into the organisation for the purpose of capitalising and recapitalising the
organisational operations. Mustar and Wright (2010) talks of third stream financing of academic spin-offs
as a policy designed in the United Kingdom (UK). That funding of technopreneurial projects can be taken
as a policy issue by different governments.
3.14 Partnerships
Partnerships, in this case, cover all mutually beneficial relationships between the organisation and other
organisations and institutions. It includes Public-Private partnerships (PPPs) which “is a contractual
arrangement involving the private sector in the delivery of public services and is based on a partnership
approach, where the responsibility for the delivery of services is shared between the public and private
sectors, both of which bring their complimentary skills to the enterprise” (Hayllar, 2010). The literature
discusses the triple helix model of government-university-industry relations in improving university
research productivity and hence having a direct contribution to social and economic development
(Chanthes, 2012). Consistent with this idea Kim et al. (2012), indicate that the ‘triple helix’ of the
university–industry–government relationship and habitat are accepted as important determinants of

Page 64
innovation and entrepreneurship. Román et al. (2012), assert that several European governments develop
new start-up programmes during recessions and the appropriateness of these policies has become a hot
policy issue. Ilao (2013) refers to partnerships when discussing incubation centres, science parks, research
and development centres and academic institutions. The implication of these factors here means an
industrial organisation should partner with the science and technology and entrepreneurial ventures so as
to enhance their innovativeness. According to Fingaz (2015), the 7th point of the 25 August 2015 Ten
Point Plan for sustained economic growth reads, “Promoting joint ventures and public-private partnerships
to boost the role and performance of state-owned companies.” The statement could have come from the
realisation that there are benefits from public-private partnerships in the sustainable development of
Zimbabwe. How these partnerships may be achieved could be the question.
3.15 Government Support
Government support covers government initiatives regarding economic policies, legal frameworks and
exemplary behaviour (Nacu and Avasilcăi, 2014). O’Gorman (2003:177) highlights that “most national,
regional and local governments have adopted measures to encourage entrepreneurship, with many city
regions specifically seeking to encourage high-tech and knowledge intensive new venture creation”. This
is a matter of policy intervention and creating a favourable environment for technopreneurship (Zhang et
al., 2008). Thus, the government is expected to play a leading role to promote technopreneurship (Pereirra,
2007). Recent literature in entrepreneurship suggests that market and legal institutions matter for
entrepreneurial investment (Nacu and Avasilcăi, 2014). Zhou (2013), suggests that entrepreneurial firms
with political connections (or higher level political connections) enjoy more security regarding property
rights and, thus, have significantly higher reinvestment rates; and such political connections are more
useful for smaller firms and among regions with the less developed market and legal institutions. Estrin
et al. (2013), found that the relationship between growth aspiring entrepreneurs and institutions is
complex; they benefit simultaneously from the strong government (in the sense of property rights
enforcement), and smaller government. However the relationships are constrained by corruption, where
social networks mediate some but not all institutional deficiencies (Estrin et al., 2013.). While the above
case looks at institutions that encourage entrepreneurial growth aspirations, this study examines how the
manufacturing or industrialisation policy may modify the role of technopreneurship in promoting
industrialisation.
The role of government and its economic policy is a key factor in steering modern economies to higher
levels of growth and development. According to Aharoni (2014) Israel started being poor after World War
II and the government spearheaded developmental efforts which include among other things, agricultural
focus, technological focus and reduction in government expenditure like military burden. Furthermore,
McChesney (2015) asserts that a democratic infrastructure is essential for effective economic activity and

Page 65
it is the role of the government to provide such an enabling environment. That is the government should
provide a legal framework; uphold the rule of law; elaborate communication; power and energy, water,
sanitation and transport systems.
3.16 Global factors
Ilao (2013) touches the global factors on the environment component when considering internet access,
communication and other support services as well as geographic accessibility. Global factors are issues
that arise from the fact that the world market has become a global village. All organisational decisions
should consider global competition, technological breakthroughs and other trends. According to Fritsch
(2011:27) “technology should be understood as a highly political and integral core component of the
global system that shapes global affairs and itself is shaped by global economics, politics, and culture.”
Thus theories of International Relations (IR), and, in particular, those of International Political Economy
(IPE) should consider technology as a core component of factors determining IR and IPE between nations
and regions. Cabrita et al. (2015) assert that regions face evolving pressures from the global economy and
have to engage withknowledge-based entrepreneurship to cope with the competition.
Nacu and Avasilcăi (2014) also argue that the political environment always affects the domestic and
international success of business ideas, since it has implications on economic policy and economic and
regional and international membership. This has a direct determination of the organisation to technological
resources through FDIs, technological sourcing and otherwise. On another discussion, Nacu and Avasilcăi
(2014) assert that globalisation is one of the influencing factors of technopreneurship. Dolatabadi and
Meigounpoory (2013) indicated that networks with foreign organisations enhance the competitiveness of
an organisation. This implies that no technopreneurial organisation can be competitive without networking
with international organisations to benefit especially technologically.
3.17 Summary
Technopreneurship as an area of study has developed greatly since the early 20th century. Although the
nomenclature varies to include technological entrepreneurship, techno-entrepreneurship and technology
entrepreneurship; the study settled for the term technopreneurship. Numerous definitions have been
proposed, however, the common thread joining them is that they acknowledge the fact that the term is a
compound term derived from two words, technology and entrepreneurship. Elements of the subject
include entrepreneurship, technology and innovation. Some view technopreneurship as a process, some
as behaviour while others as a system. The systematic view includes factors influencing technopreneurship
that is the subject matter of this study.

Page 66
This study looks at technopreneurship as a three-stage process; that is, perceiving the opportunity,
pursuing the opportunity and exploiting the opportunity. The technopreneurial process is taken to happen
in an environment with some impacting forces. The forces are the factors influencing technopreneurship
and include: internal processes, human factors, partnerships, global factors, government support and
venture capital. The factors were used to determine data to be collected through the research questionnaire
that was the research instrument.
The chapter discussed technopreneurship as an area of study and analysed its elements. A conceptual
framework was proposed based on factors influencing technopreneurship in literature. A further
understanding of the subject matter can be obtained by comparing theory and practice. The next chapter
discusses the perspectives of technopreneurship from theories, approaches or paradigms.

Page 67
CHAPTER 4: PERSPECTIVES OF TECHNOPRENEURSHIP
4.1 Introduction
Technopreneurship can be given several names: technological entrepreneurship (Carayannis et al., 2015);
technology entrepreneurship (Ferreira et al., 2015); technoentrepreneurship (Abbasi et al., 2015);
technopreneurship (Badaruddin et al., 2015); technology-based-entrepreneurship (García et al., 2015);
knowledge intensive entrepreneurship (KIE) (Malerba et al., 2015) and many others. All these terms and
others refer to the same concept. Technopreneurship can take different approaches, procedures, models
and theories such as knowledge spillover theories; technology transfer; university spillovers; academic
entrepreneurship; industrial clusters; technology parks; foreign direct investment; value addition;
innovation theories; technology sourcing and others. All the perspectives foster some theory, model or
approach to achieve the goals of technopreneurship. It also has to be appreciated that the perspectives are
not free from overlaps. However, each perspective has its own thrust and emphasis, based on the
proponents of the perspective. In fact, given that technology is so pervasive that it influences almost all
businesses, technopreneurship can end up taking over from entrepreneurship that is currently the generic
subject. However, the perspectives covered are viewed as paradigms that are different ways an
organisation can adopt to foster technopreneurship and as such policy makers can adopt to cultivate a
culture of technopreneurship in their economies. Therefore, technopreneurship can be taken as a policy,
individual attitude, culture, lifestyle or behaviour (Petti, 2012). This chapter covers the perspectives of
technopreneurship. Different perspectives and approaches of technopreneurship are discussed and its
application in practice. It explores how the perspectives are linked to the objectives and research
instrument.
4.2 Revisiting the definition of Technopreneurship
At this point, it could be appreciated that technopreneurship is viewed as consisting of innovation,
technical science and knowledge applied to the creation and management of a business at some financial
risk so as to achieve own goals and perspectives (Dolatabadi and Meigounpoory, 2013). In simpler terms
it has been noted that technopreneurship involves the compounding of technological knowledge and skills
with entrepreneurial acumen in a person, organisation, nation or region (Pujanis et al., 2015; Dutse et al.,
2013; Harlanu and Nugroho, 2015). As the assumption is that all activities and concepts or perspectives
by individuals, organisations or economies, may directly or indirectly require skills and aptitudes of both
technological skills and entrepreneurial aptitudes are deemed to fall under technopreneurship. The
argument is any endeavour that is targeted at wealth creation and improvement of the people’s well-being
is entrepreneurial as well as technological. Thus, the ultimate goal of the twins, technology and
entrepreneurship is to enhance continuously the livelihood of people (Carayannis et al., 2015).

Page 68
4.3 The Theories / Models of technopreneurship
Theories and models of technopreneurship can now be discussed one by one. Links to the study are
presented to appreciate the diversity of technopreneurship as an approach to enhance organisational
performance; guide to economic policy makers and leaders, academics in entrepreneurial research and
industrial development contribution.
4.3.1 Knowledge spillover theory
Perri and Peruffo (2015) look at knowledge spillovers as the informal flow of technological knowledge
from one organisation to another. The definition does not generalise the knowledge under consideration
but specifies the technological knowledge. Technological knowledge is the knowledge that is
developmental since it is applied as contrasted to scientific knowledge that is theoretical (Kim et al., 2015).
Knowledge spillover can occur at any level whether globally, internationally, nationally, inter-
organisational or intra-organisational but, however, varies in magnitude, scope and speed (Perri and
Peruffo, 2015). In most cases, knowledge spillovers happen in the case of multinational organisations.
Thus, multinationals allow the flow of knowledge from nation to nation and branch to branch and from
organisation to subsidiary. For the purpose of this study, knowledge includes skills and human capital
which promote creativity, innovation and economic efficiency (Audretsch and Belitski, 2015). According
to Ritala et al. (2015), some other scholars talk of knowledge sharing, knowledge leaking and innovation
performance. Knowledge can be shared through people working together or co-workers (Kim and Yun,
2015). Thus, as people work together, knowledge is passed on from one person to the next. Knowledge
can leak as organisations get into innovation activities given the multinational nature of organisations and
the different organisational levels (Olander and Hermellina-Laukkananen, 2015). Both knowledge leaking
and knowledge sharing have pros and cons to innovation performance of organisations (Ritala et al.,
2015). These are both extended views of knowledge spillover and the idea is the same. Knowledge is
shared and leaks through multinational corporations; foreign direct investment or technology-
sharing.
According to Huggins and Thompson (2015), the knowledge spillover theory of entrepreneurship is based
on the premise that uncommercialised knowledge created in an organisation can be utilised as a source of
entrepreneurial opportunities for other organisations and as a result, contribute to innovation and
development. Figure 4.1 illustrates the knowledge spillover theory of entrepreneurship.
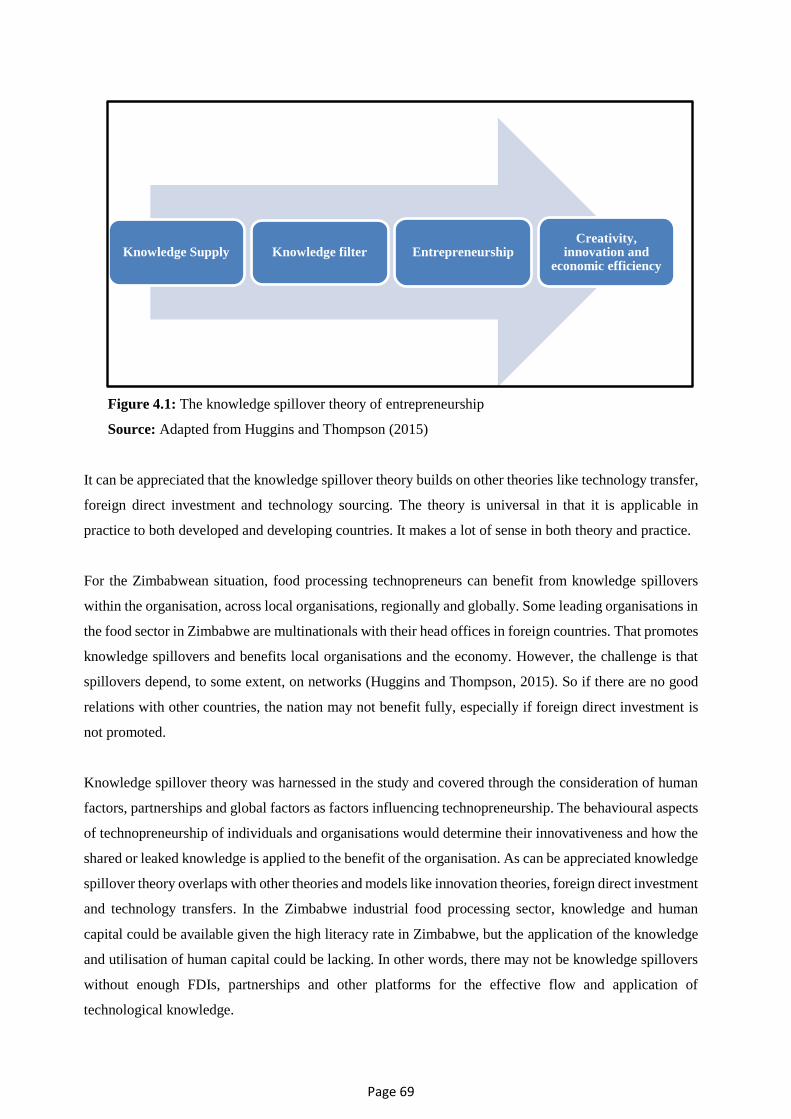
Page 69
Figure 4.1: The knowledge spillover theory of entrepreneurship
Source: Adapted from Huggins and Thompson (2015)
It can be appreciated that the knowledge spillover theory builds on other theories like technology transfer,
foreign direct investment and technology sourcing. The theory is universal in that it is applicable in
practice to both developed and developing countries. It makes a lot of sense in both theory and practice.
For the Zimbabwean situation, food processing technopreneurs can benefit from knowledge spillovers
within the organisation, across local organisations, regionally and globally. Some leading organisations in
the food sector in Zimbabwe are multinationals with their head offices in foreign countries. That promotes
knowledge spillovers and benefits local organisations and the economy. However, the challenge is that
spillovers depend, to some extent, on networks (Huggins and Thompson, 2015). So if there are no good
relations with other countries, the nation may not benefit fully, especially if foreign direct investment is
not promoted.
Knowledge spillover theory was harnessed in the study and covered through the consideration of human
factors, partnerships and global factors as factors influencing technopreneurship. The behavioural aspects
of technopreneurship of individuals and organisations would determine their innovativeness and how the
shared or leaked knowledge is applied to the benefit of the organisation. As can be appreciated knowledge
spillover theory overlaps with other theories and models like innovation theories, foreign direct investment
and technology transfers. In the Zimbabwe industrial food processing sector, knowledge and human
capital could be available given the high literacy rate in Zimbabwe, but the application of the knowledge
and utilisation of human capital could be lacking. In other words, there may not be knowledge spillovers
without enough FDIs, partnerships and other platforms for the effective flow and application of
technological knowledge.
Knowledge Supply Knowledge filter EntrepreneurshipCreativity,
innovation and economic efficiency

Page 70
4.4 Innovation theories
Lim and Suh (2015) discussed product and process innovation models and how these innovation theories
relate to each other. These models include the Life Cycle Model (Utterback, 1994); Process-Enabling
Industry (Pisano, 1997); Process Development Model (Lager, 2000); Quality by Design (Juran, 1992). It
can be appreciated that, according to Lim and Suh (2015) these models can be classified into four types
to include those which are:
Mature – have a low rate of both product and process innovation
Product driven – have a high rate of product innovation and low rate of process innovation
Process driven – have a low rate of product innovation and high rate of process innovation
Process enabling – have a high rate of both product and process innovation
Rodríguez‐Pose and Peralta (2015) advocated for a movement from a linear approach to innovation to a
systems approach when they linked innovation to economic growth in Mexico. This leads to the
consideration of innovation policies and environmental factors as forces influencing innovation and
economic growth. The systems view to innovation is supported by Gregor and Hevner (2015) who stresses
that the territory covered by innovation is so wide since it involves human actors who include:
entrepreneurs, technologists, managers, inventors, academics, employees and policy-makers.
Furthermore, Salerno et al. (2015) explain that the innovation process from idea generation through to
commercialisation is the traditional view. The modern view is that the innovation process may assume
different phases and they proposed eight different innovation processes depending on the situation
(Salerno et al., 2015). Thus to practice innovation may begin anyhow and anywhere. It may amount to
innovation myopia to think of innovation as a mechanical, step-by-step process and this leads to reduced
innovation performance. Innovation theories are also universal, applying to both developed and
developing economies. This maybe found to be the case with evidence from nations that value research
either at universities or research and development in an organisation. The innovation theories can guide
technological development and entrepreneurial development which innovative organisations can utilise
for their competitive advantage. However, most developing economies like Zimbabwe may not be as
innovative; since they end at acquiring scientific knowledge that in most cases may not be applied or
adopted by corporate organisations or nascent entrepreneurs (Kim et al., 2015). In this research study,
innovation theories were a key to determining what data could be gathered. Most questions in the
questionnaire were seeking for data that could lead to the researcher determining the innovativeness of
individual employees and their organisations as a group. This was so since innovation is one of the
important pillars of technopreneurship.

Page 71
In this study innovation is considered as the utilisation of new technology in an organisation (Jonsson,
2015). As such, innovation theories are applicable to this study as they are discussed in both technology
and entrepreneurship. The innovation information gathered determines the innovativeness of an
organisation and, as a result, competency.
4.5 Technology transfer (TTs)
According to the Association of University Technology Managers (AUTM, 2013), technology transfer
refers to the process of transferring scientific information from organisation to organisation for further
development as well as commercialisation. This is related to Murphy et al. (2015) who look at technology
transfer as the movement of knowledge, software, hardware and productive information between industry,
research and development institutions, government and non-governmental institutions within and across
nations. The idea behind the concept is that technological knowledge and skills are not equitably
distributed within or across nations. As such, to maximise the utilisation of technology before it is replaced
by a newer and better one, it has to flow to other potential users within and across nations.
Nastaseet et al. (2010) assert that innovation as a complex phenomenon is concerned by its globalism, the
assets and business units defined systems: marketing, product adoption, technology and as such
technology transfer as an element of the innovation becomes the key to realising the materiality of research
and development results. AUTM (2013) further clarifies that technology transfer as a process typically
includes:
Identifying new technologies
Protecting technologies through patents and copyrights
Forming development and commercialisation strategies such as marketing and licensing to
existing private sector companies or creating new start-up companies based on the technology
In well-developed systems like the United States of America, technology transfer is facilitated by
technology transfer offices (TTOs). TTOs assist academics to identify, patent and create production and
marketing companies or license the viable technologies. In most cases it is associated with breakthroughs
from academic research, especially from universities, which are taken to industry and commerce for
commercialisation (Mowery et al., 2015; O’kane et al., 2015; Allen and O'shea, 2014; Wright, 2014).
Universities in the USA are assessed using the number of spin-offs they have achieved (AUTM, 2013). It
may have several perspectives such as academic entrepreneurship, simply commercialisation of university
research results, of simply university spin-offs. Academic entrepreneurship simply refers to the
perspective that all research activities at universities should have a goal of ending up in industry and
commerce. Commercialisation may mean that only successful research results should be taken to industry

Page 72
and commerce. Allen and O’Shea, (2014) take technology transfer as an entrepreneurial approach, which
is the perspective of this research study. Applied to Zimbabwean efforts, this could be linked to
universities of technology, like Chinhoyi University of Technology (CUT). Such universities are meant
to engage in technology transfer as motivated by Kakava (2013). Since the opening of the university in
2003, there is not yet a move towards technology transfer. Perhaps there may be not enough government
initiative and policy support. This is the international scenario of technology transfer. It shows that there
is a need for an enabling policy support and government initiatives and collaboration between universities
and industry, as in the form of Private Public Partnerships (PPPs).
In this study, given the importance of technology transfer in technopreneurship, the researcher gathered
data with regards to existing partnerships between research and development institutions and the food
processing sector. Furthermore, the notion of government support also has a bearing on technology
transfer given that the majority of universities are state universities that are mandated by the existing
government regarding what their thrust comprises. Also, the government is responsible for cultivation
good relations between industry and universities through their policies and the study also covered the
issues in the process of questionnaire content design.
4.6 Academic entrepreneurship
Academic entrepreneurship is a concept related and handled in passing when technology transfer was
discussed. It is found imperative to discuss it in more detail separately given its influence on government
policy and relationships between industry and academic institutions. Academic entrepreneurship refers to
efforts engaged by universities or research and development institutions to promote commercialisation of
their activities on campus and in surrounding areas of the university (Siegel and Wright, 2015). Siegel and
Wright (2015:583) argue that there is need for a more open and broader perspective of academic
entrepreneurship that does not rely too much on “the research-third mission nexus, with its narrow focus
on university-industry links or a narrow emphasis of academic entrepreneurship on the transfer of
scientists’ inventions from the laboratory to licenses and start-ups, particularly in relation to formal
intellectual property”.
There is need to harness opportunities for academic entrepreneurship which are arising from informal
intellectual property and the creation of other forms of entrepreneurial ventures involving more
stakeholders which include “students, a younger generation of faculty and post-doctoral fellows who are
more comfortable working within dustry than the previous generation, federal” (Siegel and Wright,
2015:2). Meek and Wood (2015) acknowledge the changes in the perspective of academic
entrepreneurship, especially given the need to generate income in modern universities, but considers the
issue of role identity or work identity from the individual academic view. The modern approach is that

Page 73
academic entrepreneurship is taken “as a strategy to overcome resource barriers to traditional academic
duties (De Silva, 2015:1). In the Zimbabwean situation, because of current economic hardships,
universities are required to generate their own income to run their affairs (Mhukahuru, 2015; Kakava,
2013; Mushava, 2014). The government began by failing to pay grants for students and requested students
to meet their own study financial needs (Mushava, 2014). The trend was followed by the government
failing to pay for infrastructural development, asked university management to find means to acquire and
develop properties without government funding (Makoni, 2011). Furthermore, the government admitted
that they could not pay regional rates of university staff salaries and other conditions of service, so they
instructed university management to supplement the salaries from student fees or other income generating
activities (Mhukahuru, 2015). The latest development is that the government is struggling to pay the
salaries of university staff (Mhukahuru, 2015). Universities are being approached and requested to pay
perhaps half of the salaries from student fees or other sources. It is believed that universities are supposed
to be self-reliant (Mhukahuru, 2015). Given the situation, it is apparent that universities have no choice
except to embrace the latest concept of academic entrepreneurship. Long established universities like the
University of Zimbabwe (UZ) have well-established projects like farms that can supply their canteens
with enough supplies to feed the university canteen. On the other hand, other universities like The
Chinhoyi University of Technology may lack such established income generating projects. The dilemma
is the compatibility of the new paradigm of academic entrepreneurship with the traditional academic
duties. Thus, crises may be fertile grounds for creativity and innovation.
Gurau et al. (2012:165) concluded that academics choose to assume mainly three forms in academic
entrepreneurship, that is:
(1) founder-manager of an entrepreneurial organisation;
(2) project manager in an existing organisation; or a
(3) science advisor to the board of directors of one or several organisations.
They noted that the role of the academic entrepreneur varies in each form of academic entrepreneurship.
In this study, the second form, that is, project manager of an existing organisation is the most relevant
form of academic entrepreneurship. The concept of academic entrepreneurship was included in the study
through questions with regards to partnerships. The research sought to find out whether industry had
partnerships with universities so that they benefit from university research activities. Academic
entrepreneurship is a valid technopreneurship concept that encourages the application of scientific
knowledge to industrial activities and perhaps partnerships between universities and industry.

Page 74
4.7 Foreign direct investments (FDI)
Girma et al. (2015) talk of direct and indirect effects or spillovers of FDI on the host country. However it
has to be noted that there is also spillover to the home country of investors of FDIs as noted in the
American situation of multinational corporations (Tang and Altshuler, 2015) Studying the Chinese
situation, Long et al. (2015) concluded that there are positive effects of FDIs on the institutional quality
of the host country. China is one of the economies which has since benefited from advantages of FDIs.
FDI spillovers include growth in both the capital flow and the economy; advanced technological or
managerial expertise (Long et al., 2015). Long et al. (2015) point to the fact that the attraction of FDIs
depends on the host countries’ FDI policy. Thus, host countries should weigh the benefits of the FDIs
against its disadvantages. Naturally, the benefits outweigh disadvantages, especially in developing
countries like Zimbabwe. Rolfe et al. (2015) assert that intra-Africa FDI has grown faster than African
FDIs from overseas. This could be attributed to the trust among African countries as compared to the trust
of African countries to overseas investors. This can be attributed to the background of colonial history.
Gui-Diby and Renard (2015) however indicate that FDI does not have an automatic impact on the
industrialisation of African economies, because of the hosts’ over-reliance on natural endowments and
inadequate government interventions. Zimbabwe has managed to attract FDI from three major countries;
China, South Africa and Australia. The policy has a direct effect on FDI and determines the attraction and
benefits of FDI on host countries (Adams and Opoku, 2015; Bokpin et al., 2015). Therefore, measures
have to be put in place to strengthen regulations in sub-Saharan Africa to realise the benefits of FDI
especially on host countries of the region. According to the Wealth and Finance International (WFI)
(2015), Zimbabwe’s FDI dropped to $67m in 2014 from $165m during the same period in 2013. This was
after the ruling party Zimbabwe African National Union – Patriotic Front (ZANU-PF) won the 2013
elections and hence their indigenisation policy was to continue being implemented. Thus, the Zimbabwe
Indigenisation Policy is the major threat to foreign investors to commit their resources to the nation. This
is in contrast to the nation’s Chinese counterpart whose FDI year-on-year growth is 10.4%. The difference
in such developments lies in the differences in FDI policies.
According to Ruwende (2015:1), senior reporter, in the Government controlled press, the Zimbabwe
“government is coming up with a cocktail of measures to attract FDI in the country, among them amending
the Companies Act and other relevant investment regulations to align them with the best business
practices”. It has to be noted that the government advocates for reforms regarding bureaucratic procedures,
tariff barriers, non-tariff barriers and other regulatory issues contained in legal documents such as the
Companies Act. The issue of corruption by government officials seeking to elicit for bribes to assist
foreigners to register and operate their businesses was also mentioned in the report. From this view, it was
noted that the reforms did not touch the Indigenisation and Economic Empowerment Act which could be
one of the most threatening barriers for foreigners to do business in Zimbabwe. Other issues not pointed

Page 75
to which could pose some risk include the issue of political hostility against white farmers (farm invasions
that seem to continue). As such these can be viewed as political risks leading to fears of confiscation and
domestication. Fingaz (2015) names the 10th point of the 25 August 2015 Ten Point Plan for sustained
economic growth that reads “Implementation of Special Economic Zones to provide the impetus for
foreign direct investment”. The statements point to the realisation of the need for FDI in the nation.
Hu (2015:19) emphasised that FDIs benefit host countries through: “The exposure of the local economy
to the new technology through the training of local workers and engineers working in multinational
corporations, the demonstration effect, and the linkages the multinational corporation builds with
upstream and downstream firms in the local economy, thus, create opportunity for technology spillover,
at least not all of which was intended by the multinational corporation.” In other words, economic policies
that do not promote FDIs in the current globalised environment can be concluded to be leading to policy
failure.
FDIs were covered when the researcher gathered data with regards to global factors, foreign partnerships
and government policy support. FDIs are a relevant technopreneurship concept since technology is
transferred through companies investing in other countries and taking with them technology and business
concepts.
4.8 Technology sourcing
Another concept related to the FDI perspective is technology sourcing. Harhoff et al. (2014:5) define
technology sourcing “as sourcing technological knowledge from local knowledge pools”. That is, if an
organisation intends to have knowledge of technology in a foreign nation, they would invest in that
particular nation, or find other ways to collaborate with the foreign organisation so as to tap the foreign
company’s technological skills and knowledge. According to Yeoh (2014), technology can be sourced
internally, by utilising the existing knowledge in the company through the internal research and
development or externally by outsourcing from other companies which are external human capital
development or simply exploration versus exploitation. It is like in the make-or-buy decision in the
procurement process. Lattemann et al. (2015) evaluate external sourcing by Chinese companies with
regards to the impact on the technological innovation process. Benefits are weighed against costs.
Technology sourcing strategies or vehicles vary depending on the financial capacity of the organisation.
The organisation can adopt the alliance approach, acquisition or go-it-alone (Lungeanu et al., 2015).
While external sourcing or investing abroad proved to benefit Chinese companies (Lattemann et al., 2015;
Nepelski and De Prato, 2015), strategic alliances have benefited US organisations (Harrigan, 2015).
Literature covers the Zimbabwean circumstances together with other developing or African countries like

Page 76
Nigeria and South Africa. It has been noted that empowerment and indigenisation and local participation
in economic activities have been used as policy guide in Zimbabwe. Amadi-Echendu and Mhlanga
(2015:2), argue that, “Whereas it is intuitively obvious that global supply chains have wide ramifications
on indigenisation and empowerment legislations, however, the local challenge is how to harness the
extensive sources of the technological capabilities required for the capital development of an oil refinery.”
Therefore, once more, this points to the issue of economic policy analysis. Thus, ZIMASSET with its
guiding concept of indigenisation and economic empowerment could be weighed against the need for
technological capacity. Technology sourcing can adopt different sourcing vehicles that include: internal
development; alliances; or acquisitions and these are equivalent to the build, borrow or buy decisions
(Lungeanu et al., 2015). Companies can use any one of these or combine two or more to achieve their
desired outcomes. According to Lungeanu et al. (2015) the choice of a technology sourcing vehicle (s)
depends on the level of the financial slack of an organisation. The vehicles cited above can be appreciated
in practice. Internal development or the make decision can be viewed as depending on whether an
organisation has a competent research and development (R&D) department with both technological and
financial capacity to develop the desired technology. This could be said to be common in developed
countries or other emerging economies that have some financial leverage. Economies with technological
parks are good examples of those which have decided to make the technology. Zimbabwean companies
may have R&D departments but may lack the technological capacity and the financial resources to develop
technologies.
On the other hand, alliances allude to strategic partnerships, where an organisation partners with another
either competing or complementing organisation to have some technological, entrepreneurial or financial
benefit. Alliances are universally applicable to both developed and developing countries. Alliances are
dependent on the prevailing relationship between the countries involved. The relationship between nations
depends on the harmony of individual economic policies between the involved nations. Zimbabwe is
viewed as a nation with policies that do not promote good relations with other nations especially given
the Indigenisation and Economic Empowerment Act (Kachembere, 2015). Lastly, acquisitions depend on
the financial capacity of the buyer. Any company with additional financial resources can buy an existing
company and benefit from the existing technology as well as the innovativeness of the existing company.
The financial position of an organisation depends to a greater extent on the performance of the macro
economy of a nation. Therefore, acquisitions are common by companies in developed countries. However,
knowledge sharing and knowledge leaking take place in the location of the acquired organisation and
benefits both the nation of the acquired company and the nation of the acquiring company. It depends on
the risk of an investment (Zimeye, 2015).
Technology sourcing is also linked to the diffusion of technology. Technology diffusion describes the
process through which technological knowledge spread from the point of discovery to the point of

Page 77
utilisation. It also amounts to a perspective of technopreneurship. According to Hu (2015) technology
diffusion takes place through various channels which include:
International trade
Foreign direct investment (FDI)
Technology licensing
The international movement of technology personnel
The flow of disembodied knowledge
In most cases technological knowledge reaches developing countries for adoption when they are at the
decline stage in developed countries. Thus, developing countries are mostly laggards when it comes to
technology while developed countries are innovators. Perhaps the factors leading to such a fact include
innovativeness of nations, financial capacity, infrastructure development as well as the relationship with
other nations. Also, Kim and Lee (2015) indicated that technology policies in East Asia and Latin
America, that is, the science and technology (S&T) policies determined the developmental contribution
of acquired technological knowledge.
FDIs are important in this study since they are a clear concept of technopreneurship as it involves the
transfer of technology from the country of origin to the host country. The FDI concept was covered in this
study in such issues of the research as government policy, global factors and foreign partnerships.
4.9 Value addition (VA)
Mabuwa (2014:13) as the Deputy Minister of Industry and Commerce in her presentation indicated that:
Value addition and Beneficiation has been singled out as one of the four key clusters under the
ZIMASSET development agenda.
Several agro-processing areas are earmarked for development through the value addition initiative. In
the leather industry, for example, in order to encourage value addition, Government levied an export
tax of US $0,75 per kg as a deterrent measure to the exportation of raw hides and skins.
The government is encouraging the establishment of business ventures that are centred on value
adding our primary products, agricultural output included.
The Green Fuel Project in Chisumbanje is an example where economic development, environmental
sustainability and social inclusion are all at play as a result of a value addition initiative. When it
reaches its peak, the project is expected to generate direct employment of between 5000 to 6000
people.

Page 78
The concept of value addition covers a wide spectrum of raw materials that are supposed to be processed
to consumable commercial products. The concept applies to food products as well. Value addition is a
policy guide for the Ministry of Industry and Commerce in Zimbabwe as enshrined in the Value Addition
Presentation by Mabuwa (2014). The policy identifies opportunities for value addition in the food sector
which include:
Beef canning
Fruit juice manufacturing
Oil expression
Fruit jam and avocado processing
Cotton and clothing industry development
Leather and allied industries development
While these are entrepreneurial ideas and opportunities, the issue of technological capacity requires
serious consideration to turning dreams to reality. The fact points to the need of technopreneurship as a
guiding concept of industrialisation. Fingaz (2015:1) the 2nd point of the 25 August 2015 Ten Point Plan
for sustained economic growth reads, “Advancing Beneficiation and/or Value Addition to the agricultural
and mining resource endowment.” The statement acknowledges the importance of value addition as a
concept of technopreneurship. That is, it has to be realised that value addition needs to be spearheaded by
technological innovation and entrepreneurial drive. Thus the realisation of technopreneurial approaches
to employment and wealth creation.
Value addition is basically taken as an industrial food processing guide. As such it assists an organisation
to realise that when dealing with especially agricultural food produce, processing does not only mean
changing the natural state but also include packaging and preserving. The concept was covered in the
study under industrial food processing that is the object of technopreneurship. Specifically, it was dealt
within internal processes and key success factors.
4.10 Technological parks (Technoparks)
Internationally, technological parks are taken to be there to support organisational production as well as
to host innovative companies while scientific parks are there to bridge the gap between the establishments
of universities or research and development institutions and industry (Kecskés and Kovács, 2015).
Technoparks can also be in the form of industrial parks, which would be there to support a specific sector
like the automotive industry with special services and infrastructure (Kecskés and Kovács, 2015). The
Hungarian perspective combine all of these terminologies to refer to the same thing, the argument being
based on the fact that in practice, the parks may not be separated (Kecskés and Kovács, 2015; Espitia-

Page 79
Escuer et al., 2015; Stephen, 2015). Wojewnik-Filipkowska and Kowalski (2015) call them industrial-
technology parks (ITPs) which are “a combination of the infrastructure function and performance which
enable the exchange of information between scientific organisations and entrepreneurs”.
This study will take the perspective of one term referring to all whether technology parks, technological
parks, science parks, scientific parks, industrial parks or whichever. There is a difference in how
technoparks are managed, in developed and developing countries. Developed and upcoming economies
can separate the role of, for example, technological parks and scientific parks whose role can be combined
in developing countries. That is if they are in the first place found in developing countries which in most
cases have not yet thought of these as development drivers. There is, however, vast evidence that
technoparks are one of the key elements of knowledge management approaches of knowledge-based
economies. Globally, academic research and industrial innovation are seen to be well pronounced in few
economies such as the USA, Japan, and the European Union. However there are other emerging
economies that are also promising such as India, China and Brazil. In the USA, Silicon Valley, in San
Francisco, gave birth to several start-up as well as global technology companies. There is also Silicon
Valley of India. Guzman and Stern (2015) describe Silicon Valley (USA) as typical high-impact
entrepreneurship, demonstrating the role of entrepreneurship in economic development which can guide
policy-makers to develop non-self- contradictory economic policies. The success of Silicon Valley is
based on the harmonised efforts by all contributors in the technopark systems, which include: government,
universities, entrepreneurs, venture capital, mature corporations, industrial development centres,
management and service providers (Guzman and Stern, 2015). The Silicon Valley model has been copied
by most countries, examples being: Taiwan (Silicon Island); Malaysia (Multimedia Super Corridor);
Bangalore (Silicon Plateau); Cambridge, U.K. (Silicon Fen); Austin, Texas (Silicon Hills) and New York
(Silicon Alley).
In Zimbabwe, the institution which is closely related to the technopark concept is the Scientific and
Industrial Research and Development Centre (SIRDC). From its website its mission is that:
“The Scientific and Industrial Research and Development Centre (SIRDC) was established by the
Government of Zimbabwe in February 1993 under the provisions of the Research Act of 1986. SIRDC’s
mandate is to carry out strategic research and development (R & D) for the benefit of the manufacturing,
service, agricultural and mining sectors of Zimbabwe as well as to commercialise R & D outputs. Our
mission is to provide Zimbabwe and the region with technological solutions for sustainable development.
Our vision is to become the leading Centre for the development of Zimbabwe and the region through
reduction to practice of technologically developed products and processes.”

Page 80
It can be noted that, in principle, this is a good idea that however requires cooperation from all stakeholders
as has been noted in the case of Silicon Valley (USA). In any case, SIRDC made some meaningful
contributions by giving birth to some incubations of industrial food processing and other biotechnological
organisations. The off-springs of SIRDC are currently, however, facing the same viability challenges that
are being encountered by all other organisations in Zimbabwe. Also, what may lack is the policy
implementation support and collaboration with other stakeholders in the economy. Perhaps, the existing
government has not received the required recognition from the stakeholders, hence also losing the
necessary cooperation.
Technoparks have the objective of linking researchers and industry and assist organisational research and
development. The concept was covered in the study under government support, internal processes and
partnerships as factors influencing technopreneurship.
4.11 Business Clusters
It has to be noted that the concept of technoparks is taken as a form of clustering (Mohan, 2014).
According to Soviar (2015:529), “a business cluster (clusters, industry cluster, competitive cluster,
Porterian cluster, and more) is a geographic concentration of interconnected businesses, suppliers and
associated institutions in a particular field.” It seems in literature, authors refer to Michael Porter as the
father of business clusters (Nguyen and Martin, 2015; Soviar, 2015; Rauch et al., 2014; Kulakova, 2014).
Business clusters have a positive impact on economic development, knowledge transfer, innovation, and
organisational performance (Rauch et al., 2014). Kulakova (2014) outlines benefits of business clusters
as:
Access to specialised information
Better access to employees and suppliers
Access to institutions and public goods
Complementarities and better motivation and measurement
Business clusters have been used by several nations to tap into the benefits of the concept such as Slovak
Republic (Soviar, 2015), Vietnam (Nguyen and Martin, 2015) and Wales (Abbey, 2012). Developed
economies in the UK, USA and Europe, have extensively adopted and succeeded in the use of business
clusters that, in most cases are knowledge based business clusters. In all the cases the issue of the cluster
has been facilitated by the government and there is the important element of economic policy on clusters
development and success. Abbey (2012) refers to Porter’s model of economic policy on cluster
development.

Page 81
Figure 4.2: Aspects of economic policy in cluster development
Source: Abbey (2012)
In Zimbabwe, the issue of business clusters has been mentioned in economic policy documents. Section
3.9 of the Industrial Development Policy (IDP 2012-2016) outlines the cluster initiative of the nation. The
proposed industries include the clothing and textile industry to be clustered in Gokwe; steel and allied
products in the Midlands and Diamond cutting in Manicaland.
Applying Porter’s (2000) model of aspects of economic policy on cluster development, it can be pointed
out that the requirements for successful business clusters include foreign direct investment promotion,
regulatory reforms and science and technology policy. Some of such requirements are not really in
Collection and
Dissemination
of Economic
Information
Science and
Technology
Policy
Regulatory
Framework
Foreign Direct
Investment
Promotion
Export
Promotion
Advanced
and
Specialised
Factor
Development
CLUSTERS

Page 82
harmony with the development of clusters such as the promotion of FDIs, given the Indigenisation and
Economic Empowerment Act which discourage foreign investors. Thus, the industrial clustering concept
is still on paper and has not yet taken off.
Business clusters were taken as a strategic concept, where an organisation can benefit technologically and
logistically. It overlaps to other concepts like FDIs and technoparks. The idea was covered under
partnerships and government support in the research instrument.
4.12 Summary
There are theories, perspectives or approaches that are advocated in theory and practice that can be
interpreted to represent technopreneurship at the end of the day. These include knowledge spillover theory;
innovation theories, technology transfer; technology parks; business clusters; foreign direct investments
(FDIs); value edition and technology sourcing. The list may continue with different terms used. However,
the common thread is that these are guiding concepts that a technopreneurial organisation can embrace so
as to exploit opportunities emanating therefrom. The aspects have been discussed and their application
internationally, regionally, locally and in the food processing sector in Zimbabwe have been analysed.
Each concept was found to be aiding the development of the research instrument and fulfilment of the
research objectives in one way or another. The coverage of the concepts helps to understand further and
have a broader picture of technopreneurship and supporting concepts, but the idea remains the same, that
of exploiting technological opportunities to revive existing businesses or starting new ones. While it is
appreciated that the concepts are generic, it has to be noted that they facilitated in the understanding of
factors influencing technopreneurship, the role of technopreneurship and key success factors; that is, the
perspectives aided in the development of the research instrument. Knowledge spillover theory was used
in the human factors, partnerships and global factors. Innovation theories and value addition were utilised
under internal processes and key success factors. Technology transfer and business clusters were utilised
under partnerships and government support while foreign direct investment and technology sourcing were
utilised global factors, partnerships and government support. Technology parks were utilised in questions
to do with internal processes, partnerships and government support.
The chapter discussed the perspectives of technopreneurship. Having exhausted the possible preliminary
information that can be pertinent about technopreneurship, the next chapter covers the methodology and
methods adopted to gather and analyse the data as stipulated by the research objectives.

Page 83
CHAPTER 5: RESEARCH METHODOLOGY
5.1 Introduction
Research methodology is the way in which the researcher carried out the research (Jonker and Pennink,
2010). It covers both the research plan, methods of data collection and analysis. Others distinguish
between research methods and methodology, where methods represent how the research was executed
and methodology is the general science or philosophy guiding the research (Adams et al., 2007). Also,
Creswell (2009) holds that research methods are research techniques and procedures while methodology
is the guiding framework that joins methods to the research outcomes.
This section indicates the methodological issues adopted in this study to achieve the research objectives.
It covers the theory informing the methods used, the location of the study, population, sampling plan,
inclusion/exclusion criteria, data collection process, data management, data analysis, reliability and
validity as well as ethical considerations.
In deciding on which methodology and methods to adopt, the research objectives were considered. The
research objectives are to: establish factors that influence technopreneurship in the food processingsector
in Zimbabwe; determine the role of technopreneurship in the food processingsector in Zimbabwe;
determine the feasibility of technopreneurship in the food processingsector in Zimbabwe; and identify
critical success factors that influence technopreneurship in the food processingsector in Zimbabwe.
5.2 The research onion
Saunders et al. (2007) developed the research onion to illustrate the stages that a researcher should cover
when a research strategy is developed. In this study, the researcher adopted the research onion as illustrated
in Figure 5.1. The usefulness of the research onion lies in the fact that any research methodology in a
variety of contexts can be adapted to the research onion (Bryman, 2012).
Page 84
Figure 5:1 Research onion
Source: Saunders et al. (2007:132)
The research onion from the outer layer to the inner covers: Philosophies, that is, pragmatism,
subjectivism, objectivism, interpretivism, radical structuralist, realism, radical humanist, interpretive,
functionalist and positivism; approaches that include inductive and deductive; strategies consisting of
survey, case study, grounded theory, ethnography, experiment, action research and archival research;
choices cover multi-method, mono method and mixed methods; time horizons include cross-sectional
and longitudinal; techniques and procedures referring to data collection and data analysis (Saunders et al.,
2007). The research onion is a comprehensive guide to research but requires the researcher to design a
relevant research thread that links relevant research methodologies. That is, in practice specific philosophy
can only lead to particular approaches that are in harmony with a particular strategy, choices, time horizons
up to techniques and procedures (Saunders et al., 2007). However, different terminology could be
employed as the researcher dealt with the research methods as covered by the vast literature of research
methods. Such terms like the research design, quantitative and qualitative researchers were used to inform
this study.

Page 85
Figure: 5.2: Research onion for the study
Source: Adapted from Saunders et al. (2007)
The research theory used to inform this study was classified into two; that is the research philosophy and
the research design. These were taken to guide the courses of action taken by the researcher to
scientifically find answers to the research questions. Thus, the relationships between phenomena are
explained by science that leads to the development of a theory that in turn informs future decision makers.
While the scientific approach can be viewed as either inductive or deductive (Adams et al., 2007), this
study took the deductive reasoning method or deduction. It started out with general statements and
endeavoured to reach a specific and logical conclusion. The scientific approach used deduction to review
the general concepts to reach the conclusion.
Research Philosophy: Positivism
Approaches: Deductive
Strategy: Survey
Choices: Mono method
Time Horizons: Cross Sectional
Study
Data collection and Data Analysis:
Techniques and
procedures

Page 86
To fulfil the objectives of the study, the researcher modified the research onion of Saunders et al. (2007)
and came up with a research onion suitable for the study as shown in Figure 5.2. Figure 5.2 will be
explained and discussed layer by layer in the following section.
5.3 Research philosophy
According to Saunders et al. (2007), a research philosophy is viewed as the process of developing
knowledge and determining the nature of the knowledge. It is also known as scientific thought
(Bhattacherjee, 2012) thus implying that the research process has to follow mainly the scientific approach
(Adams et al., 2012). Cohen et al. (2007) view different kinds of research as referring to research
philosophies. Research philosophy can be categorised into three: epistemology, ontology and axiology
(Saunders et al., 2007). Axiology is that area of philosophy that looks at judgements about the value
(Saunders et al., 2007). Ontology concerns the nature of reality and has sub areas of Objectivism,
Subjectivism and Pragmatism (Saunders et al., 2007). Epistemology concerns what constitutes acceptable
knowledge in a field of study and covers positivism, realism and interpretivism (Saunders et al.,
2007:102). Interpretivism philosophy believes “that the best way to study social order is through the
subjective interpretation of participants involved, such as by interviewing different participants and
reconciling differences among their responses using their subjective perspectives” (Bhattacherjee,
2012:19). The interpretivism philosophy covers two areas that are phenomenology and symbolic
interactionism.
This study is guided by the positivism philosophy which also called positivist/postpositivist research,
empirical science and postposivism (Creswell, 2009). Positivism research holds that: “the social world
exists externally and is viewed objectively; research is value-free; and the researcher is independent,
taking the role of objective analyst” (Cooper and Schindler, 2011:17).
5.4 Role of theory
According to Adams et al. (2007), theory consists of a systematic definition and proposition of the
relationship between interrelated concepts which can be used to explain and predict facts. The term theory
is distinguished from other terms like paradigm, proposition and hypothesis. A proposition is a statement
assuming the relationship among variables (Adams et al., 2007). A paradigm is a knowledge claim about
a phenomenon (Creswell, 2009). A hypothesis is an assertion about the relationship between variables that
is empirically testable (Jonker and Pennink, 2010); that is, theories have underlying paradigms and
propositions and these can be the basis for hypotheses formulated to guide research to support or revise a
theory. Thus, research can be seen as based on theory testing or gathering empirical/practical evidence.
This study was based on gathering empirical data without testing any theory or hypothesis. There are two

Page 87
approaches to research; that is, starting with a theory or ending with a theory. This is the essence of
deductive and inductive reasoning. Deductive reasoning “begins with a universal view of a situation and
works back to the particulars; in contrast, induction moves from fragmentary details to a connected view
of a situation” (Gray, 2013:16). The deduction process starts with theory and gathers facts to test the theory
while induction starts with facts and construct a theory (De Vaus, 2014; Babbie, 2015).
This study adopted the deductive research process. The study started by referring to theoretical and
empirical evidence with regards to factors that influence technopreneurship, business operations and the
manufacturing industry in general. The scope of the information was the global, international, regional,
industrial and sectoral geographical parameters. The indicated factors were linked to the Zimbabwean
food processing sector situation and a conceptual framework was designed. This was the starting point of
the deduction process. However, it should be pointed out that there was no model of factors influencing
technopreneurship that were taken as this could have limited the results of the study. Furthermore, the
major theoretical and empirical models were based on different environments and situations. Most of the
theoretical and empirical models of factors influencing technopreneurship pertained to developed
countries. Perhaps the closest were the annual surveys by CZI (2011-2015) which pertained to the whole
manufacturing sector of Zimbabwe and limitations with regards to validity and reliability.
The adopted theoretical framework, Figure 3.4 in Chapter 3 was based on reviewed empirical and
theoretical literature which pertained to factors influencing technopreneurship as gathered in chapter 3
and 4. The results and findings from other researchers on factors influencing technopreneurship were
gathered and modelled to come up with the theoretical or conceptual framework. The conceptual
framework was also backed by the reviewed literature on technopreneurship so as to take concrete and
refined factors influencing technopreneurship through a test process into the field to achieve the objectives
of the study. Issues considered to develop the conceptual framework also included that the research was
not supposed to duplicate existing research or leave out other pertinent factors thatwere put through the
testing process. According to Gray (2013) and De Vaus (2014), the deductive and inductive approaches
are not mutually exclusive since, in practice, research is about constructing theories and testing theories.
That is, it has to be appreciated that, the deductive approach has elements of the inductive approach in that
the conclusion of the deductive reasoning ends up modifying the existing beliefs. This modification can
be deemed to be a new construct thatis based on a model that could be taken to be general since it may
not be taken as pure as it maybe (Bryman and Bell, 2015).
5.5 Research design
A research design stipulates the purpose of the research (Gray, 2013). According to Kothari (1990:39), “a
research design is the arrangement of conditions for collection and analysis of data in a manner that aims

Page 88
to combine relevance to the research purpose with economy in procedure.” It concerns research decisions
regarding, where, how many, what, when and how. “A research design is primarily the model you propose
to use to analyse the data, but it also must include the plans for measuring the major variables and
collecting data” (Baker, 1999:451). Research designs describe the data to be gathered by a research study.
Research designs can be categorised into three, that is, descriptive, explanatory or predictive research.
It has to be appreciated that while the three research designs may be considered different, these tend to
build on each other. They move from the most basic, that is the descriptive design, through the
intermediate, that is explanatory design, to the most advanced, that is predictive research design. While a
study may assume one of the designs, an element of each design is found in all designs. This study adopted
a descriptive research design (Saunders et al., 2007).
Descriptive research design
According to Adams et al. (2007) descriptive research design aims to provide a simple description of
phenomena and is not specifically concerned with considering why behaviour may be the way it may be.
The study did not focus of establishing a cause-and-effect relationship but a correlational relationship
which is basically descriptive in nature and not causal. In this case, the study aims at describing what is
going on in the Zimbabwean food processing sector with regards to technopreneurship. So the descriptive
research design became the best suitable design for that purpose. This study mainly assumed a descriptive
research design using the survey research approach, thus, it sought to find out what it is or “what was
going on” (descriptive research) (Greenfield, 2002). Thus through asking questions to the employees of
food processing companies the researcher could be told what was going on and given the design its
suitability.
Descriptive research describes a phenomenon only (De Vaus, 2014). In this study, the purpose of the
descriptive design was to describe the factors that influence technopreneurship in the food processing
sector in Zimbabwe. The design has its disadvantage mainly from the fact that it cannot establish cause
and effect relationship.
However, its advantages include:
1. Its ability to generate much information through description. Given that the factors influencing
technopreneurship are being sought, the best way to know these is by describing them and their
association with the dependent variable (adoption of technopreneurship).
2. Can identify variables and hypothetical constructs. Through the design, the independent and
dependent variables were identified as factors influencing technopreneurship and technopreneurship
in the Zimbabwean food processing sector respectively. The variables were modelled into a
conceptual framework that assisted to focus the study.

Page 89
3. Descriptions can be utilised in a direct test of a theory or model. From this view, the conceptual
framework, Figure 3.4 in Chapter 3, which is based on literature can be put to test and results useful
to review existing models and beliefs about factors that influence technopreneurship.
4. Some situations can only be studied through description. In this case, it can be appreciated that, given
the aim of the study, that is, to know which factors influence technopreneurship in the Zimbabwean
food processing sector, the only description could fulfil the purpose.
Explanatory research design
Adams et al. (2007) indicate that explanatory research goes deeper than descriptive research in the logic
that it describes phenomena, as well as attempting to consider why behaviour may be what it may be. The
research design is seen as a step further than descriptive or exploratory research designs and does not
describe only but goes further to give reasons for the nature of phenomena. It is aimed at describing and
linking relationships among variables and revise theories and models. The design is not used in this study
since this study does not aim at revising any theory or model in technopreneurship. The aim of the study
is to describe and discuss what is going on in the Zimbabwean food processing sector with regards to
technopreneurship.
Predictive research design
Predictive research takes research one step further than explanatory research and attempts to explain
behaviour, as well as to predict future behaviour suppose with a change in one or more of the determining
variables relevant to the particular phenomenon (Adams et al., 2007). Thus explanatory research design
explains how something is happening. It advances the notion of cause and effect. It is a full experimental
design that suits experiments that formulate theories and models to guide future decisions. The explanatory
research design was not used in this research study since the aim of this study was not to explain how
technopreneurship was happening but what was happening with regards to technopreneurship in the
Zimbabwean food processing sector.
Adams et al. (2007) indicate that explanatory research goes deeper than descriptive research in the logic
that it describes phenomena, as well as attempting to consider why behaviour may be what it may be. The
research design is seen as a step further than descriptive or exploratory research designs and does not
describe only but goes further to give reasons for the nature of phenomena. It is aimed at describing and
linking relationships among variables and revise theories and models. The design was used in this study
since this study aim at revising theories or models in technopreneurship as they apply to a developing
nation.

Page 90
5.6 Research approaches
Research approaches consist of two research domains namely, qualitative research and quantitative
research (Adams et al., 2007). Others add a third approach, namely the mixed research domain (Saunders
et al., 2007).In this study, the quantitative research approach was adopted as opposed to the qualitative
research.
Quantitative Research
Regardingthe type of data gathered, the study assumed a quantitative research approach.
Ingham-Broomfield (2014) highlighted that quantitative research is in line with research which attempts
to establish statistical significance, and addresses questions through measuring and describing. As such
quantifying and describing were the aims of this research hence justifying the adoption of the qualitative
domain. According to Babbie (2015:24):
“Every observation is qualitative at the outset, whether it is our experience of someone’s intelligence, the
location of a pointer on a measuring scale, or a check mark entered in a questionnaire. None of these
things is inherently numerical or quantitative, but converting them to a numerical form is sometimes
useful. Quantification often makes our observations more explicit. It also can make it easier to aggregate,
compare, and summarise data. Further, it opens up the possibility of statistical analyses, ranging from
simple averages to complex formulas and mathematical models. Quantitative data, then, offer the
advantages that numbers have over words as measures of some quality.”
Quantitative research finds answers to questions such as: how much, how often, how many, when, and
who (Cooper and Schindler, 2011). In this study quantification of responses to specific issues was sought
to fulfil the objectives. Merits of quantitative research include:
1. It is believed to be more objective.
2. It uses statistics to generalise research results.
3. It can model a complex problem to simple terms.
4. It tests hypotheses and theories.
5. It assumes a representative sample of the population.
6. It easily assumes the scientific approach.
7. It does not require much detail.
However quantitative research may lack in the richness of explanations which is often required to have a
full description and understanding of phenomena (Babbie, 2015). Quantitative data needs to be qualified
at times for the data to convey its full meaning and answer all pertinent questions. In this study, this

Page 91
limitation was minimised by exhausting all possible answers in the multiple choice questions, for example
where alternative answers were given, an ‘Any other’ would be included to open for those who could not
be accommodated on the alternatives. Also cross checking for consistency was used through determining
the relationship between outcomes of different questions during data analysis.
5.7 Survey research strategy
Saunders et al. (2007) describes seven research strategies namely: experiment, survey, case study, action
research, grounded theory, ethnography and archival research. This study adopted a survey research
strategy. Zikmund and Babin (2012:61) define survey research as “a technique in which a sample is
interviewed in some form or behaviour of respondents is observed and described in some way”. The
definition points to the issue of sampling, interviewing and observation. On the other hand, De Vaus
(2014) holds that survey research is mostly regarded as quantitative research and observation and focus
groups regarded as qualitative.
In this study survey research was used to gather data by asking questions. Questions can be asked through
various means that include: telephone interviews, personal interviews, mail interviews or questionnaires.
The study adopted the questionnaire as a survey strategy. Surveys are compatible with phenomenological
philosophy, descriptive research design and quantitative research.
Surveys are regarded as the most popular research strategy because of its merits which include:
Easy to execute
Cheaper to administer
Can gather large quantities of data
Rely on people and not the researcher
However surveys have their weaknesses emanating from:
Respondents may not cooperate
Respondents may not be able to answer the questions.
In this research study, while taking advantage of the merits of the survey method, the researcher minimised
the weakness of lack of cooperation by negotiating for access (Saunders et al., 2007).
5.8 Time horizons
Research time horizons can be categorised into two, that is, cross-sectional and longitudinal (Saunders,
2007). Time horizons include research timing that has to do with planning or scheduling of the research.

Page 92
Longitudinal research
Adams et al. (2007: state that “longitudinal research involves the study of a sample (or cohort) on more
than one occasion. In other words, longitudinal studies cover a long period, at times several decades, and
follow the sample a repeated number of times.”When the researcher has control over the research process,
the longitudinal approach can be adopted. Longitudinal research is appropriate when the research involves
monitoring or observing the subjects at a constant or given time interval and the research has no time
constraints. This approach did not suit the situation and circumstances of this study.
Cross-sectional research
Rindfleisch et al. (2008) view cross-sectional research as a survey research in which each respondent
complete the survey at one point in time. The study adopted the cross-sectional approach since the
researcher was expected to work over a limited period. According to the University regulations, the study
had a minimum period of two years and a maximum of five years. The cross-sectional approach has
advantages of suiting various academic and industrial situations and circumstances regarding its pragmatic
and cost advantages. However it is viewed as prone to common method variance (CMV) which can be
minimised by using the cross-sectional approach in conjunction with the longitudinal approach
(Rindfleisch et al., 2008). In practice, this is not an easy or practical issue that leaves the cross-sectional
approach being suitable on its own.
Questionnaire pilot testing
Pilot testing is the launching of the questionnaire at a limited scale to eliminate any problems before the
questionnaire is distributedat a large scale (Shukla, 2008). The principal purpose of pilot testing is to
improve the reliability and validity of the questionnaire (Cohen et al., 2007; Saunders et al., 2007). 20
people from 10 organisations which had shown consent were used to complete the questionnaire in the
pilot test. The questionnaire pilot test was one of the major techniques to achieve reliability of the research
instrument and the validity of the gathered data thatare further discussed under reliability and validity.
The results were as follows:
Some of the terminology, such as technopreneurship, was given common meaning. Some of the
terminologwere adjusted to suit the language, jargon was removed and the definition of
technopreneurship was included on the instruction of the questionnaire. As such, to some extent,
thecommon meaning was achieved.
Two out of the twenty respondents had completed the consent letter. A follow-up indicated that
respondents wanted to keep themselves and their organisations anonymous. The researcher indicated
orally to respondents that the consent letter was optional so as to increase the response rate.
Questionnaires offer anonymity and avoid interviewer bias and can be effective, the high response

Page 93
rate for an educated target population that has a strong interest in the topic (Neuman, 2012). Data were
gathered from industrialists who were taken to be involved in technopreneurial decisions.
Some of the questions were not properly aligned to the objectives. These questions were realigned to
gather the desired data and address the objectives. The gathered data included production constraints,
possible innovations and business attitudes. Questions for successful technopreneurs included what
they could point to as success factors and their view towards manufacturing as a business in
Zimbabwe.
5.9 Population of the study
According to Bhattacherjee (2012) population refers to all people, items, units or elements with the
characteristics that the researcher wishes to study. A population is the total collection of units about which
the researcher intends to make possible inferences (Cooper and Schindler 2011). On the other hand,
Adams et al. (2010) view a population as consisting of a well-defined set of elements. In this case, all the
food processing technopreneurs in Zimbabwe and their employees are identified as the population of this
study. The employees are classified as either engineers, administrators, scientists or managers.
The population statistics from ZIMSTAT (2015) show that the employment rate in the manufacturing
industry reduced from 118 600 to 93 100 from the year 2012 to 2014.There are 11 sub-sectors in the
manufacturing industry according to the International Standard for Industrial Classification (2014)with
two which include the foodstuffs and beverages sectors. For the industrial sector in general, ZIMSTAT
(2015) indicated that about 83 percent of the employed is unskilled, that is 17 percent skilled and
professionals; while employment at the managerial level is 1 percent of those employed and with about
72 percent being male. From the above statistics, it can be estimated that from the 93 100 employees in
the manufacturing industry, two sub-sectors fallintofood processing sector thatincludes foodstuffs and
beverages. These two sub-sectors employs about 16 927 employees. That is 2 out of 11 of 93100 assuming
equal employment across the manufacturing industry produces 16 927.From the 16 927 employees in the
food processing sector, 17 percent are skilled according to ZIMSTAT (2015) which is a population of 2
878 workers and these workers are targeted in this study according to this approach.
In this study, the population is represented by all food processing technopreneurs in Zimbabwe. food
processing technopreneurs manufacture food products distributed through retail outlets. The food
processing sector in Zimbabwe is made up of mainly small-scale companies (Macheka et al., 2013). This
could mean employing approximately 100 to 200 people. Respondents included employees within the
food processing technopreneurs who are management, administrators, technicians, engineers and other
staff within the food processing companies in Zimbabwe. Information with regards to the companies was
obtained from the Confederation of Zimbabwe Industries (CZI), Zimbabwe Stock Exchange (ZSE),

Page 94
Industrial Directories and websites. From the sources, it was established that there are 14 major food
processing technopreneurs in Zimbabwe which were still operating in 2014. The researcher contacted
more than half of these industrial food processing technopreneurs.
5.10 Sample design
Sampling can be defined as a process or technique of choosing a suitable portion of the population in order
to determine parameters of the whole population (Jonker and Pennink 2010; Bhattacherjee 2012).
Sampling is the selection of some of the elements in the population from which to draw conclusions about
the entire population (Adams et al., 2007; Salaria, 2012). A sample design is a procedure used by the
researcher to obtain the sample from the population (Adams et al., 2007). It includes details of the
sampling unit, sample size and sampling techniques. The rationale behind sampling include, according to
Adams et al. (2007):
Cost minimisation
Speed
Practicality and Feasibility
Higher Data Quality
Public Acceptability
However, sampling has such challenges as
Variance and Bias - Sampling Bias and Non-response Bias
Imperfect Coverage
To minimise the impact of the limitations of sampling the researcher strived to contact more than 50% of
the food processing companies in Zimbabwe. That is nine companies out of an estimation of 14 viable
and operational food processing companies in Zimbabwe.
Sample Unit
The sampling unit refers to a single aspect or group of aspects subject to inclusion in the sample (Adams
et al., 2007). In this study, the sample unit was an individual employee in the food processing industry. In
particular, the sample unit covered managers, administrators, engineers, scientists and technicians in the
food processing sectors in Zimbabwe. These were taken as the relevant target respondents since they are
rich in the organisational information with regards to information on technopreneurship. The sample unit
is further described under sample size and in section 5.11 of this chapter, that is, under inclusive/exclusive
criteria.
Page 95
Sampling techniques
Sampling techniques/approaches can be sub-divided into two categories, which are probability/random
sampling and non-probability/non-random sampling (Adams et al., 2007).
Probability sampling procedure
Probability sampling is an approach in which every element in the universe has a known chance of being
chosen in the sample of which can be determined accurately (Bhattacherjee, 2012). The sampling
procedures can be utilised where there is a sampling frame. A sampling frame is a completely documented
list of all units in the target population from which the sample is to be drawn (Saunders et al., 2007; Adams
et al., 2007). In this probability sampling techniques were not utilised.
Non-probability sampling procedure
Bhattacherjee (2012) view non-probability sampling as a sampling procedure in which some elements of
the population have no chance of being chosen or where the probability of their selection may not be
accurately determined. The selection of elements is based on assumptions regarding the population of
interest, which forms the criteria for selection. Sample units are chosen based on non-random criteria such
as the researcher’s judgement, convenience, referrals or willingness to participate (Saunders et al.,
2015).The researcher used non-random sampling procedures owing to lack of a sampling frame and the
need for gatekeeper’s consent and respondents’ consent as an ethical requirement.
The researcher had to involve companies that showed consent through their gatekeepers and employees
that also showed consent of which the process could not be probabilistic. This study adopted non-random
sampling techniques since the chance of selection of sample units to the sample was not known (Adams
et al., 2007). In this study, the researcher established that food processing companies could not all be
found in some database hence the rationale behind using non-random sampling.Non-random sampling
techniques are sub-divided into five types, which are, convenience sampling, purposive / judgemental
sampling, self-selection, snowball sampling and quota sampling (Saunders et al., 2007). Literature could
add more or have different nomenclature.
Purposive Sampling
Purposive sampling also known as judgemental sampling enables the researcher to use own judgement to
select sample units that best meet the criteria so as to gather data to satisfy the objectives of the research
(Saunders et al., 2007). Important features are the researcher’s judgement, criteria and research purpose.
It is also seen as a non-probability sampling procedure that conforms to some criteria (Adams et al., 2007).
In this instance, the issue of conformance and criteria are important elements of the definition.
Furthermore, Cohen et al. (2007:114-115) expressed that: “In purposive sampling, often (but by no means
exclusively) a feature of qualitative research, researchers handpick the cases to be included in the sample

Page 96
on the basis of their judgementof their typicality or possession of the particular characteristics being
sought.”
Cohen et al. (2007) confirm that in most cases, purposive sampling is used to contact knowledgeable
people. In this case, the researcher wanted to access knowledgeable employees in the food processing
companies. The technique became suitable since the researcher wanted to select employees who could
provide the desired information that could be obtainable from managers, administrators, engineers,
technicians and scientists. Such employees were assumed to be rich in the desired information about the
food processing companies. Thus, those who did not meet these criteria would not provide the desired
information and could not be respondents of the questionnaire.
Quota Sampling
Adams et al. (2007) indicated that purposive sampling covers two types of sampling, namely judgement
sampling and quota sampling. Judgement sampling has been defined and presented how it was used. Quota
sampling is defined as where the researcher seeks to have more of the groups not represented in the total
sample (Adams et al., 2007). Quota sampling was used at company level selection. In this case, as many
food processing companies as possible were required to be substantially represented in the final sample.
The researcher continuously sought gatekeepers’ consent so as to increase the number of participating
food processing companies. This was used to reduce bias against companies not represented in the final
sample (Adams et al., 2007).
Sample Size
The issue of sample size has no clear-cut answer since the correct sample size depends on the purpose of
the research and the nature of the population under study (Cohen et al., 2007; Adams et al., 2007).
However, Bartlett and I (2001:43) indicated that “a common goal of survey research is to collect data
representative of a population since the researcher uses information gathered from the survey to generalise
findings from a drawn sample back to a population, within the limits of random error”. For the sample
size to be representative, it could be statistically tested. The sample size was not statistically determined
but Table 5.1 was used to guide the determination of an optimum sample size. However, the collected
data was quantitatively analysed. Quantitative analysis of data assists the generalisation of sample
statistics to population parameters (Creswell 2009; Bartlett et al., 2001).
There are statistical tables like Table 5.1 which can be used to select appropriate sample sizes for a
research problem from a population depending on alpha level and a set error rate (Bartlett et al., 2001).
According to Kazemi et al. (2007), the general guiding principle for determining a suitable sample is that
a 5% level of significance (alpha level of 0.05) is satisfactory for most survey research. “For most
statistical analysis, α is set to 0.05” (Bhattacherjee, 2012:125).

Page 97
Bartlett et al. (2001) indicate that at a 10% level of significance (alpha = 0.10)or more may be suitable if
the survey is mostly after determining insignificant differences, associations or other statistical phenomena
as antecedent to further research; while 1% level of significance (alpha = 0.01) may suit situations where
the survey results are critical and errors may have substantial cost implications (Bartlett et al., 2001).
Using Table 5.1, the population of employees of food processing companies who meet the criteria is
around 10 000. As a result, a sample of at least 119 respondents from at least 50% of the food processing
companies would be significant and representative of the population.
Table 5.1: Table for determining minimum returned sample size for a given population size for continuous
and categorical data
Sample size
Continuous data
(margin of error=.03)
Categorical data
(margin of error=.05)
Population
size
Alpha = .10,
t=1.65
alpha = .05,
t= 1.96
alpha = .01,
t= 2.58
alpha = .50,
t=1.65
alpha = .50,
t= 1.96
alpha =.05,
t=2.58
100 46 55 68 74 80 87
200 59 75 102 116 132 154
300 65 85 123 143 169 207
400 69 92 137 162 196 250
500 72 96 147 176 218 286
600 73 100 155 187 235 316
700 75 102 161 196 249 341
800 76 104 166 203 260 363
900 76 105 170 209 270 382
1,000 77 106 173 213 278 399
1,500 79 110 183 230 306 461
2,000 83 112 189 239 232 499
4,000 83 119 198 254 351 570
6,000 83 119 209 259 362 598
8,000 83 119 209 262 367 613
10,000 83 119 209 264 370 623
NOTE: The margins of error used in the table were .03 for continuous data and .05 for categorical data. Researchers
may use this table if the margin of error shown is appropriate for their study. However, the appropriate sample size
must be calculated if these error values are not appropriate.
Source: Bartlett and Ik (2001)

Page 98
The sample size had to be determined at two levels; that is the company level and employee level. At the
company level, there was no sampling frame from which the sample could be drawn (Adams et al., 2007).
The registrar of companies had no list of food processing companies since most of them were no longer
operational because of the economic meltdown. The researcher used product packages at retail stores to
identify operational companies in Zimbabwe and identified 14.The researcher managed to reach nine
companies using mainly quota sampling.
Also, participants in the study, who were employees of the cooperating companies, were non-randomly
selected through judgemental sampling and only those who cooperated participated in this study. Eriksson
and Kovalainen (2008) indicate challenges like access to companies and cooperation from respondents,
as well as how to deal with these as a researcher are important aspects to consider when the sample size
is determined. The challenges were anticipated and measures were taken to minimise the effect of this on
the study. Measures taken to enhance respondent cooperation were such as identifying influential people
within the organisations and use them as contact persons in advance beforehand delivery of the
questionnaire. In additions, appointments could be sought with gatekeepers to negotiate access. However
appointments could hardly be secured and negotiations could also be hardly entertained as the gatekeepers
could pretend to be very busy. The original intention was to identify qualified employees per company
and get a representative sample of at least 10% that could amount to 20 respondents per company.
However because of field challenges this was not achievable. A total of 147 participants from nine food
processing companies were obtained as shown in Table 5.2.
Table 5.2: Sample size
Target Respondents Number of
Organisations
Sample Unit Actual
Sample Size
Food processing sector in
Zimbabwe 9
Managers, Scientists,
Administrators, Engineers,
Technologists
147
At the organisational level, nine out of an approximate population of 15 companies constituting 60% of
the population can be said to be representative although some of the companies had a low response rate.
5.11 Inclusive/exclusive criteria
The concepts of inclusion/exclusion criteria are often most applicable to experimental designs (Tuszynski
et al., 2007). They refer to the specifications made by the researcher that define inclusion and exclusion
qualifications for participants to achieve the objectives of the study (Tuszynski et al., 2007). Inclusion
Page 99
criteria are specific attributes that the prospective subjects must possess for them to be considered in the
study while exclusion criteria are those specific attributes that disqualify prospective subjects from being
considered in the study (Wilmot, 2005). In this study, the inclusion/exclusion criteria included such
characteristics as company sector, job position, educational qualification and cooperation. These can
further be explained as follows:
Company Sector
The study focused on the food processing sector in Zimbabwe only. The organisations in the food
processing sector are the subjects of this study. Industrial food processing in Zimbabwean organisations
is either 100% or less; that is, some manufacturing companies apart from industrial food processing are
engaged in the manufacturing of other consumer or commercial products like cosmetics, sanitary products
and stock feeds as well as retailing. All organisations doing industrial food processing to some extent were
to be included as subjects of the study.
Job Position
To be able to achieve the objectives of the study, the researcher had to reach the correct organisations and
then contact the right people within the organisations. One of the criteria for the right people within the
right organisation was their job position. Questionnaires were distributed to employees who could fit in
the following categories: top management, middle management, first line managers, scientists, engineers
and technicians. People occupying such positions were taken to possess the level of information about the
organisation as sought by the questionnaire. People occupying lower positions may lack the information
about the organisation sought by the questionnaire. In most cases people occupying lower positions in the
Zimbabwean manufacturing industry are unskilled and tend to lack technopreneurial knowledge.
However, this criterion has weaknesses in that terms used for job positions in different organisations vary
regarding nomenclature.
Educational Qualifications
This criterion held that if someone has, at least, a diploma in an area of specialisation they could be
respondents. A minimum of a diploma ensures that the person is literate enough to answer the
questionnaire and has enough content to appreciate the issues within the questions. It was assumed that
someone with a lower qualification may not understand the subject matter of the enquiry.
Technopreneurial issues in the questionnaire covered both strategic and operational questions. Those
without at least a diploma could hardly attend to questions seeking responses with regards to strategic
issues.

Page 100
Cooperation
Apart from the above criteria, there was a need to consider cooperation from the respondents. In fact,
consent can be and was taken as one of the inclusion/exclusion criteria (Chandrika and Vasudha,
2010).The organisation could be in the food processing sector with people of the correct level and
qualifications, but if they were not willing to participate in the study, they were excluded. However, the
researcher did his best to persuade the organisations and their employees to take part in the study and it
was donewithin the ethical considerations of the study.
5.12 Data collection instruments
Surveys involve collecting data through asking questions. In this study, a questionnaire was chosen to be
the questioning method (research instrument). According to Jonker and Pennink (2010), a questionnaire
is a widely applicable instrument of gathering data through surveys, experiments, field research or even
any other modes of observation.
Stone (1993) holds that a questionnaire should be: unbiased, intelligible, appropriate, unambiguous,
omnicompetent, appropriately coded, ethical and piloted. To achieve such criteria, Stone (1993) suggested
a process that could be followed in designing a questionnaire:
1. Decide what data you need.
2. Select items for inclusion.
3. Design the individual questions.
4. Compose the wording.
5. Design the layout and presentation.
6. Think about coding.
7. Prepare the first draft and pretest.
8. The pilot and evaluate the form.
9. Perform the survey.
The process was also used in this study and this will be explained by focusing on the following
specifically: the questionnaire, measurement scales, types of questions and question arrangements.
Questionnaire
A questionnaire is a document containing questions and accompanying relevant information for the
respondent and is systematically designed to solicit appropriate information from the respondent to satisfy
the research objectives (Jonker and Pennink, 2010). Essentials of this definition include the issue of

Page 101
questions and accompanying information for the respondent. The accompanying information (see
Appendix 1) included:
The introductory letter introducing the research study, researcher, institution and the supervisor with
contact details for transparency purposes.
The informed consent letter for the respondent to complete and endorse as evidence that the
respondent was free to participate or not to participate; participation or no participation had no
negative repercussion to the individual.
On the questionnaire, instructions were included to guide the respondent as to the required action.
Lastly, the definition for technopreneurship was included to contextualise the subject matter.
Types of Questions
Questions to be included in a questionnaire can be classified into open-ended questions (unstructured
questions) and closed-ended questions (structured questions) (Shukla, 2008). Open-ended questions are
those in which respondents are requested to describe issues in their words or write their views and feelings
(Adams et al., 2007). Such questions are often used for qualitative studies. Adams et al. (2007) assert that
in open questions responses are given in the form of textual statements and hence the following challenges
arise:
How to analyse the answers is both time consuming and difficult, especially if the respondents deviate
from the question or misinterpret it
Some respondents are wary of open questions as they find writing prose difficult or get concerned
about grammar or spelling
The researcher did not use open-ended questions in the questionnaire for this study. Open-ended questions
would bring in the issue of qualitative data analysis thatwas not originally intended. Numerical data is
easier to handle and analyse that words and statements
Closed-ended questions also known as closed questions or forced-choice questions as it providesa number
of optional answers from which respondents are instructed to choose (Saunders et al., 2007). Closed-ended
questions were used in this study.
Adams et al. (2007:132) summarise the advantages and disadvantages of closed ended questions as:
Advantages
Easy to process answers
Enhances comparability between cases
Clarify meaning to the respondent
Completion is easier
Reduces variability in analyst’s interpretation

Page 102
Disadvantages
Loss of spontaneity of respondent
Difficult to make forced choice answers or mutually exclusive responses
Difficult to make forced choice answers or exhaustive responses
Can be irritating
Makes questionnaire long
Wide variation by respondents in the interpretation of forced choice answers
To deal with the shortcoming of close-ended questions, the researcher resorted to the use of five-point
Likert scales that accommodate most possible alternative responses. In other instances that did not use
Likert scales, the alternative response ‘any other’ was used.
There are three types of closed-ended questions namely: dichotomous questions, multiple choice questions
and scale questions (Shukla, 2008). Dichotomous questions are closed-ended questions that give
respondents a choice of two alternative responses (Saunders et al., 2007). The type of question was used
to solicit for the gender of each respondent. It is some form of a nominal scale which only was meant to
identify the respondent regarding either male or female (Question 5.4 on the questionnaire). Multiple
choice questions are closed-ended questions that give respondents more than two choices of alternative
answers that are discrete/free from overlaps and mutually exclusive (Cohen et al., 2007). Such questions
are also nominal scales or ordinal scale. In the questionnaire questions thatwere nominal scales were:
question 5.1, 5.2 and 5.3. Question 5.5 is a typical multiple choice question that is an ordinal scale. Scale
questions or rating scales are multiple choice questions that give respondents three or more alternative
answers that rate a variable (Shukla 2008; Cohen et al., 2007). Scaled questions are examples of ordinal
scales. The questions can be categorised as Likert scales, semantic differential scales, Thurstone scales
and Guttman scaling (in Cohen et al., 2007). The questionnaire of the study was mainly five-pointLikert
scales. The latter has merits of being accommodative and exhaustive regarding responses and are easy to
analyse through SPSS version17.
Content of questions
According to Shukla (2008), the content of each question is determined by such elements as the wording,
the order of the words and tense. To decide on what data was required the researcher used the research
objectives and reviewed literature and research methodology to generate possible questions. The activity
also worked as a criterion to determine what items were to be covered by the questionnaire. Also, it
functioned as questionnaire validation since the questionnaire was being alignedwith the research
objectives. Saunders et al. (2007) assert that internal validity in questionnaire design refers to the ability
of the questionnaire to measure what it is intended to measure. Individual questions were crafted and each

Page 103
aligned with a specific objective. In principle, to design the questions the researcher formulated questions
that measured the adoption of technopreneurship at each of the companies (respondents) and then went
on to find out what factors were present at these companies. The aspects of innovativeness of the company
and entrepreneurship management were of the essence in the questions. Thus, the researcher wanted to
find out what was happening in reality.
According to Shukla (2008), questionnaire content challenges can be dealt with by avoiding common
content errors which include:
Use of jargon and ‘big’ words
Ambiguous words
Leading questions
Implicit words
Generalisations
Double barreled questions
Difficult or taxing questions
The challenges were anticipated and a pilot test was used to minimise these challenges. The details of the
pilot test are covered under questionnaire pilot test. The other issues of question content such as the order
of words and tense were dealt with using technical guidance from the statistician as well as the comments
from the supervisor.
Administering the questionnaire
Questionnaire administration answers the questions of who should complete the questionnaire and how
should the questionnaire be completed). According to Cohen et al. (2007), a questionnaire can be
administered either by self-administration; post; face-to-face interview; telephone or the internet. The self-
administered questionnaire was completed at the workplace of the respondent.
Question order, layout and order
According to Shukla (2008), a questionnaire can be subdivided into three parts that is the opening
questions, the generic questions and the specific questions. The questionnaire was presented by starting
with opening questions that focused on the role of technopreneurship. The questions were structured in a
way that aroused the respondent’s interest. The next section consisted of specific questions that attended
to the major research objectives (Shukla 2008). The questions focused on factors influencing
technopreneurship; feasibility of technopreneurship and critical success factor of technopreneurship.
These questions aimed to find answers to the research objectives. The last part of the questionnaire focused

Page 104
on generic questions that can also be termed demographic questions. In the Zimbabwean society, most of
the demographic data like gender, the level of education, the department at work, the position at work, are
considered sensitive. As a result, to avoid possible distortions, the questions seeking this information were
placed towards the end of the questionnaire. Shukla (2008) confirms that most researchers agree on the
layout and the formulation of the opening questions, then with the specific questions and ending with the
classification and identification questions.
Measurement scales
Shukla (2008) view a questionnaire as a formal document of questions consisting of at least one
measurement scale designed to collect particular primary data. The major element of interest in the
definition has to do with measurement scales. A scale may be viewed as a measuring instrument for
suitable quantification of variables (Adams et al., 2007). Measurement scales vary regarding their
fundamental properties to include: nominal scale – assignment property; ordinal scale – order property;
interval scale – distance property and ration scale – origin properties (Shukla, 2008). The measurement
scales have implications to the type of data or information they provide and the type of questions to be
asked. The measurement scales were all used each on the relevant situation and circumstances.
Likert scale
The questionnaire used in this study did not have other types of scaled questions but only utilised Likert
scales that are mainly ordinal scales. A Likert scale (from Rensis Likert, 1932) provides several alternative
responses to the respondent rating a variable ranging from one extreme to another (Cohen et al., 2007).
Likert scales vary from a three-point scale (three alternative answers) to as far as ten-point rating scale
(ten alternative answers). The principle is that the middle point is neutral in the case of an odd number
rating scale. A commonly used rating scale is a five-point Likert scale (Cohen et al. 2007; Shukla, 2008).
The Likert scales were presented in the form of a grid or matrix so as to enable recording of responses of
two or more similar questions (Saunders et al., 2007).
Kothari (2009:86) outlines the advantages of Likert scales as:
It is relatively easy to construct the Likert-type scale in comparison to Thurstone-type scales because
the Likert-type scale can be performed without a panel of judges.
More reliable because it also provides more information and data than does the Thurstone-type scale.
Permitting the use of statements that are not manifestly related (to have a direct relationship) to the
attitude being studied.
Easy to use in respondent-centered and stimulus-centered studies.
Less time consuming to construct and is frequently used by the students of opinion research.
Being reported in various research studies that there is a high degree of correlation between Likert-
type scale and Thurstone-type scale.
Page 105
Furthermore, Kothari (2009) indicates the disadvantages of Likert scales as:
Not giving the interval between two consecutive alternative responses.
Responses may lack validity since explanations to qualify the responses are not possible.
To limit the effect of such limitations, the researcher used the proper wording of statements on the scale
and tested for relationships between different statements on the Likert scale and other questions.
The Likert scale was used in the form of importance and agreement scales. On the questionnaire, question
1 and 3 were grids of importance scales while question 2and 4 were grids of agreement scale. Final
questions were mainly multiple-choice questions in the form of five-point importance scales and
agreement scales. Importance scales employed five-point alternative responses from ‘not at all important
to extremely important. The possible responses were coded as 1 representsnot at all important, 2
representsnot really important, 3 represents neutral, 4 represents important and 5 represents extremely
important. Questions were numbered continuously using multi-level lists. That is, question 1 had 1.1 to
1.3, and question 2 had 2.1 to 2.20 and so on. Possible responses were then coded using ordinal numbers
to facilitate data capturing and analysis. Agreement scale questions had five possible responses to each
statement where1representsstrongly agree, 2 represents agree, 3 represents not sure, 4 represents disagree,
and lastly 5 represents strongly disagree. For objective number four, a five-point importance scale was
designed which ranged from, ‘definitely yes’ to ‘no, not at all’. The possible responses were then coded
as, 1 represents definitely yes; 2 represents yes, to some extent; 3 represents neutral; 4 represents no, not
really; 5 represents no not at all. Likert scales are easy to develop and understand, as well as making data
analysis through statistical packages such as MS Excel and SPSS easy.
According to Shukla (2008:81), a robust and appropriate measurement scale can be developed to measure
a phenomenon but errors in measurement should always be anticipated and their impact minimised. Errors
in measurement happen because of the following reasons:
Respondent error – respondent characteristics such as intelligence and education can affect the test
score.
Short-term personal factors – such as fatigue, stress and anxiety.
Situational factors – such as noise in the surroundings and presence of other people.
Clarity errors – such as poor framing of questions and scale.
Mechanical errors – such as poor printing, recording the error and poor design.
Analysis error – inappropriate methods of analysis used.

Page 106
The cited causes of errors seem to be affecting the validity of the research results. To deal with the
respondent error, the researcher stipulated who can participate in the study using inclusion / exclusion
criteria. Control questions were used in the questionnaire, such as job position. Positions that did not meet
the criteria were eliminated. The major uncounted error in this study had to do with short-term personal
factors. The target population had low morale due to economic and political circumstances and situations
that placed their employment at risk as outlined in chapter 2. There was the threat of further massive
retrenchment without terminal benefits because of a 17 September 2015 Zimbabwe Supreme Court Ruling
(The Citizen 2015) which saw about 30000 employees retrenched with a three month notice period without
terminal benefits (Martel 2015). According to the Citizen (2015) (online):
“The current dismissals follow a wave of job losses in the last few years, which have reportedly seen more
than 4 610 companies filing for liquidation or closing shop. Zimbabwe’s finance minister Patrick
Chinamasa said in a mid-term monetary policy statement last year that the closure of companies had
resulted in more than 55 443 people losing their jobs.”
This led to a depressed workforce, who could hardly give attention to a questionnaire that seemed not to
attend to their personal and current problems. The challenge was dealt with by identifying influential
people within each organisation and used them as contact persons who would assist to distribute and
collect the questionnaire. Clarity errors, analysis errors and mechanical errors were minimised by
employing a specialised statistician who assisted in the designing of the questionnaire as well as the
analysis of the gathered data.
5.13 Data collection process: fieldwork
Barkhuus and Brown (2012) assert that fieldwork poses some problems that are beyond the researcher’s
control, but which the researcher encounters and has to be resolved.Data collection refers to the process
of gathering the facts and figures on variables of interest, according to the preplanned procedure that
enables the researcher to achieve the research objectives. Adams et al. (2007) look at data collection as
the actual implementation of the research methods; in this case, the survey.
It should simply be taken as the research stage during which the researcher gets into the field to gather
data specified by the research plan. In other words, it is the implementation stage of the research plan.
Self- administered questionnaires were hand-delivered at workplaces and respondents could complete it
in their own time. Follow-ups through calling at different times of day as well as on different days every
week were made to remind the respondents were necessary (Saunders et al., 2007).A collection of data
was donefor three months– March, April and May 2015. The research sought and identified a contact
person in each organisation who were responsible for the distribution and collection of the questionnaires.
Page 107
The risk of manipulating people by the contact person was minimised by working closely with the contact
person. Some of the answered questionnaires were obtained as hard copies while others were returned as
soft copies.
Data collection proved to be one of the challenging research activities. High costs were involved from
travelling, telephoning and reprography. It called for a lot of patience since employees in the industry are
often very busy and could hardly give researchers enough attention. There was low morale in the
Zimbabwean industry since almost everyone was not motivated because of low income and at times going
for months without salaries. Furthermore, industrial workers were uncertain of their future since most
manufacturers were closing. Lastly, some respondents did not understand the purpose of the contributed
information. As a result, those who did not understand the purpose did not complete the questionnaire.
There is a hostile relationship between universities and industries in Zimbabwe as previously indicated
and this point to a lack of knowledge management in the nation. However, the 98% literacy rate makes
Zimbabwe a researchable area since the people have information that could be interrupted by the political
situation.
5.14 Data management
According to the Pennsylvania State University Libraries (PSUL) (2015) data management involves
controlling the information produced during a research project. That is control of research data is
considered from the source, preparation, capturing, processing and safekeeping. In other words, there is a
need for control regarding accessibility, integrity, and timeliness to meet the needs of data users. PSUL
(2015) asserts that data management approach depends on the type of data, data collection and storage
procedures and intended usage, that is, it encompasses data description, access and sharing; storage and
back-up, archiving and preservation; intellectual property rights. To facilitate proper data management,
the researcher, through the guidance of a statistician, used two data management software programmes,
that is, MS Excel and Statistical Package for Social Scientists (SPSS).

Page 108
Data management software packages
For the purpose of this study, the researcher used MS Excel and SPSS to facilitate data management. Bella
(2013) compared the computer software packages in Table 5.3 which assisted in the choice of the
packages.
Microsoft Excel
According to Businessdictionary.com (2015) (online) MSExcel “allows users to organise, format, and
calculate data with formulas using a spreadsheet system broken up by rows and columns.” The important
aspects of the definition include such aspects as organising, formatting and calculation of data as well as
the aspect of the spreadsheet and formulas features. They point to the merits and demerits of MS Excel.
According toMS Excel Online (2009) the advantages and disadvantages of Excel are:
Merits
1. Easy connection to Online Analytical Processing (OLAP).
2. Can be secured with a password.
3. It can manipulate figures, prepare reports and word-process.
4. It can be sent through emails and can be viewed by most smart phones which make it more
convenient.
5. It is part of the Microsoft Office package.
6. An All in One Program.
7. Availability of Training Programs and Training Courses.
Table 5.3: Comparison of MS Excel, SPSS and SAS
Criteria Excel SPSS SSAS
Maximum number
of rows
Approx 1.048
million
Approx. 2.15
billion
Approx. 2.15
billion
Maximum number
of columns 16,383 32,767 32,767
Price Cheap Expensive More expensive
than SPSS
License Perpetual Perpetual Year on year
General Use Easy to learn and
use
Easy to learn and
use
Hard to learn and
use
Typical user Non programmer Non programmer Programmer
Statistical Analysis Very limited Advanced
Analysis
Advanced
Analysis

Page 109
Data Manipulation Ok Powerful Very Powerful
Macro
Programming Powerful (VBA) Ok Very Powerful
Documentation
(Help Guide) Ok Excellent Good
Popularity Most widely used
tool
Popular in market
research field
Popular in data
mining and
business modelling
Source: Bella (2013)
Demerits
1. Viruses can attack it.
2. It does not readily execute the one sample t-test.
3. It is slow in execution.
4. It can easily lose data.
5. It can be difficult to use if not trained.
6. It has limited space.
However from the above points, it can be appreciated that the merits outweigh the demerits given the
situation and circumstances of this study.
During this study, after successfully designing the questionnaire with the aid of the professional
statistician, the statistician recommended a MS Excel template to the researcher for data imputation. The
template included all the questions and their alternative answers and data codes. That is all the answered
questionnaires were captured on MS Excel after validation and numbering the questionnaires as they were
being returned from the food processing companies. The other strength was that data in MS Excel can be
exported to, or shared with, other packages like the Statistical Package for Social Sciences (SPSS) for
further analyses.
Data coding
According to Bhattacherjee (2012), data coding is the process of adapting data into a numeric format. In
this study data codes were created and placed on the template as a key for all questions to guide the
imputation process. Since most questions were based on the five-point Likert scales, codes were assigned
to each alternative answer that were 1 for Not at all important; 2 for Not that important; 3 for undecided;
4for important and 5 for very important. The codes could fit questions 1.1 to 1.3 as well as questions 3.1
to question 3.19. Furthermore numerical codes of 1, 2, 3, 4 and 5 were assigned to the agreement scales

Page 110
of questions 2.1 to 2.20 as follows: 1 for Strongly agree; 2 for Agree; 3 for Not sure; 4 for Disagree and
lastly 5 for Strongly disagree (Bhattacherjee, 2012). Also numerical codes ranging from 1 to 5 were given
to variable of questions4.1 to 6.6 as follows: 1 for Definitely yes; 2 for Yes, to some extent; 3 for Neutral;
4 for No, not really and lastly 5 for No, not at all. Other questions were given numeric codes. Numerical
codes of 1, 2, 3 and 4 were assigned to question 5.1 as follows: 1 for engineering only; 2 for Business
only; 3 for both engineering and business and lastly 4 for other (Which was to be specified). Question 5.4
variables were also assigned numerical data codes as 1 for Male and 2 for Female. Question 5.5 was also
given numerical data codes as follows: 1 for O-level; 2 for Certificate; 3 for Diploma; 4 for the degree; 5
for Honours; 6 for Masters and 7 for Ph.D.
Question 5.2 and 5.3 were modified and responses classified into categorical responses that are converting
the answers from qualitative to quantitative. This was done as follows:
Positions were classified to for categories as either Top management; Middle management, First-line
management or Non-managerial. Numerical codes were then assigned as follows: 1 for Top management;
2 for Middle management; 3 for First-line management and 4 for the Non-managerial position.
Departments were classified into three categories as engineering, administrative or support services.
Numerical data codes were then assigned as 1 for Engineering; 2 for Administrative and 3 for Support
services. During capturing, any question that was not attended to either by error or omission by the
respondent would warrant that the cell is left blank. Thus, the MS Excel system recognised it also as not
answered and automatically adjusted the actual sample size for the particular question accordingly.
Statistical Package for Social Sciences (SPSS)
According to Bella (2012), SPSS is a software package employed to conduct statistical analyses, data
manipulation, and generation of tables and graphs that compress raw facts and figures. In other words,
SPSS can calculate and present descriptive statistics that include averages and frequencies and advanced
inferential statistics including regression models, variance analysis and factor analysis.
Stumm (2011) outlined capabilities and limitations for using SPSS to study individual differences in
psychology as:
Capabilities
Screen data for frequencies and errors; check labels and missing data codes.
Latent traits of crystallised and fluid intelligence (each derived from three indicator variables/
observed test scores).
Build composite scores from z-scores.

Page 111
The composite score for Need for Cognition and Internal Consistency.
Correlations and regression models.
The research theory used to inform this study was classified into two; that is, the research philosophy and
the research design. These were taken to guide the courses of action taken by the researcher to
scientifically find answers to the research questions. Thus, the relationships between phenomena are
explained by science that leads to the development of a theorythat in turn informs future decision makers.
While the scientific approach can be viewed as either inductive or deductive, this study took the deductive
reasoning, or deduction (Adams et al., 2007). It started out with general statements and endeavoured to
reach a specific and logical conclusion. The scientific approach used deduction to review the general
concepts to reach the conclusion.
To fulfil the objectives of the study, the researcher modified Saunders et al. (2007) research onion and
came up with a research onion suitable for the study as shown in Figure 5.2.
Limitations
Does not support Structural Equation Modelling (by and large, an extension method of regression
models based on covariance matrix).
Does not allow for simultaneous estimation of regression parameters and associations between
independent (predictor) variables.
Does not provide model fit indices to evaluate how well data is represented.
Does not allow including latent traits without building composite scores or extracting factor regression
scores
After capturing, the hard copies of the answered questionnaires were kept in a locker to allow electronic
data processing to progress to the end before they were destroyed. The MS Excel file was kept as a soft
copy also to allow progress with data presentation and analysis up to the end. The data was then transferred
to a compact disc that is secured in a lockable cabinet until the data use could be completed for 5 years.
5.15 Data analysis
Cooper and Schindler (2001) look at data analysis as involving editing and reducing collected facts and
figures to a manageable size; summarising, looking for patterns, and application of statistical techniques.
The essentials of the definition can be observed as:
Data editing
Data reduction
Data summaries

Page 112
Determining data patterns
Application of statistical techniques
Data analysis is viewed therefore as a process involving all the five phases. On the other hand, Jonker and
Pennink (2010) define data analysis as composed of three synchronised flows of activity:
Data reduction
Data display
Conclusion drawing/verification
Figure 5.3: Data analysis decision tree
Source: Own Compilation
Saunders et al. (2007) hold that data analysis for quantitative data involves preparation, the input of the
data into the computer and cross-checking the data. The major decisions are:
Choice of the most appropriate ways of data presentation: tabulation and diagrammatic presentation
Decide on descriptive statistics to explore the data
Choosing the most appropriate inferential statistics to examine relevant relationships among the
variables
In making such decisions in quantitative data analysis, Saunders et al. (2007) recommend that the
researcher considers the following items:
Data Collected from the Sample
Establishing the
significance of
responses
One Sample t-
test
Report
significant mean
scores
Spearman’s
correlation
analysis
Chi-Squared
test
Report on
significant
Association
s
Report on the
reliability of
factors
Report significant
correlation
coefficient
Testing for
associations
Testing for reliability
Cronbach’s
alpha coefficient

Page 113
Type of data regarding the level of numerical measurement
The data format in which there are input to the analysis software
The impact of data coding for different data types on subsequent analyses
Need to assign weight
Methods of data error checks
For the purpose of this study, a combination of the two definitions was utilised as data analysis activity of
the research process.To enhance the process of data analysis, the researcher employed the computer
software packages MS Excel and SPSS as described under data management. Figure 5.3 summarises the
data analysis techniques adopted to analyse the collected data. These are explained in the data analysis
process in this section.
Data validation/ editing
In this study, “Data validation is the process of ensuring that data to be processed is correct, free of
unnecessary or unwanted data, and typically involves testing against a list of valid items or algorithms”
(Jenks et al., 2015). On the other hand, De Waal et al. (2011) define statistical data editing as the process
of enhancing the quality of collected data by manually or automatically detecting and correcting data
errors. Data errors and missing data can arise because perhaps the respondent is not willing or does not
know how to respond to the particular question and, as a result, leave blank spaces on the questionnaire
(De Waal et al., 2011). This was a common occurrence in the study and necessitated both manual and
automatically editing the data. Manual data editing is done by the researcher or other assistants during or
after imputation. In this study during imputation, the researcher had to leave questions with no responses
blank. These are ignorable data errors that had no significant increase in the standard error of parameter
estimates and no significant reduction in the sample size (De Waal et al., 2011). Automatic data editing
was affected as the computer automatically reduced the effective sample size and increased standard error
of parameter estimates for the particular question that had a non-response.
De Waal et al. (2011) indicate that a surveyor anticipates the occurrences of non-responses by
oversampling and moreover the losses of precision can be qualified when standard error is estimated. In
this study, a sample of 119 respondents was statistically determined at 5% level of significance
(alpha = 0.05) (Bartlett et al., 2001). The effective sample size was 147 and could be slightly reduced
because of non-response and because of oversampling; the results remained statistically valid.
Data reduction
Data reduction can be defined as the process of selection, simplification, summarising, and transformation
of data that appear as raw facts and figures (Jonker and Pennink, 2010).On the other hand, Jonker and
Pennink (2010) explain data reduction as the questioning or interrogation of the meanings or categories

Page 114
that have been assigned to the data, that is, looking at alternative ways of viewing the data. This is the
process that involves selection and abstraction from raw facts and figures to written data. In this study,
the reduction could be done after the data was displayed and analysed. Insignificant responses were not
reported on and reporting concentrated on significant responses.
Data tabulation
According to Kothari (2009), tabulation refers to the procedure of summarising raw facts and figures and
displaying them in the compact structure for further analysis. Tables are extremely helpful data summary
and display tools (Adams et al., 2007). Adams et al. (2007:184) outline 10 guidelines for the production
of tables as:
1. The table must have a clear purpose.
2. The table must have an explanatory title.
3. The table must clearly indicate the units of measurement of the data.
4. The table should clearly indicate the source of the data.
5. Lines should be drawn where appropriate to draw attention.
6. Row and column totals should be shown where meaningful.
7. Percentages and ratios should be computed if appropriate.
8. Do not present too many significant digits.
9. It is easier to look down a column of numbers than across a row.
10. Give attention to the spacing and layout of the table.
Data tabulation is the initial display and summarisation of captured data. The major type of table
commonly used is the frequency distribution table. According to Bhattacherjee (2012), a frequency
distribution summarises a variable through the display of the frequency (or percentages) of each value or
range of values for the variable. Adams et al. (2007) look at a frequency as the number of occurrence of
each class in a certain variable or the tally of each category for a particular variable that can be expressed
in as an absolute figure; percentage measure or cumulative percentage figure. Frequency distribution
tables can be bivariate– displaying one variable values; or multivariate – displaying more than one variable
values. The researcher took advantage of the questionnaire design which presented questions in a grid
form (Saunders et al., 2007). Thus, the system could easily convert these to display frequency of responses
in a table showing one variable or more. Apart from the five possible responses for a Likert scale, one
more possible response was added to the tables, that is the non-response row; being the bottom row. In
other words, the total frequency always added to the total possible sample of 147 for absolute frequency
and 100% for percentage frequency.

Page 115
Tables are a simple and fundamental summaries of data and readers and analysts can make some
observations by merely looking at the table especially based on percentages. Kothari (2009:127) outlines
reasons of using tables as:
It conserves space and reduces the explanatory and descriptive statement to a minimum.
It facilitates the process of comparison.
It facilitates the summation of items and the detection of errors and omissions.
It provides a basis for various statistical computations.
However, tables may not be conclusive on their own but are enhanced by graphical presentations and
statistical calculations.
Graphical presentations
From the tables, statisticians extend data presentations to graphs and charts. Adams et al. (2007) assert
that charts and graphs are very helpful in explaining difficult concepts and however, they need to be clearly
titled, explained and discussed in the text. To help the researcher to omprehend the biggerdata picture,
graphs were utilised to aid in the presentation of data in chapter 6.
Statistical analysis
Kothari (2009) views statistical analysis as the process of computing certain indices or measures and
searching for a pattern of relationships that exist among the groups of data. In this case thus it “involves
estimating the values of unknown parameters of the population and testing of hypotheses for drawing
inferences” (Kothari, 2009:130).The study employed descriptive and inferential statistics to analyse the
collected data (Bhattacherjee, 2012; Kothari, 2009).
Descriptive statistical analysis
Descriptive analysis mainly concerns the development of some indices from the raw facts and figures and
is the study of distributions concerning one variable in the form of unidimensional analysis; bivariate
analysis or multivariate analysis (Kothari, 2009). In this study, measurement of magnitude and shapes of
distributions are worked out as well as measures of relationships between two and among more variables
(Kothari, 2009). The statistics involved in the descriptive analysis include measures of central tendency
or averages; measures of dispersion; measures of asymmetry; and measures relationships (Kothari, 2009).
It has to be appreciated that all the formulae of all the descriptive and inferential statistical calculations
are contained in the software packages MS Excel and SPSS which were used for data analysis. The
stakeholders can only view the results of their calculations and utilise these for reporting and basing their
conclusions.
Measures of dispersion / variability quantify the degree of scatteredness / spread of values of a variable
around the central tendency (Bhattacherjee, 2012). While there are different types of measures of

Page 116
dispersion, the study mostly utilised the standard deviation and the variance. There are also other measures
of dispersion thatwere not utilised in the study for data analysis such as the range and mean deviation.
Standard deviation (σ pronounced sigma) is the most popularly employed measure of dispersion. Kothari
(2009) defines standard deviation as “the square-root of the average of squares of deviations when such
deviations for the values of individual items in a series are obtained from the arithmetic average”. On the
other hand, thevariance is the square of standard deviation and is mostly utilised for analysis of variance
(Kothari, 2009). The standard error is the inherent sample error that is due to the differences between a
sample and the population (Bhattacherjee 2012). The standard error is the square root of the variance
(Adams et al., 2007).
Advantages
Do not ignore the arithmetic signs of values in a series
Not affected by outliers
Not affected by fluctuations of sampling
It is the basis for inferential statistical analysis
Measures of Relationships
Measures of relationship determine whether there is any relationship between two variables (regression
analysis) and the strength of the relationship (correlation analysis) or what part or portion of the dependent
variable is determined by the independent variable (coefficient of determination). In this study, the
Pearson’s coefficient of correlation or rank correlation (Rho) was utilised. In this study, Pearson’s
correlation was used and only significant relationship were used to know whether there was an association
between two variables.
Inferential statistical analysis
The inferential analysis also known as sampling statistical analysis concerns the methods of generalisation
and deals mainly with two major types of problems: estimating population parameters; and hypothesis
testing or significance testing (Kothari, 2009). The mostly utilised inferential statistical analysis was the
significance testing. It was the ultimate statistical analysis on which conclusions were based.
Although inferential statistical analyses vary, for SPSS one sample t-test used various concepts need some
definition/identity: The common concepts used in inferential statistical calculations include: the p-value;
the significance level (α pronounced alpha) and degrees of freedom (df). For the t-tests using SPSS version
17, various concepts need some definition/identity:

Page 117
Bhattacherjee (2012) looks at each of these as:
The p-value – where p stands for probability is “the probability that a statistical inference is
causedby pure chance.” (Bhattacherjee 2012:125)
The significance level (α pronounced alpha) – the maximum level of risk that one may be willing
to take that the inference/deduction is incorrect, which is 0.05 in this study
Degrees of freedom (df) – is the number of values that can vary freely in any calculation of a
statistic; in this case df = N-1
N is the actual sample size that could vary from 147 or less
The Meanis the calculated sample mean
Std. Deviation is the sample standard deviation
Std. Error mean is the sample standard error
rho – correlation coefficient depending on α and df
According to Whitley and Ball (2002:513) the advantages and disadvantages of non-parametric methods
are:
Advantages of nonparametric methods
Require no or very limited assumptions to be made about the format of the data, and they may,
therefore, be preferable when the assumptions required for parametric methods are not valid
Can be useful for dealing with unexpected, outlying observations that might be problematic with
a parametric approach
They are intuitive and are simple to carry out by hand, for small samples at least
They are often useful in the analysis of ordered categorical data in which assignation of scores to
individual categories may be inappropriate
Disadvantages of nonparametric methods
May lack power as compared with more traditional approaches
They are geared toward hypothesis testing rather than estimation of effects. It is often possible to
obtain nonparametric estimates and associated confidence intervals, but this is usually not
straightforward
Tied values can be problematic when these are common, and adjustments to the test statistic may
be necessary
Appropriate computer software for nonparametric methods can be limited although the situation
is improving. Also, how a software package deals with tied values or how it obtains appropriate
P values may not always be obvious

Page 118
One sample t-test
According to Kothari (2009:196), the “t-test is based on t-distribution and is consideredan appropriate test
for judging the significance of a sample mean or for judging the significance of difference between the
means of two samples in case of small sample(s) when population variance is not known (in which case
we use variance of the sample as an estimate of the population variance).”
The concepts are built in the statistical software SPSS version 17 that was used for statistical inferences.
To test the significance, the p-value is compared with the significant level (α). The difference between the
p-value and significant level (α) determines whether the null hypothesis is accepted or rejected. If the p-
value is less than significant level (α) it means the null hypothesis is rejected and vice versa.
Significance testing was used on three occasions in the study. The relevant t-test statistic was employed
to do so. The t-value is calculated from the sample data and then compared with its probable value based
on t-distribution (to be read from the table that gives probable values of t for different levels of significance
for different degrees of freedom) at a specified level of significance for concerning degrees of freedom
for accepting or rejecting the null hypothesis.
Significance testing was mostly used to determine significant responses that could be worthy of reporting
on. This was done by calculating the probability (or p-value) of a distribution. The P-value was used to
reduce the bulkiness of the report by eliminating all insignificant responses.
Spearman’s correlation analysis
According to Kothari (2009), “Charles Spearman’s coefficient of correlation (or rank correlation) is the
technique of determining the degree of correlation between two variables in case of ordinal data where
ranks are given to the different values of the variables. The main objective of this coefficient is to
determine the extent to which the two sets of ranking are similar or dissimilar.” Its values range from -1
to +1 and any value close to -1 denotes strong negative linear relationship while any value close to +1
denotes a strong positive linear relationship (Bhattacherjee, 2012). If the value of r is negatively or
positively close to zero it shows a weak positive or negative linear relationship (Bhattacherjee, 2012). The
strength of the relationship between variables indicates how responsive the dependent variable is to the
changes in the independent variable. Through SPSS version 17, the significance of the relationship
between variables was tested and only significant relationships were reported (Adams, 2007).
Cross tabulation
The essentials for the test process wereanother useful way of presenting bivariate data in cross-tabulation
(often abbreviated to cross-tab, and sometimes called more formally as a contingency table). According
to Bhattacherjee (2012), cross-tabulation makes a table that presents the frequencies or percentages of
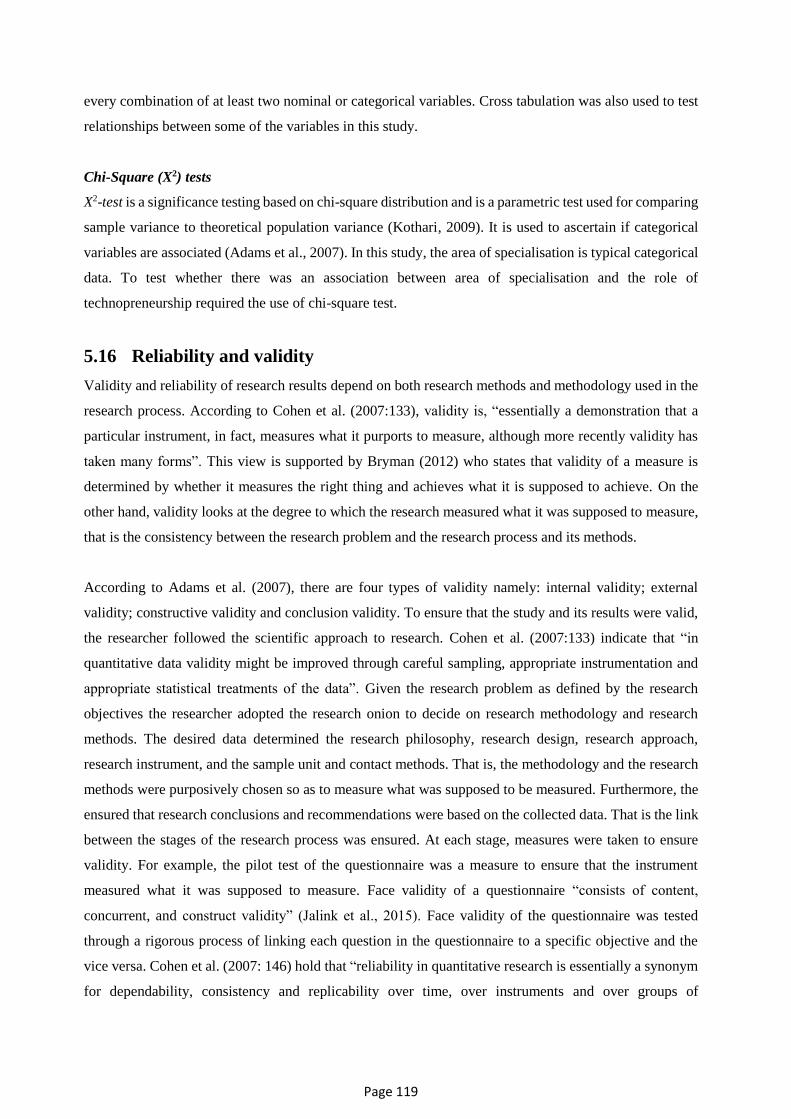
Page 119
every combination of at least two nominal or categorical variables. Cross tabulation was also used to test
relationships between some of the variables in this study.
Chi-Square (X2) tests
X2-test is a significance testing based on chi-square distribution and is a parametric test used for comparing
sample variance to theoretical population variance (Kothari, 2009). It is used to ascertain if categorical
variables are associated (Adams et al., 2007). In this study, the area of specialisation is typical categorical
data. To test whether there was an association between area of specialisation and the role of
technopreneurship required the use of chi-square test.
5.16 Reliability and validity
Validity and reliability of research results depend on both research methods and methodology used in the
research process. According to Cohen et al. (2007:133), validity is, “essentially a demonstration that a
particular instrument, in fact, measures what it purports to measure, although more recently validity has
taken many forms”. This view is supported by Bryman (2012) who states that validity of a measure is
determined by whether it measures the right thing and achieves what it is supposed to achieve. On the
other hand, validity looks at the degree to which the research measured what it was supposed to measure,
that is the consistency between the research problem and the research process and its methods.
According to Adams et al. (2007), there are four types of validity namely: internal validity; external
validity; constructive validity and conclusion validity. To ensure that the study and its results were valid,
the researcher followed the scientific approach to research. Cohen et al. (2007:133) indicate that “in
quantitative data validity might be improved through careful sampling, appropriate instrumentation and
appropriate statistical treatments of the data”. Given the research problem as defined by the research
objectives the researcher adopted the research onion to decide on research methodology and research
methods. The desired data determined the research philosophy, research design, research approach,
research instrument, and the sample unit and contact methods. That is, the methodology and the research
methods were purposively chosen so as to measure what was supposed to be measured. Furthermore, the
ensured that research conclusions and recommendations were based on the collected data. That is the link
between the stages of the research process was ensured. At each stage, measures were taken to ensure
validity. For example, the pilot test of the questionnaire was a measure to ensure that the instrument
measured what it was supposed to measure. Face validity of a questionnaire “consists of content,
concurrent, and construct validity” (Jalink et al., 2015). Face validity of the questionnaire was tested
through a rigorous process of linking each question in the questionnaire to a specific objective and the
vice versa. Cohen et al. (2007: 146) hold that “reliability in quantitative research is essentially a synonym
for dependability, consistency and replicability over time, over instruments and over groups of

Page 120
respondents”. In practice this means that the research process and techniques used can be repeated and
that similar results can be expected if high Cronbach Alpha coefficients are recorded.
The internal reliability of each factor that influences the adoption technopreneurship was tested using
Cronbach’s alpha coefficient. Reliability was mainly considered during the designing of the questionnaire
and choice of data analysis techniques. The questionnaire was designed in such a way that most of the
respondents could interpret the wording and layout in more or less the same way. The wording of the
questionnaire was reduced to suit people of different professions. The key term, ‘technopreneurship’ was
defined on the introductory part of the questionnaire in the simplest way that the researcher wanted the
respondents to interpret it. The questionnaire was made up of multiple choice questions to simplify the
answering process and the demographic questions that could offend the respondents were placed at the
end of the questionnaire. Data analysis techniques were chosen on the basis of the type of questions, that
is, Likert scales. Different quantitative analysis techniques can be used, but they lead to the same
conclusions and thus ensuring the reliability of the research process.
This study adopted a suitable research methodology to determine or establish the factors that influenced
technopreneurship in the food processing sector in Zimbabwe. Thus, the research problem was pertinent
and worth researching, thereby contributing to a knowledge gap in the Zimbabwean industry and even
other developing countries. Furthermore, the research methods adopted also aimed at achieving the
reliability and validity required for the research results. In other words, the guiding research philosophy,
design, methods, instruments, sample design and data analysis techniques all were synchronised towards
the same objective.
5.17 Ethical considerations
For the research to be above board regarding ethical standards, the researcher attained an ethical clearance
letter (reference number: HSS/1456/014D) from the University’s ethical committee.
According to Saunders et al. (2007:178) “research ethics relates to questions about how we formulate and
clarify our research topic, design our research and gain access, collect data, process and store our data,
analyse data and write up our research findings in a moral and responsible way”. Thus, morality and
responsibility are of the essence in this case. The ethical dilemma faced by the researcher was not new in
research. Cohen et al. (2007:51) highlight that “a major ethical dilemma is that which requires researchers
to strike a balance between the demands placed on them as professional scientists in pursuit of truth, and
their subjects’ rights and values potentially threatened by the research”.

Page 121
To observe high standards of ethical consideration the researcher benefited from the ethical academic
requirements by the University of KwaZulu-Natal. The University has a research code of ethical conduct
which binds all researchers (Creswell, 2009). The code requires that several documentations be done to
ensure high ethical standards. The documentation includes: Gatekeeper consent letters and Informed
consent letters. The gatekeeper’s letter was endorsed by the company gatekeeper who could be the Chief
Executive Officer (CEO), Human Resources Manager (HRM) or any senior member of the organisation
with authority to approve circulation of questionnaires in the organisation. This was required to be
endorsed before data collection and a submission to the University for Ethical Clearance. On the other
hand, the informed consent accompanied each questionnaire for each respondent to read and agree to
participate in the research. The questionnaire was also accompanied by an introductory letter introducing
the researcher and the institution so as to give full information for the respondent to make a free and
informed decision. The University acted as an ethical review board (Bhattacherjee 2012). After the
proposal had been approved by the university, the researcher was required to go through a process of
ethical clearance. The ethical clearance sought mainly to confirm the observance of participants’ right to
freedom of participation. This was achieved by requiring the gatekeeper to approve the circulation of the
researcher’s questionnaire. Furthermore, the questionnaire had to be accompanied by a cover letter giving
all necessary information to the individual participant as well as an informed consent letter giving the
respondent freedom of participation. After the ethical clearance, it was not allowed to make changes to
the research methods. That is, the university offered strong ethical guidance through its academic
leadership. Principles of ethical conduct in research could be followed through the guidance, that is,
voluntary participation and harmlessness, anonymity and confidentiality, disclosure as well as analysis
and reporting (Bhattacherjee, 2012).
This study observed all stakeholder values and from the topic through the methodology to the dissertation,
confidentiality and professionalism were of priority. The topic was chosen with the understanding that it
is of social interest and the subsequent procedures had to follow the same notion. As such no names of
participating organisations and individuals were included anywhere in or on source documents or the
dissertation. Source documents were stored in a locked cabinet in the researcher’s office until all possible
publications have been made including the publication of the thesis. Data were stored off-line on the
personal laptop and flash disc also until publications have been made. All respondents in the research did
it voluntarily and withdrawal was free since participants could easily be replaced.
5.18 Summary
Research studies can be planned according to the ‘research onion’ (Saunders et al. 2007) which can be
adapted to suit any research study (Bryman, 2012). All researchers cover aspects of research philosophy;
design; strategy; time horizons; methods and data analysis. While research theory stipulates the

Page 122
harmonisation of research philosophies, designs, strategies and so on, dovetailing each other, it has been
discovered that each research is unique. Each research study is executed by creating a suitable mix of
philosophies, designs, strategies and methods to attain the research objectives.
In this study, the research onion was adapted to suit the situation and circumstances of this study. For the
first three layers of the research onion, the researcher adopted the phenomenological research philosophy,
deductive research approach and survey research strategy. The next layers of the research onion of this
study, quantitative research and cross-sectional research study were adopted to guide data collection and
analysis. The chapter covered the research methodology and methods that were adopted to gather the
desired information. The results are presented in the next chapter.

Page 123
CHAPTER 6: RESEARCH RESULTS
6.1 Introduction
In this chapter, the results of the quantitative data are presented through frequency distribution tables,
interpretation of graphical presentations, relative statistics and inferential statistics. This is applied to
Likert scale questions. All tabulation, descriptive and inferential statistics were interpreted accordingly to
assign meaning to the gathered data. The results are presented according to the objectives, starting with
the demographic data of the sample.
The chapter presents, analyses and interprets demographic data that include the respondents’ areas of
specialisation; gender, the level of education; position at work and the working department. The findings
are then presented, analysed and interpreted as per set objectives; that is, the role of technopreneurship
and the results of its three questions, namely:(1) factors influencing the successful adoption of
technopreneursip categorised as internal processes with the results of its six questions, (2) human factors
with the results of its three questions, venture capital with the results of its two questions, partnerships
with the results of the two questions, government support and the results of its four questions and lastly
(3) global factors with the results of its three questions. The findings of objective number three, with
nineteen critical success factors, were presented, analysed and interpreted. Lastly, findings of objective
number four, with regards to the feasibility of technopreneurship were presented, analysed and interpreted.
Feasibility of technopreneurship was covered by six questions.
6.2 Response rate
Table 6.1 shows the actual sample size from participating organisations of the 14 food processing
companies in Zimbabwe. The table also indicates that there was a low response rate from the Companies.
The non-response error was catered for by the quantitative analysis of data that made it representative of
the population (Eriksson and Kovalainen, 2008). Other details of the composition of respondents regarding
demographic characteristics are in the presentation of findings.
Table 6.1: Sampling data
Target
Respondents
Number of
Organisations
Sample Unit Actual
Sample Size
Food processing
sector in Zimbabwe 14
Managers, Scientists, Administrators,
Engineers, Technologists 147

Page 124
From the 250 questionnaires distributed 147 were returned completed and one uncompleted giving a
response rate of about 59% that is slightly more than half. Whelan (2015) suggests an updated benchmark
of an organisational survey response rate of 51%. As such this study response rate was slightly above the
benchmark. Also, Baruch and Holtom (2008) concluded an average response rate for individuals in
organisational research to be 52.7% while 35.7% was the average response rate for organisational
responses from 2000 to 2005. Allen et al. (2015) also concluded that there was a general decline in survey
response rate in academic research from 1960-1995 and the overall response rate was determined by the
type of sample and procedures used to influence response rate. The major determinant of response rate in
this study was the willingness of the gatekeepers of the food processing companies. It can be appreciated
that among the 14 operational food processing companies in Harare, only nine cooperated. This is a 64%
cooperation rate. Some of the gatekeepers could simply continuously postpone appointments or simply
indicate that the researcher leaves the documentation but they would just ignore it to the frustration of the
researcher. The issue in Zimbabwe is that there are no good relations between universities and industry.
The industry is sceptical about academic research and would take it negatively. The responses were not
equally distributed among the nine companies that participated. Company situations vary so the employee
circumstances and atmosphere would determine the mood of each employee which would determine
whether they responded or not. While a low response rate is common in survey research, the major
contributing factor to the low response rate, in this case, was the low staff morale in the Zimbabwean
industry in 2015. As was presented in chapter 2, workers were massively retrenched and felt they had no
job security (Mataranyika, 2015; Kariati, 2015). As a result, attending to questionnaires that seem not to
directly address their cause, was not important from their view. Also, there are no good relations between
industry and universities in Zimbabwe. Industry, for example, feels their information is confidential and
cannot be shared with academic institutions. Three of the gatekeepers refused to approve the circulation
of the questionnaire, while two others who had previously approved the circulation, said the researcher
was late and there was a need for reconsideration.
To deal with the challenges, the researcher had to make follow-ups calling the link persons twice a day
and visiting each company in person at least once a week. The snowball approach assisted in getting in
touch with influential people in some food processing companies and more responses could be obtained.
6.3 Internal reliability test and face validity
As was indicated in Section 5.16, the internal validity of each factor that influence the adoption of
technopreneurship in the food processing sector in Zimbabwe was tested using Cronbach’s alpha
coefficient. The results in Table 6.2 shows that items in Human factors and Government support were not
measuring the same things with coefficients of 0.185 and 0.285 respectively. All other factors have reliable
measures.

Page 125
Table 6.2: Internal validity of factors influencing technopreneurship
Factor Questions Cronbach’s
alpha
coefficient
Comment
Internal processes q2.1 – q2.6 0.820 Internally reliable
Human Factors q2.7 – q2.9 0.185 Items in this factor were not measuring
the same thing
Venture Capital q2.10 – q2.11 0.874 Internally reliable
Partnerships q2.12 – q2.13 0.802 Internally reliable
Government Support q2.14 – q2.16 0.285 Items in the factor were not consistent
Global Factors q2.18 – q2.20 0.916 Internally reliable
Given the rigorous process of questionnaire development and testing, it was concluded that face validity
of the research instrument existed.
6.4 Demographic details
In this study, five sets of variables were used to demographically describe the target respondents. The
demographic variables included: area of educational specialisation; position at the workplace; the
department in which the respondent worked, gender and the highest level of education of the respondent.
The aim was to ensure that the sample represented the respondents. These were expected to represent the
population’s characteristics.
6.4.1 Area of specialisation
Area of specialisation had four categories, namely, engineering only, business only, both business &
engineering and other. The idea behind the identification of areas of specialisation was to determine the
skills in possession by the respondents. The results are presented in Table 6.3 and in the pie chart, Figure
6.1 below. Although the areas of specialisation were so general, its function was basically to collect data
about the skills that the companies had. From Table 6.3, it can be noted that 144 out of 147 respondents
answered the question that represents 98% response rate and makes it a substantial response rate.
From Figure 6.1 it can be noted that almost half the respondents, 47%, indicated that they were specialists
in business while one-fifth were specialists in engineering, 20%, and also, almost one-fifth were both
engineering and business specialists, 18% and others 13%. Indications on others could include such areas
as information technology and supply chain activities like logistics and transport who felt they were
neither engineering nor business. This can be viewed as the composition of most manufacturing industries,

Page 126
regarding areas of specialisation given the capital intensity of engineering activities and labour intensity
of business functions. In terms of areas of specialisation, the response rate was 100% of the questionnaires
returned.
Table 6.3: Frequency distribution table showing responses for area of specialisation
Frequency Percent Valid Percent Cumulative
Percent
Valid
Engineering only 30 20.4 20.8 20.8
Business only 69 46.9 47.9 68.8
Engineering and business 26 17.7 18.1 86.8
Other 19 12.9 13.2 100.0
Total 144 98.0 100.0
Missing System 3 2.0
Total 147 100.0
Figure 6.1 compares responses to areas of specialisation. A total of 47% represents business only while
20% and 18% represent engineering only and engineering and business respectively. In this case, business
only meant professional qualifications in business management and related areas. On the other hand
engineering only referred to professional qualifications in any engineering area. This seems that food
processing technopreneurs have more employees in business operations than in engineering operations.

Page 127
Figure 6.1: A pie chart showing responses of areas of specialisation
6.4.2 Gender
From Table 6.4 it can be observed from the valid responses that about 68% were male while about 32%
were female. This can be taken as a correct reflection of the population composition of staff regarding
gender in the food processing sector. That is compared with ZIMSTAT (2015) labour statistics in the
industrial sector which stated that the composition is 72% male and 28% female.
Table 6.4 A frequency distribution showing gender composition of the respondents
Frequency Percent Valid
Percent
Cumulative
Percentage
Valid
Male 99 67.3 68.3 68.3
Female 46 31.3 31.7 100.0
Total 145 98.6 100.0
Missing System 2 1.4
Total 147 100.0
Engineering
only
20%
Business
only
47%
Engineering
and business
18%Other
13%
Unspecified
2%

Page 128
6.4.3 Educational level
The Zimbabwean educational system progress from Ordinary level, through certificate, diploma, general
degree, honours degree, master’s degree to Ph.D. for people who are employable by the manufacturing
sector. The question was used to gather data with regards to the levels of education of the respondents.
Areas of specialisation assisted in determining the skills available in the food processing sector and the
levels of education assisted in further determining the extent to which the employees were professionally
trained. From Table 6.5, it can be observed that the majority of respondents had degrees, 33.6%, followed
by those with diplomas, 29.3%.
Table 6.5: A frequency distribution table showing highest educational levels for respondents
Frequency Percent Valid
Percent Cumulative Percent
Valid
O-levels 7 4.8 5.0 5.0
Certificate 9 6.1 6.4 11.4
Diploma 41 27.9 29.3 40.7
Degree 47 32.0 33.6 74.3
Honours 23 15.6 16.4 90.7
Master’s 13 8.8 9.3 100.0
Total 140 95.2 100.0
Missing System 7 4.8
Total 147 100.0
It is also important to note how gender composition and levels of educational attainment compare. This
was done in Figure 6.2 and it can be noted that 50% of the respondents had undergraduate qualifications,
that is, 32.6% degrees and 15.6% honours degrees. This was followed by diploma holders who were
27.9%.

Page 129
Figure 6.2: Gender composition and educational levels for respondents
6.4.4 Positions at work
Positions at workplaces represent the degree of responsibility and degree of influence respondents have
on organisational decision-making. Positions were classified regarding organisational hierarchy and
included top management, middle management, first-line management and non-managerial employees.
Non-managerial employees include practitioners like scientists and technicians. From Table 6.6, it can be
observed that the majority (39.9%) of respondents were first-ine managers, followed by middle
management (37.8%); non-managerial level (16.3%) and top management (5.4%). The responses seem to
fit an organisational setup where top management should be the minority, specialised support staff who
are non-managerial are the second minority while the majority being supervisors and middle managers
the third majority. Positions at work were used as a control measure in the study to ensure a range of
positions are covered like managers, administrators, scientists, engineers and technicians.
.0
10.0
20.0
30.0
40.0
50.0
60.0
70.0
Mal
e
Fem
ale
Unsp
ecif
ied
O-l
evel
s
Cer
tifi
cate
Dip
lom
a
Deg
ree
Honours
Mas
ters
Unsp
ecif
ied
Gender Education
67.3
31.3
1.44.8 6.1
27.9
32.0
15.6
8.8
4.8
Per
cen
tag
e

Page 130
Table 6.6: Level of position at work
Frequency Percent Valid Percent
Cumulative
Percent
Valid
Top management 8 5.4 5.6 5.6
Middle management 54 36.7 37.8 43.4
First-line
management 57 38.8 39.9 83.2
Non-managerial 24 16.3 16.8 100.0
Total 143 97.3 100.0
Missing System 4 2.7
Total 147 100.0
6.4.5 Respondent’s department
A department of the respondent is the organisational unit responsible for a specific function that
contributes to the overall goal of the organisation. Since the nomenclature of departments varies from
organisation to organisation, the researcher simplified the matter by using generic classifications like
administrative, engineering or support staff. Table 6.7 shows that the majority (47.2%) of the employees
worked in the administrative departments followed by engineering departments with 38.2% and lastly
support services with 14.3%. The results are to some extent consistent with the composition of staff at
most organisations with the majority of administrators having a business specialisation. However, it is
possible to have administrators with engineering qualification or both.

Page 131
Table 6.7: A frequency distribution table showing categories of departments of respondents
Frequency Percent Valid Percent Cumulative
Percent
Valid
Administrative 68 46.3 47.2 47.2
Engineering 55 37.4 38.2 85.4
Support services 21 14.3 14.6 100.0
Total 144 98.0 100.0
Missing System 3 2.0
Total 147 100.0
A comparison of positions and departments may also be necessary also to verify consistency. From Figure
6.3, it can be noted that the majority of respondents were from middle management; that is, 36.7% and
first-line management, that is, 38.8%. Most of the respondents came from administrative departments;
that is, 46.3% followed by respondents from engineering departments (37.4%). Thus administrative duties
are assumed mostly by middle and top management. Engineering duties are carried out by first-line
managers while support staff carries out non-managerial responsibilities. Thus again the results are
consistent.

Page 132
Figure 6.3: Position levels and categories of departments
6.5 One sample t-tests
Having presented the demographic variable results, it was pertinent that the results of other elements as
measured by the objectives were to be presented. The results were presented according to the research
objectives. In the presentation, frequency distribution tables, graphs and charts are used. Data analysis is
done through descriptive and inferential statistics. The inferential statistical analysis was done to test
whether there was significant agreement/disagreement; importance/unimportance. The one-sample t-test
was used to test whether the average score was significantly different from the neutral score of ‘3’.
The study involved a quantitative strategy as presented in the methodology section; as a result, the
gathered data was quantitatively analysed. To determine which results to report on and which ones to
leave out, the researcher used one sample t-test of significance. That means all the responses that were not
statistically significant was not reported on. According to Kent University (2015), one sample t-test
determines the statistical difference between the hypothesised population mean and sample mean. Given
that the instrument (questionnaire) consisted mainly of the 5-point Likert scales, one sample t-test was
used to determine the “statistical difference between the sample mean and the sample midpoint of the test
.0
10.0
20.0
30.0
40.0
50.0
Top m
anag
emen
t
Mid
dle
man
agem
ent
Fir
st l
ine
man
agem
ent
Non m
anag
eria
l
Unsp
ecif
ied
Adm
inis
trat
ive
Engin
eeri
ng
Support
ser
vic
es
Unsp
ecif
ied
Position Department
5.4
36.738.8
16.3
2.7
46.3
37.4
14.3
2.0
Per
cen
tag
e

Page 133
variable” (Kent University, 2015). In this case, the sample midpoint was 3 and sample means were
calculated for each question and compared to the midpoint. The significance of the difference between
test statistic or calculated t and the critical t-value (determined by the degrees of freedom and the
confidence level) is determined by the corresponding p-value denoted by sig. (2-tailed). Depending on the
direction of the Likert scale, the corresponding p-value is compared with the significance level alpha (α),
which is the significance level that is 0.05 or 5%. When the p-value is less than 0.05 and the Likert scale
ranges from ‘strongly disagree’ it implies disagreement and vice versa. When the p-value is greater than
0.05 and the Likert scale ends with ‘strongly agree’ it implies agreement. This applies to other Likert
scales, that is, the importance scale, that is question 1 and that of the feasibility of technopreneurship
(question number four). The tables showing the one sample statistics and one sample test statistics are
found in Appendix 2 and not in the presentations where only the sample statistics and the test statistics
are quoted to avoid data overload.
It has to be noted that the test value is the mean score. However the t statistic is indicated since it has an
equivalent p-value, the size of which has implications to the significance of the difference from the mid-
point. The p-value is compared to α (alpha) which is the level of significance 0.05 which is expressed as
0.0005 in SPSS. If the p-value is 0.000 it is reported as p< 0.0005 which implies mean score significantly
different from the mean score in this case of 3. To avoid overcrowding the presentation, the researcher
concentrated on the p-value and mean score for reporting. The researcher also used percentage simple
component bar charts to show the composition of responses for each question and simple bar charts. In
the simple bar charts, mean scores of the average company responses are compared to the mean score of
3. The mean score of three is the midpoint of the 5-point Likert scale. The majority of the tables showing
sample statistics results and tables showing test statistic results are presented in Appendix 2.
6.6 The importance of technopreneurship in the food processing sector
One of the research objectives was, “To assess the importance of technopreneurship in the food processing
sector in Zimbabwe.” The value given to technopreneurship was measured through finding out the degree
of importance assigned by the companies to elements of technopreneurship. The elements of
technopreneurship were: industrial food processing technology; entrepreneurship orientation and;
technopreneurship. Three basic Likert scale questions were asked to achieve this research objective.
Figure 6.4 presents the results of the three questions in terms of percentage responses.

Page 134
Figure 6.4: Importance attached to three elements
It can be observed that ‘very important’ and ‘important’ responses are dominating on the bar chart for the
three questions on the importance scale. This indicates that the ‘important’ and ‘very important’ responses
were dominating and as a result, all the three facets seem to be valued by the food processing
technopreneurs. The three facets measured in the three questions were industrial food processing
technology, entrepreneurial orientation and technopreneurship.
The significance of the responses was statistically tested and analysed using the one sample t-test. Using
the results of the test statistic and its p-value, analysis shows that significant importance was indicated for
all the three elements as follows:
Industrial food processing technology is significantly important to the companies [t(146) = 29.558,
p < 0.0005]
Entrepreneurial orientation is significantly important to the companies [t(140) = 10.559, p < 0.0005]
Technopreneurship is significantly important to the companies [t(140) = 12.658, p < 0.0005].
The three facets had mean scores >3 which implies the importance of technopreneurship in the food
processing sector to the companies as shown in Table 6.8, figures. The table shows that industrial food
processing technology had a mean score of 4.56; entrepreneurial orientation 3.94, and technopreneurship
.0
20.0
40.0
60.0
80.0
100.0
q1.1 Food
processing
technology
q1.2
Entrepreneurship
orientation
q1.3
Technopreneurship
4.1 2.72.76.8 6.8
11.68.2
35.4
41.541.5
61.9
32.0 36.7
Per
cen
tage
Not at all important Not that important Undecided Important Very important

Page 135
4.07. This indicates that there was significant importance attached to the three facets by the companies
and that technopreneurship plays an important role in the food processing sector.
Table 6.8: One sample test statistics for the importance of technopreneurship
N Mean Std. Deviation Std. Error Mean
q1.1 Food processing technology 147 4.56 .642 .053
q1.2 Entrepreneurship orientation 141 3.94 1.061 .089
q1.3 Technopreneurship 141 4.07 1.005 .085
6.7 Factors influencing the adoption of technopreneurship in the food
processing sector
The other research objective of the study was, “To examine the factors that influence successful adoption
of technopreneurship in the food processing sector in Zimbabwe.” To examine these factors as presented
in the conceptual framework, Chapter 3, Figure 3.4, Likert scale questions were used. The factors were
categorised into six, namely: internal processes; human factors; venture capital; partnerships; government
support and global factors. The results were presented, analysed and interpreted for each factor influencing
technopreneurship below.
6.7.1 Internal processes
Internal factors influencing technopreneurship were examined through six questions q2.1 to q2.6 in the
questionnaire. The results regarding percentage responses are shown in Figure 6.5. Looking at the
component bar chart, observations can be made for the different questions that the purple colour is
dominant, indicating ‘disagreement’ in most questions (s q2.2, q2.3, q2.4 and q2.5). On the other hand,
there seems to be a balance between the ‘agree’ and ‘disagree’ responses in q2.1 that implies to some
balance between disagreement and agreement. Lastly, in q2.9 the red colour is dominant which implies
disagreement. However, while such observations can be made, the dominance of these responses has to
be statistically tested for significance.

Page 136
Figure 6.5: Percentage responses to agreement scales of internal processes
To establish the significance of the responses, the one-sample t-tests were used for all the questions (q2.1
to q2.6). The analysis shows that significant disagreement was indicated by the companies for:
Full utilisation of current processing machinery [t(146) = 3.725, p < 0.0005];
The replacement of machinery as soon as it is old [t(146) = 7.768, p < 0.0005]
Changing to new processing technology being not a problem to the company [t(146) = 3.643, p <
0.0005].
On the other hand significant agreement was indicated for:
The company having research and development (R&D) department [t(146) = -2.899, p = 0.004].
Furthermore, with three as the test statistic for mean scores, the results of the questions were presented,
analysed and interpreted accordingly. From Figure 6.6, it can be observed that q2.2, q2.3 and q2.5 all
have mean score > 3 which implies disagreement. Q2.6 shows significant agreement since the mean score
< 2.
13.64.1 2.7 4.8 10.2 13.6
36.7
26.517.0
31.3 18.4
42.9
4.1
11.6
10.9
11.611.6
17.034.7
46.9
46.9
46.9
43.5
12.9
8.2 10.922.4
5.416.3 13.6
.0
20.0
40.0
60.0
80.0
100.0
q2.1 The
company has
the latest food
processing
technology.
q2.2 The
processing
machinery is
currently
fully utilised.
q2.3
Machinery is
replaced as
soon as it is
old.
q2.4 The
company
continuously
updates itself
with the latest
processing
technology.
q2.5
Changing to
new
processing
technology is
not a problem
for the
company.
q2.6 The
company has
a research and
development
(R&D)
department.
Per
cen
tage
Strongly agree Agree Not sure Disagree Strongly disagree
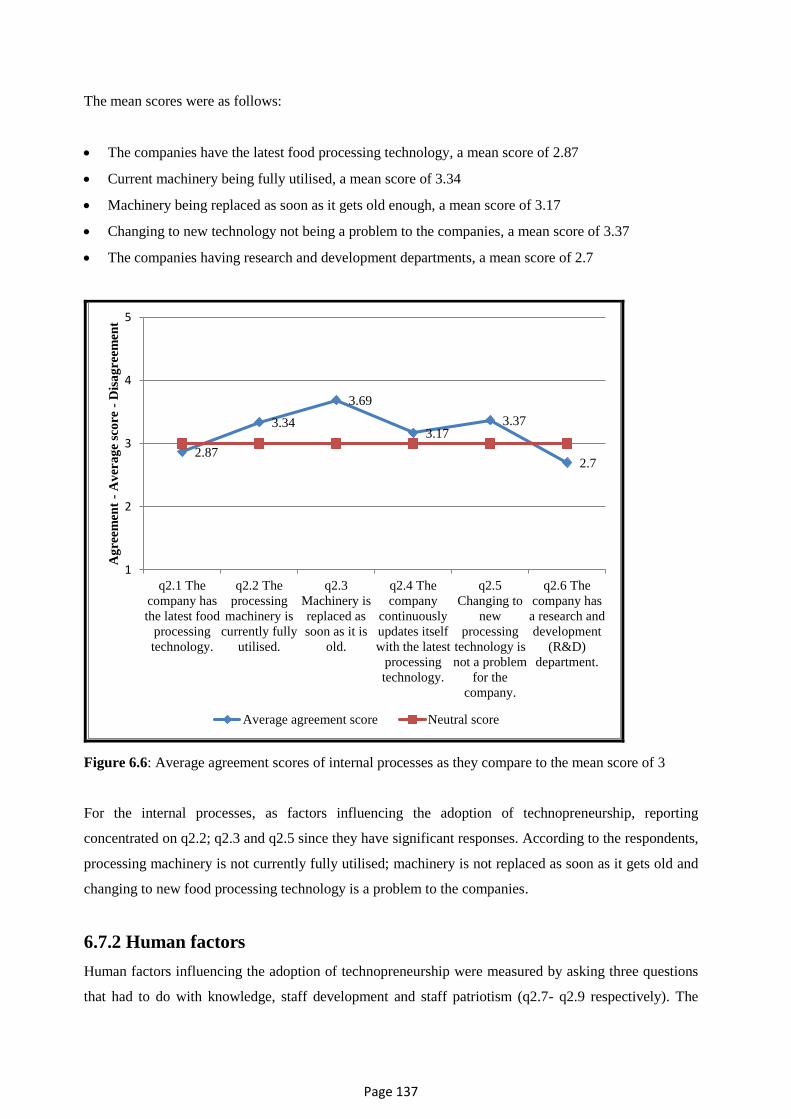
Page 137
The mean scores were as follows:
The companies have the latest food processing technology, a mean score of 2.87
Current machinery being fully utilised, a mean score of 3.34
Machinery being replaced as soon as it gets old enough, a mean score of 3.17
Changing to new technology not being a problem to the companies, a mean score of 3.37
The companies having research and development departments, a mean score of 2.7
Figure 6.6: Average agreement scores of internal processes as they compare to the mean score of 3
For the internal processes, as factors influencing the adoption of technopreneurship, reporting
concentrated on q2.2; q2.3 and q2.5 since they have significant responses. According to the respondents,
processing machinery is not currently fully utilised; machinery is not replaced as soon as it gets old and
changing to new food processing technology is a problem to the companies.
6.7.2 Human factors
Human factors influencing the adoption of technopreneurship were measured by asking three questions
that had to do with knowledge, staff development and staff patriotism (q2.7- q2.9 respectively). The
2.87
3.34
3.69
3.173.37
2.7
1
2
3
4
5
q2.1 The
company has
the latest food
processing
technology.
q2.2 The
processing
machinery is
currently fully
utilised.
q2.3
Machinery is
replaced as
soon as it is
old.
q2.4 The
company
continuously
updates itself
with the latest
processing
technology.
q2.5
Changing to
new
processing
technology is
not a problem
for the
company.
q2.6 The
company has
a research and
development
(R&D)
department.
Ag
reem
ent
-A
ver
ag
e sc
ore
-D
isa
gre
emen
t
Average agreement score Neutral score

Page 138
human factors questions used the same Likert scale as internal processes. From Figure 6.7 it can be noted
from the component bar chart that the ‘agree’ and ‘strongly agree’ scales dominated the responses.
However further analysis can show how significant these responses are.
Figure 6.7: Percentage responses to questions on the ‘human factors’
Analysis shows that significant agreement is indicated for:
Plant engineers having full knowledge of the processing machinery [t(146) = -14.477, p < 0.0005]
The company continuously training its workers [t(146) = -2.992, p = 0.003
The workers supporting the organisation’s vision [t(146) = -10.375, p = < 0.0005]
From Figure 6.8 it can be observed that all human factor questions have mean scores of < 3 which implies
agreement. That is, the respondents indicated that engineers have full knowledge of the processing
machinery and that the companies continuously train their workers. Also, the companies indicated that the
workers in the companies support organisational visions.
19.0 17.0 19.0
64.6
36.1
57.8
9.5
12.2
10.9
5.4
29.3
9.5
1.4 5.4 2.7
.0
20.0
40.0
60.0
80.0
100.0
q2.7 Plant engineers
have full knowledge
of the processing
machinery.
q2.8 The company
continuously trains its
workers
q2.9 The workers
support the
organisation’s vision.
Per
cen
tage
Strongly agree Agree Not sure Disagree Strongly disagree

Page 139
Figure 6.8: Mean scores for human factors questions
6.7.3 Venture capital
The influence of venture capital was measured by asking two questions, that is, q2.10 and q2.10. The
questions had to do with access to venture capital loans and relations with local and foreign venture
capitalists. Figure 6.9 shows the results and it can be observed that the ‘agree’ and ‘not sure’ responses
dominate in both questions that imply agreement.
2.05
2.7
2.19
1
2
3
4
5
q2.7 Plant engineers have
full knowledge of the
processing machinery.
q2.8 The company
continuously trains its
workers
q2.9 The workers support
the organisation’s vision.
Ag
reem
ent
-A
ver
ag
e sc
ore
-D
isa
gre
emen
t
Average agreement score Neutral score

Page 140
Figure 6.9: Percentage responses to the two ‘venture capital’ questions
Analysis shows that significant agreement is indicated for:
The companies having access to venture capital loans [t(146) = -2.101, p = 0.037]
The companies endeavouring to create relations with local and foreign venture capitalists [t(144)
= 0.004).
Also from Figure 6.10, it can be observed that both questions of venture capital had mean scores of <3
which implies agreement. Q2.10 had mean score of 2.82 and q2.11 had mean score of 2.74 both of which
are significantly <3. This implies that respondents indicated that companies:
Had access to venture capital
Endeavoured to create relations with local and foreign venture capitalists
6.8 3.4
36.750.3
34.022.4
12.9 12.9
9.5 9.5
.0
20.0
40.0
60.0
80.0
100.0
q2.10 The company has
access to venture capital
loans.
q2.11 The company
endeavours to create
relations with local and
foreign venture capitalists.
Per
cen
tag
eVenture Capital
Strongly agree Agree Not sure
Disagree Strongly disagree

Page 141
Figure 6.10: Mean scores for venture capital
6.7.4 Partnerships
Partnerships were also measured by two questions, that is, q2.12 and q2.13, which had to do with a foreign
partnership in technology and finance, as well as links with research and development institutions.
Figure 6.11 shows that the ‘agree’, ‘not sure’ and ‘disagree’ seem to dominate in both questions on
partnerships. This could mean a balance between agreement and disagreement regarding the partnership
questions. However for q2.13, the 36.1% for the ‘agree’ response can overweigh the 23.8% for the
‘disagree’ response. Significance testing can help reach a conclusion on these responses.
2.82 2.74
1
2
3
4
5
q2.10 The company has access to
venture capital loans.
q2.11 The company endeavours
to create relations with local and
foreign venture capitalists.
Ag
reem
ent
-A
ver
ag
e sc
ore
-D
isa
gre
emen
t
Average agreement score Neutral score
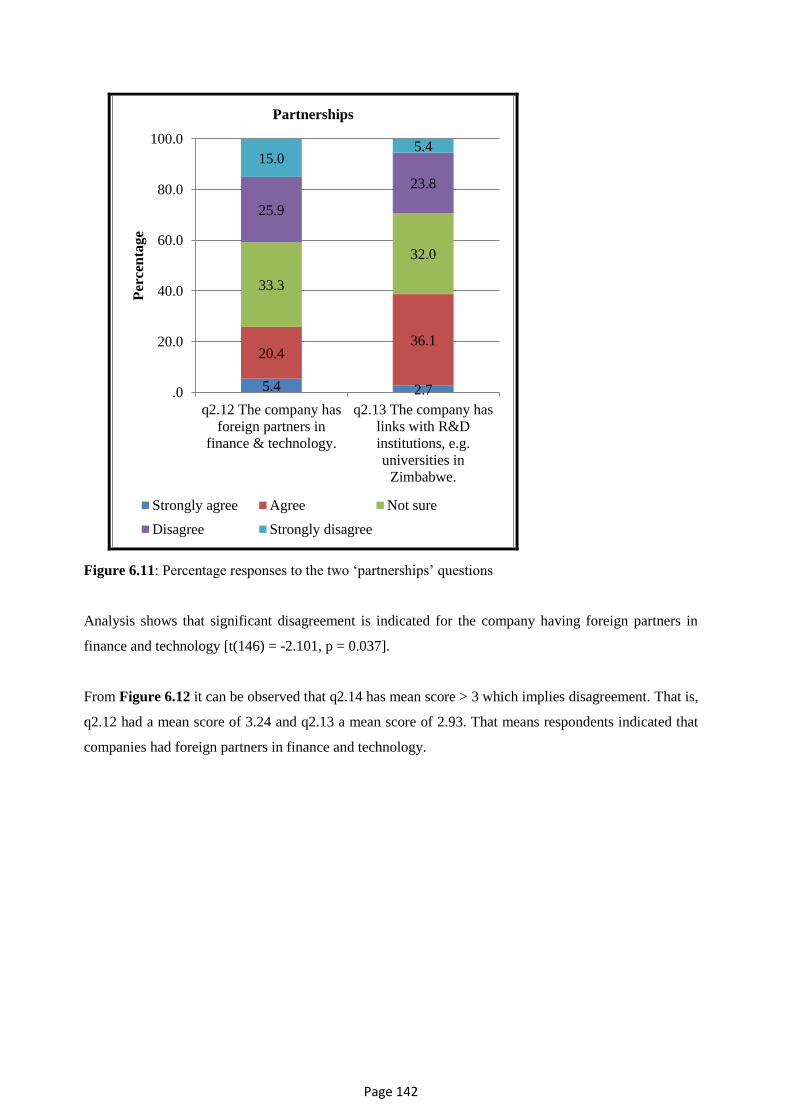
Page 142
Figure 6.11: Percentage responses to the two ‘partnerships’ questions
Analysis shows that significant disagreement is indicated for the company having foreign partners in
finance and technology [t(146) = -2.101, p = 0.037].
From Figure 6.12 it can be observed that q2.14 has mean score > 3 which implies disagreement. That is,
q2.12 had a mean score of 3.24 and q2.13 a mean score of 2.93. That means respondents indicated that
companies had foreign partners in finance and technology.
5.4 2.7
20.436.1
33.3
32.0
25.9
23.8
15.05.4
.0
20.0
40.0
60.0
80.0
100.0
q2.12 The company has
foreign partners in
finance & technology.
q2.13 The company has
links with R&D
institutions, e.g.
universities in
Zimbabwe.
Per
cen
tag
e
Partnerships
Strongly agree Agree Not sure
Disagree Strongly disagree

Page 143
Figure 6.12: Mean scores for partnerships
6.7.5 Government support
To measure government support as a factor influencing technopreneurship, four questions were posed
(q2.14 - q2.17). The questions had to do with the reliability of power supply, power costs, government
taxes and government policy support. Figure 6.13 shows that the ‘agree’ and ‘strongly agree’ dominate
the responses. That is, the ‘strongly agree’ and ‘agree’ seem to be having higher percentages of responses
to the four questions. Likewise, the percentage results were tested to have statistical significance support
and the results are presented after Figure 6.13.
3.24
2.93
1
2
3
4
5
q2.12 The company has foreign
partners in finance & technology.
q2.13 The company has links
with R&D institutions, e.g.
universities in Zimbabwe.
Ag
reem
ent
-A
ver
ag
e sc
ore
-D
isa
gre
emen
t
Average agreement score Neutral score

Page 144
Figure 6.13: Percentage responses of the four questions on ‘government support’
Analysis shows that companies agree that:
Electricity load shedding hampered the industrial food processing business in Zimbabwe [t(146)
= -17.364, p < 0.0005]
Electricity costs were a drawback to the industrial food processing business in Zimbabwe [t(146)
= -11.655, p < 0.0005]
Government taxes are a drawback to the food processing sector in Zimbabwe [t(142) = -8.382, p
< 0.0005]
Government gives policy support to the food processing sector [t(146) = -5.337, p > 0.0005]
From Figure 6.14, it can be observed that all government support questions have a mean score < 3
which implies agreement. That is q2.14 has a mean score of 1.68; q2.15 a mean score of 2; q2.16 a
mean score of 2.24 and q2.17 a mean score of 2.59.
49.036.7
26.5
5.4
44.2
40.8
40.1
51.0
.7
10.9
14.326.5
2.0 8.813.6 12.9
4.1 2.72.7 4.1
.0
20.0
40.0
60.0
80.0
100.0
q2.14 Electricity
load shading
hampers the
food processing
business in
Zimbabwe.
q2.15 Electricity
costs are a
drawback to the
food processing
business in
Zimbabwe.
q2.16
Government
taxes are a
drawback to the
food processing
in Zimbabwe.
q2.17 The
government
gives policy
support to the
food processing
sector in
Zimbabwe
Per
cen
tag
e
Strongly agree Agree Not sure Disagree Strongly disagree

Page 145
Figure 6.14: Mean scores for government support questions
From the results, it can be said that respondents indicated that electricity load shedding and electricity
costs were hampering industrial food processing business of the companies. Also, government taxes and
lack of policy support from the government were also drawbacks to industrial food processing operations
of the organisations.
6.7.6 Global factors
The global factors were measured using three questions, q2.18, q2.19 and q2.20, which pertained to the
quality of food products versus imports, keeping track of industrial food processing technology and the
companies competing with neighbouring countries on food production. In Figure 6.15, it can be observed
that the ‘agree’ and the ‘strongly agree’ dominate the responses. That means the ‘strongly agree’ and
‘agree’ responses overwhelmed the three ‘global factors’ questions as observed from the percentage
presentations.
1.68
2
2.24
2.59
1
2
3
4
5
q2.14 Electricity
load shading
hampers the
food processing
business in
Zimbabwe.
q2.15 Electricity
costs are a
drawback to the
food processing
business in
Zimbabwe.
q2.16
Government
taxes are a
drawback to the
food processing
in Zimbabwe.
q2.17 The
government
gives policy
support to the
food processing
sector in
Zimbabwe
Ag
reem
ent
-A
ver
ag
e sc
ore
-D
isa
gre
emen
t
Average agreement score Neutral score

Page 146
Figure 6.15: Percentage responses to ‘global factors’ questions
Analysis shows that significant agreement is indicated for:
The company’s products being of higher quality than imported products [t(146) = -9.025, p < 0.0005]
The company keeping track of global trends in the food processing sector [t(146) = -5.397, p < 0.0005]
The company being able to stand up against competition from neighbouring countries [t(146) = -2.965,
p = 0.004].
From Figure 6.16, it can be observed that all global factors questions had mean scores of<3 that implies
agreement. For q2.18 the mean score was 2.19 and for q2.19 the mean score was2.5 while q2.20 had mean
score of 2.67.
30.6
14.3 18.4
37.4
50.3 40.8
17.015.0
10.2
12.212.2
16.3
2.78.2
14.3
.0
20.0
40.0
60.0
80.0
100.0
q2.18 The company’s
products are of a
higher quality than
imported products.
q2.19 The company
keeps track of global
trends in the food
processing sector.
q2.20 The company
can stand up against
competition from
neighbouring
countries.
Per
cen
tag
e
Strongly agree Agree Not sure Disagree Strongly disagree

Page 147
Figure 6.16: Average agreement scores for ‘global factors’ questions as they compare to the mean
score of 3
Thus according to the results, respondents indicated that the companies’: food products are of higher
quality than imports; kept track of global trends in food processing; and could stand up against competition
from neighbouring countries.
6.7.7 Critical success factors that influence technopreneurship in the food processing
sector
One of the research objectives was, “To examine critical success factors that influence the successful
adoption of technopreneurship in the food processing sector in Zimbabwe.” To fulfil this research
objective, the researcher used a list of 19 critical success factors that included the proposed factors
influencing technopreneurship as presented in Figure 6.17. The elements were presented on a Likert scale
in the form of an importance scale ranging from ‘Not at all important’ through to ‘Extremely important’.
Figure 6.17 reflects that the ‘important’ and ‘extremely important’ dominate the responses. That is,
‘important’ and ‘extremely important’ responses had the majority responses of almost 50% each. That
implies that the respondents viewed each of the key success factors as important. However, the responses
have to be statistically quantified.
2.19
2.52.67
1
2
3
4
5
q2.18 The company’s
products are of a
higher quality than
imported products.
q2.19 The company
keeps track of global
trends in the food
processing sector.
q2.20 The company
can stand up against
competition from
neighbouring
countries.
Ag
reem
ent
-A
ver
ag
e sc
ore
-D
isa
gre
emen
t
Average agreement score Neutral score
Page 148
Figure 6.17: Percentage responses to ‘critical success factors’ questions
Table 6.9 shows that all 19 factors had mean scores of > 3 which ranged from 4.04 being the lowest to
4.69 as the highest and mean difference ranging from 1.04 to 1.69.This shows that these 19 factors are
important.
51.0
38.8
40.1
52.4
43.5
51.7
46.3
38.1
30.6
40.1
44.2
27.9
23.1
38.8
32.0
25.9
23.8
29.9
23.8
43.5
53.1
41.5
25.9
49.7
38.8
49.7
56.5
63.9
49.0
45.6
68.0
67.3
50.3
55.8
67.3
69.4
66.0
58.5
0 20 40 60 80 100
q3.1 Internal processes
q3.2 Human Factor
q3.3 Venture Capital
q3.4 Partnerships
q3.5 Government Support
q3.6 Global factors
q3.7 Process Innovation
q3.8 Product Innovation
q3.9 Technological Innovation
q3.10 Business Innovation
q3.11 Daily/Monthly Production
q3.12 Quality of products
q3.13 Minimisation of costs
q3.14 Involvement of all workers
q3.15 Participation of all workers
q3.16 Team work
q3.17 Responsiveness to customer needs
q3.18 Skills development
q3.19 Dynamism to suit situations.
Not at all important Not really important Neutral
Important Extremely important

Page 149
Table 6.9: One sample t-test statistics for key success factors
N Mean Std. Deviation Std. Error Mean
q3.1 Internal processes 143 4.41 .596 .050
q3.2 Human factors 141 4.50 .628 .053
q3.3 Venture capital 137 4.29 .759 .065
q3.4 Partnerships 141 4.04 .764 .064
q3.5 Government support 141 4.49 .556 .047
q3.6 Global factors 141 4.33 .629 .053
q3.7 Process innovation 143 4.50 .529 .044
q3.8 Product innovation 139 4.60 .492 .042
q3.9 Technological innovation 143 4.63 .540 .045
q3.10 Business innovation 143 4.42 .644 .054
q3.11 Daily/Monthly production 140 4.42 .601 .051
q3.12 Quality of products 143 4.69 .495 .041
q3.13 Minimisation of costs 141 4.62 .683 .058
q3.14 Involvement of all workers 143 4.42 .686 .057
q3.15 Participation of all workers 143 4.48 .670 .056
q3.16 Team work 143 4.65 .560 .047
q3.17 Responsiveness to customer needs 143 4.66 .606 .051
q3.18 Skills development 143 4.66 .503 .042
q3.19 Dynamism to suit situations 143 4.41 .866 .072
The analysis shows that significant importance is indicated for all the key success factors with p < 0.0005.
The critical success factors, in order of importance, are shown in Table 6.10. To be noted is the mean of
the lowest important key success factor that is partnerships with a mean of 4.04. The value shows that it
is still not different from most key success factors. Some thing of interest could be the top ten critical
success factors. Also to be noted is the outstanding importance of product quality. Most of the types of
innovation are in the top ten critical success factors that are technological innovation, product innovation
and process innovation.

Page 150
Table 6.10: Ordered average score from most important to least important of the critical success factors
Factor Mean Score
1 q3.12 Quality of products 4.69
2 q3.18 Skills development 4.66
3 q3.17 Responsiveness to customer needs 4.66
4 q3.16 Teamwork 4.65
5 q3.9 Technological innovation 4.63
6 q3.13 Minimisation of costs 4.62
7 q3.8 Product innovation 4.60
8 q3.7 Process innovation 4.50
9 q3.2 Human factors 4.50
10 q3.5 Government support 4.49
11 q3.15 Participation of all workers 4.48
12 q3.11 Daily/MonthlypProduction 4.42
13 q3.10 Business innovation 4.42
14 q3.14 Involvement of all workers 4.42
15 q3.1 Internal processes 4.41
16 q3.19 Dynamism to suit situations 4.41
17 q3.6 Global factors 4.33
18 q3.3 Venture capital 4.29
19 q3.4 Partnerships 4.04
6.8 Feasibility of technopreneurship in the food processing sector
The last research objective was, “To determine the feasibility of technopreneurship in the food processing
sector in Zimbabwe.” To fulfil this research objective, six questions were posed (q4.1 - q4.6) that deal
with local demand, organisational capacity, technological capacity, entrepreneurial skills and competition
in the market. Figure 6.18 shows that the definitely ‘yes’ and ‘yes, to some extent’ dominate the graph.
That means the ‘definitely yes’ and the ‘yes, to some extent’ have the highest responses in the six
‘feasibility of technopreneurship’ questions. That is, there seems to be agreement with the posed questions.
For further analysis, the responses are tested for statistical significance.

Page 151
Figure 6.18: Percentage responses to ‘feasibility of technopreneurship’ questions
The analysis shows that significant agreement is indicated for:
Enough demand for processed food products in Zimbabwe [Z(N = 9) = -2.668, p = 0.008]
The company having the capacity to satisfy the demand [Z(N = 9) = -2.666, p = 0.008]
The company possessing enough technology for industrial food processing [Z(N = 9) = -2.073, p
= 0.038]
The company possessing enough entrepreneurial skills [Z(N = 9) = -2.668, p = 0.008]
The company having the ability to compete with existing food products on the market [Z(N = 9)
= -2.666, p = 0.008]
Analysis shows that a significant positive response is indicated for:
.0
20.0
40.0
60.0
80.0
100.0
q4.1
Is
ther
e en
ough d
eman
d f
or
pro
cess
ed f
oo
d
pro
duct
s in
Zim
bab
we?
q4.2
Does
the
com
pan
y h
ave
the
capac
ity t
o
sati
sfy
th
e d
eman
d?
q4.3
Does
the
com
pan
y p
oss
ess
eno
ug
h
tech
nolo
gy
fo
r fo
od
pro
cess
ing
?
q4.4
Does
the
com
pan
y h
ave
the
capac
ity t
o
acquir
e new
pro
cess
ing
tec
hn
olo
gy?
q4.5
Does
the
com
pan
y p
oss
ess
eno
ug
h
entr
epre
neu
rial
sk
ills
?
q4.6
Can
the
com
pan
y c
om
pet
e w
ith
exis
tin
g f
oo
d
pro
du
cts
on
the
mar
ket
?
Per
cen
tag
e
Definitely yes Yes, to some extent Neutral
No not really No, not at all

Page 152
Whether there is enough demand for processed food products in Zimbabwe [t(143) = -39.620, p
< 0.0005];
The company having the capacity to satisfy the demand [t(143) = -7.274, p < 0.0005;
The company possessing enough technology for food processing [t(146) = -5.238, p < 0.0005;
The company having capacity to acquire new processing technology [t(146) = -3.466, p = 0.001;
The company possessing enough entrepreneurial skills [t(146) = -6.233, p < 0.0005; and
The company having the ability to compete with existing food products on the market [t(144) = -
10.574, p < 0.0005].
From Figure 6.19, it can be observed that all feasibility of technopreneurship in the food processing sector
questions have mean scores of <3, which implies positive responses to all the questions, except q4.4. The
mean score for q4.1 is 1.24, for q4.2 it is 2.19, q4.3; it is 2.48, for q4.4 it is 2.58, for q4.5 it is 2.44 and for
q4.6 the mean score is 1.92.
Figure 6.19: Average scores for ‘feasibility of technopreneurship’ questions
This means that respondents indicated that there was enough demand for locally produced food products;
the companies have capacity and technology to satisfy the demand. Also the companies have the capacity
to acquire new processing technology; the companies have enough entrepreneurial skills and ability to
compete with existing food products on the market.

Page 153
6.9 The relationship between factors that influence Technopreneurship and
the role of technopreneurship in the company
To address the main objective of the study, that is, which factors influence technopreneurship, each of the
items in the factor that influence technopreneurship (namely questions 2.1 – 2.20) were tested to see how
it correlated with the 3 items of question 1 (the role of technopreneurship). This indicated which factors
significantly correlated with the agreement that a factor is used in the company and importance of
technopreneurship/ food processing technology/ entrepreneurship orientation in the company.
For this purpose, Spearman’s correlation was applied. Spearman’s correlation was used instead of
Pearson’s correlation because the scale of measurement of the variables is ordinal and not interval. The
results of the correlation analysis are presented in Table 6.11.

Page 154
Table 6.11: Correlation analysis between internal processes and the importance of technopreneurship
(Question 1 and 2.1 to 2.6).
q1.1 Food
processing
technology
q1.2 Entrepre-
neurship
orientation
q1.3 Techno-
preneurship
q2.1 The company has the
latest food processing
technology.
Correlation Coefficient -.167* -.328** -.075
Sig. (2-tailed) .046 .000 .384
N 143 137 137
q2.2 The processing
machinery is currently fully
utilised.
Correlation Coefficient .002 -.039 .116
Sig. (2-tailed) .984 .647 .170
N 147 141 141
q2.3 Machinery is replaced
as soon as it is old.
Correlation Coefficient -.015 -.112 .048
Sig. (2-tailed) .861 .185 .574
N 147 141 141
q2.4 The company
continuously updates itself
with the latest processing
technology.
Correlation Coefficient -.050 -.018 .097
Sig. (2-tailed) .546 .830 .255
N 147 141 141
q2.5 Changing to new
processing technology is
not a problem for the
company.
Correlation Coefficient .034 .021 .152
Sig. (2-tailed) .687 .802 .072
N 147 141 141
q2.6 The company has a
research and development
(R&D) department.
Correlation Coefficient -.087 .128 .065
Sig. (2-tailed) .293 .130 .444
N 147 141 141
This means that there was a significant negative correlation between the importance of food processing
technology and the company having latest food processing technology. There was significant negative
correlation between the importance of entrepreneurial orientation and the company having the latest food
processing technology. For human factors, there was no significant correlations between q2.1 – 2.6 and
q1.1. However, there was a significant negative correlation between q1.2 and q 2.9 (rho = -0.269, p =
0.001), and between q1.3 and q2.9 (rho = -0.309, p < 0.0005) as shown in Table 6.12. The disagreement
with q2.9 is associated with the importance of q1.2 and q1.3.

Page 155
Table 6.12: A table showing correlation analysis between human factors and the role of
technopreneurship (Question 1 and 2.7 to 2.9)
q1.1 Food
processing
technology
q1.2 Entrepre-
neurship
orientation
q1.3 Techno-
preneurship
q2.7 Plant engineers have
full knowledge of the
processing machinery.
Correlation Coefficient -.039 -.124 -.097
Sig. (2-tailed) .640 .142 .253
N 147 141 141
q2.8 The company
continuously trains its
workers.
Correlation Coefficient -.050 .011 .108
Sig. (2-tailed) .544 .896 .203
N 147 141 141
q2.9 The workers support
the organisation’s vision.
Correlation Coefficient -.019 -.269** -.309**
Sig. (2-tailed) .823 .001 .000
N 147 141 141
This means there was a significant negative correlation between the importance of entrepreneurial
orientation and the workers supporting the organisation’s vision. There was also a significant negative
correlation between the importance of technopreneurship and the workers supporting the organisation’s
vision.
For venture capital and partnerships, there were no significant correlations.
For government support, there were no significant correlations between q2.14 - q2.17 and q1.1 and q1.2.
There was only negative correlation between q1.3 and q2.17 (rho = -0.205, p = 0.015 as shown in Table
6.13.

Page 156
Table 6.13: A table showing correlation analysis between government support and the importance of
technopreneurship (Question 1 and 2.14 to 2.17)
q1.1 Food
processing
technology
q1.2 Entrepre-
neurship
orientation
q1.3 Techno-
preneurship
q2.14 Electricity load
shedding hampers the
food processing business
in Zimbabwe.
Correlation Coefficient .123 .052 .082
Sig. (2-tailed) .137 .544 .337
N 147 141 141
q2.15 Electricity costs are
a drawback to the food
processing business in
Zimbabwe.
Correlation Coefficient .115 -.068 -.022
Sig. (2-tailed) .165 .424 .795
N 147 141 141
q2.16 Government taxes
are a drawback to the
food processing in
Zimbabwe.
Correlation Coefficient .041 -.100 -.098
Sig. (2-tailed) .624 .243 .255
N 143 137 137
q2.17 The government
gives policy support to the
food processing sector in
Zimbabwe.
Correlation Coefficient -.099 -.155 -.205*
Sig. (2-tailed) .234 .067 .015
N 147 141 141
This means there was a significant negative correlation between the importance of technopreneurship and
the government giving policy support to the food processing sector in Zimbabwe.
As for global factors, there were no significant correlations between q2.19 to q2.20 and q1.1 to q1.3. There
was, however, a negative correlation between q2.18 and q1.3 (rho = - 0.198, p = 0.018.) as shown in Table
6.14.
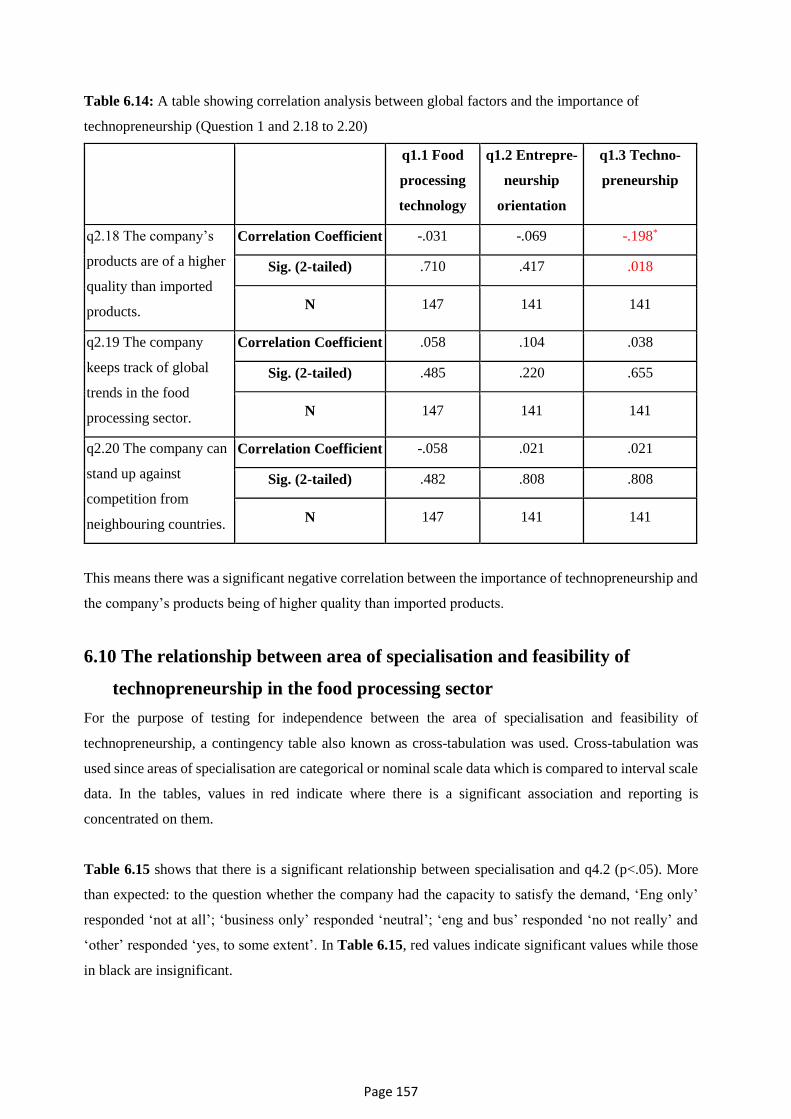
Page 157
Table 6.14: A table showing correlation analysis between global factors and the importance of
technopreneurship (Question 1 and 2.18 to 2.20)
q1.1 Food
processing
technology
q1.2 Entrepre-
neurship
orientation
q1.3 Techno-
preneurship
q2.18 The company’s
products are of a higher
quality than imported
products.
Correlation Coefficient -.031 -.069 -.198*
Sig. (2-tailed) .710 .417 .018
N 147 141 141
q2.19 The company
keeps track of global
trends in the food
processing sector.
Correlation Coefficient .058 .104 .038
Sig. (2-tailed) .485 .220 .655
N 147 141 141
q2.20 The company can
stand up against
competition from
neighbouring countries.
Correlation Coefficient -.058 .021 .021
Sig. (2-tailed) .482 .808 .808
N 147 141 141
This means there was a significant negative correlation between the importance of technopreneurship and
the company’s products being of higher quality than imported products.
6.10 The relationship between area of specialisation and feasibility of
technopreneurship in the food processing sector
For the purpose of testing for independence between the area of specialisation and feasibility of
technopreneurship, a contingency table also known as cross-tabulation was used. Cross-tabulation was
used since areas of specialisation are categorical or nominal scale data which is compared to interval scale
data. In the tables, values in red indicate where there is a significant association and reporting is
concentrated on them.
Table 6.15 shows that there is a significant relationship between specialisation and q4.2 (p<.05). More
than expected: to the question whether the company had the capacity to satisfy the demand, ‘Eng only’
responded ‘not at all’; ‘business only’ responded ‘neutral’; ‘eng and bus’ responded ‘no not really’ and
‘other’ responded ‘yes, to some extent’. In Table 6.15, red values indicate significant values while those
in black are insignificant.

Page 158
There is a significant relationship between specialisation and q4.4 (p<.05). More than expected: to the
question whether the company had the capacity to acquire new processing technology - ‘Eng only’
responded ‘not at all’; ‘business only’ responded ‘yes, to some extent’ or ‘neutral’.
Table 6.15: Cross tabulation for area of specialisation and the company having the capacity to
satisfy the demand
q4.2 Does the company have the capacity to satisfy
the demand?
Total
Definitely
yes
Yes, to some
extent Neutral
No, not
really
No,
not at
all
Area of
specialisation
Engineering
only 9 9 0 4 8 30
Business only 31 18 5 12 2 68
Engineering and
business 10 8 0 6 0 24
Other 6 11 0 0 2 19
Total 56 46 5 22 12 141

Page 159
Table 6.16: A cross tabulation for the relationship between area of specialisation and the company
having the capacity to acquire new processing technology
q4.4 Does the company have the capacity to
acquire new processing technology?
Total
Definitely
yes
Yes, to
some
extent Neutral
No, not
really
No, not
at all
Specialisation
Engineering
only 14 2 0 4 10 30
Business only 19 17 10 21 2 69
Engineering and
business 13 1 3 7 2 26
Other 8 3 0 6 2 19
Total 54 23 13 38 16 144
6.11 Representation of areas of specialisation
To test whether the specialisation areas are equally represented in the sample or not, the chi-square
goodness of fit test was used as presented in Table 6.17 and Table 6.18. The result shows that the
specialisation areas are not equally represented in the sample (χ2 (3, N=144) = 420.56, p<.0005).
Significantly more than expected of the sample are ‘business only’.
Table 6.17: Chi-Square tests for whether the areas of specialisation are equally
represented
Observed N Expected N Residual
Engineering only 30 36.0 -6.0
Business only 69 36.0 33.0
Engineering and business 26 36.0 -10.0
Other 19 36.0 -17.0
Total 144

Page 160
6.12 Summary
In this study data analysis was done through one sample t-tests (SPSS version 17). These would ensure
that reporting concentrated on significant results and left out results that were not significant. Furthermore,
SPSS version 17 was utilised to test relationships between two sets of variables through the Spearman’s
correlation test or the Chi-square test so as to establish any association between the variables. Data was
presented numerically and textually. The guiding format for the presentation of the results was the research
objectives of this study. The demographic data which is found at the end of the questionnaire was
presented first to lead the presentation, as they mainly were control variables. Demographic data
presentation was followed by the presentation of results of the role of technopreneurship in the food
processing sector. The presentation was then followed by results of factors influencing the adoption of
technopreneurship which is the main objective of this study. Results of critical success factors of
technopreneurship and the results of the feasibility of technopreneurship in the food processing sector of
Zimbabwe were presented in that order. Furthermore, some tests were done to determine the relationship
between two sets of variables such as the relationship between the role of technopreneurship and the
factors that influence technopreneurship. In addition, relationships between feasibility of
technopreneurship and the areas of specialisation were also done to further get insight into the results. The
results of relationship tests were presented at the end of data presentation and analysis. For the purpose of
this study, the researcher managed to report on significant results only and left out insignificant responses.
This was to limit the bulkiness of data and not confuse the reader. Data was presented, analysed and
interpreted so as to get the findings of the research accordingly.
The chapter presented and analysed data through tabulation, that is, frequency distribution tables and cross
tabulation as well as pie charts, component bar charts and line graphs. The analysis was done through
descriptive statistics such as percentages, arithmetic means, standard deviation and mean deviation. Lastly
inferential statistics were used such as one-sample t-tests, cross-tabulation and chi-square tests. Now the
analysed data is given more meaning by discussing the results in the next chapter.
Table 6.18: Test statistics for the Chi-sSquare test
Specialisation
Chi-Square 42.056
df 3
Asymp. Sig. .000
a. 0 cells (.0%) have expected frequencies less than 5.
The minimum expected cell frequency is 36.0.
Page 161
CHAPTER 7: DISCUSSION
7.1 Introduction
It can be appreciated that the previous chapter reported the results as they were. A presentation, analysis
and interpretation followed, but this did not give sufficient meaning to the gathered data. There is still a
need to take the data further, compare it with other empirical and theoretical findings in other research
studies locally, regionally and globally. The discussion in this chapter puts the results into perspective.
In this chapter, the results were discussed about the Zimbabwean food processing sector and compared to
other economies as presented in the literature. The discussion was presented regarding the research
objectives of this study and the layout used in the previous chapter. It covers issues like the importance of
technopreneurship; factors influencing technopreneurship; critical success factors for technopreneurship
and the feasibility of technopreneurship in the food processing industry in Zimbabwe. The chapter
criticises the results as comparing and contrasting it with recent findings by other researchers in related
literature.
7.2 Demographic details
In this study, five sets of variables were used to demographically describe the target respondents. The
demographic variables included: area of educational specialisation; position at the workplace; the
department in which the respondent worked, gender and the highest level of education of the respondent.
The major purpose was to ensure sample representation of the respondents. In this case, the researcher
had no problems regarding coverage of the population except the response rate being lower than the target.
However, the final sample size was substantial enough (147) to achieve the objectives of the research. The
reasons for the low response rate include:
Gatekeepers’ consent
Some of the gatekeepers denied access into their companies, even some of those who had previously
signed the gatekeepers’ consent letter during ethical clearance. Some simply indicated that according to
their policy they do not accept private researchers and if they want research to be performed, they engage
their own. Those who had previously endorsed the gatekeeper’s letter indicated that the researcher was
late and needed to make another arrangement later when there is an opportunity. Other gatekeepers just
continuously postponed to the frustration of the researcher. In fact, there are no good relations between
academic institutions and industry in Zimbabwe.

Page 162
Low staff morale
The other factor was the low morale in the industrial workforce. The Zimbabwean industry was under
threat of the economic hardships. The economic challenges led to a massive closure of companies and
retrenchment of thousands of workers as explained in chapter 2. As a result, some workers refused to
participate or simply did not return the questionnaire.
The researcher engaged different strategies like multiple distribution modes, snowball approach and the
use of leads and references to secure the 147 response rate from the 250 distributed questionnaires. Thus,
the researcher was guided by two major issues, that is, the ethical research standards and the adequate
sample size of at least 200 as determined by abstract approaches. It can be indicated that sample size is
determined by considering the population size, the size of population variance, research costs and degree
of precision required in the research (Kothari 2010; Shukla 2008). Both qualitative and quantitative
considerations were considered to determine the sample size but the ethical consideration of the
gatekeeper and the respondents’ consent ultimately determined how large the sample size was.
The demographic variables in this study included: gender, the area of specialisation, department, position
and level of education. These can now be discussed one after the other and their relationship with other
variables in the results.
7.2.1 Gender
Gender was used as a control variable of employees in the food processing sector. This was used to ensure
the validity of the results and monitor the representativeness of the sample. Results reported that 68%
were male while about 32% were female. This can be regarded as a correct reflection of the population
composition of staff regarding gender in the food processing sector. That is compared with ZIMSTAT
(2015) labour statistics in the industrial sector which stated that the composition is 72% male and 28%
female.
7.2.2 Area of Specialisation
“Area of specialisation” had four categories, namely, engineering only, business only, both business and
engineering and others. The idea behind the categories was to determine the skills in possession by the
respondents. Skills are important since technopreneurship is an area of study that consist of both aptitude
and knowledge and could further assist to discuss the human factors influencing technopreneurship. The
results showed that almost half the respondents (47%) indicated that they were specialists in business
while one fifth (20%) were specialists in engineering, and also almost one-fifth (18%) were both
engineering and business specialists. Some 13% were others which included information technology and
supply chain specialists who thought they were none of the specified. This can be viewed as the

Page 163
composition of most manufacturing industries, regarding areas of specialisation. A chi-square goodness
of fit test revealed that areas of specialisation were not equally represented in the study. The only area of
specialisation that was significantly represented was business only. Regarding training and development,
this is the scenario, where in colleges and universities in Zimbabwe the majority enrolment is in business
studies and the other areas of study are a minority. This could have connotations to business attitude or
reward systems in the industries. The idea behind technopreneurship views the above situation as not ideal
for a technopreneurial organisation. The issue of specialising in any area is not desirable for
technopreneurs. Those who combine both business and engineering are close to becoming skilled
technopreneurs (Harlanu and Nugroho, 2015). Thus, the interplay between technology, entrepreneurship
and innovation should be taken as the lifestyle for economic growth and development (Kwa et al., 2014).
Technically, business is not entrepreneurship, and neither is engineering technology. The terminology was
only used in the questionnaire to make it easier for respondents.
7.2.3 Respondent’s department
A department of the respondent is the company unit responsible for a specific function that contributes to
the overall goal of the organisation. Department of the respondent was also used as a control variable so
as to ensure departmental representativeness. Departmental representativeness also enhances the validity
of the study results. Since the nomenclature of departments varies from organisation to organisation, the
researcher simplified the matter by using generic classifications like administrative, engineering or support
staff. Results reported that the majority (47.2%) of the employees worked in the administrative
departments, followed by engineering departments with 38.2% and lastly support services with 14.3%.
The results are to some extent consistent with the composition of staff at most of the organisations with
the majority of administrators having a business specialisation. However, it is possible to have
administrators with engineering qualifications or both. A comparison of positions and departments may
also be necessary to verify consistency. Results reported that the majority of respondents were from
middle management, that is, 36.7% and first-line management, that is, 38.8%. Most of the respondents
came from administrative departments, that is, 46.3% followed by respondents from engineering
departments at 37.4%. Thus administrative duties are assumed mostly by middle and top management.
Engineering duties are carried out by first-line managers while support staff carry out non-managerial
responsibilities. Thus again the results are consistent.
7.2.4 Educational level
The level of educational attainment attempts to establish the amount of knowledge acquired by employees
in the companies. Areas of specialisation assisted in determining the skills available in the food processing
sector and the levels of education assisted in further determining the extent to which the employees were
professionally trained. The majority of employees employed by the companies in the food processing

Page 164
sector can be viewed as professionals with degrees and diplomas. Many can be expected from such
employees regarding creativity and innovativeness because of the knowledge and skills they possess.
However, that could depend on how and where the people were trained; that is, the educational thrust or
orientation that can be theoretical or applied. It is also important to note how gender composition and
levels of educational attainment compare. According to ZIMSTAT (2015), 2014 labour statistics shows
that 57% of the professionals were male while 43% were female. This, to some extent, compares with the
results of this study that had 68% male and 32% female. This also has an implication to the validity of the
results of the study.
7.2.5 Positions at work
Positions at workplaces represent the amount of responsibility and amount of influence respondents have
on organisational decision-making. Positions were classified regarding organisational hierarchy and
included top management, middle management, first-line management and non-managerial employees.
Non-managerial employees include practitioners like scientists and technicians. It was reported in the
results that the majority (39.9%) of respondents were first-line managers, followed by middle management
(37.8%); non-managerial level (16.3%) and top management (5.4%). The responses seem to fit an
organisational setup where top management should be the minority, specialised support staff who are non-
managerial are the second minority while the majority being supervisors and middle managers the second
majority. Positions at work were used as a control measure in the study to ensure a range of positions are
covered like managers, administrators, scientists, engineers and technicians as specified by the
inclusion/exclusion criteria.
7.3 The importance of technopreneurship in the food processing sector
The original intention in this objective was ‘to assess the importance given to technopreneurship by the
food processing sector’. It was taken that the importance attached to what were termed the facets of
technopreneurship would indicate how technopreneurship would be able to play its role. The facets include
industrial food processing technology, entrepreneurial orientation and technopreneurship. In this case, the
‘role’ refers to the part played or the function or the purpose served by technopreneurship in the
organisation. Reza and Mona (2014) held that in the current world of the massive population, food
processing technopreneurs have turned to technopreneurship to be and remain competitive in the market,
as well as being able to meet the growing food demand. Given that, from the results, significant importance
was indicated for technopreneurship and its facets; that is, food technology processing and
entrepreneurship orientation. It could, therefore, be said that technopreneurship is valued in the food
processing sector and it plays an important role in food processing. The role, in this case, referred to the
part played by technopreneurship in the food processing sector and this was judged from the importance
assigned to technopreneurship by the companies. The researcher used the SPSS version 17 Spearman’s

Page 165
correlation analysis to test the relationship between the importance of technopreneurship and areas of
specialisation. There were no significant associations between the importance of technopreneurship and
other human factor elements. The results indicated that there was a significant negative correlation
between the importance of entrepreneurial orientation and the workers supporting the organisational
vision. In corporate entrepreneurship employee support is a vital element for the success of the
organisation. However it is a function of various elements. Hefti and Levie (2015) advocate for vision
casting and signalling in entrepreneurial leadership so as to communicate organisational vision to the
leader him/herself, the team of founders and the key organisational stakeholders. The results indicated that
there was a significant negative correlation between the importance of technopreneurship and the workers
supporting organisational vision. According to Hanks and McCarrey (2015) there is a five-part strategy
for expanding organisational vision and this consists of: getting to know the territory; recognising the
inevitability of change; revising vision in anticipation of expansion; updating the business plan; and
sharing the vision at every appropriate opportunity. A shared vision attracts enough support to take the
organisation to greater heights.
Results showed that there was a significant negative correlation between the importance of industrial food
processing technology and companies having latest food processing technology. That means that there
was association between the importance of industrial food processing technology and the acquisition of
latest food processing technology. Results also showed that there was a significant negative correlation
between the importance of Entrepreneurship orientation and companies having the latest food processing
technology. That is, in addition there was association between entrepreneurship orientation and the
acquisition of the latest industrial food processing technology. The major issue here is innovation in
technopreneurship. In Iran, Nejad and Zarei (2015) also discovered a direct relationship between
innovation strategy and the competitiveness of business. Innovation is part of both entrepreneurship and
technological advancement that amounts to technopreneurship. In this case, the importance of industrial
food processing technology in the Zimbabwean industry determines the competitiveness of the industry
against neighbouring countries. In particular, technological innovation and business innovation also taken
as part of the key success factors in the results and played a pivotal role in determining the competitiveness
of the Zimbabwean industries against neighbouring countries.
Correlational results also show that there was a negative correlation between importance of
technopreneurship and the government giving policy support to the food processing sector. That means
there was association between the importance of technopreneurship and the government’s role of giving
policy support to industry. Technopreneurship is taken to be both a strategic guide and an economic policy
guide for modern economies and food processing technopreneurs (Reza and Mona, 2014). Thus, in this
case, it can be noted that the role of technopreneurship is at both macro and micro level. At the macro
level, it is viewed as guidance to policy makers as they draw economic policies in progressive

Page 166
communities. It can be adopted as an economic development policy through guiding the industrialisation
process of an economy (Ajagbe et al., 2015) while at the micro level it assists entrepreneurial managers
to make decisions so as to survive in the highly competitive global village, as well as meeting quantity
and quality product demands and capitalising on the prevalent new business opportunities. Kwa et al.
(2014) stress that underdeveloped and developing nations should realise the urgent need to recognise
technopreneurship as a lifestyle among its citizens; and take it as a fulcrum of economic development
through the interplay of science, technology and entrepreneurship; so as to make technological innovations
valuable in the context. Therefore, the results of the study also confirm the technopreneurial orientation
as a modern and important concept for economic development.
Lastly there was a negative correlation between the importance of technopreneurship and the Zimbabwean
companies being of higher quality than imports. There was an association between the importance of
technopreneurship and the superiority of locally produced food stuffs over imports. Off hand, a
technopreneurial opportunity can be perceived from this result. A competitive edge of local companies
over imports can be derived from adopting technopreneurship (Nejad and Zarei, (2015).
7.4 Factors that influence successful adoption of technopreneurship in the
food processing sector
The examination of the factors influencing the adoption of technopreneurship was the major objective of
the study. Based on empirical research and theoretical literature, a conceptual framework was proposed
which proposed such issues as internal processes, venture capital, human factors, global factors and
partnerships as influencing technopreneurship.
Reza and Mona (2014) concluded that the main factors influencing the technopreneurship process of the
Iranian nano-food industry included organisational factors, environmental factors, institutional factors,
technological factors and individual factors that are shown in the new conceptual model of the
technopreneurship process. The factors seem to be general and not specific, that is, they seem to be similar
to the traditional business environmental forces. However, the factors are interesting since they refer to
the subject matter of the study that is technopreneurship though in a different specialised area. These can
be contrasted to CZI (2014) factors that affected business operations in Zimbabwe, which include: access
to financing; policy instability; inadequate supply of infrastructure; inefficient government bureaucracy;
corruption and restrictive labour regulations. On the other hand, Ajagbe et al. (2015) concluded that
barriers hindering innovation activities in the Malaysian industries were cost factors; knowledge factor;
market factors; attitude of personnel towards change; regulatory factors and public policy. Another
important factor was that there is no need to innovate as a result of earlier innovations.
Page 167
7.4.1 Internal processes
Velikova et al. (2014) emphasised the definition of business processes as a starting point of executing a
technology-oriented innovations of an industrial organisation. Organisational processes are summarised
as going through the idea, idea realisation, financing and commercialisation (Velikova et al., 2014). The
results indicated that of the six internal processes asked about, three of them had a significant
disagreement, which are full utilisation of current processing machinery, the replacement of machinery as
soon as it is old and changing to new processing technology not being a problem to the companies. Of the
six, only one of the companies has a research and development department and had significant agreement.
Machinery capacity utilisation
Thus, in general, food processing technopreneurs are not fully utilising its current processing machinery.
This refers technically to capacity utilisation. CZI (2014) also concluded that manufacturers were not fully
utilising capacity owing to such factors as low local demand; working capital constraints; competition
from imports; antiquated machinery and machine breakdowns; drawbacks from the current economic
environment; high cost of doing business; shortage of raw materials and power and water shortages.
Technopreneurs can be viewed as opportunity perceivers, pursuers and exploiters. Memon et al. (2015)
hold that technopreneurs are technically skilled and opportunity spotters in high-value-added products
and/or processes. This is a behavioural perspective of technopreneurship. Capacity can be viewed as an
opportunity for innovative companies especially in light of the prevailing demand for locally made food
products. That is, technopreneurship has an innovation element which includes process innovation;
product innovation; technological innovation, and business innovation. Innovation can convert any
challenge to an opportunity. There are challenges to capacity utilisation in the Zimbabwean manufacturing
industry which includes the industrial food processing sector, and through innovation, these can be
exploited as opportunities. This can be supported by Fynes et al. (2015) who concluded that absorptive
capacity enhances mass customization capabilities. Mass customization is viewed as involving the
satisfaction of customer demands in different fronts; that is, product quality; quantity and variety; and
requires not only advanced manufacturing technologies, but also tailormade operational capabilities
(Fynes, 2015).
Replacement of old processing machinery
One of the variables measured in internal processes was the company innovation through the company’s
tendency of replacing ageing equipment. The questions posed asked whether the company replaced the
processing machinery as soon as it became old. The innovativeness of a company was measured by the
company’s replacement of processing machinery as soon as it is deemed obsolete (Nejad and Zarei, 2015).
The absorptive capacity already looked at as the ability of an organisation to adopt new technology as a
competitive advantage (Duchek, 2013). The concept of absorptive capacity was also extended by Fynes
Page 168
et al. (2015) as it included different processes of absorptive capacity which include: knowledge
acquisition, knowledge assimilation and knowledge application. Thus, the food processing technopreneurs
may be lacking all these absorptive capacity processes that have implications on their innovativeness.
Furthermore, a company’s production knowledge determines the chances of the new product introduction,
that is, process improvements facilitate product innovation (Machikita and Ueki, 2015).
Challenges of replacement of old processing machinery
There was a need to establish whether the companies had challenges in the replacement of obsolete
processing equipment. It was reported that the companies had challenges in the ability to replace old
processing technology. Such challenges can be addressed as suggested by Lungeanu et al. (2015) who
moved that companies with a financial slack can respond to issues of poor innovation by diversifying
technological sourcing vehicles. That is, a company with some financial slack can adopt different
technology sourcing strategies in a make-or-buy decision that include: the sole approach; alliances or joint
effort; and acquisition (Lungeanu et al., 2015). However the challenges of acquiring new processing
technology can point to other factors that influence technopreneurship, such as government support,
partnerships and global factors.
The company’s internal Research and Development Department
On the other hand, the significant agreement is indicated for the company having a research and
development (R&D) department. This is in line with the assertion by Memon et al. (2015) who hold that,
technopreneurs emphasise innovation and invention in their business approach as they deploy a significant
percentage of investment on R&D and “use a relatively high percentage of scientists and engineers in their
workforce, and compete worldwide”. The R&D department is expected to behave as knowledge
entrepreneurs. Memon et al. (2015) look at knowledge entrepreneurs as “being capable of producing and
using intellectual assets of self for the growth of new start-up or services that can later guide entrepreneurs
to prosperity and wealth creation of community and provide better and superior services”. Research is
worthless if it ends at research, without implementation.
The development part means that the knowledge created by research has to be utilised to create knowledge.
This is the essence of academic entrepreneurship (Kakava, 2013). Thus, while organisations may have
R&D departments, the impact of such departments should be felt by solving business challenges through
innovative means. Research should solve industrial challenges and thereby achieve developmental goals.
Apart from the company’s R&D department, collaboration could be sought with R&D institutions. R&D
can be enhanced through industry and universities’ collaboration as universities apply and acquire patents
and generate science and technology revenue through licencing and commercialisation of their research
output. This is also an area of government support as expressed by Wong (2015) where the Singaporean
government in their initiative to develop a life science industrial cluster in Asia took a leading role and
Page 169
created a technopreneurial culture. Research requires funding and normally no private organisation may
sustain a viable R&D department on its own as this is funded by government efforts (Ajagbe et al., 2015).
7.4.2 Human Factors
The human factors encompassed knowledge of processing equipment, human capital development and
employee patriotism. From the findings, all three of the aspects had a mean score less than three which
imply agreement. Perhaps this was the case given that it pertained to workers who happened to be the
respondents.
Processing technological knowledge
The analysis shows that significant agreement was indicated for plant engineers having full knowledge of
the processing machinery. In this study, the main technology under consideration is manufacturing
technology or industrial food processing technology in particular. As such it is assumed that the plant
engineering skill is equivalent to the technological skill that was being sought by the quest. Thorsteinsson
and Olafsson (2015) considered technological skills as, “psychomotor skills that are an important element
of technical thinking and understanding and such skills include kinesthetic capability and everyday
intellect.” It is noted that engineers have the required technological skills; however it seems that the factor
may not achieve much if it is not backed by other factors influencing technopreneurship. Furthermore, the
engineers may have full skills and knowledge of outdated equipment. Kabukcu (2015) advocates for
creativity and innovation, as well as an entrepreneurial mind required for managers in the industry. This
is so because industrial food processing technopreneurs are not doing well in Zimbabwe with at least 70%
of the food products on the market being imports.
Human factor development
The results indicate that the companies in the industrial food processing sector in Zimbabwe continuously
train their workers. It is assumed that when workers have enough knowledge and skills for their work,
they are motivated and likely to have a sense of belonging. Training with regards to the tasks to be
executed and clarifications about outcome expectations was found to be an important element of creating
a workforce that delivers quality to the customers (Cook and Chaganti, 2015).This is in line with the
general strategy that if workers are happy that will naturally spill over to the customers hence leading to
the organisation achieving its goals (Guchait et al., 2015). The issue of satisfied employees leads to the
next item of workers supporting the organisation’s vision.

Page 170
Company employee support
Results indicated that workers in the food processing sector support their organisation’s vision.
Organisations can have corporate visions, but may lack shared vision. A shared vision is influenced by
affective commitment, effective communication and intrinsic motivation (Smutkupt, 2015). On this note,
food processing technopreneurs are expected to do well given the support they receive from the workers.
Studying the “workplace concept development towards optimal work support in knowledge-intensive
organisations”, Keinänen (2015) concluded that to maximise potential from the workers, organisations
should consider physical dimensions, social dimensions, virtual dimensions, and sustainable dimensions
that influence people at their workplace. Furthermore, market orientation has a bearing on the support that
employees give to their organisation. Roghie et al. (2015) examines market orientation as the positive
sentiments that employees have about their job.
7.4.3 Venture capital
Venture capital, in this case, covered two aspects that included: access to venture capital loans and local
and international venture capital sourcing. Findings showed that the questions had a mean score of less
than three which implies agreement. That is, the employees of the companies indicated the companies had
access to venture and collaborated with internal and external venture capitalists. Of course, one of the
factors influencing the responses here is that in most cases employees would not believe that their
organisation has no access to funds since this would mean that they should be retrenched.
Venture capital loans
The analysis shows that significant agreement is indicated for the company having access to venture
capital loans. The issue of venture capital can also have support from policy-makers to encourage
technopreneurs in specific areas which they deem to be critical (Klingler-Vidra, 2015). Ajagbe et al.
(2015:210) state that “the establishment of various agencies to support and finance researchers at
universities and research institutes capable to grow Technology Based Firms was due to the Malaysian
government’s recognition of Technology Entrepreneurship as an avenue to develop the economy
industrially”. Thus, funding can, apart from being attracted from private sources, be obtained by
governmental policies designed towards supporting technopreneurship as shown by the Malaysian
government. Velikova et al. (2014) investigate financing aspects of innovations only as being insufficient
but at funding the whole process until commercialisation.
Relations with venture capitalists
Results show that companies in the food processing sector endeavoured to create relations with local and
foreign venture capitalists. According to Wonglimpiyarat and Khaemasunun (2015), upcoming economies

Page 171
can adopt the triple-helix model of innovation financing systems. The model allows the financing system
to tap potential from the three arms, which are, the government, the universities and the industry. Other
governments like the Singaporean government adopted a Technopreneurship Investment Fund (TIF) to
promote industrial development through technopreneurship (Klingler-Vidra, 2015). Thus, the financing
of technopreneurial activities require policy intervention as well. According to Mani (2004), nations like
Singapore and Malaysia adopted three types of financial instruments, which are: research grants, venture
capital and tax incentives.
7.4.4 Partnerships
Partnerships, in this case, were studied through finding out whether the companies had foreign
partnerships or links in finance and technology, as well as research and development institutions that
included universities. From the findings, it could be observed that q2.12 had a mean score of >3 which
implied disagreement. The analysis shows that significant disagreement is indicated for the company
having foreign partners in finance and technology. Zinyama and Nhema (2015) concluded that there is the
low uptake of private-public partnerships (PPPs) in Zimbabwe and view PPPs to have the potential to
raise the financial resources to fund projects on infrastructural development such as, “electricity,
telecommunications, transport, water, education and the health sectors.” The PPPs policy in the Zimbabwe
Agenda for Sustainable Socio-Economic Transformation (ZIMASSET), which was the five-year
economic blueprint (2013-2018), lacked a clear supporting legislative and regulative framework hence an
implementation barrier. A triple helix framework can be adopted to complement potential from the private
sector, government and universities (Wong 2015; Mok, 2015). Mok (2015) also supports that the
Malaysian economic development was facilitated by transforming universities and driving them to partner
with industry and commerce to enhance innovation and entrepreneurship for innovation and technological
advancement.
The uniqueness of the Singaporean model of economic development rests in the strengthening of
university enterprise cooperation to attain the goal of promoting innovation and entrepreneurship (Mok,
2015). Also,technology transfers make a lot of sense in trying to benefit from the relationship between
other institutions and industry. Nurdin (2014:2366) looks at technology transfer as “the process of skill,
knowledge and technologies transferring to ensure that scientific and technological development are
exploited for improving new products, processes, applications, materials or services, while technopreneur
(techno-entrepreneurs) use technology to come out with new or innovative products through a process of
commercialization”. Industry collaborating with universities can yield far-reaching results. However the
unfortunate part is that in developing countries, universities and research centres take little or no part in
stimulating the formation of local innovation systems that lead to industrialisation and instead, they are
substituted by large companies that are multinational corporations in most cases (Ferretti and Parmentola,

Page 172
2015). The modern university technopreneurial educational approach can adopt the experiential-learning
approach that enhances the collaboration between universities and industry (Ho et al., 2014). That is, the
experiential-learning approach involves learning by practising in the real-world setup (Ho et al., 2014).
In addition, as a global factor, international co-inventions have become prevalent in the global economy
especially with the advent of communication technology that has simplified communication between
geographically separated groups and individuals collaboration has become important in recent years
(Tsukada and Nagaoka, 2015). Also, according to Lee and Narjoko (2015), technological spillovers can
be enhanced by globalisation through foreign direct investments and international trade backed by sound
policy for innovation and high productivity so as to upgrade economies from low income to high-income
earners.
7.4.5 Government support
In this case, government support was analysed through such government role like infrastructural
development to include a power supply, fiscal policy and economic policy. The results show that all
government support questions had mean scores of <3 that implied agreement. Regarding government
support in this study, the questions were structured in such a way that the issues concerned were asked as
barriers and the respondents concurred that they were barriers to technopreneurship in the Zimbabwean
food processing sector.
Electricity load shedding
The findings indicate that electricity load shedding hampered the industrial food processing business and
furthermore electricity costs were a drawback to the industrial food processing business in Zimbabwe.
These fall under infrastructural development. The results are consistent with conclusions of the annual
survey by CZI (2014). CZI (2014:21) indicating the five most problematic infrastructural challenges that
included: “Power cuts and shortages; Poor road infrastructure; water shortages; inefficient rail network
within the country; and lastly, poor transport Infrastructure for access to ports”. This could reflect that
there are no government initiatives to deal with the challenges. Government initiatives can influence the
success of industrial food processing and other industrial processes in the nation (Kamarudin and Sajilan,
2013; Wong, 2015).
Electricity costs
Results showed that there was significant agreement that electricity costs were a drawback to the food
processing sector in Zimbabwe. The government has a monopolistic right to supply electricity to all users
in Zimbabwe. As such it can peg electricity tariffs at the level they see fit. Currently, the government is
broke and may commercialise electricity supplies leading to the stifling of industrial operations. The

Page 173
supply of electricity in the nation has also massively reduced and the government may charge higher tariffs
in order to discourage consumption of the important commodity. In Malaysia, Shaari et al. (2013)
concluded that causality ran from electricity consumption to economic growth and as such, a policy to
reduce gas utilization would harm economic growth in the nation.
The fiscal policy
The results also indicate that the government taxes were a drawback to the industrial food processing
sector in Zimbabwe. Taxes fall under government fiscal policy. Within the fiscal policy, sectoral support
may be included through exemptions on certain activities or developmental moves of organisations within
the sector. To develop, Singapore had an effective industrial policy (Mok, 2015) and it has to be noted
that the government is the policy-maker.
According to Chinamasa (2015), the Zimbabwean fiscal policy included tax measures imposed to enhance
industry productivity and discourage imports of non-essential imports. However, the same policy has a
chain of taxes as enshrined in the fiscal policy which may be viewed as burdensome such as:
Pay as you earn
Value added tax
Corporate tax
Excise duty
Customs duty
Other direct taxes
Non-tax revenue
Apart from the taxes, there are also other levies and licences required for operation especially in the food
production and enforced by different government departments such as the National Social Security
Authority (NSSA); Aids Levy; medical certificates; health licences; operator’s licence.
The economic policy
Finally, it was found that the government gave policy support to the food processing sector in Zimbabwe.
This could be supported by the issue of Food Security and Nutrition being taken as one of the strategic
clusters in the economic blueprint ZIMASSET (Bonga, 2014).The result could be true on policy
documents but lacking implementation. Bonga (2014) indicates that power generation is among issues of
prioritised infrastructural development policy issues in the ZIMASSET. This is on paper but lacks
implementation support like a legal and regulatory framework. This is so, because of a lack of consistence
between the other three findings with regards to electricity load shedding, electricity costs as well as

Page 174
government taxes as limitations to industrial food processing in the nation. Zinyama and Nhema (2015)
encored that some of the economic policy issues in the blueprint lack a clear legislative and regulative
framework and thus leading to implementation drawback.
Wong (2013) evaluated technopreneurship policy in Singapore and concluded that there was enough
government support which boosted technopreneurship and strengthened the whole process up to the
commercialisation process. The evaluation was based on weighing the efficacy of government support on
promoting technopreneurship in Singapore. Governments may have a clear technology policy like that
relating to technology transfer. Technology transfer according to Nurdin (2014:2366), can take various
forms like, “Foreign Direct Investment (FDI), Joint Venture (JV), Licensing Agreement (LA),
Technological Advisory/Consultant (Technical Assistance) (TA), Technical Staff Training and Education
(TT), Sales/Purchase Equipment or Machineries (S/P), Intellectual Property Right (IPR), and Unlocking
Tacit Technical Knowledge (UTK).”This is a broad perspective that the policy-maker can consider.
To this end, it can be appreciated that the government is the captain of all economic and industrial
activities. In particular, the government determines the relationship and the effectiveness of all economic
activities in a nation. Kassicieh (2015) advocates for joint and harmonized efforts to develop and grow
viable economies through triple-helix (government, academia and industry), the quadruple helix (adding
to the triple helix the culture of the technology sources and users) and the quintuple helix ( adding the
societal need for economic development based on technology and innovation).
7.4.6 Global factors
Regarding global factors, the study considered: local versus foreign products; organisational global trend
information of the company and competition with neighbouring countries. Thus, the forces of
globalisation can be analysed regarding their influence to technopreneurship in the food processing sector
in Zimbabwe.
Local versus foreign products
Analysis showed that significant agreement is indicated for the company’s products being of higher
quality than imported products. This can be viewed as consistent with Makanyeza (2015) who indicated
that the higher the consumer ethnocentrism, the lower the consumer loyalty to imported poultry products
in Zimbabwe, especially given a high level of consumer awareness. As such this gives some competitive
edge to local industrial food processing technopreneurs as their products are perceived to be of higher
quality than imported food products. This could also support the results that the company being able to
stand up against competition from neighbouring countries.

Page 175
Technological global trends
The results also show that food processing companies keep track of global trends. Global trends are part
of the globalisation process. The global trend in technological development is basically through R&D and
technology sourcing between developing and developed countries under the concept of international
technology sourcing (Nepelski and De Prato, 2015). As such, while organisations keep track of global
trends in industrial food processing technology, there may be a need to consider international technology
sourcing with policy support from the government. Without good international relations challenges,
technology sourcing and technology exchange programmes may not work. Government policies should
be compatible with global trends.
The current trend in the food sector is the advent of nanotechnology in foods (Momin and Joshi, 2015;
Var and SagLam, 2015; Keshwani et al., 2015; Neves et al., 2015; Amenta et al., 2015). According to
Momin and Joshi (2015:3), nanotechnology in industrial food processing has several applications which
include: “improved taste, flavour, colour, texture and consistency of foodstuffs, better absorption,
bioavailability of nutraceuticals and health supplements, food antimicrobials development, innovative
food packaging materials with enhanced mechanical barrier and antimicrobial properties, nanosensors for
traceability and monitoring food condition during transport and storage, as well as encapsulation of food
components or additives”. Another global trend is the development of industrial clusters in order to
enhance technopreneurship (Mohan, 2014). Such clusters include: Silicon Valley (USA); Silicon Island
(Taiwan), Multimedia Super Corridor (Malaysia), Silicon Plateau (Bangalore), Silicon Hills (Austin
Texas), Silicon Alley (New York), Silicon Fen (Cambridge, U.K).
Yetisen et al. (2015) hold that high-tech businesses of late have become the driving forces behind
knowledge-based economies’ success stories in the world. As such, companies are to adopt a
technopreneurial corporate strategy if they are to be competitive in the global market. Lastly, Motohashi
(2015) asserted that technological innovation does matter for manufacturing competitiveness.
7.5 Critical success factors that influence the adoption of technopreneurship
in the food processing sector
In this case, critical success factors were not limited to a few factors and were done so as to give
respondents a wider range of choice. It can be noted that the 19 critical success factors used in this study
scored a mean of more than three. That means that all the factors were considered as critical. One would
perhaps want to note the difference between the highest and the lowest score that is 4.69 for product
quality and 4.04 for partnerships, which gives us 0.65. It seems all factors are almost equally critical and
more factors could be added for evaluation.

Page 176
From the results, it was noted that all the 19 factors were taken as critical success factors. The factors were
ordered from most important to least important and the top were found to be: quality of products; skills
development; responsiveness to customer needs; teamwork; technological innovation; minimisation of
costs; product innovation; process innovation; human factors and government support. Kamarudin and
Sajilan (2013:232) concluded that the critical success factors to animation technopreneurship in Malaysia
are: “access to financial resources, talent pool, government’s initiatives; promotion and marketing;
networks and collaboration; IP; content quality; technology; diversification of products; entrepreneurial
skills; and business location.”
Table 7.1: A comparison of food processing sector findings and Malaysian animation sector
Critical Success Factors of
Technopreneurship in the
Zimbabwean industrial food
processing sector
Critical Success Factors of
Technopreneurship in the Malaysian
animation sector
(Kamarudin and Sajilan, 2013)
1 Quality of products Access to financial resources
2 Skills development Talent pool
3 Responsiveness to customer needs Government’s initiatives
4 Teamwork Promotion and marketing
5 Technological Innovation Networks and collaboration
6 Minimisation of costs IP
7 Product Innovation Content quality
8 Process Innovation Technology
9 Human Factors Diversification of products
10 Government Support Entrepreneurial skills
11 Participation of all workers Business location
12 Daily/Monthly Production
13 Business Innovation
14 Involvement of all workers
15 Internal processes
16 Dynamism to suit situations
17 Global factors
18 Venture capital
19 Partnerships
Source: Own compilation from results and literature

Page 177
By comparing the two results, it can be noted that the issue of government support and technology appears
to be valued in both situations. Thus, modern economies should adopt a technopreneurial policy with the
government as the central player through its initiatives of policy formulation and implementation. It can
be summed up by asserting that all other critical success factors are influenced/determined by the
behaviour and attitude of the government towards political, economic and industrial issues.
Harlanu and Nugroho (2015) regard a technopreneur as a person who believes that technology increases
efficiency, productivity, product quality, broaden the market and helps to market the developed product
widely. This view is also supported by Çalışkan (2015) who holds that technology reduces costs and
enhances productivity gains, as well as contributing to the cultural and political development of societies.
Studying the concept of knowledge-based entrepreneurship ecosystems (KBEEs) in Iran; Entezari (2015)
postulates that the process of designing KBEEs is influenced by both actors and factors.The actors include
“academic entrepreneurs, entrepreneurial universities, science and technology parks, knowledge-based
industrial parks, financial institutions and government”; and the factors included: “entrepreneurship
opportunity, entrepreneurial capacity technological learning, entrepreneurial culture, innovation capital,
human capital, social capital, knowledge production, and infrastructure and infostructure and University
- company interactions” (Entezari, 2015:1206). In the case of this study, the actors and factors can be
taken as critical success factors or factors that influence technopreneurship.
7.6 Feasibility of technopreneurship in the food processing sector
The objective of feasibility focused on how possible it may be to implement the concept of
technopreneurship in the Zimbabwean food processing sector. Issues of feasibility included: whether there
was enough demand for local products; the companies having capacity to satisfy the demand; the
companies possessing enough industrial food processing technology; the companies being able to acquire
new processing technology; the company having enough entrepreneurial skills; and lastly the ability to
compete with existing food products on the market. It was observed that all the feasibility of
technopreneurship questions in the food processing sector had mean scores of >3, which implies positive
responses to all the questions. So, according to the respondents, it is feasible to implement
technopreneurial concepts to the food processing sector in Zimbabwe.
Demand for locally made products
Results indicated that there was enough demand for processed food products in Zimbabwe. This is in
contrast with CZI (2014) that indicated that there is low domestic demand in the nation. Perhaps the
difference is because of the target sample. The CZI (2014) survey focused, on the whole, manufacturing
industry while this study focused on the industrial food processing sector. Because of Zimbabwean
consumer ethnocentrism (Makanyeza 2015), questions may be raised regarding why we may say there is

Page 178
low domestic demand. This could require analysis product by product. Thus, in this case, the results are
that Zimbabwean consumers prefer locally manufactured food products to imports, owing to trust they put
in the local food stuff. However Mlambo and Marufu (2015) concluded that it was difficult to establish
consumer ethnocentrism in Zimbabwe given that at least 70% of the retail products on the market are
imports and therefore, consumers are left with no choice.
Capacity to satisfy demand
It was found that the companies had the capacity to satisfy the demand. Capacity, in this case, refers to
the production capacity, as well as the competency to meet the local demand for locally produced food
products. The issue of capacity was discussed under global factors as the researcher examined the capacity
of the company to compete with neighbouring countries like South Africa and Zambia, who are the leading
suppliers of food products in Zimbabwe. However, the issue of satisfying demand may be viewed much
regarding quality and quantity demanded. Perhaps the issue of quality can be in order since the
Zimbabwean market can be viewed as ethnocentric. On the other hand, the issue of quantity is an issue
that requires discussion here since it concerns the issue capacity utilisation and efficiency.
To satisfy the food market regarding quantity demanded is not consistent with other empirical evidence
like CZI (2014). CZI (2014) indicated that manufacturing companies were operating far below the
capacity of an average of 36.3% capacity utilisation. Also, the ZIMSTAT (2015) reports that most
companies in the manufacturing sector operated well below capacity at about 36%. Furthermore,
Chinamasa (2015) acknowledges that there was still under-utilisation of capacity. This can be viewed as
that capacity is there but it is not being utilised because of different Zimbabwean economic challenges
such as infrastructural problems (power and water shortages) and policy inconsistencies as presented by
CZI (2014). If capacity is there but not fully utilised, it amounts to a lack of capacity to operate. It can be
pointed out that companies are incapacitated by the prevailing economic and political challenges
(Mhlanga, 2015).
Industrial food processing technology
There was a positive response to the question that the company had enough technology for food
processing. Perhaps the meaning attached to industrial food processing technology may not be wide
enough for the respondents. According to Poti et al. (2015), industrial food processing can be seen as all
activities that transform all natural or agricultural food produce from the natural state. Wagner et al. (2015)
view technology as a set of tools used to exploit the natural state to enhance human life. The term ‘set of
tools’ can be misunderstood and narrow the scope of technology. Rebentisch and Ferretti (1995) has a
wider view of technology that encompasses not only a set of tools but also procedures, laws, strategies
and so on, designed to solve day-to-day human problems. That means, according to the respondents the
companies have all that it takes regarding machinery, innovation skills and knowledge to the production

Page 179
and distribution of food products. This may be correct, but, it is not consistent with the result that
companies had difficulties in replacing existing equipment. Perhaps the fact emanates from the fact that
industrial food processing technology does not only cover production equipment but also touches
production procedures and formulae. Rodriguez-Gonzalez et al. (2015) acknowledge that the food
industry is continuously developing solutions to: enhance food manufacturing; improve efficiency in
energy use; satisfy consumer demands for shelf-life; natural taste and composition, and preserved healthy
micronutrients. Thus, latest food technologies endeavour to meet engineering; scientific and
entrepreneurial requirements.
Acquisition of new processing technology
Respondents indicated that companies had the capacity to acquire new industrial food processing
technology. The result is also not consistent with results of internal processes that asked whether the
company has problems in changing to new processing technology. However, Haq and Boddu (2015)
indicate that global competition compels organisations to be more responsive and efficient. Latest
technologies have enhanced qualities of quality and efficiency enhancement. Hu (2015) asserts that
success stories of Japan, Taiwan and Korea are based on the graduation from imitation to innovation.
The current trend in technological development is towards nanotechnology even in the food industry
(Kuan et al., 2012; Momin and Joshi, 2015; Var and SagLam, 2015; Keshwani et al., 2015; Neves et al.,
2015; Amenta et al., 2015). One could wonder why they still have old and outdated processing equipment.
Perhaps again, capacity, in this case, was taken to touch several issues to include financially, human capital
and so on. It has to be noted that Dosi et al. (2015) concluded that technological variables such as patents
and investments pose the highest costs to organisations than other organisational cost drivers like labour
costs. Thus, the capacity that industrial food processing organisations have to acquire new technology is
subject to qualification. In any case, Motohashi (2015) asserted that technological innovation does matter
for manufacturing competitiveness. Hence, a food processing company that does not value technological
innovation may not withstand competition in the global village.
Entrepreneurial skills
It was indicated that companies in the food processing sector possessed enough entrepreneurial skills. This
was one of the key questions that measured one of the pillars of technopreneurship. However, the result
is subject to debate and perhaps further assessment. As an entrepreneur, one would want to identify the
evidence of enough entrepreneurs in the food processing sector. Usman and Tasmin (2015) explain
entrepreneurial skills as embedding competencies in such areas as creativity, analytic, motivation,
networking, adaptive and financial prudence. The entrepreneurial skills, in this case, are being viewed
from a trait as well as capabilities or competencies approach. Thus certain competencies should be present

Page 180
for someone to have enough entrepreneurial skills. The entrepreneurial skills are developed and enhanced
by entrepreneurship knowledge and entrepreneurial attitude (Usman and Tasmin, 2015).
For the companies to be said to have enough entrepreneurial skill, this should be evidenced by new
production projects being added to the existing list or replacing some. Chinamasa (2015) indicated that in
2014 the manufacturing sector was characterised by underutilisation of capacity, closure of companies
and introduction of few new companies. In the industrial food processing sector, few new companies and
acquisitions (take-overs) led by Chinese investors could be witnessed in cooking oil production. However,
the rate of reduction in capacity utilisation and company closures is higher than the rate at which new
companies were being opened resulting in overall industrial shrinkage. Also, companies should be
observed to be opportunity conscious rather than threat conscious. Entrepreneurs, in this case,
technopreneurs should be innovators regarding technovation in food processing. They are supposed to
adopt emerging technologies. Rotolo et al. (2015) discern emerging technologies as marked by five
features, namely: radical novelty; prominent impact; coherence; fast growth, and uncertainty and
ambiguity. Entrepreneurial skills give managers the acumen to relay technological and other opportunities,
pursue the opportunities and exploit them at some risk.
Competition against existing food products
Lastly, there was a positive response to companies having the ability to compete with existing food
products on the market. Harlanu and Nugroho (2015) argue that competitive advantage is not only based
on the abundance of natural endowments but on the ability to convert the natural endowments to various
purposes, which is the essence of technological and entrepreneurial innovation and competencies. Perrea
et al. (2015) acknowledge that global technological progress prompts the rise to new and advanced food
manufacturing and processing technologies. This means competition in the globalised market is mainly
based on technological and entrepreneurial capabilities. Abilities, in this case, touch several factors such
as technological skills, strategy, marketing, supply chain management and so on.
Comparative advantage may lead to Zimbabwean companies losing the competition in the production of
foodstuff given the business environment. The factors affecting business operations in Zimbabwe as
outlined by CZI (2014) can lead to food processing companies failing to compete with neighbouring
countries. Industrial operations in Zimbabwe are held back by such factors as a shortage of power and
water as well as ageing production equipment. Perhaps the only opportunity for Zimbabwean industrial
food processing technopreneurs is the ethnocentrism of the Zimbabwean food market. Furthermore,
Motohashi (2015) pointed out that technological innovation is of the essence for manufacturing
competitiveness, especially in the globalised economies where competition is stiff.

Page 181
7.7 The relationship between factors that influence technopreneurship and
the importance of technopreneurship in the company
To answer the main objective of the study, that is, which factors influence technopreneurship, each item
in the factors influencing technopreneurship; all questions in question 2 (2.1 to 2. 20) were tested to see
how it correlated with the three items of section 1, which is the role of technopreneurship. That is, to see
for which factors there is a significant correlation between an agreement that a factor is used in the
company and importance of technopreneurship/ industrial food processing technology/ entrepreneurship
orientation in the company. For this purpose, Pearson’s correlation analysis was applied. This is used since
the Likert scale of measurement of the variables was taken as nominal and the data as categorical.
Industrial food processing technology and latest industrial food processing technology
For internal processes, there was a significant association between “industrial food processing technology”
and “the company having the latest industrial food processing technology”. As such, this could be
indicated that the importance of food technology has a bearing on the company acquiring new industrial
food processing technology. Naturally it should follow that the industrial food processing companies keep
abreast of technological developments by having the latest technology. However, this could be answered
by the fact that it was observed that companies had difficulties in changing from existing industrial food
processing technologies to new processing technology.
To support the association Machikita and Ueki (2015:171) explained that:
“...we ask what drives the innovative capability that comes from the firm-level scores in process
improvements. We find that inter-firm technology transfers from quality-oriented buyers and foreign
knowledge in the managerial class can provide a good explanation of innovative capability well. More
specifically, we find that CEO and factory manager MNE experience plays an important role in increasing
innovative capability. In addition to the impact of CEOs and factory managers, worker-embodied foreign
knowledge functions well to shape innovative capability as long as foreign workers stay in the managerial
class. A capital tie-up with an MNE has a positive and significant impact on innovative capability only
for MNE respondents.”
Thus, the innovativeness of an organisation can depend a great deal on the attitude of the organisational
leader. If the organisational leader is a laggard, it follows that the organisation may not value the
acquisition of new or latest technology leading to the organisation not being competitive.
Entrepreneurial orientation and latest industrial food processing technology
It was also noted that there was a significant negative correlation between, “entrepreneurial orientation”
and “the company having the latest industrial food processing technology”. In principle, there may not be

Page 182
any entrepreneurship without innovation. Further, to that, there may not be innovation without adopting
new technology. Perhaps, the engineers who were held to have enough knowledge and skills of the
companies’ industrial food processing machinery have the knowledge and skills of old and outdated
equipment. This does not function well for technopreneurship. Technological advancement was found to
be a crucial endogenous variable in aggregate production function and it was concluded that technological
progress and innovation in Turkey had a significant effect on economic growth (Adak, 2015). The essence
of innovation viewed as creative destruction is on “discarding the old and familiar for the new and better”
(Markatoua and Vetsikasb, 2015:123). Companies should monitor the life cycle of their technologies and
mercilessly replace them as soon as the world trends have emerging technologies.
Entrepreneurship orientation and employee organisational support
For human factors, there was a significant negative correlation between, “entrepreneurship orientation”
and “workers supporting the organisation’s vision”. This can be observed as an anomaly. It is assumed
that the more the organisation become entrepreneurial, the more support it should get from the workers.
However to some extent, this could be the case given the fact that employee support to an organisation is
a function of several factors that include morale, motivation and patriotism. According to Bircana and
Gençler (2015:1348), “the spread of innovation-based human resources will accelerate by the emergence
of new business areas, knowledge, skills, and expansion of high value-added production”. There is need
of a human resources paradigm shift from the traditional knowledge and skills requirements to a
technopreneurial perspective that suit the current industrial demands in the global village.
Government policy support and role of technopreneurship
Under government support, there was a significant association between, “importance of
technopreneurship” and “the government giving policy support to the food processing sector”. This can
be viewed as interesting. It could be expected that there be a positive correlation between the two aspects,
that is, if technopreneurship would be a success in the given situation. The role of technopreneurship was
viewed as the policy maker’s guide, so if the policy is not in harmony with technopreneurship it may not
be viewed as a well-crafted policy.
Global factors and role of technopreneurship
As for global factors, there was a negative correlation between, “importance of technopreneurship” and
“the company’s products being of a higher quality than imported products.” In this case also, it could be
assumed that quality of products should be associated with technopreneurship since technology may be
assumed to enhance product quality (Harlanu and Nugroho, 2015). So if it were found to be negatively
correlated to the importance of technopreneurship, it may be said not to be genuine quality. However, the
quality of local food products in comparison to imports is a function of several factors.

Page 183
7.8 Relationship between area of specialisation and feasibility of
technopreneurship
The relationship of the area of specialisation and feasibility of technopreneurship is important to
determine the differences in the technopreneurial drive among the employees with different educational
backgrounds.
Area of specialisation and ability to satisfy demand
From the correlation analysis, it was seen that there was a significant relationship between specialisation
and the company’s capacity to satisfy the demand for processed food products in Zimbabwe (q4.2; p<.05).
More than expected: ‘Eng only’ responded ‘not at all’; ‘business only’ responded ‘neutral’; ‘eng and bus’
responded ‘no not really’ and ‘other’ responded ‘yes, to some extent’.
From the previous discussion, the capacity to satisfy demand could be interpreted from the perspective of
technological capacity, financial capacity or other competencies that enable the company to meet the
demand. García-Barriocanal et al. (2012) indicate that organisational competencies could be modelled by
concrete human capacities under certain work conditions. Chong (2013) discusses the importance of
managerial competencies as equally essential for all organisations. Thus, the responses could be based on
the respondents’ assessment of managerial competence of the organisations. On the other hand, the
responses could have been based on entrepreneurial attitude orientation of the respondents. Abdul-Mohsin
et al. (2015) regard entrepreneurial attitude orientation as an evaluation of the chances of success or failure
of entrepreneurial activity. It seems people from different departments have different assessments or
attitude towards their organisational activities. Engineers thought the organisation lacks capacity not
perhaps from the point of view that they lacked technological skill but from the perspective that the
organisation lacks the required modern technology. Engineers had the most negative attitude followed by
those with both engineering and business people towards the organisation’s capacity while business only
neutral.
Area of specialisation and capacity to acquire new technology
There was a significant relationship between specialisation and the company’s ability to acquire processing
technology (q4.4; p< 0.05). More than expected: ‘Eng only’ responded ‘not at all’; ‘business only’
responded ‘yes, to some extent’ or ‘neutral’.
Acquisition of new technology is a function of several factors that include: the organisation’s financial
position and the company’s innovative personality. Engineering staff seemed to be sceptical about the
companies’ ability to acquire new industrial food processing technology while business staff was
optimistic. This is a matter of entrepreneurial attitude.

Page 184
This takes the focus again back to innovativeness and absorptive capacity. Engineers once more seem to
be pessimistic about the companies’ capacity to acquire new industrial food processing technology while
business people are to some extent optimistic. The issue of technopreneurial personality seems to be
playing a big role in this case. Ahmetoglu (2015) indicated nine major entrepreneurial personality traits
that included:
Trait Emotional Intelligence
Core Self-Evaluations
Locus of Control
Primary and Secondary Psychopath
Machiavellianism
Vocational Interests
General Mental Ability
Divergent Thinking
Relevant demographic variables
Espíritu-Olmos and Sastre-Castillo (2015) concluded that personality traits influence entrepreneurial
intentions more than work values. Thus, the entrepreneurial drive is determined by personality traits.
7.9 Summary
The discussion of research results involves a lot of deductions, inductions and abductions. In this study,
it involved comparing and contrasting the findings with other empirical and theoretical findings locally,
regionally, internationally and globally. The researcher’s deductions and views were also dominating the
discussion based on acquired knowledge and principles. However more could be discussed and different
dimensions could be taken given the findings.
All the results of the research objectives of this study were discussed and more insight could be obtained
as the results were compared to literature. Technopreneurship was discussed as playing a pivotal role in
the industrial food processing sector in company strategic and policy guidance. The association between
the role of technopreneurship and such elements as an area of specialisation and feasibility of
technopreneurship were also discussed. The impact and implications of the factors influencing
technopreneurship, that is, human factors, global factors, venture capital, internal processes and
government support were discussed. The pervasiveness of government support was noted from the results
and compared with literature. Key success factors were discussed and compared with other research
results in the theoretical and empirical literature. Feasibility of technopreneurship was discussed and their

Page 185
implication to technopreneurial attitude and behaviour was noted. Nevertheless, for the purpose of the
study, the chapter has enough discussion to create grounds for conclusions and recommendations. The
next chapter covers the research study’s conclusions and recommendations that represent the major
contributions of the study.

Page 186
CHAPTER 8: CONCLUSIONS AND RECOMMENDATIONS
8.1 Introduction
The deductive reasoning begins with theory and gathers facts to test the theory. In this study, there was
no specific theory but some theoretical and empirical findings regarding factors influencing
technopreneurship in different industries. At this point, facts were gathered, analysed and discussed
accordingly. That means conclusions can now be made based on the discussion and recommendations
based on conclusions and acquired knowledge and analysed theoretical and empirical literature.
This chapter aims at concluding the thesis through revealing mainly the research conclusions and
recommendations for different audiences. It starts by restating the problem of the study and aim of the
study. The conclusions per each objective are given followed by recommendations for policy makers,
curriculum developers and industrialists.
8.2 Restating the research problem
The study focused on the factors influencing the successful adoption of technopreneurship in the food
processing sector in Zimbabwe. It was against the background that there is low industrial activity in the
economy while modern concepts like technopreneurship can revive economic and industrial activity. In
particular, the fact that the country is an agriculturally based economy would mean a great deal of value
addition activity to produce food products on the market. However, the retail market was observed to have
about 70% imported products. Technopreneurship was taken as a policy guide to developing most
upcoming economies in the knowledge-based economies. It has been an issue of concern of developing
countries not industrialising or developing in the manufacturing industry. A point in this study was why a
bread basket like Zimbabwe would import 70% of its food products if they can produce locally.
To focus the research the objectives of the study were:
To examine factors that influence the adoption of technopreneurship in the food processing sector in
Zimbabwe.
To assess the importance given to technopreneurship by the food processing sector in Zimbabwe;
To examine the feasibility of technopreneurship in the food processing sector in Zimbabwe;
To test the relationship between the factors influencing the adoption of technopreneurship.

Page 187
8.3 Limitations
The major limitations encountered during the study were:
Delays in the ethical clearance process which lead to respondents resisting the questionnaire that had
sought for permission for circulating in 2014 while data collection commenced in 2015. This reduced
the targeted sample size by a quarter.
The industrial situation in Zimbabwe was not conducive for research since it was so turbulent and
hostile. Companies were closing; some were downsizing leading to massive job losses. Retrenchment
was a threat to most of the employees who were the target respondents who were not motivated and
depressed.
It was difficult to access employees with the questionnaire in most companies who were suspicious
about the research and at times, the gatekeepers would not cooperate.
Although a full-time researcher, the researcher could not get cooperation from the employer who
could not agree to reduce workload and approve study leave as the need arose.
To deal with the limitations the researcher adopted different measures so as to reduce the effect of the
limitations which included:
Use of multiple data analysis techniques which included Wilcoxon’s signed ranks test that eliminated
response bias on questions that pertained to a particular organisation.
Balancing between ethical research standards and the qualitative as well as quantitative sample size
considerations.
The use of leads and snowballing to reach potential respondents to the questionnaire.
8.4 Conclusions
The research conclusions are made on each objective so as to round off the study. Thus, each objective is
the subheading for each set of conclusions. From the findings the following conclusions were reached:
8.5 Conclusion 1: The role of technopreneurship
Technopreneurship and its facets were rated very important in the food processing sector. The two facets
were industrial food processing technology and entrepreneurship. The role of technopreneurship was
concluded to be at two levels, that is, the macro level – for policy makers and the micro level – for
industrialists.
At the macro level, it was concluded that the modern economies are basically knowledge based and
technopreneurship can guide policy makers to make government policy interventions and initiatives to

Page 188
assist technopreneurs in their economies. Blanco (2007) echoed that technopreneurship is regarded as one
of best approaches to economic value creation, growth and development in European economies as it
explores and exploits technology-based solutions. It was observed that without proper government policy
intervention and initiatives, technopreneurship may add no value to developing economies like Zimbabwe.
Such lessons have been learnt from the success stories of the Asian countries. The implication of these
conclusions is that there is a need for a paradigm shift on the part of policymakers who have the duty of
putting policies in place and ensuring that they are implemented. The government spearhead research and
facilitate the required relationship among players to include industry research and developmental
institutions.
At the micro level, technopreneurship was taken to be a strategic guide to modern industrial food
processing technopreneurs. Thus organisational strategy should be technopreneurial, if environmental
dynamics can be exploited. Organisations have to harness new technological breakthroughs in the
industrial food processing area so as to compete in the global village. Thus, the technopreneurial
behavioural pattern can lead industrial food processing technopreneurs to successful production.
8.6 Conclusion 2: Factors influencing technopreneurship
The factors influencing technopreneurship in the food processing sector of Zimbabwe were concluded to
be in six categories. That is internal processes, human factors, venture capital, partnerships, government
support and global factors. From the six factors, the most pervasive was concluded to be government
support. Government support that included policy formulation and implementation and government
initiatives were concluded to influence technopreneurship as well as the other five factors, which include:
internal processes; human factors; venture capital; partnerships and global factors.
8.7 Conclusion 3: Critical success factors of technopreneurship
From the findings, it can be concluded that the success of technopreneurship in the food processingsector
is determined by a multiplicity of factors. All the 19 factors thatwere put to test were found to be a factor
that if not in place, leads to failure in technopreneurship. The factors were the quality of products, skills
development, responsiveness to customer needs, teamwork, technological innovation, minimisation of
costs, product innovation, process innovation, human factors, government support, participation of all
workers, daily/monthly production, business innovation, involvement of all workers, internal processes,
dynamism to suit situations, global factors, venture capital and partnerships.
8.8 Conclusion 4: Feasibility of technopreneurship
From the findings, it was concluded that technopreneurship in the food processing sector in Zimbabwe is
feasible. Results indicated that there was enough demand for processed food products in Zimbabwe; the

Page 189
companies had the capacity to satisfy the demand; the companies had enough technology for food
processing; the companies had the capacity to acquire new food processingtechnology; the companies in
the food processingsector possessed enough entrepreneurial skills and lastly the companies had the ability
to compete with existing food products on the market.
8.9 Recommendations
Recommendations, in this case, are based on the conclusions, empirical and theoretical literature and
knowledge acquired during the period of the study. The recommendations are classifiedas contribution to
new knowledge; recommendations to policy makers, recommendations to industrialists; recommendations
to curriculum developers and R&D institutions and recommendations for further research. Given the
conclusions above, the researcher had the following recommendations to make:
8.10 Recommendation 1: New knowledge
The major contribution to new knowledge was the technopreneurship system. Nacu and Avasilcăi (2014)
stipulate that technopreneurship can be treated as policy, as a system and as individual attitude. From the
study, the researcher looks at technopreneurship as the system that explores and exploits business
opportunities through technological prowess and entrepreneurial knowledge and skills under any
conditions. Technopreneurship operates in any environment that is technopreneurial-opportunity-based.
It is influenced by a multiplicity of factors that can be presented in a model like Figure 8.1.

Page 190
Figure 8.1: The technopreneurship system
Source: Own compilation from the results
The model in Figure 8.1 presents factors influencing technopreneurship from a systematic perspective.
The model can be explained from inside categorised into three layers that are the technopreneurship
process; factors influencing technopreneurship and government support.
(1) Government support
It was established that government support is the most pervasive factor influencing technopreneurship.
The behaviour of the government of any economy was concluded to be the determining factor of other
factors. Thus, it has been placed as the universal force behind all technopreneurial activities. The
government support has been seen to include: the economic policy; robust economic policy
implementation; legal frameworks; government initiatives and infrastructural development as determined
by the ideology of the ruling party determine all the factors and actors influencing technopreneurship.
It is at present held that the government is responsible for creating a conducive atmosphere for all
economic and socio-cultural activities in any nation. The success or failure of an economic system is
Page 191
anchoredin the economic managers and administrators. Thus,in this case, the ZANU PF administration
with its ideologies is largely responsible for any success or failure of the Zimbabwean technopreneurial
operations in the food processing sector and the economy at large. The government’s ability to manage
interior and exterior relationships will determine the impact of:
Internal processes – internal processes are influenced by the government through government
regulations regardinglicences, safety regulations, quality standards and other regulatory measures on
operations and products.
Global factors – global factors that include international relations are spearheaded and regulated by
the government through its foreign affairs department. Foreign policies will determine global
cooperation and alliances and the ability to execute foreign direct investments (FDIs), technological
sourcing and other strategies.
Partnerships – While the government is one of the partners in triple or quadruple helices, it has to be
appreciated that it is the captain of the whole system and determines its relationships with all partners
that are industry, academia and socio-cultural systems. Universities that are the most common run
their affairs based on the given mandate and educational systems. Industries are given industrial
policies to guide their conduct. The socio-cultural systems are developed and influenced by political
systems through the ideologies of the ruling party.
Venture capital – The government policies determine investor confidence and other funding
programmes. Government organises funding support and criteria for different organisations and
projects. They determine the distribution of the government revenue through monetary policy,
subsidies and taxation as they decide on what can be taken as strategic or not to the economy.
Human factor – Human factor development also is one of the policy issues as the government plans
on the skills requirements of the economy. Educational training in schools, colleges and universities
is directly controlled by the government especially in an autocratic system of Zimbabwe.
(2) Factors influencing technopreneurship
The factors influencing technopreneurship have been included as internal processes; venture capital;
human factors; partnerships and global factors. It was noted that the factors influence technopreneurship
as well as influencing each other and all being influenced by government behaviour or support. Thus, the
middle position implies that the factors influence technopreneurship but these are covered by government
support that is the main determinant of how each of the factors influencing technopreneurship function.
(3) The technopreneurship process
The inside area covers technopreneurship viewed as a process with three basic phases that include
perceiving an opportunity; pursuing the opportunity and exploiting the opportunity. The actors involved

Page 192
in the process include industry; government; academics, social and cultural set-ups; that is, from a
quadruple helix perspective.
Perceiving the opportunity
Firstly, a technopreneurial opportunity can be perceived by individuals and groups who have opportunity
receptors or who can identify and define a technopreneurial opportunity clearly. Opportunities arise from
unlimited sources that include all perspectives of technopreneurship such as innovation theories,
technoparks, academic entrepreneurship, technological spinoffs and industrial clusters. The other source
opportunities are economic problems, community challenges and social problems that may give rise to
sociopreneurship, environmental entrepreneurship, green entrepreneurship or ecopreneurship.
Pursuing the opportunity
Next in the technopreneurial process is the drive to pursue an opportunity. Thus, perception brings
awareness and insight that leads to a motive which when it becomes strong enough to push someone to
act or move towards something becomes a drive. That is, technopreneurs are distinguished from non-
technopreneurs by their tendency to act upon an opportunity. The actions involve developing an idea into
a business plan, project plan or written business proposals. Such plans indicate the readiness of the
technopreneur and will attract support from all other stakeholders in the technopreneurial process. Thus,
from this phase resources are mobilised and all desired support is gained.
Exploiting the opportunity
Lastly, the resources and support that has been gained by pursuing the technopreneurial opportunity are
arranged into a technological venture. Successful technological venture creation is determined by the
technopreneurial traits, knowledge and skills of the visionary or technopreneur as well as the strength of
the support from the actors in the quadruple helix set up.
Also to be noted on the diagram is the double headed arrows that are labelled technopreneurship as a
strategic and policy guide. These imply that all actors in the technopreneurship process and system are
supposed to be led by the technopreneurial philosophy. A technopreneurial attitude modifies the
behaviour of governments, industries, academics and socio-cultural systems.
8.11 Recommendation 2: For policy-makers
The policy maker here refers to the government and all its elements which include the executive, judiciary
and the parliament. Other government arms include all ministries and institutions that assist with policy
formulation and implementation. Thus, the policy maker is the authority that is responsible for economic
governance.

Page 193
Policy Support
It was recommended that technopreneurship be taken as the key to the economic development framework.
De Beer et al. (2014:32), “The review suggests that the time is ripe for African policy-makers to seek
more holistic approaches to facilitating innovation and, in turn, to fostering socio-economic development
in African nations”.
While the nation has ZIMASSET as the so-called economic blueprint, there is a need for the government
to have technopreneurial initiatives. Any paradigm shift in an economic system begins with a change in
the mindset of the economic leaders. Success stories of Asian Tigers are based on policy makers being
sincere and designing an economic policy consistent with modern globalisation forces around which they
build a culture. Examples include Singapore (Wong 2015), Indonesia (Harlanua and Nugroho, 2015) and
Malaysia (Ayoib and Nosakhare. 2015; Ayoib and Nosakhare Peter, 2015) who took technopreneurship
as a policy guide for an economic development model and developed a technopreneurial culture around
the policy. Sub-Saharan Africa is to have a paradigm shift and drop traditional and ancient economic
developmental models and cultures which are based on colonial backgrounds and no longer fit into a
modern global system. Current political leadership should be based on the ability to manage relationships
locally, regionally, internationally and globally and not based on pride, revenge, selfish interests and the
inability to prioritise issues.
ZIMASSET is criticised by analysts who view the economic programme as having a lot of inconsistencies
and controversial issues like the Indigenisation and Economic Empowerment Act (IEEA) [Chapter
14:33] which is not in harmony with the promotion of foreign direct investment.
Regulatory framework
The government as the captain of the economic system should be able to offer a legal framework and
regulatory systems that facilitate the implementation of the economic programme. When an economic
programme has been put in place, the government should lead by example through the upholding of the
rule of law to ensure successful implementation of the programme. Stakeholders like the industry,
academia and society would not take the government seriously if they witness such issues like corruption
and uncontrollable government expenditure without any prosecutions. The legal frameworks should
provide for prosecution of any perpetrators of ‘economic crimes’ even if it is the head of state without
fear or favour. African economies fail because leaders are hero-worshipped even if they are corrupt and
dictators to the detriment of the whole system. Thus, no one should be above the law.

Page 194
Quadruple-helix framework
For an economy to succeed there is a need for all players to be active and maximise their potential. Every
economic system hascooperation of all stakeholders or economic players that include the government,
industry, academia and socio-cultural systems. It is again the government that facilitates the
harmonisation and interplay of all stakeholders and members in the quadruple framework (Kassicieh,
2015). Any government that has no cooperation of such members may not succeed in developing the
economy. Here it is a matter of the government’s integrity and ability to manage relationships.
Government initiatives
The government has to make strategic initiatives that include: promoting foreign direct investment;
technoparks; venture incubation centres; value addition; and industrial clusters. The government has to
spearhead all developmental programmes and seek cooperation from other players like industry and the
academia. Without the government initialising all these, otherwise, nothing may be done since there
would be a lack of coordination.
8.12 Recommendation 3: For industrialists
The industrialists here refer to all the primary, secondary and tertiary industrialists. The research results
can be generalised as such. However, the manufacturing (secondary) industry is the one often called the
industry. In this case, industrialists pertain to industrial food processing technopreneurs although the
principles can apply to all industries. Technopreneurship is universal.
The first point is that organisational leadership transformed over years. Initially, economics was leading,
followed by management, followed by strategic management; currently, entrepreneurship is the
organisational leadership acumen that is required to spearhead organisation dynamics. In particular, here
it is advocated that technopreneurship be the aptitude required to lead industries and organisations. It is
recommended that management in the food processing sector be technopreneurial in their skills,
knowledge and behaviour. Also, take technopreneurship as the strategic and policy guide. Industrial food
processing technopreneurs are encouraged to adopt the latest food technologies like the nano-foods and
nanotechnology. This is one of the characteristics of innovators so as to capitalise on the prevalent
opportunities and enhance food production and packaging. Technology has advantages of reducing costs
and to enhance productivity gains as well as contributing to the cultural and political development of
societies (Çalışkan, 2015).
Industrialists should consider effectuation and their technopreneurial orientation. Especially the
organisational Chief Executive Officers (CEOs) should have the technopreneurial acumen. Organisations
in Zimbabwe should leave the appointment of CEOs who have traditional qualifications and skills like
Page 195
chartered accountancy. Such CEOs are not innovative since they are not trained to be innovative, but to
follow myopic accounting standards. CEOs who have entrepreneurial or specifically technopreneurial
thrusts can handle situations in the Zimbabwean industry without much difficulty.
8.13 Recommendation 4: For universities
Private Public Partnerships and Universities
Universities are to be involved in private-public partnerships to contribute to industrial development. In
principle, the modern concept of experiential-learningprogrammes should guide university curriculum
development and education. When universities partner with industry, the synergistic effect will be realied,
that is financially and technologically and universities will have an opportunity to contribute to industrial
development.
Academic entrepreneurship and university spin-offs
Academic entrepreneurship should guide universities as they allocate the available resources towards
research. All university research should end up in venture incubation or license of the patents to
industrialists. The current situation is that the Zimbabwean government has since failed to fund fully
universities so universities should open own income generating projects. That means universities are to
be entrepreneurial in their approach. The criteria ofrating / ranking of universities should change as such.
University Rankings
The criteria ofrating / ranking of universities should change. Universities should not be ranked using
publications only but the registered patents and incubations emanating therefrom. Thus, there should be
an Entrepreneur and Innovative University Index (İskendera and Batı, 2015). It follows that universities
should compete on a technopreneurial basis rather than other traditional variables that are failing to have
a meaningful contribution to economic growth and development.
Academic promotions
Therefore, it automatically applies to academic promotions, in all fields the academic should be rated /
ranked based on contributions to patenting and venture creation.

Page 196
8.14 Future research
The following recommendations are made for further research on:
The business attitudes of local industrial food processing technopreneurs (industrialists) can be
explored more based on the current Zimbabwean political and economic crisis. A question can be
asked: “To what extent do the industrialists envisage any technopreneurial opportunities?”
The diffusion and adoption of technopreneurship as a strategic guide to industrial food processing
technopreneurs is also an issue that requires further study.
The availability of technopreneurial knowledge and skills in Zimbabwe and Africa specifically require
further research.
8.15 Summary
The thesis pertains to the study of factors influencing technopreneurship in the food processing sector in
Zimbabwe. The topic was introduced in chapter one; chapter two presented the situation of the location
of the study; chapter three analysed the subject content and its global application and information; while
chapter four described the perspectives of the subject area. The methodology and methods were presented
in chapter five; with research findings outlined in chapter six and discussed in chapter seven.
This chapter began by a recap of the whole thesis and the limitations of the study. Conclusions were
reached at and presented based on analyses and discussions. Lastly, recommendations were made for all
stakeholders of the study. The next sections present the appendices to cover other pertinent information
that include data tables, the questionnaire and list of references.
The study managed to fulfil all the research objectives thatwere formulated as to: establish the role of
technopreneurship in the food processingsector of Zimbabwe; determine factors influencing
technopreneurship in the food processingsector of Zimbabwe; determine key success factors of
technopreneurship in the food processingsector of Zimbabwe and determine the feasibility of
technopreneurship in the Zimbabwean food processingsector. The original contribution of the study was
mainly in the implementation of technopreneurship in a developing country like Zimbabwe so as enhance
organisational performance thereby developing the economy. How technopreneurship could be applied in
practice; how it works and the influencing factors and an accompanying model to understand the
situational forces in such a developing nation were part of the contribution of this study. The study proves
to be important not just to fulfil Ph.D. study requirements but it attends to a pertinent developmental issue
in developing economies and organisational operational challenges. This study has a direct contribution
to organisational competitiveness, economic development and value addition to academic knowledge
further research.

Page 197
BIBLIOGRAPHY
Abbasi, R. P., Pouri, M. R. M., and Hamidi, F. (2015) Presenting a Conceptual Model of New Product
Development Process in Active Techno-Entrepreneur Ventures. Jurnal UMP Social Sciences
and Technology Management Vol, 3(2).
Abbey, J. (2012) Regions and Clusters as a Focus of Economic Development. Open Stax-CNX module:.
http://cnx.org/content/m43448/1.1/.
Abbott, A. (2015) Teaching Social Entrepreneurship: Business Concepts within Cultural Contexts.
Cuadernos de ALDEEU, 28, 139-154.
Abdul-Mohsin, A., Abdul-Halim,.A., and Ahmad, N. H. (2015). Competitive Intelligence among SMEs:
Assessing the Role of Entrepreneurial Attitude Orientation on Innovation Performance. In
Innovation, Finance, and the Economy (pp. 15-22).Springer International Publishing.
Adak, M. (2015) Technological Progress, Innovation and Economic Growth; the Case of Turkey.
Procedia - Social and Behavioral Sciences, Volume: 195 Pages: 776–782.
Adams, J., Khan, H. T., Raeside, R. and White, D. I. (2007) Research methods for graduate business
and social science students, SAGE Publications India.
Adams, S. and Opoku, E. E. O. (2015) Foreign direct investment, regulations and growth in sub-Saharan
Africa. Economic Analysis and Policy, 47, 48-56.
Adams, S. B. (2011) Growing where you are planted: Exogenous firms and the seeding of Silicon
Valley. Research Policy 40, 368-379.
Africa Development Bank Group, (2015) Zimbabwe Economic Outlook [Online].
http://www.afdb.org/en/countries/southern-africa/zimbabwe/zimbabwe-economic-outlook/:
Africa Development Bank Group. [Accessed 15 October 2015].
Afuah, A. (1998) Innovation management: Strategies, implementation, and profits. , New York, Oxford
University Press.
Aharoni, Y. (2014) The Israeli Economy (Routledge Revivals): Dreams and Realities. Routledge.
Ahmetoglu, G. (2015) The Entrepreneurial Personality: A New Framework and Construct for
Entrepreneurship Research and Practice.

Page 198
Ajagbe, M. A., Isiavwe, D. T., Ogbari, E. M. and Sholanke, A. B. (2015) Financing Early Staged
Technology Based Firms in Malaysia. Research Journal of Finance and Accounting, 6, 210-
221.
Ajagbe, M. A., Ismail, K., Isiavwe, D. T. and Ogbari, M. I. (2015) Barriers to Technological and non-
Technological Innovation Activities in Malaysia. European Journal of Business and
Management, 7, 157-168.
Allen, J., Liptak, K., Guo, J., and Worasinchai, L. (2015) Mail Survey Response Rates in Academic
Research: A Multi-Disciplinary Trend Analysis. In Proceedings of the 1999 Academy of
Marketing Science (AMS) Annual Conference (pp. 250-254). Springer International Publishing.
Allen, T. J. and O'shea, R. P. (2014) Building Technology Transfer Within Research Universities: An
Entrepreneurial Approach, Cambridge University Press.
Amadi-Echendu, J. and Mhlanga, N. M. (2015) On Engineering Assets and Technology Supply
Capacity. Proceedings of the 7th World Congress on Engineering Asset Management (WCEAM
2012), 2015. Springer, 33-42.
Amadi-Echendu, J. and Mhlanga, N. M. (2015) On Engineering Assets and Technology Supply
Capacity. Proceedings of the 7th World Congress on Engineering Asset Management (WCEAM
2012), 2015. Springer, 33-42.
Amenta, V., Aschberger, K., Arena, M., Bouwmeester, H., Moniz, F. B., Brandhoff, P., Gottardo, S.,
Marvin, H. J., Mech, A. and Pesudo, L. Q. (2015) Regulatory aspects of nanotechnology in the
agri-feed-food sector in EU and non-EU countries. Regulatory Toxicology and Pharmacology.
Antoncic, B. and Prodan, I. (2008) Alliances, corporate technological entrepreneurship and firm
performance: Testing a model on manufacturing firms. Technovation, 28(5), pp.257-265.
Aracid, M. M. 2011. The Open Technology Business Incubator as a Positive Environment for
Technopreneurship. In: Edralin, D. M., ed. National Conference on Entrepreneurship and
Innovation 2011, 2011 Barcelo International Conference Center: La Consolacion College
Manila. La Consolacion College Manila and Philippine Academy of Management.
Arezki R, Hadri K, Kuromi E and Rao Y (2012) Testing the Prebish–Singer hypothesis using second-
generation panel data stationarity tests with a break Economics Letters 117, 814–816.

Page 199
Association of University Technology Managers (2013) What is Technology Transfer? USA [Online].
[Accessed Accessed 2 September 2015].
Audretsch, D. and Belitski, M. (2015) Creativity Filter and Start-Ups to Resolve the Innovation Paradox.
Information and Knowledge Management in Complex Systems. Springer.
Audretsch, D. B., Kuratko, D. F. and Link, A. N. (2015) Making sense of the elusive paradigm of
entrepreneurship. Small Business Economics, 1-10.
AUTM (2013) Technology transfer industry shows gains in patents filed and granted, university-created
startups and commercial products; slippage in federal research funding cited
www.autm.net/AUTMMain/media/Resources/Documents/AUTM_FY2013_Canadian_Highligh
ts_no_appendix.pdf
Ayoib, C.A. and Nosakhare Peter, O. (2015) Directors culture and environmental disclosure practice of
companies in Malaysia.
Babbie, E. (2015) The practice of social research, Wadsworth, Cengage Learning.
Backman, M. (2015) Zambia’s currency is falling so fast its president asked the country to pray for it.
Quartz Africa, 19 October 2015.
Badaruddin, M. N., Mohamad, Z. Z., Awee, A., Mohsin, F. H., and Kadir, S. A. (2015) Cyber
Entrepreneurship Ecosystem: Proposed Concept Paper.
Bailetti, T. (2012) Technology Entrepreneurship: Overview, Definition, and Distinctive Aspects
Technology Innovation Management Review
Baiphethi, M. N. and Jacobs, P. T. (2009) The contribution of subsistence farming to food security in
South Africa. Agrekon, 48, 459-482.
Baker, T. L. (1999) Doing Social Research, Boston, McGraw-Hill College.
Baliamoune‐Lutz, M. (2015) Taxes and Entrepreneurship in OECD Countries. Contemporary Economic
Policy, 33, 369-380.
Barkhuus, L. and Brown, B. (2012) The sociality of fieldwork: designing for social science research
practice and collaboration. Proceedings of the 17th ACM International Conference on
Supporting group work, 2012. ACM, 35-44.

Page 200
Bartlett, J. E. and Ik, J. W. K. (2001) Organizational Research: Determining Appropriate Sample Size.
In: Survey Research Information Technology, Learning, and Performance Journal, 2001.
Citeseer.
Baruch, Y., and Holtom, B. C. (2008) Survey response rate levels and trends in organizational research.
Human Relations, 61(8), 1139-1160.
Beckman, C., Eisenhardt, K., Kotha, S., Meyer, A. and Rajagopalan, N. (2012) Technology
entrepreneurship. Strategic Entrepreneurship Journal, 6(2), pp.89-93.
Bhalla, D. (2012) Introduction to SPSS [Online]. Listen Data: Make Your Data Tell a Story. [Accessed
9 October 2015].
Bhalla, D. (2013) Data Analysis Tools: Excel, SPSS or SAS? [Online]. Listen Data: Let your data tell a
story. [Accessed 9 October 2015].
Bhattacherjee, A. (2012) Social science research: principles, methods, and practices, Florida, Scholar
Commons.
Bhupatiraju S, Nomaler Ö, Triulzi G and Verspagen B (2012) Knowledge flows – Analyzing the core
literature of innovation, entrepreneurship and science and technology studies Research Policy
41 1205– 1218.
Bircana, İ. and Gençler, F. (2015) Analysis of Innovation-Based Human Resources for Sustainable
Development. Procedia - Social and Behavioral Sciences, Volume: 195 ,, Pages: 1348–1354.
Blanco, S. (2007) How techno-entrepreneurs build a potentially exciting future? In: THÉRIN, F. (ed.)
Handbook of Research on Techno-Entrepreneurship. Cheltenham, UK: Edward Elgar
Publishing Limited.
Boell, S. K. and Cecez-Kecmanovic, D. (2014) A Hermeneutic Approach for Conducting Literature
Reviews and Literature Searches. Communication of the Association for Information Systems,
Volume: 34, Pages: 257-286.
Bokpin, G. A., Mensah, L., Asamoah, M. E. and Bahmani-Oskooee, M. (2015) Foreign direct
investment and natural resources in Africa. Journal of Economic Studies, 42.
Bonga, W. G. (2014) Economic Policy Analysis in Zimbabwe: A Review of Zimbabwe Economic
Policies: Special Reference to Zimbabwe Agenda for Sustainable Socio-Economic
Transformation (Zim Asset) Social Science Research Network [Online]. [Accessed 15 July
2015].

Page 201
Bradley, S. W., Mcmullen, J. S., Artz. K. and Simiyu, E. M. (2012) Capital Is Not Enough: Innovation
in Developing Economies. Journal of Management Studies 49, 684–717.
Brem, A. and Borchardt, J. (2014) 2.Technology entrepreneurship, innovation and intrapreneurship–
managing entrepreneurial activities in technology-intensive environments. Handbook of
Research on Techno-Entrepreneurship: How Technology and Entrepreneurship are Shaping the
Development of Industries and Companies, 17.
Brennan, C., and Tiwari, B. K. (2015).Food Processing and Preservation. Journal of Food Processing
and Preservation, 39(3).
Brett, E. A. (2005) From corporatism to liberalization in Zimbabwe: economic policy regimes and
political crisis, 1980–97. International Political Science Review, 26, 91-106.
Bryman, A. (2012) Social research methods, Oxford university press.
Bryman, A. and Bell, E. (2015) Business research methods, Oxford university press.
Bulsara H. P, Gandhi S and D., P. P. (2009) Techno-innovation to Techno – Entrepreneurship through
Technology Business Incubation in India: An Exploratory Study. Asia Pacific Journal of
Innovations and Entrepreneurship, Asian Association of Business Incubation, Volume 3, 55 –
77.
Businessdictionary.Com. (2015) Business Dictionary: Microsoft Excel [Online].
http://www.businessdictionary.com/definition/Microsoft-Excel.html#ixzz3nxy2DJIK:
BusinessDictionary.com. [Accessed 8 October 2015].
Bygrave, W. D. and Zacharakis, A. (20090 The portable MBA in entrepreneurship, John Wiley and
Sons.
Cabrita, M. R., Cabrita, C., Matos, F. and Dueñas, M. D. P. M. (2015) Entrepreneurship Capital and
Regional Development: A Perspective Based on Intellectual Capital. Entrepreneurship, Human
Capital, and Regional Development .Springer.
Caggese, A. (2012) Entrepreneurial risk, investment, and innovation Journal of Financial Economics,
106, 287–307.
Çalışkan, H. K. (2015) Technological Change and Economic Growth. Procedia - Social and Behavioral
Sciences, Volume 195 Pages: 649–654.
Caloghirou, Y., Llerena, P., Malerba, F., Mckelvey, M. and Radosevic, S. (2015) 16 Public policy for

Page 202
knowledge intensive entrepreneurship. Dynamics of Knowledge Intensive Entrepreneurship:
Business Strategy and Public Policy, 356.
Camisón, C. and Villar-López, A. (2014) Organizational innovation as an enabler of technological
innovation capabilities and firm performance. Journal of Business Research, 67, 2891-2902.
Carayannis, E.G., Samara, E.T. and Bakouros, Y.L. (2015) Introduction to Technological
Entrepreneurship. In Innovation and Entrepreneurship (pp. 137-157). Springer International
Publishing Cereijo, M. 2002. Technopreneurship [Online]. http://www.amigospais-
guaracabuya.org/oagmc160.php
Chandrika, N. and Vasudha, K. C. (2010) Comparative study of serum ferritin levels after oral
supplementation with ferrous sulphate and carbonyl iron in mild iron deficiency anemia in
pregnancy. International Journal of Biological and Chemical Science, Volume: 4, Pages: 362-
370.
Chanthes, S. (2012) Increasing Faculty Research Productivity via a Triple-Helix Modeled University
Outreach Project: Empirical Evidence from Thailand. Procedia - Social and Behavioral
Sciences, 52, 253 – 258.
Chinamasa, P. (2015) Zimbabwe: The 2015 Mid-Year Fiscal Policy Review Statement. In:
Development, Ministry of Finance and Economic Development. (ed.)
http://www.zimtreasury.gov.zw/mid-year-fiscal-policy-review
Chittithaworn, C., Islam, M. A., Keawchana, T. and Yusuf, D. H. M. (2011) Factors affecting business
success of small and medium enterprises (SMEs) in Thailand. Asian Social Science, 7, p180.
Chong, E. (2013) Managerial competencies and career advancement: A comparative study of managers
in two countries. Journal of Business Research, 66, 345-353.
Claudio, P. and Shujun, Z. (2011) Factors influencing technological entrepreneurship in Chinese
enterprises: Preliminary evidences from Guangdong province. Management Science and
Engineering (ICMSE), 2011 International Conference on, 2011. IEEE, 271-278.
Clausen T and Korneliussen T (2012) The relationship between entrepreneurial orientation and speed to
the market: The case of incubator firms in Norway Technovation, 32, 560–567.
Clover, J. (2003) Food security in sub-Saharan Africa. African Security Studies, 12, 5-15.
Cohen, L., Manion, L. and Morrison, K. (2000) Research Methods in Education [5th ed] London:
Routledge Falmer. Teaching in Higher Education, 41.

Page 203
Cohen, L., Manion, L. and Morrison, K. (2007) Research Methods in Education, London and New
York, Routledge.
Cohen, W. M. and Levinthal, D. A. (1989) Innovation and learning: the two faces of R and D. The
economic journal, 569-596.
Colovic, A. and Lamotte, O. (2015) Technological Environment and Technology Entrepreneurship: A
Cross‐Country Analysis. Creativity and Innovation Management.
Confederation of Zimbabwe Industries (2011) Manufacturing Sector Survey. Annual Report. Harare.
Confederation of Zimbabwe Industries (2012) Manufacturing Sector Survey. Annual Report. Harare.
Confederation of Zimbabwe Industries (2013) Manufacturing Sector Survey. Annual Report. Harare.
Confederation of Zimbabwe Industries (2014) Manufacturing Sector Survey. Annual Report. Harare.
Confederation of Zimbabwe Industries (2015) Manufacturing Sector Survey. Annual Report. Harare.
Cook, R. G. and Chaganti, R. (2015) Improving Profitability of Very Small and Small Firms: The
Impact of Qualiity Practices in the Human Resources Area. Journal of Small Business Strategy,
9, 44-56.
Cooper D R and Schindler P S (2011) Business Research Methods, Boston, McGraw-Hill International
Edition.
Creswell, W. J. (2009) Research design: Qualitative, quantitative, and mixed methods approaches,
SAGE Publications, Incorporated.
Crouch, E.C. (2015) Comment on Wolfgang Merkel, “Is capitalism compatible with democracy?”
Zeitschrift für Vergleichende Politikwissenschaft, pp.1-11.
Damanpour, F. (2010) An integration of research findings of effects of firm size and market competition
on product and process innovations. British Journal of Management, 21, 996-1010.
Damsgaard F. E. (2012) Exhaustible resources, technology choice and industrialization of developing
countries. Resource and Energy Economics, 34, 271-294.
Dana, L.P. (1993) An analysis of strategic intervention policy in Namibia. Journal of Small Business
Management, 31(3), p.90.

Page 204
Dana, L.P. (1997) Voluntarily socialist culture and small business in the Kingdom of Lesotho. Journal
of Small Business Management, 35(4), p.83.
Dana, L.P., 1996. Global perspectives: Small business in Mozambique after the war. Journal of Small
Business Management, 34(4), 67.
Davies, R. (2004) Memories of underdevelopment: A personal interpretation of Zimbabwe’s economic
decline. Brian Raftopoulos and Tyrone Savage (ends)“Zimbabwe: Injustice and Political
Reconciliation”. Institute for Justice and Reconciliation, Cape Town South Africa.
Davies, R. and Rattsø, J. (2000) Zimbabwe: Economic adjustment, income distribution and trade
liberalization. Center for Economic Policy Analysis Working Paper Series.
De Beer, J., Sowa, I. and Holman, K. (2014) Frameworks for analysing African innovation:
Entrepreneurship, the informal economy and intellectual property. Innovation and Intellectual
Property, 32.
De Silva, M. (2015) Academic entrepreneurship and traditional academic duties: synergy or rivalry?
Studies in Higher Education, 1-15.
De Vaus, D. (2014) Surveys in social research, Routledge.
De Vries, M.F.R. (1977) The entrepreneurial personality: A person at the crossroads. Journal of
management studies, 14(1), pp.34-57.De Waal, T., Pannekoek, J. and Scholtus, S. (2011)
Handbook of statistical data editing and imputation, John Wiley and Sons.
Deeds, D. (2014) Thoughts on the challenge of empirical research in entrepreneurship. Handbook of
Research Methods and Applications in Entrepreneurship and Small Business, Cheltenham, UK
and Northampton, MA, USA: Edward Elgar, pp.10-19.
Denscombe, M. (2010) The Good Research Guide - For small-scale social research projects, New
York, McGraw Hill Open University Press.
Devendra, C. Malik, P.K. Bhatta, R. Takahashi, J. Kohn, R.A. and Prasad, C.S. (2015) Carbon
sequestration and animal-agriculture: relevance and strategies to cope with climate change.
Livestock Production and Climate Change, 6, 146.
Dolatabadi, R. V. and Meigounpoory, M. R. (2013) Effective Determinants of Corporate Nano-
Technopreneurship Process in Active Technological Knowledge Base Firms. International
Journal of Academic Research in Economics and Management Sciences, 2, 140.

Page 205
Dosi, G., Grazzi, M. and Moschella, D. (2015) Technology and costs in international competitiveness:
from countries and sectors to firms. Research Policy, 44, 1795-1814.
Dossick, C. S. and Neff, G. (2011) Messy talk and clean technology: communication, problem-solving
and collaboration using Building Information Modelling. The Engineering Project Organization
Journal, 1, 83-93.
Drucker, P. (2014) Innovation and entrepreneurship, Routledge.
Duchek, S. (2013) Capturing absorptive capacity: A critical review and future prospects. Schmalenbach
Business Review, 65, 312-329.
Dutse, A. Y., Ningi, S. I. and Abubakar, S. (2013) Technopreneurship and Enterprise Growth in Nigeria:
An Exploration into the Latent Role of Microfinance Banks. IOSR Journal of Business and
Management, Volume: 12, PP 25-32.
Engel, J. S. (2015) Global Clusters of Innovation: Lessons from Silicon Valley. California Management
Review, 57.
Entezari, Y. (2015) Building Knowledge-Based Entrepreneurship Ecosystems: Case of Iran. Procedia-
Social and Behavioral Sciences, 195, 1206-1215.
Eriksson, P. and Kovalainen, A. (2008) Qualitative methods in business research, Sage.
Espíritu-Olmos, R. and Sastre-Castillo, M. A. (2015) Personality traits versus work values: Comparing
psychological theories on entrepreneurial intention. Journal of Business Research, 68, 1595-
1598.
Espitia-Escuer, M., García-Cebrián, L. I. and Muñoz-Porcar, A. (2015) Location as a competitive
advantage for entrepreneurship an empirical application in the Region of Aragon (Spain).
International Entrepreneurship and Management Journal, 11, 133-148.
Estrin S, Korosteleva J and Mickiewicz T (2013) Which institutions encourage entrepreneurial growth
aspirations? Journal of Business Venturing 28, 564–580.
Farquhar, J. D. (2012) Case study research for business, Sage.
Feldman, M., Hadjimichael, T., Kemeny, T., & Lanahan, L. (2014).Economic Development: A
Definition and Model for Investment. Retrieved from
http://maryannfeldman.web.unc.edu/files/2014/05/Economic-Development-a-definition-model-
forinvestment. pdf on December, 1st.

Page 206
Ferreira, J. J., Ferreira, F. A., Fernandes, C. I., Jalali, M. S., Raposo, M. L. and Marques, C. S. (2015)
What do we [not] know about technology entrepreneurship research? International
Entrepreneurship and Management Journal, 1-21.
Ferretti, M. and Parmentola, A. (2015) The University-Driven LISs. The Creation of Local Innovation
Systems in Emerging Countries.Springer.
Financial Gazette, (2015) April annual inflation down to -2,65%. The Financial Gazette, 15 May 2015.
Financial Gazette, (2015) Electricity generation falls below 1 000MW – ZPC. The Financial Gazette, 21
September 2015.
Financial Gazette, (2015) Mugabe proposes Ten Point Plan for sustained economic growth. The
Financial Gazette, 26 Aug 2015.
Financial Gazette, (2015) Zimbabwe’s August inflation flat at -2,77 percent. The financial Gazette, 16
September 2015.
Fokoue, E. and Gunduz, N. (2015) An Information-Theoretic Alternative to the Cronbach's Alpha
Coefficient of Item Reliability. arXiv preprint arXiv:1501.04070.
Fritsch, S. (2011) Technology and global affairs. International Studies Perspectives, 12(1), pp.27-45.
Frost, J. (2015) Understanding Hypothesis Tests: Significance Levels (Alpha) and P values in Statistics.
The Minitab Blog [Online]. 2015].
Fullerton, S., and Dodge, H. R. (2015) The Impact of Color on the Response Rates for Mail
Questionnaires. In Proceedings of the 1988 Academy of Marketing Science (AMS) Annual
Conference (pp. 413-415). Springer International Publishing.
Funk, K. (1999) Technology and Christian 'Values' [Online].
http://web.engr.oregonstate.edu/~funkk/Technology/index.html#introduction Retrieved on 24
June 2014.
Fusari A and Reati A (2013) Endogenizing technical change: Uncertainty, profits, entrepreneurship. A
long-term view of sectoral dynamics. Structural Change and Economic Dynamics, 24, 76–100.
Fynes, B., Professor Paul Coughlan, P., Zhang, M., Zhao, X., Lyles, M. A. and Guo, H. (2015)
Absorptive capacity and mass customization capability. International Journal of Operations and
Production Management, 35, 1275-1294.
García, J. A. T., Skotnicka, A. G., and Maeso-González, E. (2015) The Role of the Entrepreneur in the

Page 207
New Technology-Based Firm (NTBF). In Enhancing Synergies in a Collaborative Environment
(pp. 225-232).Springer International Publishing.
García-Barriocanal, E., Sicilia, M.-A.and Sánchez-Alonso, S. (2012) Computing with competencies:
Modelling organizational capacities. Expert Systems with Applications, 39, 12310-12318.
Gartner, W.B. (1989) Some suggestions for research on entrepreneurial traits and
characteristics. Entrepreneurship theory and practice, 14(1), pp.27-37.
Germak, A. J. (2015) For Love or Money? Achievement Orientation, Non-Monetary Focus and the
Nascent Social Entrepreneur. Society for Social Work and Research 19th Annual Conference:
The Social and Behavioral Importance of Increased Longevity, 2015. Sswr.
Gicheva, D. and Link, A. N. (2015) On the Economic Performance of Nascent Entrepreneurs. European
Economic Review.
Gilbert, N. (2007) Research, theory and method. Researching social life, 2.
Gilsing, V. A., Van Burg, E. and Romme, A. G. L. (2010) Policy principles for the creation and success
of corporate and academic spin-offs. Technovation, 30, 12-23.
Girma, S., Gong, Y., Görg, H. and Lancheros, S. (2015) Estimating direct and indirect effects of foreign
direct investment on firm productivity in the presence of interactions between firms. Journal of
International Economics, 95, 157-169.
Goddard, J. (2015) Rechargeable Antimicrobial Coatings for Food Processing Equipment. In 2015
Annual Meeting (July 25-28, 2015). Iafp.
Goh K-L and Wong C-Y (2012) The sustainability of functionality development of science and
technology: Papers and patents of emerging economies. Journal of Informetrics, 6, 55– 65.
Gompers, P. and Lerner, J. (2001) The venture capital revolution. The journal of economic
perspectives, 15(2),145-168.
Gray, D. E. (2013) Doing research in the real world, Sage.
Green, H. (2015) Dietary carbohydrates: A food processing perspective. Nutrition Bulletin, 40(2), 77-82.
Greenfield T (2002) Research Methods for Postgraduates, London, Arnold.
Gregor, S. and Hevner, A. R. (2015) The Front End of Innovation: Perspectives on Creativity,
Knowledge and Design. New Horizons in Design Science: Broadening the Research Agenda.

Page 208
Springer.
Gries, T. and Naudé, W. (2011) Entrepreneurship and human development: A capability approach.
Journal of Public Economics, 95, 216-224.
Guchait, P., Simons, T., and Pasamehmetoglu, A. (2015) Error Recovery Performance The Impact of
Leader Behavioral Integrity and Job Satisfaction. Cornell Hospitality Quarterly,
1938965515613858.
Gui-Diby, S. L. and Renard, M.-F.(2015) Foreign Direct Investment Inflows and the Industrialization of
African Countries. World Development, 74, 43-57.
Guo R (2012) Chapter 11 Industrialization and Technological Progress. Understanding the Chinese
Economies.
Gurau, C., Dana, L.P. and Lasch, F. (2012) Academic entrepreneurship in UK biotechnology firms:
Alternative models and the associated performance. Journal of Enterprising Communities:
People and Places in the Global Economy, 6(2), pp.154-168.
Guzman, J. and Stern, S. (2015) Where is Silicon Valley? Science, 347, 606-609.
Hadass, Y. S. and Williamson, J. G. (2001) Terms of trade shocks and economic performance 1870-
1940: Prebisch and Singer revisited. National Bureau of Economic Research.
Hair Jr, J. F., Wolfinbarger, M., Money, A. H., Samouel, P. and Page, M. J. (2015) Essentials of
business research methods, Routledge.
Hanks, S.H. and McCarrey, L.R. (2015) Beyond survival: Reshaping entrepreneurial vision in
successful growing ventures. Journal of Small Business Strategy, 4(1), pp.1-12.
Hayllar, M.R. (2010) Public‐Private Partnerships in Hong Kong: Good Governance–The Essential
Missing Ingredient? 1. Australian Journal of Public Administration, 69(s1), pp.S99-S119.
Haq, A. N. and Boddu, V. (2015) Analysis of agile supply chain enablers for Indian food processing
industries using analytical hierarchy process. International Journal of Manufacturing
Technology and Management, 29, 30-47.
Harhoff, D., Mueller, E. and Reenen, J. 2014. What are the channels for technology sourcing? Panel data
evidence from German companies. Journal of Economics and Management Strategy, 23, 204-
224.
Harlanu, M. and Nugroho, A. (2015 0 The Importance of Technopreneurship Management Model for

Page 209
Vocational School. In: Abdullah, A. G., Aryanti, T., Kurnia, D. and Elvyanti, S., eds. The 3rd
UPI International Conference on Technical and Vocational Education and Training (TVET),
2015 Central Java, INDONESIA. Atlantis Press, Pages: 147-150.
Harlanu, M. and Nugroho, A. (2015) The Importance of Technopreneurship Management Model for
Vocational School. 3rd UPI International Conference on Technical and Vocational Education
and Training, 2015.Atlantis Press.
Harlanua, M. and Nugrohob, A. (2015) The Importance of Technopreneurship Management Model for
Vocational School. In 3rd UPI International Conference on Technical and Vocational
Education and Training. Atlantis Press.
Harrigan, K. R. (2015) Strategic alliances as agents of competitive change. Collaborative strategy a
guide to strategic alliances. Cheltenham: Elgar Book Series.
Harrison III, R. L. (2013) Using mixed methods designs in the Journal of Business Research 1990-2010.
Journal of Business Research, 66, 2153–2162.
Harwell, M. R. (2011) Research design in qualitative/quantitative/mixed methods. The Sage handbook
for research in education. 2nd ed. Los Angeles, CA: Sage, 147.
Heckman, J. J. (1979) Sample selection bias as a specification error. Econometrica: Journal of the
econometric society, 153-161.
Hefti, J. and Levie, J. (2015) Entrepreneurial Leadership-Vision Casting and the Role of Signalling. In
ICMLG2015-The 3rd International Conference on Management, Leadership and Governance:
ICMLG2015 (p. 95). Academic Conferences and Publishing Limited.
Heng, L. H., Othman, N. F. M., Rasli, A. M. and Iqbald, M. L. (2012) Fourth Pillar in the
Transformation of Production Economy to Knowledge Economy. Procedia - Social and
Behavioral Sciences, 40, 530 – 536.
Henrekson, M. and Jakobsson, U. (2001) Where Schumpeter was nearly right–the Swedish model and
Capitalism, Socialism and Democracy<--RID="*"-->. Journal of Evolutionary Economics,
11(3), pp.331-358.
Ho, Y.-P., Low, P.-C. and Wong, P.-K. (2014) Do University Entrepreneurship Programs Influence
Students’ Entrepreneurial Behavior? An Empirical Analysis of University Students in
Singapore. Innovative Pathways for University Entrepreneurship in the 21st Century (Advances
in the Study of Entrepreneurship, Innovation andamp, 24, 65-87.

Page 210
Holbreich, M., Metwali, N., Thorne, P.S., Sperling, A.I., Martinez, F.D., Ober, C., Von Mutius, E.,
Vercelli, D. and Gozdz, J. (2015) Opposite effects of farming on asthma: mice exposed to
Amish and Hutterite environmental products recapitulate asthma protection and risk. Am J
Respir Crit Care Med, 191, A2489.
Hu, A. G. (2015) Innovation and economic growth in East Asia: An overview. Asian Economic Policy
Review, 10, 19-37.
Huberman, A. M. and Miles, M. B. (1994) Data management and analysis methods.
Huggins, R. and Thompson, P. (2015) Entrepreneurship, innovation and regional growth: a network
theory. Small Business Economics, 45, 103-128.
Hungwe, B. (2015) Robert Mugabe admits Zimbabwe's land reform flaws. British Broadcasting
Corporation News, 27 February 2015.
Ibarz, A., Garvín, A. and Falguera, V. (2015) Ultraviolet in food preservation and processing.
Conventional and advanced food processing technologies, 411-436.
IEEA, (2007) Indigenisation And Economic Empowerment Act, Chapter 14:33 In: Law Development
Commission (ed.). Harare, Zimbabwe: Government Printers.
Ingham-Broomfield, R. B. (2014) A nurses' guide to Quantitative Research. Australian Journal of
Advanced Nursing, 32, 32-38.
IDP See Ministry of Industry and Commerce
Ilao, C. A. (2013) Technopreneurship [Online]. http://ilaochriszleann.blogspot.com/. [Accessed 6
March 2014].
International Technology Education Association (2007) Standards for Technological Literacy: Content
for the Study of Technology 3rd ed. Virginia, USA
Jaidka, K., Khoo, C. S. G. and Na, J.-C. (2013) Literature review writing: how information is selected
and transformed. Aslib Proceedings, 65, 303-325.
Jakšić, M. L., Marinković, S. and Rakićević, J. (2014) Sustainable Technology Entrepreneurship and
Development–the Case of Serbia. Management, 70, 65-73.
Jalink, M.B., Goris, J., Heineman, E., Pierie, J.P.E. and Henk, O. (2015) Face validity of a Wii U video
game for training basic laparoscopic skills. The American Journal of Surgery, 209(6),1102-
1106.
Page 211
Jamali, D. and Kreidie, L. (2014) Social Entrepreneurship in the Arab World: Lessons from Lebanon.
Emerging Research Directions in Social Entrepreneurship. Springer.
Jenks, J., Low, B.B., Char, H., Vosshall, P.S. and Brunette, W., Amazon Technologies, Inc. (2015)
Secure validation using hardware security modules. U.S. Patent Application 14/733,795.
Jermann, C., Koutchma, T., Margas, E., Leadley, C. and Ros-Polski, V. (2015) Mapping trends in novel
and emerging food processing technologies around the world. Innovative Food Science and
Emerging Technologies.
Johns Hopkins Bloomberg School of Public Health (2015) Food processing: Lesson plan
http://www.jhsph.edu/research/centers-and-institutes/teaching-the-food-
system/curriculum/_pdf/Food_Processing-Lesson.pdf Retrieved on 19 November 2015.
Jonker, J. and Pennink, B. (2010) The essence of research methodology: A concise guide for master and
PhD students in management science, Springer Science and Business Media.
Jonsson, I. (2015) The Political Economy of Innovation and Entrepreneurship: From Theories to
Practice, Ashgate Publishing, Ltd.
Judge, W. Q., Liu-Thompkins, Y. Brown, J. L. and Pongpatipat, C. (2013) The Impact of Home Country
Institutions on Corporate Technological Entrepreneurship via RandD Investments and Virtual
World Presence Entrepreneurship Theory and Practice, 1042-2587.
Juran, J.M. (1992) Juran on quality by design: the new steps for planning quality into goods and
services. Simon and Schuster.
Kabukcu, E. 2015. Creativity Process in Innovation Oriented Entrepreneurship: The case of Vakko.
Procedia-Social and Behavioral Sciences, 195, 1321-1329.
Kachembere, J. (2015) Zim FDI slumps further: Report. Daily News, [22 November 2015]
Kakava, N. (2010) Get Patents for Inventions, Inventors Urged. Zimbabwe Broadcasting
Corporationwww.zbc.co.zw/index.php?...patent Saturday, 08 May 2010 15:38
Kakava, N. Z. (2013) The Essence of Academic Entrepreneurship: Application to Chinhoyi University
of Technology Thrust. Public Policy and Administration Research, 3, 62-68.
Kakava, N. Z., Msiphah, N. and Mugari, G. (2014) Technology and Social Entrepreneurship.
http://www.igi-global.com/: IGI-Global.
Kamarudin, H. S. and Sajilan, S. (2013) Critical Success Factors of Technopreneurship in The Creative

Page 212
Industries: A Study of Animation Ventures Review Integrative Business and Economics
Research, 2, 231-246.
Kanter, R. M. (2015). From spare change to real change: The social sector as beta site for business
innovation. Havard Business Review.
Kaplinsky R (2011) Schumacher meets Schumpeter: Appropriate technology below the radar. Research
Policy, 40, 193–203.
Kariati, M. (2015) Dejected Zimbabweans Commit Suicide as Massive Job Cuts Continue Voice of
America: Zimbabwe, 2 September 2015.
Kariati, M. (2015) Dejected Zimbabweans Commit Suicide as Massive Job Cuts Continue Voice of
America: Zimbabwe, 2 September 2015.
Kassicieh, S. (2015) Technology Entrepreneurship: Progress of a Clinical Approach through Time.
Journal of the Knowledge Economy, 1-22.
Kazemi, S., Lim, S. and Ge, L. (2007) An international research survey: cartographic generalisation
practices at mapping agencies. Spatial Science Institute Biennial International Conference,
Hobart, Tasmania, Australia, 2007.14-18.
Kecskés, P. and Kovács, E. P. (2015) Development Path and the Role of Industrial Parks–The Case of
Győr. Development, 1, 12-16
Keinänen, K. J. (2015) A case study on workplace concept development towards optimal work support
in knowledge-intensive organizations.
Kenney M, Breznitz D and Murphree M (2013) Coming back home after the sun rises: Returnee
entrepreneurs and growth of high tech industries. Research Policy 42, 391-407.
Kent University. 2015. SPSS Tutorials - One Sample t Test [Online].
http://libguides.library.kent.edu/SPSS/OneSampletTest: Kent State University Libraries.
Retrieved 24 October 2015.
Keshwani, A., Malhotra, B. and Kharkwal, H. (2015) Advancements of Nanotechnology in Food
Packaging. World Journal Of Pharmacy And Pharmaceutical Sciences, 4, 1054-1057.
Khazaal, Y., Van Singer, M., Chatton, A., Achab, S., Zullino, D., Rothen, S., Khan, R., Billieux, J. and
Thorens, G. (2014) Does self-selection affect samples’ representativeness in online surveys? An
investigation in online video game research. Journal of medical Internet research, 16, 119-128.

Page 213
Khoo, C. S. G., Na, J.-C.and Jaidka, K. (2011) Analysis of the macro-level discourse structure of
literature reviews. Online Information Review, 35, 255-271.
Kim, S. L., and Yun, S. (2015) The effect of coworker knowledge sharing on performance and its
boundary conditions: An interactional perspective. Journal of Applied Psychology, 100(2), 575.
Kim, Y. K. and Lee, K. (2015) Different impacts of scientific and technological knowledge on economic
growth: Contrasting science and technology policy in East Asia and Latin America. Asian
Economic Policy Review, 10, 43-66.
Kim, Y., Kim, W. and Yang, T. (2012) The effect of the triple helix system and habitat on regional
entrepreneurship: Empirical evidence from the U.S. Research Policy, 41, 154-166.
Ki-Moon, B. (2013) Millennium Development Goals: 2013 Progress Chart.
http://www.un.org/millenniumgoals/pdf/report-2013/2013_progress_english.pdf
Kirzner, I. M. (1973) Competition and Entrepreneurship, University of Chicago Press.
Klingler-Vidra, R. (2015) Diffusion and adaptation: why even the Silicon Valley model is adapted as it
diffuses to East Asia. The Pacific Review, 1-24.
Kothari, C. R. (1990) Research Methodology, New Delhi, Wishwa Prakashan.
Kothari, C. R. (2004) Research Methodology: Methods and Techniques, New Delhi, New Age
International Publishers.
Kotler, P. and Keller, K. L. (2006) Marketing Management. 12th Edition ed. Delhi: Pearson Education
Kotrlik, J. and Higgins, C. (2001) Organizational research: Determining appropriate sample size in
survey research appropriate sample size in survey research. Information technology, learning,
and performance journal, 19, 43.
Kuan, C.-Y., Yee-Fung, W., Yuen, K.-H.and Liong, M.-T. (2012) Nanotech: propensity in foods and
bioactives. Critical reviews in food science and nutrition, 52, 55-71.
Kulakova, N. (2014) Business Clusters Formation in Latvia. Procedia-Social and Behavioral Sciences,
110, 174-181.
Kuratko, D. F., Hornsby, J. S. and Hayton, J. (2015) Corporate entrepreneurship: the innovative
challenge for a new global economic reality. Small Business Economics, 1-9.

Page 214
Lager, T. (2000) A New Conceptual Model For The Development Of Process Technology In Process
Industry: A Point Of Departure For The Transformation Of The" Process Development Process"
Into A Formal Work Process?.International Journal of Innovation Management, 4(03), 319-346.
Laeven, L., Levine, R. and Michalopoulos, S. (2015) Financial innovation and endogenous growth.
Journal of Financial Intermediation, 24, 1-24.
Lakitan, B. (2013) Technopreneurship as a Strategic Mechanism for Commercializing University-
Created Technology. In Presented at Technopreneurship Seminar at Lampung University.
Landström H, Harirchi G and Åström F (2012) Entrepreneurship: Exploring the knowledge base.
Research Policy 41, 1154-1181.
Lattemann, C., Professor W. Zhang, D., Gugler, P. and Vanoli, L. (2015) Technology-sourcing
investment abroad as an enhancer of Chinese MNEs’ innovative capabilities. International
Journal of Emerging Markets, 10, 243-271.
Lau, T.L., Shaffer, M.A., Fai Chan, K. and Wing Yan Man, T. (2012) The entrepreneurial behaviour
inventory: A simulated incident method to assess corporate entrepreneurship. International
Journal of Entrepreneurial Behavior & Research, 18(6), 673-696.
Lee, C. and Narjoko, D. (2015) Escaping the Middle‐Income Trap in Southeast Asia: Micro Evidence on
Innovation, Productivity, and Globalization. Asian Economic Policy Review, 10, 124-147.
Lee, P. Y., Lusk, K., Mirosa, M., and Oey, I. (2015) Effect of information on Chinese consumers’
perceptions and purchase intention for beverages processed by High Pressure Processing,
Pulsed-Electric Field and Heat Treatment. Food Quality and Preference, 40, 16-23.
Li, H., Yang, Z., Yao, X., Zhang, H. and Zhang, J. (2012) Entrepreneurship, private economy and
growth: Evidence from China. China Economic Review 23, 948–961.
Lim, S. Y. and Suh, M. (2015) Product and Process Innovation in the Development Cycle of
Biopharmaceuticals. Journal of Pharmaceutical Innovation, 10, 156-165.
Liu, H. (2008) Immigrant transnational entrepreneurship and its linkages with the state/network. Chinese
entrepreneurship in a global era, 1919, 117.
Long, C., Yang, J. and Zhang, J. (20150 Institutional impact of foreign direct investment in China.
World Development, 66, 31-48.
Louis, C., Lawrence, M. and Keith, M. (2007) Research methods in education, Routledge, New York

Page 215
Lungeanu, R., Stern, I. and Zajac, E.J. (2015) When do firms change technology‐sourcing vehicles? The
role of poor innovative performance and financial slack. Strategic Management Journal, 9(1), 5-
24.
Mabuwa, C. I. 2014. Value Addition in Raw Material and Agricultural Exports from Zimbabwe.
Victoria Falls: Ministry of Industry and Commerce.
McAdam, R., Miller, K., McAdam, M. and Teague, S. (2012) The development of University
Technology Transfer stakeholder relationships at a regional level: Lessons for the
future. Technovation, 32(1), 57-67.
Macheka, L., Manditsera, F. A., Ngadze, R. T., Mubaiwa, J. and Nyanga, L. K. (2013) Barriers, benefits
and motivation factors for the implementation of food safety management system in the food
sector in Harare Province, Zimbabwe. Food Control, 34, 126-131.
Machikita, T. and Ueki, Y. (2015) Measuring and explaining innovative capability: Evidence from
Southeast Asia. Asian Economic Policy Review, 10, 152-173.
Maglana, M. (2007) Technopreneurship - 1st Lecture Technopreneurship definition
http://markjasonesgana.wordpress.com/2013/03/18/28/. Retrieved 6 March 2014.
Makanyeza, C. (2015) Consumer Awareness, Ethnocentrism and Loyalty: An Integrative Model.
Journal of International Consumer Marketing, 27, 167-183.
Makoni, M. (2011) Tough times for Zimbabwe's science minister. Sci Dev Net: Bringing science and
development together through original news and analysis. Retrieved 21 November 2015
Malakh-Pines, A. and Èzbilgin, M. eds. (2010) Handbook of Research on High-technology
Entrepreneurs. Edward Elgar Publishing.
Malerba, F., and McKelvey, M. (2015) Conceptualizing Knowledge Intensive Entrepreneurship:
Definition and Model. Malerba, F.; Caloghirou, Y.; McKelvey, M. and Radosevic, S. (2015 in
press). The Dynamics of Knowledge Intensive Entrepreneurship: Business Strategy and Public
Policy.
Malerba, F., Caloghirou, Y., McKelvey, M., and Radoševic, S. (Eds.). (2015) Dynamics of Knowledge
Intensive Entrepreneurship: Business Strategy and Public Policy. Routledge.
Mangudhla, T. (2015) Deflation a major threat to economy. Zimbabwe Independent, 23 October 2015.
Mani, S. (2004) Financing of innovation‐a survey of various institutional mechanisms in Malaysia and

Page 216
Singapore. Asian Journal of Technology Innovation, 12, 185-208.
Markatoua, M. and Vetsikasb, A. (2015) Innovation and Crisis: An Analysis of its Impact on the Greek
Patenting Activity Procedia - Social and Behavioral Sciences, 195, 123–132.
Marlow S and Mcadam M (2012) Analyzing the Influence of Gender Upon High-Technology Venturing
Within the Context of Business Incubation. Entrepreneurship Theory and Practice, 36, 655–
676.
Martel, F. (2015) Witch Doctor Business Booms as 30,000 Lose Jobs in Zimbabwe. Breitbart News
Network, 11 Sep 2015.
Martini L, Tjakraatmadja J H T, Anggoro Y, Pritasari A and Hutapea L (2012) Triple Helix
Collaboration to develop Economic Corridors as Knowledge Hub in Indonesia Procedia - Social
and Behavioral Sciences, 52, 130-139.
Marques, C.S., Ferreira, J.J., Gomes, D.N. and Gouveia Rodrigues, R., 2012. Entrepreneurship
education: How psychological, demographic and behavioural factors predict the entrepreneurial
intention. Education+ Training, 54(8/9), 657-672.
Mataranyika, M. (2015) Zim economy bleeds 4 000 jobs, 150 firms. Fin24, 7 April 2015.
Mavimbela, N. (2015) A randomised clinical trial comparing the effectiveness of two exercise
programmes on core strength and balance in healthy females.
Maxfield, M. (2015) Basics of research methods for criminal justice and criminology, Cengage
Learning.
McChesney, R.W. (2015) Rich media, poor democracy: Communication politics in dubious times. The
New Press.
Mckenna, W. R. (2013) Aron Gurwitsch and the Transcendence of the Physical. Husserl’s Ideen.
Springer.
Meek, W. R. and Wood, M. S. (2015) Navigating a Sea of Change: Identity Misalignment and
Adaptation in Academic Entrepreneurship. Entrepreneurship Theory and Practice.
Memon, J., Rozan, M., Ismail, K., Uddin, M. and Daud, D. (2015) Mentoring an Entrepreneur. SAGE
Open, 5, 2158244015569666.
Mfula, C. and Strohecker, K. (2015) Update 4-Copper, Glencore send Zambian kwacha into freefall.
Reuters, 28 September 2015.

Page 217
Mhlanga, P. (2015) Zim faces unprecedented power crisis. The Financial Gazette, 4 June 2015.
Mhlanga, P. (2015) Zimbabwe electricity crisis to worsen. The Financcial Gazette, 10 September 2015.
Mhukahuru, C. (2015) Universities brace for 50% government cuts to salaries. University World News,
Retrieved 21 November 2015.
Microsoft Excel Online. (2009) MicrosoftExcelOnline.MicrosoftExcelOnline. Retrieved 8 October 2015.
Milián, E. and Kamen, A.A. (2015) Current and emerging cell culture manufacturing technologies for
influenza vaccines. BioMed research international, 2015.
Ministry of Justice legal and Parliamentary Affairs (2007) Indigenisation and Economic Empowerment
Act Chapter14:33 Of 2007. In: Zimbabwe Ministry of Justice, Legal and Parliamentary Affairs
(ed.) 33 of 2007.Harare Government Printers.
Ministry of Industry and Commerce (2012) Industrial Development Policy 2012-2016 Harare,
Zimbabwe: Government Printers
Minten. B., Singh, K. M. and Sutradhar, R. (2013) Branding and agricultural value chains in developing
countries: Insights from Bihar (India). Food Policy, 38, 23–34.
Mlambo, S. and Marufu, B. (2015) Choice and Patronage: A Study of Retail Consumers in Zimbabwe.
Scholedge International Journal of Management and Development, ISSN, 2394-3378.
Modi, A.T. (2003) What do subsistence farmers know about indigenous crops and organic farming?
Preliminary experience in KwaZulu-Natal. Development Southern Africa, 20(5), 675-684.
Mohammadi, S., Momayez, A. and Rahbar, F. (2014) Factors Influencing Technological
Entrepreneurship Process in the Field of Services for Individuals with Disability. A Qualitative
Study: Urban management in Tehran. Asian Journal of Research in Social Sciences and
Humanities, 4, 515-523.
Mohan, A. V. (2014) Support System for Entrepreneurial and Small and Medium Ventures in ICT
Sector: Case of the Technopreneurship Development Program (TDP) Flagship of Malaysia’s
Multimedia Super Corridor (MSC) Project. Technopolis. Springer.
Mohan, A. V. (2014) Support System for Entrepreneurial and Small and Medium Ventures in ICT
Sector: Case of the Technopreneurship Development Program (TDP) Flagship of Malaysia’s
Multimedia Super Corridor (MSC) Project. . Technopolis.14 December 2013 ed. London:
Springer

Page 218
Mohannak, K. and Matthews, J. (2015) Knowledge integration within innovation process: a
technopreneurial perspective. International Journal of Technoentrepreneurship, 3(1), 17-36.
Mok, K. H. (2015) The quest for global competitiveness: Promotion of innovation and entrepreneurial
universities in Singapore. Higher Education Policy, 28, 91-106.
Momin, J. K. and Joshi, B. (2015) Nanotechnology in Foods. Nanotechnologies in Food and
Agriculture. Springer.
Monyau, M. M. and Bandara, A. (2015) Africa Economic Outlook: Zimbabwe 2015.
http://www.africaneconomicoutlook.org/fileadmin/uploads/aeo/2015/CN_data/CN_Long_EN/Zi
mbabwe_GB_2015.pdf.
Monyau, M. M. and Bandara, A. (2015) Zimbabwe. African Economic Outlook.
www.africaneconomicoutlook.org: African Development Bank.
Moroz, P. W. and Hindle, K. (2011) Entrepreneurship as A Process: Toward Harmonizing Multiple
Perspectives. Entrepreneurship Theory and Practice.
Moroz, P. W. and Hindle, K. (2012) Entrepreneurship as a process: Toward harmonizing multiple
perspectives. Entrepreneurship Theory and Practice, 36, 781-818.
Mortazavi S H and Bahrami M (2012) Integrated Approach to Entrepreneurship – Knowledge based
Economy: A Conceptual Model. Procedia - Social and Behavioral Sciences, 41, 281 – 287.
Motohashi, K. 2015. Comment on “Different Impacts of Scientific and Technological Knowledge on
Economic Growth: Contrasting Science and Technology Policy in East Asia and Latin
America”. Asian Economic Policy Review, 10, 67-68.
Mowery, D., Nelson, R., Sampat, B. and Ziedonis, A. (2015) Ivory tower and industrial innovation:
University-industry technology transfer before and after the Bayh-Dole Act, Stanford University
Press.
Moyo, H. (2014) Low trade hampers SADC integration. Zimbabwe Independent, 29 August 2014.
Moyo, N. and Besada, H. (2008) Zimbabwe in Crisis: Mugabe's Policies and Failures. The Centre for
International Governance Innovation Technical Paper.
Munangagwa, C. (2009) The Economic Decline of Zimbabwe. GettysburG economic, 110.
Murphy, G. (2013) Robert Mugabe’s Africa: Zimbabwe as a Failed State. Tulane Journal of
International Affairs, 1.

Page 219
Murphy, K., Kirkman, G. A., Seres, S. and Haites, E. (2015) Technology transfer in the CDM: an
updated analysis. Climate Policy, 15, 127-145.
Murray, G., Crowe, L. and Howells, R. (2015) The Medical Technologies Evaluation Programme
(Mtep): An Analysis Of Notifications, Decision-Making And The Interpretation Of Claimed
Healthcare System Benefits. Value in health: the journal of the International Society for
Pharmacoeconomics and Outcomes Research, 18(7), A367.
Muscio and Nardone (2012) The determinants of university–industry collaboration in food science in
Italy. Food Policy 37, 710–718.
Mushava, E. (2014) Money drives universities’ enrolment. The Standard Retrieved 21 November 2015.
Musonza, B. (2015) De-industrialisation: Zim’s economic crisis demystified. Zimbabwe Independant.
Musso, J., Weare, C. and Hale, M. (2000) Designing web technologies for local governance reform:
good management or good democracy?.Political Communication, 17(1), 1-19.
Mustafa, A. (2010) Research Methodology, Krishan Nagar, Delhi, A. I. T. B. S. Publishers.
Mustar, P. and Wright, M. (2010) Convergence or path dependency in policies to foster the creation of
university spin-off firms? A comparison of France and the United Kingdom. The Journal of
Technology Transfer, 35, 42-65.
Mutenga, T. (2015) 2015/2016 agric season in financial mess. The Financial Gezette, 13 Aug 2015.
Mwaniki, A. (2006) Achieving food security in Africa: Challenges and issues. UN Office of the Special
Advisor on Africa (OSAA) http://www.un. org/africa/osaa/reports/Achieving% 20Food%
20Security% 20in% 20Africa-Challenges% 20and% 20Issues. pdf Retrieved 9 May 9 2010.
Nacu, C. M. and Avasilcăi, S. (2014) Environmental factors influencing technological entrepreneurship:
research framework and results. Procedia-Social and Behavioral Sciences, 109, 1309-1315.
Nacu, C. M. and Avasilcăi, S. (2014) Performance Management in Entrepreneurial Contexts. Advanced
Materials Research, 2014. Trans Tech Publ, 1072-1076.
Nacu, C. M. and Avasilcăi, S. (2014) Technological Ecopreneurship: Conceptual Approaches. Procedia-
Social and Behavioral Sciences, 124, 229-235.
Nacu, C. M. and Avasilcăi, S. (2014) Technological Entrepreneurship: Success Factors as Perceived by
Potential Young Entrepreneurs. Advanced Materials Research, 2014. Trans Tech Publ, 639-
644.

Page 220
Nastase, G. I., Badea, D. C. and Nastase, D. I. (2010) Innovative models of development through
science. Cogito: Multidisciplinary Res. J., 2, 96.
Nastase, I.G., Badea, C.D. and Nastase, G.I.D. (2010) Innovative models of development through
science. Cogitto Journal, No. II, March, 2, 106-135.
Nasution, H. N., Mavondo, F. T., J. Matanda, M. and Ndubisi, N. O. (2011) Entrepreneurship: Its
relationship with market orientation and learning orientation and as antecedents to innovation
and customer value. Industrial Marketing Management, 40, 336–345.
Naude´ W (2011) Entrepreneurship is Not a Binding Constraint on Growth and Development in the
Poorest Countries. World Development 39, 33-34.
Ndlela, D. (2015) Zim economic crisis worsens. Financial Gazette, 6 August 2015.
Nejad, A. J. and Zarei, H. (2015) Research Paper Investigating the Relationship between innovation
strategy and business Competitive advantages. Innovation, 3, 930-934.
Nepelski, D. and De Prato, G. (2015) International technology sourcing between a developing country
and the rest of the world. A case study of China. Technovation, 35, 12-21.
Neuman, W. L. (2012). Understanding Research, Pearson Education, Inc.
Neves, M. A., Hashemi, J. and Prentice, C. (2015) Development of novel bioactives delivery systems by
micro/nanotechnology. Current Opinion in Food Science, 1, 7-12.
Newfarmer, R. and Pierola, M. D. (2015) Trade in Zimbabwe: Changing Incentives to Enhance
Competitiveness, World Bank Publications.
Nguyen, N. D. and Martin, J. (2015) Implementing Clusters for Economic Development in Emerging
Economies: The Case of Luong Bamboo Sector in Thanh Hoa Province, Vietnam. Toulon-
Verona Conference" Excellence in Services", 2015.
Nielsen, L. (2011) Classifications of countries based on their level of development: How it is done and
how it could be done. IMF Working Papers, 1-45.
Nurdin, M. (2014) Technology Transfer Model through Industrial Collaboration for Product
Development and Technopreneurship in Polytechnic Education. Proc. 2014 International
Conference on Industrial Engineering and Operations Management, Bali, Indonesia, 2014.
2366-1370.

Page 221
Nyakazeya, P. (2013) OK Zimbabwe buoyant. Financial Gazette.
Nyoni, M. (2014) Zimtrade to revive export markets News Day www.newsday.co.zw/2014
O’Gorman, C. (2003) Stimulating high–tech venture creation. R&D Management, 33(2), 177-187.
O’kane, C., Mangematin, V., Geoghegan, W. and Fitzgerald, C. (2015) University technology transfer
offices: The search for identity to build legitimacy. Research Policy, 44, 421-437.
Okorie, N.N., Kwa, D.Y., Olusunle, S.O.O., Akinyanmi, A.O. and Momoh, I.M. (2014)
Technopreneurship: An Urgent Need in the Material World for Sustainability in
Nigeria. European Scientific Journal, 10(30), 101-111.
Olander, H., & Hurmelinna-Laukkanen, P. I. A. (2015) Perceptions Of Employee Knowledge Risks In
Multinational, Multilevel Organisations: Managing Knowledge Leaking And Leaving.
International Journal of Innovation Management, 1540006.
Organisation of Economic Co-operation and Development (2015) DAC List of ODA Recipients,
http://www.oecd.org/dac/stats/daclist.htm
Ottaviano, G. I., Peri, G. and Wright, G. C. (2015) CEP Discussion Paper No 1353 May 2015
Immigration, Trade and Productivity in Services: Evidence from UK Firms.
Pakrad, M., Hejazi, S. R. and Kazemi, R. M. (2012) Identifying Effective Factors on Technological
Entrepreneurship in Iranian Nanotechnology SMEs. Information Management and Business
Review, 4, 461-466.
Pandey, D. K. and De, H. (2015) Entrepreneurial behaviour of tribal fish farmers in Tripura, north-east
India.Indian Journal of Fisheries, 62, 38-40.
Pei, L. K., Noordin, K. A., Ting, Y. P. and Baharudin, A. S. (2010) Failure factors of the Malaysian IT
technopreneurship CSSR 2010 - 2010 International Conference on Science and Social
Research.Kuala Lumpur; Malaysia.
Pennsylvania State University, (2015) Statistics - Resorces for Online courses [Online].
https://onlinecourses.science.psu.edu/statprogram/node/158: The Pennsylvania State University
- Department of Statistics Online Programs. Retrieved 17 October 2015.
Pereira, A. A. 2007. Attitudes towards entrepreneurship in Singapore: The role of the state in cultural
transition. Asian Journal of Social Science, 35, 321-339.

Page 222
Perrea, T., Grunert, K. G. and Krystallis, A. (2015) Consumer Value perceptions of food products from
emerging processing technologies: A cross-cultural exploration. Food Quality and Preference,
39, 95-108.
Perri, A. and Peruffo, E. (2015) Knowledge spillovers from FDI: a critical review from the international
business perspective. International Journal of Management Reviews.
Petti, C. (2009) Cases in technological entrepreneurship: Converting ideas into value, Edward Elgar
Publishing.
Petti, C. (2012) Technological Entrepreneurship in China: How Does it Work? Edward Elgar
Publishing.
Petti, C. and Zhang, S. (2011) Factors influencing technological entrepreneurship capabilities towards an
integrated research framework for Chinese enterprises. Journal of Technology Management in
China, 6, 7-25.
Petti, C. and Zhang, S. (2014) Factors influencing technological entrepreneurship in Chinese firms:
evidence from Guangdong. International Journal of Technology Management, 65, 70-95.
Pisano, G.P. (1997) The development factory: unlocking the potential of process innovation. Harvard
Business Press.
Porter, M.E. (2000) Location, competition, and economic development: Local clusters in a global
economy. Economic development quarterly, 14(1), pp.15-34.
Porter, M.E. (1989) From competitive advantage to corporate strategy. InReadings in Strategic
Management (pp. 234-255). London: Macmillan Education.
Popescu, M. and Crenicean, L. C. (2012) Innovation and change in education economic growth goal in
Romania in the context of knowledge-based economy. Procedia - Social and Behavioral
Sciences, 46, 3982 – 3988.
Poti, J. M., Mendez, M. A., Ng, S. W. and Popkin, B. M. (2015) Is the degree of food processing and
convenience linked with the nutritional quality of foods purchased by US households? The
American journal of clinical nutrition, ajcn100925.
Potts, D. (2015) Debates about African urbanisation, migration and economic growth: what can we learn
from Zimbabwe and Zambia? The Geographical Journal.

Page 223
Prajogo, D. I. (2015) The strategic fit between innovation strategies and business environment in
delivering business performance. International Journal of Production Economics.
Prebisch, R. (1950) The economic development of Latin America and its principal problems, United
Nations, New York.
Psulibraries. (2013) Publishing and Curation Services: What is Data Management. Pennsylvania State
University Libraries. Retrieved 8 October 2015.
Pujanis, V., Khairunnisaa, S. and Meuthia, M. (2015) Technopreneurship in Small Travel Entreprises
(STEs): A Conceptual Framework of Performance Measurement. Sains Humanika, 5, 43-49.
Pujanis, V., Khairunnisaa, S. and Meuthia, M. (2015) Technopreneurship in Small Travel Entreprises
(STEs): A Conceptual Framework of Performance Measurement. Sains Humanika, 5,24-32.
Pullen, A. J. J, Weerd-Nederhof, P. C., J, G. A. and Fisscher O A M (2012) Open Innovation in Practice:
Goal Complementarity and Closed NPD Networks to Explain Differences in Innovation
Performance for SMEs in the Medical Devices Sector Journal of Product Innovation
Management, 29, 917–934.
Rauch, A., Doorn, R. and Hulsink, W. (2014) A Qualitative Approach to Evidence‐Based
Entrepreneurship: Theoretical Considerations and an Example Involving Business Clusters.
Entrepreneurship Theory and Practice, 38, 333-368.
Rebentisch, E. S. and Ferretti, M. (1995) A knowledge asset-based view of technology transfer in
international joint ventures. Journal of Engineering and Technology Management, 12, 1-25.
Revilla, A. J. and Ferna´Ndez, Z. (2012) The relation between firm size and RandD productivity in
different technological regimes. Technovation, 32.
Reza, M. M. and Mona, A. (2014) Effective Determinants of High Technopreneurship Process in Active
Science Based Technological SMEs in the Field of Nano-Food Industry. Asian Journal of
Research in Business Economics and Management, Volume: 4, Pages: 292-311.
Rindfleisch, A., Malter, A. J., Ganesan, S. and Moorman, C. (2008) Cross-sectional versus longitudinal
survey research: Concepts, findings, and guidelines. Journal of Marketing Research, 45, 261-
279.
Ritala, P., Olander, H., Michailova, S. and Husted, K. (2015) Knowledge sharing, knowledge leaking
and relative innovation performance: An empirical study. Technovation, 35, 22-31.

Page 224
Rodriguez‐Gonzalez, O., Buckow, R., Koutchma, T. and Balasubramaniam, V. (2015) Energy
Requirements for Alternative Food Processing Technologies—Principles, Assumptions, and
Evaluation of Efficiency. Comprehensive Reviews in Food Science and Food Safety, 14, 536-
554.
Rodríguez‐Pose, A. and Villarreal Peralta, E. M. (2015) Innovation and Regional Growth in Mexico:
2000–2010. Growth and Change.
Roghie, F., Morteza, A. and Maryam, K. (2015) Spatial analysis of job satisfaction and organizational
commitment among employees of Tehran Municipality (District 5).International Journal of
Business and Technopreneurship, 5, 75-86.
Rolfe, R., Perri, A. and Woodward, D. (2015) Patterns and Determinants of Intra-African Foreign Direct
Investment. The Changing Dynamics of International Business in Africa, 4, 101.
Román, C., Congregado, E. and Millán, J. M. (2013) Start-up incentives: Entrepreneurship policy or
active labour market programme? Journal of Business Venturing, 28, 151–175.
Rosner, B., Glynn, R. J. and Lee, M. L. T. (2006) The Wilcoxon signed rank test for paired comparisons
of clustered data. Biometrics, 62, 185-192.
Rostamnezhad, S., Zarei, H. and Jalali, M. (2014) Identifying the role of technological entrepreneurship
on economic development.
Rotolo, D., Hicks, D. And Martin, B. R. (2015) What is an emerging technology? Research Policy, 44,
1827-1843.
Runkel, P. (2015) What Are T Values and P Values in Statistics? The Minitab Blog. 27 January 2015.
Rusu, G. And Avasilcăi, S. (2014) Factors Influencing Employees' Motivation for Knowledge
Communication. Advanced Materials Research, 2014. Trans Tech Publ, 657-662.
Ruwende, I. (2015) Government moves to promote FDI. The Herald, 14 September 2015, p.1.
Sabouri, M. S. and Safarpour, R. (2015) Analyzing of Economic Factors on Improvement of
Entrepreneurship Management of Firms Quick Impact at Agriculture Department for Poverty
Alleviation in Alborz County. Journal of Emerging Trends in Economics and Management
Sciences (JETEMS), 6, 284-290.
Sahoo, S. R. (2015) Technopreneurship: A Synthesis Based on Case Studies of Rural Innovators in India
Eleventh Biennial Conference on Entrepreneurship, 410-417
Page 225
Sai-Wing Ho, P. (2012) Revisiting Prebisch and Singer: Beyond the declining terms of trade thesis and
on to technological capability development. Cambridge Journal of Economics, 36(4), 869-893
Salaria, N. (2012) Meaning of the term descriptive survey research method. International journal of
transformations in business management, 1, 161-175.
Saldi, S. B. M. (2015) The Funding Landscape Among Technopreneurs In Malaysia. Project Paper
Submitted in Partial Fulfilment of the Requirements for the Degree of Master of Business
Administration (Leadership) Universiti Tun Abdul Razak APRIL 2015 researchgate.net.
Salerno, M. S., De Vasconcelos Gomes, L. A., Da Silva, D. O., Bagno, R. B. And Freitas, S. L. T. U.
(2015) Innovation processes: Which process for which project? Technovation, 35, 59-70.
Sabouri, M.S. and Safarpour, R. (2015) Analyzing of economic factors on improvement of
entrepreneurship management of firms quick impact at agriculture department for poverty
alleviation in Alborz County. Journal of Emerging Trends in Economics and Management
Sciences (JETEMS), 6(7), 284-290.
Sasson, A. (2012) Food security for Africa: an urgent global challenge. Agriculture & Food Security,
1(2), 1-16.
Satria Bekti, S. (2014) The Effect of Self-Efficacy and Entrepreneurship Learning Achievement on
Motivation of Technology Based Entrepreneurship (Technopreneurship) On Machinery
Technique Vocation Students Program Class Xi At Smk Muhammadiyah 3 Yogyakarta. E-
Jurnal Pendidikan Teknik Mesin.
Saunders, M., Lewis, P. and Thornhill, A. (2000) Research Methods for Business Students, New Delhi,
Prentice Hall
Saunders, M., Lewis, P. and Thornhill, A. (2007) Research Methods for Business Students, England,
Pearson Education.
Schumpeter, J. A. (1934) The Theory of Economic Development, Cambridge, Harvard University Press.
Schwendimann, B.A., Cattaneo, A.A., Dehler Zufferey, J., Gurtner, J.L., Bétrancourt, M. and
Dillenbourg, P. (2015) The ‘Erfahrraum’: a pedagogical model for designing educational
technologies in dual vocational systems. Journal of Vocational Education & Training, 67(3),
367-396.
Scotland, J. (2012) Exploring the philosophical underpinnings of research: relating ontology and
epistemology to the methodology and methods of the scientific, interpretive, and critical

Page 226
research paradigms. English Language Teaching, 5, 9.
Sekaran, U. and Bougie, R. (2009) Research Methods for Business: A Skill Building Approach, West
Sussex UK, Wiley and Sons ltd.
Shaari, M.S., Hussain, N.E. and Ismail, M.S. (2013) Relationship between energy consumption and
economic growth: empirical evidence for Malaysia. Business Systems Review, 2(1), 17-28.
Shane, S. and Venkataraman, S. (2000) The promise of entrepreneurship as a field of research. Academy
of management review, 25(1), 217-226.
Shukla, P. (2008) Essentials of marketing research, Ventus Publishing Aps Bookboon.
Sichone, O. (2003) Zimbabwe’s Economic Policies, 1980–2002.Development Policy Management
Forum Bulletin, 2003.
Sichone, O. (2003) Zimbabwe’s Economic Policies, 1980–2002.In Development Policy Management
Forum Bulletin (Vol. 10, No. 2).
Siegel, D. S. and Wright, M. (2015) Academic Entrepreneurship: Time for a Rethink? British Journal of
Management.
Siegrist, M., Stampfli, N., Kastenholz, H. and Keller, C. (2008) Perceived risks and perceived benefits
of different nanotechnology foods and nanotechnology food packaging. Appetite, 51, 283-290.
Sindakis, S. and Walter, C. eds. (2015) The Entrepreneurial Rise in Southeast Asia: The Quadruple
Helix Influence on Technological Innovation. Palgrave Macmillan.
Singer H. W. (1950) The distribution of gains between investing and borrowing countries, American
Economic Review, 40, 473–485.
Sindzingre A (2012) The Impact of The 2008–2009 Crisis on Commodity-Dependent Low-Income
African Countries: Confirming The Relevance of The Concept of Poverty Trap? Journal of
International Development, 24, 989–1007
Smart, J., Nel, E., and Binns, T. (2015) Economic crisis and food security in Africa: Exploring the
significance of urban agriculture in Zambia’s Copperbelt province. Geoforum, 65, 37-45.
Smutkupt, S. (2015) The Key Antecedents Of Shared Vision: A Case Study On An Industrial Estate
Developer In Thailand. AU Journal of Management, 12.
Soludo, C. C., Ogbu, M. O. and Chang, H.-J. (2004) The politics of Trade and Industrial Policy in

Page 227
Africa: Forced Consensus? IDRC.
Soviar, J. (2015) Cluster initiatives in Žilina region (Slovak Republic).Economics and Management,
528-534.
Stephen, A. I. (2015) The Effects of the Discrimination between Polytechnic Education and University
Education on the Overall Technological Development of Nigeria. Industrial Engineering
Letters, 5, 41-45.
Stone, D. H. (1993) Design A Questionnaire. British Medical Journal, 307, 1264-1266.
Strumickas, M. and Valanciene, L. (2015) Research of management accounting changes in Lithuanian
business organizations. Engineering Economics, 63(4), 178-184.
Stull, W. J. (2014) Taking the Plunge: Teaching the Microeconomics of Entrepreneurship. International
Advances in Economic Research, 20, 139-150.
Stumm, S. V. (2011) The Pros and Cons of using SPSS as a Research Tool to explore Individual
Differences. SPSS User Group Meeting.
www.spssusers.co.uk/Events/2011/Vonstumm2011.ppt: University of Edinburgh.
Sun, C. C. (2011) Evaluating and benchmarking productive performances of six industries in Taiwan.
Hsin Chu Industrial Science Park Expert Systems with Applications, 38, 2195–2205.
Szirmai, A. (2012) Industrialisation as an engine of growth in developing countries, 1950–2005.
Structural Change and Economic Dynamics 23, 406–420.
Szirmai, A. (2013) 9.Explaining Success and Failure in Economic Development1.World Economic
Performance Past, Present and Future, 227.
Tang, J. And Altshuler, R. (2015) The spillover effects of outward foreign direct investment on home
countries: evidence from the United States. Available at SSRN 2545129.
The Citizen. (2015) Zim Supreme Court ruling triggers big job losses The Citizen, 23 September 2015.
Thorsteinsson, G. And Olafsson, B. (2015) Piloting technological understanding and reasoning in
Icelandic schools. International Journal of Technology and Design Education, 1-15.
Toral, J. (2012) Definitions of Technopreneurship and Technopreneurs [Online]. AIE College
International: http://ramonching22.wordpress.com/2012/04/25/definition-of-technopreneurship/.

Page 228
Tourangeau, R. And Yan, T. (2007) Sensitive Questions in Surveys. Psychological Bulletin, 133, 859-
883.
Trading Economics (2016) Zimbabwe Balance of Trade 1991-2016
http://www.tradingeconomics.com/zimbabwe/balance-of-trade
Trading Economics, (2015) Zimbabwe Government Budget. Retrieved 7 November 2015.
Tripathi P C and Shukla A (2005) Research Methodology in Social Sciences New Delhi, Sultan Chad
and Sons.
Tsuchiya, R. 2015. Nascent Entrepreneurship Process and Effect of Firm Size: Evidence from Taiwan’s
Labor Market. International review of business, 25-44.
Tsukada, N. and Nagaoka, S. (2015) Determinants of International Research Collaboration: Evidence
from International Co‐Inventions in Asia and Major OECD Countries. Asian Economic Policy
Review, 10, 96-119.
Tuszynski, M., Steeves, J., Fawcett, J., Lammertse, D., Kalichman, M., Rask, C., Curt, A., Ditunno, J.,
Fehlings, M. and Guest, J. (2007) Guidelines for the conduct of clinical trials for spinal cord
injury as developed by the ICCP Panel: clinical trial inclusion/exclusion criteria and ethics.
Spinal Cord, 45, 222-231.
Ünay, F. G. and Zehir, C. (2012) Innovation intelligence and entrepreneurship in the fashion
industry.Procedia - Social and Behavioral Sciences, 41, 315-321.
United Nations, (2014) Millennium Development Goals: 2013 Progress Chart [Online].
http://mdgs.un.org/unsd/mdg/Resources/Static/Products/Progress2013/Progress_E.pdf.
Retreived 19 November 2015.
United Nations, (2015) Millennium Development Goals: 2014 Progress Chart [Online].
http://mdgs.un.org/unsd/mdg/Resources/Static/Products/Progress2014/Progress_E.pdf.
Retrieved 11 March 2014.
Urabe, K., Child, J., and Kagono, T. (1988) Innovation and management: International comparisons
(Vol. 13). Walter de Gruyter.
Urban, B. (2010) Entrepreneurship as a discipline and field of study. In Frontiers in Entrepreneurship,
(pp. 33-62). Springer Berlin Heidelberg.
Usman, A. and Tasmin, R. (2015) Entrepreneurial Skills Development Strategies through the Mandatory

Page 229
Students’ Industrial Work Experience Scheme in Nigeria. Procedia-Social and Behavioral
Sciences, 204, 254-258.
Utterback, J. (1994) Mastering the dynamics of innovation: how companies can seize opportunities in
the face of technological change. University of Illinois at Urbana-Champaign's Academy for
Entrepreneurial Leadership Historical Research Reference in Entrepreneurship.
Van der Lingen, E. and Van Niekerk, G. (2015) Entrepreneurship Traits of Science, Engineering and
Technology (SET) Students.
Var, I. and SagLam, S. (2015) Nanotechnology applications in the food industry. GIDA-Journal of
Food, 40, 101-108.
Velikova, D., Kohler, J. And Gerten, R. (2014) Case Study on Financing and Business Development
Processes in Technopreneurship. In: Galbraith, B., ed. 9th European Conference on Innovation
and Entrepreneurship, 2014 University of Ulster Belfast UK. Academic Conferences and
Publishing International Limited.
Velikova, D., Kohler, J. and Gerten, R. (2014) Case Study on Financing and Business Development
Processes in Technopreneurship. 9th European Conference on Innovation and
Entrepreneurship: ECIE2014, 2014. Academic Conferences Limited, 445.
Venkataraman, S. (2004) Regional transformation through technological entrepreneurship. Journal of
Business venturing, 19(1), 153-167.
Venkataraman, S. (2004) Regional transformation through technological entrepreneurship Journal of
Business Venturing, 19, 153-167.
Wagner, C. S., Horlings, E. And Dutta, A. (2015) Can science and technology capacity be measured?
arXiv preprint arXiv:1501.06789.
Wahba, J. and Zenou, Y. (2012) Out of sight, out of mind: Migration, entrepreneurship and social
capital. Regional Science and Urban Economics 42, 890–903.
Wang, Y., Fang, C., Jiang, Q. and Ahmed, S.N. (2015) The Automatic Drilling System of 6R-2P Mining
Drill Jumbos. Advances in Mechanical Engineering, 7(2), 504-561.
Wealth and Finance International, (2015) FDI in China Rises 10.4%. Foreign Direct Investment.
Retrieved 5 September 2015.

Page 230
Wealth and Finance International, (2015) FDI Investment Slumps in Zimbabwe. Wealth and Finance
Interational. Retrieved 5 September 2015.
Wegner, T. (2002) Applied Business Statistics, Cape Town, Juta.
Wheeldon, J. 2010. Mapping mixed methods research: Methods, measures, and meaning. Journal of
Mixed Methods Research, 4, 87-102.
Whelan, T. J. (2015) Response Rates in 21st Century Organizational Survey Research: A Conceptual
Model and Meta-analysis.
Whitley, E. and Ball, J. 2002. Statistics review 6: Nonparametric methods. Critical Care-London-, 6,
509-513.
Wilmot, A. (2005) Designing sampling strategies for qualitative social research: with particular
reference to the Office for National Statistics' Qualitative Respondent Register. Survey
Methodology Bulletin-Office for National Statistics-, 56, 53.
Wilson, J. (2014) Essentials of business research: A guide to doing your research project, Sage.
Wojewnik-Filipkowska, A. and Kowalski, R. (2015) Investing In Industrial-Technology Parks In City
Development-A Cost-Benefit Analysis. Real Estate Management and Valuation, 23, 24-41.
Wong, C.-Y. (2011) Rent-seeking, industrial policies and national innovation systems in Southeast
Asian economies Technology in Society, 33, 231–243.
Wong, P.-K. (2015) Toward an ecosystem for innovation in a newly industrialized economy.
Entrepreneurship and Knowledge Exchange, 406.
Wong, P-K., Ho, H-P.and Singh, A. (2007) Towards an “Entrepreneurial University” Model to Support
Knowledge-Based Economic Development: The Case of the National University of Singapore.
World Development, 35, 941–958.
Wong, T. Y. (2013) Evaluation of technopreneurship policies in Singapore. Nanyang Technological
University. Doctoral Thesis.NTU Library https://dr.ntu.edu.sg/handle/10356/53488.
Wonglimpiyarat, J. And Khaemasunun, P. (2015) China’s innovation financing system: Triple Helix
policy perspectives. Triple Helix, 2, 1-18.
World Atlas (2015) Zimbabwe Maps www.worldatlas.com/webimage/countrys/africa/zimbabwe/

Page 231
Wright, M. (2014) Academic entrepreneurship, technology transfer and society: Where next? The
Journal of Technology Transfer, 39, 322-334.
Xin, L. and Weiguo, L. (2011) Study on the Industrialization of Servicing of Solar Water Heaters
Energy. Procedia - Social and Behavioral Sciences, 5, 513–519.
Yeoh, P. L. (2014) Internationalization and Performance Outcomes of Entrepreneurial Family SMEs:
The Role of Outside CEOs, Technology Sourcing, and Innovation. Thunderbird International
Business Review, 56, 77-96.
Yetisen, A. K., Volpatti, L. R., Coskun, A. F., Cho, S., Kamrani, E., Butt, H., Khademhosseini, A. and
Yun, S. H. (2015) Entrepreneurship. Lab on a chip, Online.
Yiu, D. W., Wan, W. P., Ng, F. W., Chen, X. And Su, J. (2014) Sentimental Drivers of Social
Entrepreneurship: A Study of China's Guangcai (Glorious) Program. Social entrepreneurship
and sentiment driving force : China Guangcai research. Management and Organization Review,
10, 55-80.
Yusop, A. Y. M. (2011). Human Governance in Technopreneurship: As a Means for Sustainable Future.
Zahra, S. A. (2015) Corporate entrepreneurship as knowledge creation and conversion: The role of
entrepreneurial hubs. Small Business Economics, 44, 727-735.
Zhang, G., Peng, X. and Li, J. (2008) Technological entrepreneurship and policy environment: a case of
China. Journal of Small Business and Enterprise Development, 15(4), 733-751.
Zhou, W. (2013) Political connections and entrepreneurial investment: Evidence from China's transition
economy. Journal of Business Venturing, 28, 299–315.
Zikmund, W. and Babin, B. (2012) Essentials of marketing research, Cengage Learning.
Zimbabwe Government, (2013) Zimbabwe Agenda for Sustainable Socio-Economic Transformation
(Zim Asset) “Towards an Empowered Society and a Growing Economy”.
http://www.dpcorp.co.zw/assets/zim-asset.pdf: Zimbabwe Government.
Zimbabwe National Statistics Agency, (2015) 2014 Labour Force Survey. http://www.zimstat.co.zw/:
Zimbabwe National Statistics Agency. [Accessed 15 October 2015].
Zimbabwe National Statistics Agency, (2015) Quarterly Digest of Statistics: 1st Quarter 2015
http://www.zimstat.co.zw/: Zimbabwe National Statistics Agency. Retrieved 15 October 2015.

Page 232
Zimbabwe National Statistics Agency, (2015) Statistics at a glance [Online].
http://www.zimstat.co.zw/index.php?option=com_contentandview=articleandid=18:statistics-at-
a-glance: Zimbabwe National Statistics Agency. Retrieved 15 October 2015.
Zinyama, T. and Nhema, A. G. (2015) Public-Private Partnerships: Critical Review and Lessons for
Zimbabwe. Public Policy and Administration Research, 5, 39-44.
Zimeye (2015) Innscor Buying 3 more companies http://www.zimeye.net/innscor-buying-3-more-
companies/
Zinyuke, R. (2013) Manufacturing Woes Persist, The Herald: Business: October 3, 2013.

Page 233
APPENDIX 1: The Questionnaire
UNIVERSITY OF KWAZULU-NATAL
School of Management, IT and Governance
Dear Respondent,
PhD Research Project
Researcher: Nicholas Z. Kakava +263772887043
Supervisor: Dr. Ziska Fields +27 31 260 8103
Research Office: Ms P Ximba 031-2603587
I, Nicholas Zivengwa Kakava, am a PhD student in the School of Management, IT and Governance, at
the University of KwaZulu-Natal. You are invited to participate in a research project entitled: “Factors
Influencing Technopreneurship in the Food Processing Sector in Zimbabwe.” The aim of this study is to
establish factors which influence technopreneurship in the food processing sector.
Through your participation I hope to understand issues to do with technopreneurship in your organization.
The result of this survey is intended to contribute to the growth and development of the food processing
sector in Zimbabwe.
Your participation in this project is voluntary. You may refuse to participate or withdraw from the project
at any time with no negative consequence. There will be no monetary gain from participating in this
research project. Confidentiality and anonymity of records identifying you as a participant will be
maintained by the School of Management, IT and Governance, at the University of KwaZulu-Natal.
If you have any questions or concerns about participating in this study, please contact me or my supervisor
at the numbers listed above.
It should take you less than 15 minutes to complete the questionnaire. I hope you will take the time to
complete the questionnaire.
Sincerely
Investigator’s signature_____________________________ Date_________________
This page is to be retained by participant

Page 234
UNIVERSITY OF KWAZULU-NATAL
School of Management, IT and Governance
PhD Research Project
Researcher: Nicholas Z. Kakava +263772887043
Supervisor: Dr. Ziska Fields +27 31 260 8103
Research Office: Ms P Ximba 031-2603587
CONSENT
I_________________________________________________________(full names of participant)
hereby confirm that I understand the contents of this document and the nature of the research project, and
I consent to participating in the research project. I understand that I am at liberty to withdraw from the
project at any time, should I so desire.
___________________ ___________________
Signature of Participant Date
This page is to be retained by researcher

Page 235
Questionnaire
Please complete this questionnaire by ticking in the appropriate box or writing on given spaces. This
should take you less than 15 minutes.
Terminology: “Technopreneurship refers to a business approach that employs both technological and
entrepreneurial skills to revive existing projects or start new ones”.
1. The role of Technopreneurship in the food processing sector.
Indicate how important the following aspects are to your company:
Aspect Not at all
Important
Not that
Important Undecided Important
Very
Important
1.1 Food processing
technology
1.2 Entrepreneurship
orientation
1.3 Technopreneurship
2. Factors that influence technopreneurship in the food processing sector.
Indicate your agreement with the following statements with regard to your company:
Statement
Strongly
Agree Agree Not sure Disagree
Strongly
Disagree
Internal Processes
2.1 The company has the latest food
processing technology.
2.2 The processing machinery is
currently fully utilised.
2.3 Machinery is replaced as soon as it
is old.
2.4
The company continuously
updates itself with the latest
processing technology.
2.5
Changing to new processing
technology is not a problem for the
company.
2.6 The company has a research and
development (R&D) department.

Page 236
Human Factor
2.7
Plant engineers have full
knowledge of the processing
machinery.
2.8 The company continuously trains
its workers
Statement Strongly
Agree Agree Not sure Disagree
Strongly
Disagree
2.9 The workers support the
organisation’s vision.
Venture Capital
2.10 The company has access to venture
capital loans.
2.11
The company endeavours to create
relations with local and foreign
venture capitalists.
Partnerships
2.12 The company has foreign partners
in finance & technology.
2.13
The company has links with R&D
institutions, e.g. universities in
Zimbabwe.
Government Support
2.14
Electricity load shading hampers
the food processing business in
Zimbabwe.
2.15
Electricity costs are a drawback to
the food processing business in
Zimbabwe.
2.16
Government taxes are a drawback
to the food processing in
Zimbabwe.
2.17
The government gives policy
support to the food processing
sector in Zimbabwe

Page 237
Global Factors
2.18
The company’s products are of a
higher quality than imported
products.
2.19
The company keeps track of global
trends in the food processing
sector.
2.20
The company can stand up against
competition from neighbouring
countries.
3. Critical success factors that influence technopreneurship in the food processing sector.
Indicate how important you believe the following factors are to the successful adoption of
technopreneurship in the food processing industry
Aspect
Not at all
Important
Not really
Important Neutral Important
Extremely
Important
3.1 Internal processes
3.2 Human Factor
3.3 Venture Capital
3.4 Partnerships
3.5 Government Support
3.6 Global factors
3.7 Process Innovation
3.8 Product Innovation
3.9 Technological Innovation
3.10 Business Innovation
3.11 Daily/Monthly
Production
3.12 Quality of products
3.13 Minimisation of costs
3.14 Involvement of all
workers
3.15 Participation of all
workers

Page 238
3.16 Team work
3.17 Responsiveness to
customer needs
3.18 Skills development
3.19 Dynamism to suit
situations.
4. Feasibility of Technopreneurship in the food processing sector
Indicate your opinion on the following items with particular regard to your company.
Aspect Definitely
yes
Yes, to
some
extent.
Neutral No, not
really
No, not at
all
4.1
Is there enough demand for
processed food products in
Zimbabwe?
4.2
Does the company have the
capacity to satisfy the
demand?
4.3
Does the company possess
enough technology for food
processing?
4.4
Does the company have the
capacity to acquire new
processing technology?
4.5 Does the company possess
enough entrepreneurial skills?
4.6
Can the company compete
with existing food products on
the market?

Page 239
5. Demographic information
Select ONE option for each of the following questions
5.1
Your
specialisation
Engineering only Business only Both Engineering
& Business
Other
(Please Specify)
5.2.
Your position
5.3.
Your department
5.4.
Gender
Male Female
5.5.
Please indicate
your highest level
of education
O-
level
Certifica
te
Diplom
a Degree
Honours Masters PhD
THANK YOU
THE END

Page 240
APPENDIX 2: DATA ANALYSIS TABLES AND GRAPHS
Demographic Data
Table A2.1: A frequency distribution table showing respondents’ areas of specialisation
Frequency Percent Valid Percent
Cumulative
Percent
Valid Engineering only 30 20.4 20.8 20.8
Business only 69 46.9 47.9 68.8
Engineering and
business
26 17.7 18.1 86.8
Other 19 12.9 13.2 100.0
Total 144 98.0 100.0
Missing System 3 2.0
Total 147 100.0
Table A2.2: A frequency distribution table showing respondents’ gender
Frequency Percent Valid Percent
Cumulative
Percent
Valid Male 99 67.3 68.3 68.3
Female 46 31.3 31.7 100.0
Total 145 98.6 100.0
Missing System 2 1.4
Total 147 100.0
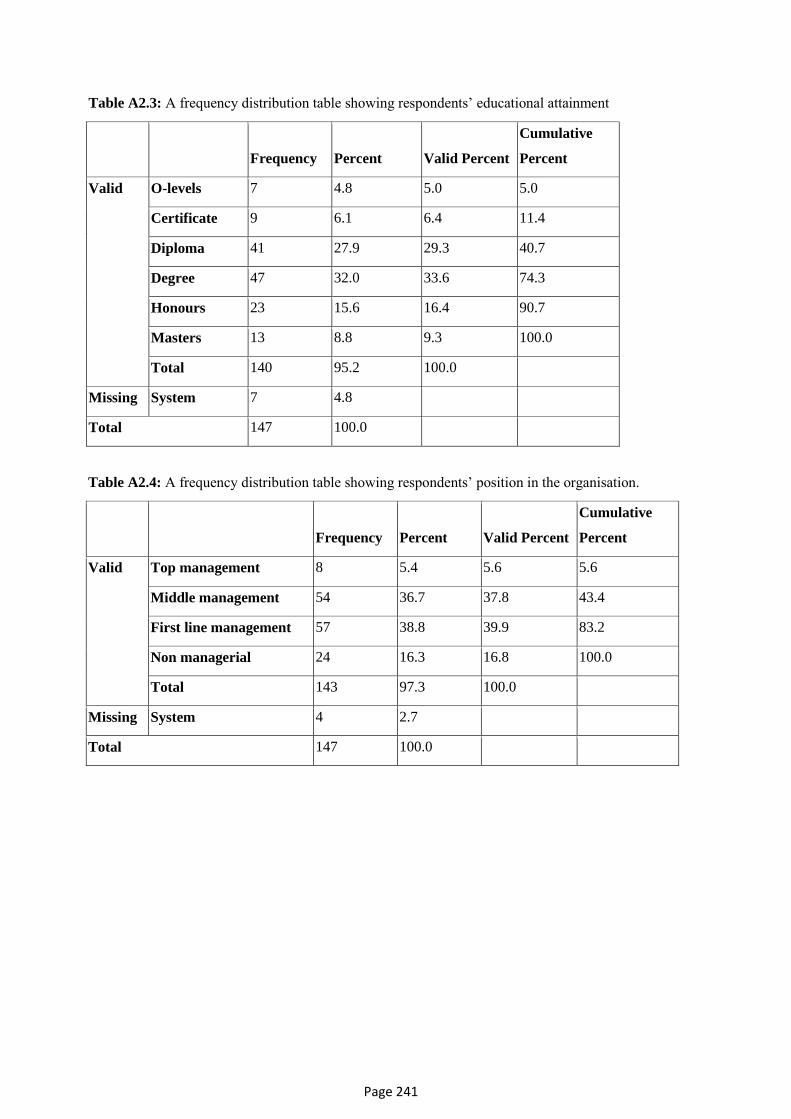
Page 241
Table A2.3: A frequency distribution table showing respondents’ educational attainment
Frequency Percent Valid Percent
Cumulative
Percent
Valid O-levels 7 4.8 5.0 5.0
Certificate 9 6.1 6.4 11.4
Diploma 41 27.9 29.3 40.7
Degree 47 32.0 33.6 74.3
Honours 23 15.6 16.4 90.7
Masters 13 8.8 9.3 100.0
Total 140 95.2 100.0
Missing System 7 4.8
Total 147 100.0
Table A2.4: A frequency distribution table showing respondents’ position in the organisation.
Frequency Percent Valid Percent
Cumulative
Percent
Valid Top management 8 5.4 5.6 5.6
Middle management 54 36.7 37.8 43.4
First line management 57 38.8 39.9 83.2
Non managerial 24 16.3 16.8 100.0
Total 143 97.3 100.0
Missing System 4 2.7
Total 147 100.0
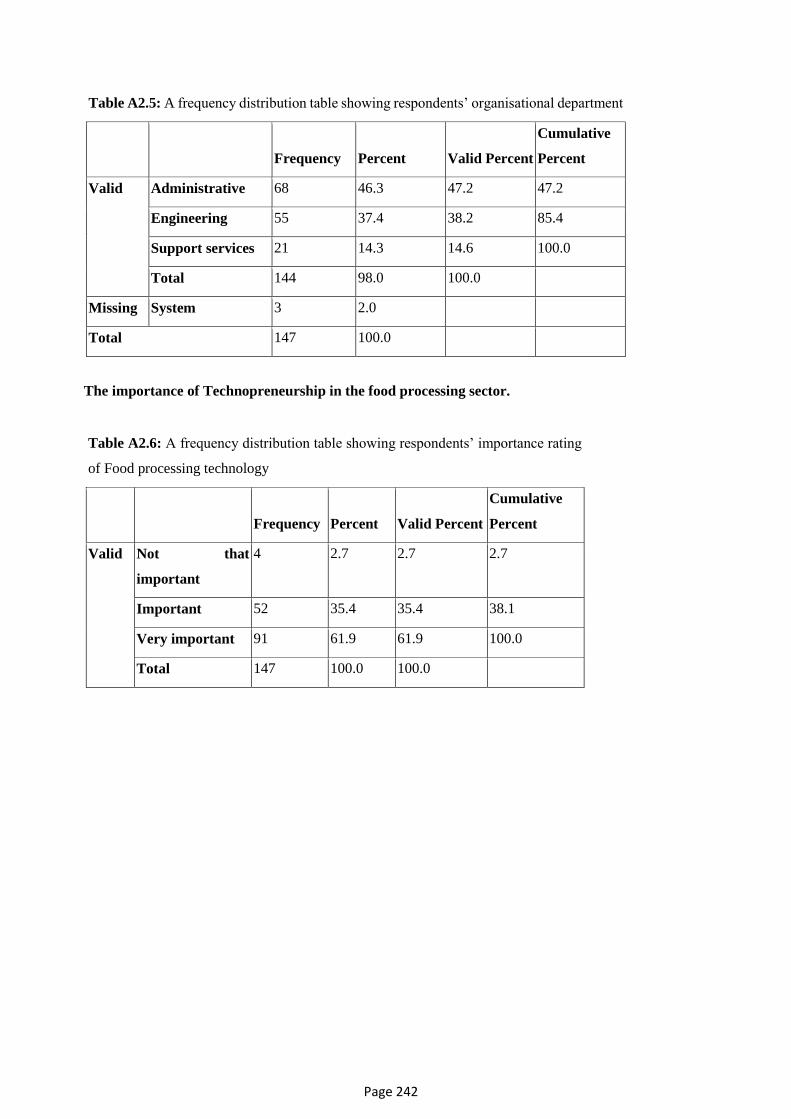
Page 242
Table A2.5: A frequency distribution table showing respondents’ organisational department
Frequency Percent Valid Percent
Cumulative
Percent
Valid Administrative 68 46.3 47.2 47.2
Engineering 55 37.4 38.2 85.4
Support services 21 14.3 14.6 100.0
Total 144 98.0 100.0
Missing System 3 2.0
Total 147 100.0
The importance of Technopreneurship in the food processing sector.
Table A2.6: A frequency distribution table showing respondents’ importance rating
of Food processing technology
Frequency Percent Valid Percent
Cumulative
Percent
Valid Not that
important
4 2.7 2.7 2.7
Important 52 35.4 35.4 38.1
Very important 91 61.9 61.9 100.0
Total 147 100.0 100.0

Page 243
Table A2.7: A frequency distribution table showing respondents’ importance rating of
entrepreneurship orientation
Frequency Percent Valid Percent
Cumulative
Percent
Valid Not at all
important
6 4.1 4.3 4.3
Not that important 10 6.8 7.1 11.3
Undecided 17 11.6 12.1 23.4
Important 61 41.5 43.3 66.7
Very important 47 32.0 33.3 100.0
Total 141 95.9 100.0
Missing System 6 4.1
Total 147 100.0
Table A2.8: A frequency distribution table showing respondents’ importance rating of
technopreneurship
Frequency Percent
Valid
Percent
Cumulative
Percent
Valid Not at all important 4 2.7 2.8 2.8
Not that important 10 6.8 7.1 9.9
Undecided 12 8.2 8.5 18.4
Important 61 41.5 43.3 61.7
Very important 54 36.7 38.3 100.0
Total 141 95.9 100.0
Missing System 6 4.1
Total 147 100.0
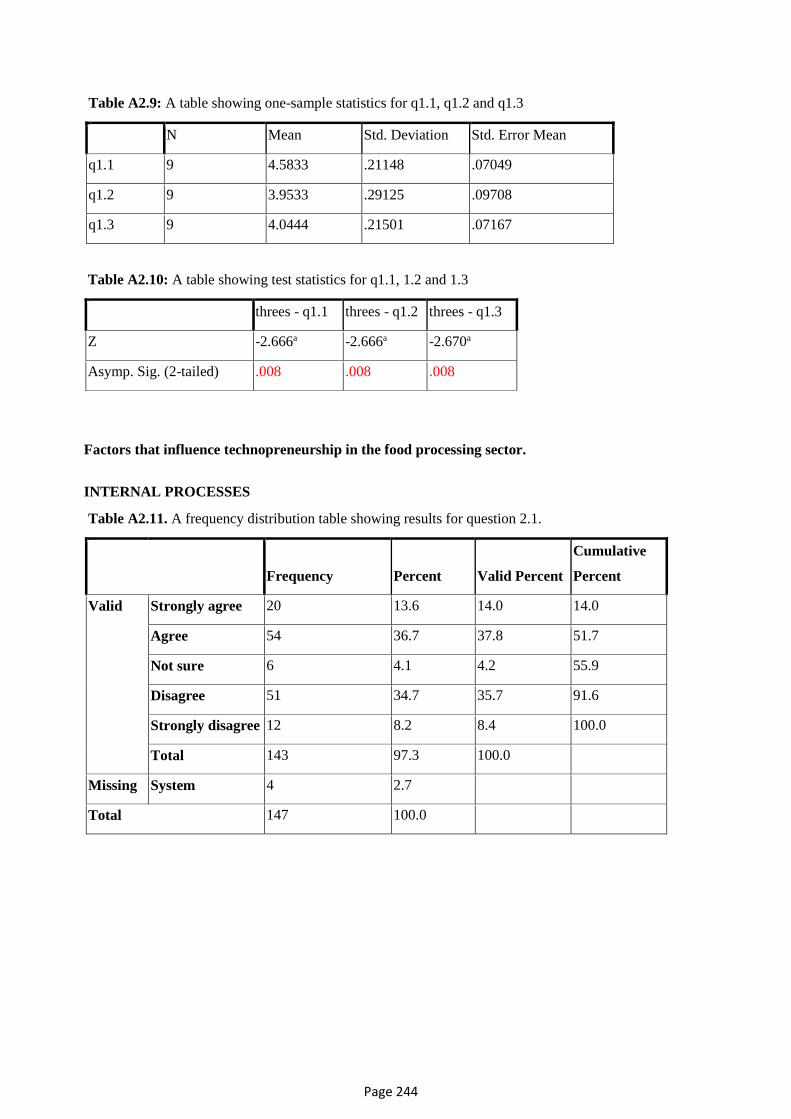
Page 244
Table A2.9: A table showing one-sample statistics for q1.1, q1.2 and q1.3
N Mean Std. Deviation Std. Error Mean
q1.1 9 4.5833 .21148 .07049
q1.2 9 3.9533 .29125 .09708
q1.3 9 4.0444 .21501 .07167
Table A2.10: A table showing test statistics for q1.1, 1.2 and 1.3
threes - q1.1 threes - q1.2 threes - q1.3
Z -2.666a -2.666a -2.670a
Asymp. Sig. (2-tailed) .008 .008 .008
Factors that influence technopreneurship in the food processing sector.
INTERNAL PROCESSES
Table A2.11. A frequency distribution table showing results for question 2.1.
Frequency Percent Valid Percent
Cumulative
Percent
Valid Strongly agree 20 13.6 14.0 14.0
Agree 54 36.7 37.8 51.7
Not sure 6 4.1 4.2 55.9
Disagree 51 34.7 35.7 91.6
Strongly disagree 12 8.2 8.4 100.0
Total 143 97.3 100.0
Missing System 4 2.7
Total 147 100.0

Page 245
Table A2.12. A frequency distribution table showing results of question 2.2.
Frequency Percent Valid Percent
Cumulative
Percent
Valid Strongly agree 6 4.1 4.1 4.1
Agree 39 26.5 26.5 30.6
Not sure 17 11.6 11.6 42.2
Disagree 69 46.9 46.9 89.1
Strongly disagree 16 10.9 10.9 100.0
Total 147 100.0 100.0
Table A2.13. A frequency distribution table showing results for question 2.3.
Frequency Percent Valid Percent
Cumulative
Percent
Valid Strongly agree 4 2.7 2.7 2.7
Agree 25 17.0 17.0 19.7
Not sure 16 10.9 10.9 30.6
Disagree 69 46.9 46.9 77.6
Strongly disagree 33 22.4 22.4 100.0
Total 147 100.0 100.0
Table A2.14. A frequency distribution table showing results of q2.4.
Frequency Percent Valid Percent
Cumulative
Percent
Valid Strongly agree 7 4.8 4.8 4.8
Agree 46 31.3 31.3 36.1
Not sure 17 11.6 11.6 47.6
Disagree 69 46.9 46.9 94.6
Strongly disagree 8 5.4 5.4 100.0
Total 147 100.0 100.0

Page 246
Table A2.15. A frequency distribution table showing results for q2.5.
Frequency Percent Valid Percent
Cumulative
Percent
Valid Strongly agree 15 10.2 10.2 10.2
Agree 27 18.4 18.4 28.6
Not sure 17 11.6 11.6 40.1
Disagree 64 43.5 43.5 83.7
Strongly disagree 24 16.3 16.3 100.0
Total 147 100.0 100.0
Table A2.16. A frequency distribution table showing results for q2.6.
Frequency Percent Valid Percent
Cumulative
Percent
Valid Strongly agree 20 13.6 13.6 13.6
Agree 63 42.9 42.9 56.5
Not sure 25 17.0 17.0 73.5
Disagree 19 12.9 12.9 86.4
Strongly disagree 20 13.6 13.6 100.0
Total 147 100.0 100.0

Page 247
Table A2.17. A table showing one sample statistics for questions 2.1, 2.2, 2.3,
2.4, 2.5 and 2.6
N Mean Std. Deviation Std. Error Mean
q2.1 The company has the latest
food processing technology.
143 2.87 1.274 .107
q2.2 The processing machinery
is currently fully utilised.
147 3.34 1.107 .091
q2.3 Machinery is replaced as
soon as it is old.
147 3.69 1.083 .089
q2.4 The company continuously
updates itself with the latest
processing technology.
147 3.17 1.081 .089
q2.5 Changing to new
processing technology is not a
problem for the company.
147 3.37 1.245 .103
q2.6 The company has a
research and development
(R&D) department.
147 2.70 1.252 .103
Table A2.18: A table showing one sample test results for questions 2.1, 2.2, 2.3, 2.4, 2.5 and 2.6
95% Confidence Interval
of the Difference
t df
Sig. (2-
tailed)
Mean
Difference Lower Upper
q2.1 The company has the latest food
processing technology.
-1.247 142 .214 -.133 -.34 .08
q2.2 The processing machinery is currently
fully utilised.
3.725 146 .000 .340 .16 .52
q2.3 Machinery is replaced as soon as it is
old.
7.768 146 .000 .694 .52 .87
q2.4 The company continuously updates
itself with the latest processing technology.
1.907 146 .059 .170 .00 .35
q2.5 Changing to new processing
technology is not a problem for the
company.
3.643 146 .000 .374 .17 .58
q2.6 The company has a research and
development (R&D) department.
-2.899 146 .004 -.299 -.50 -.10

Page 248
HUMAN FACTOR
Table A2.19. A frequency distribution table showing results for q2.7
Frequency Percent
Valid
Percent
Cumulative
Percent
Valid Strongly agree 28 19.0 19.0 19.0
Agree 95 64.6 64.6 83.7
Not sure 14 9.5 9.5 93.2
Disagree 8 5.4 5.4 98.6
Strongly disagree 2 1.4 1.4 100.0
Total 147 100.0 100.0
Table A2.20. A frequency distribution table showing results for q2.8
Frequency Percent
Valid
Percent
Cumulative
Percent
Valid Strongly agree 25 17.0 17.0 17.0
Agree 53 36.1 36.1 53.1
Not sure 18 12.2 12.2 65.3
Disagree 43 29.3 29.3 94.6
Strongly disagree 8 5.4 5.4 100.0
Total 147 100.0 100.0
Table A2.21. A frequency distribution table showing results for q2.6.
Frequency Percent
Valid
Percent
Cumulative
Percent
Valid Strongly agree 28 19.0 19.0 19.0
Agree 85 57.8 57.8 76.9
Not sure 16 10.9 10.9 87.8
Disagree 14 9.5 9.5 97.3
Strongly disagree 4 2.7 2.7 100.0
Total 147 100.0 100.0

Page 249
Table A2.22: Showing one-sample statistics for questions 2.7, 2.8, 2.9 and 2.9
N Mean
Std.
Deviation
Std.
Error
Mean
q2.7 Plant engineers have full knowledge of the
processing machinery.
147 2.05 .792 .065
q2.8 The company continuously trains its workers 147 2.70 1.213 .100
q2.9 The workers support the organisation’s vision. 147 2.19 .946 .078
Table A2.23: A table showing one-sample test results for questions 2.7, 2.8 and 2.9
Test Value = 3
95%
Confidence
Interval of the
Difference
t df
Sig. (2-
tailed)
Mean
Difference Lower Upper
q2.7 Plant engineers have full
knowledge of the processing
machinery.
-14.477 146 .000 -.946 -1.07 -.82
q2.8 The company continuously trains
its workers
-2.992 146 .003 -.299 -.50 -.10
q2.9 The workers support the
organisation’s vision.
-10.375 146 .000 -.810 -.96 -.66

Page 250
VENTURE CAPITAL
Table A2.24. A frequency distribution table showing results for q2.10.
Frequency Percent
Valid
Percent
Cumulative
Percent
Valid Strongly agree 10 6.8 6.8 6.8
Agree 54 36.7 36.7 43.5
Not sure 50 34.0 34.0 77.6
Disagree 19 12.9 12.9 90.5
Strongly disagree 14 9.5 9.5 100.0
Total 147 100.0 100.0
Table A2.25. A frequency distribution table showing results for q2.11
Frequency Percent
Valid
Percent
Cumulative
Percent
Valid Strongly agree 5 3.4 3.4 3.4
Agree 74 50.3 51.0 54.5
Not sure 33 22.4 22.8 77.2
Disagree 19 12.9 13.1 90.3
Strongly disagree 14 9.5 9.7 100.0
Total 145 98.6 100.0
Missing System 2 1.4
Total 147 100.0
Table A2.26: A table showing one-sample statistics for questions 2.10 and 2.11.
N Mean
Std.
Deviation
Std. Error
Mean
q2.10 The company has access to venture capital loans. 147 2.82 1.060 .087
q2.11 The company endeavours to create relations with
local and foreign venture capitalists.
145 2.74 1.053 .087

Page 251
Table A2.27: A table showing one-sample test results for questions 2.10 and 1.11.
Test Value = 3
95% Confidence
Interval of the
Difference
t df
Sig. (2-
tailed)
Mean
Difference Lower Upper
q2.10 The company has access to
venture capital loans.
-2.101 146 .037 -.184 -.36 -.01
q2.11 The company endeavours to
create relations with local and
foreign venture capitalists.
-2.919 144 .004 -.255 -.43 -.08
PARTNERSHIPS
Table A2.28. A frequency distribution table showing results for q2.12.
Frequency Percent
Valid
Percent
Cumulative
Percent
Valid Strongly agree 8 5.4 5.4 5.4
Agree 30 20.4 20.4 25.9
Not sure 49 33.3 33.3 59.2
Disagree 38 25.9 25.9 85.0
Strongly disagree 22 15.0 15.0 100.0
Total 147 100.0 100.0

Page 252
Table A2.29. A frequency distribution table showing results for q2.13
Frequency Percent
Valid
Percent
Cumulative
Percent
Valid Strongly agree 4 2.7 2.7 2.7
Agree 53 36.1 36.1 38.8
Not sure 47 32.0 32.0 70.7
Disagree 35 23.8 23.8 94.6
Strongly disagree 8 5.4 5.4 100.0
Total 147 100.0 100.0
Table A2.30: A table showing one-sample statistics questions 2.12 and 2.13
N Mean
Std.
Deviation
Std.
Error
Mean
q2.12 The company has foreign partners in finance &
technology.
147 3.24 1.108 .091
q2.13 The company has links with R&D institutions, e.g.
universities in Zimbabwe.
147 2.93 .963 .079
Table A2.31: A table showing one-sample test results for questions 2.12 and 2.13
Test Value = 3
95% Confidence
Interval of the
Difference
t df
Sig. (2-
tailed)
Mean
Difference Lower Upper
q2.12 The company has foreign partners
in finance & technology.
2.680 146 .008 .245 .06 .43
q2.13 The company has links with R&D
institutions, e.g. universities in
Zimbabwe.
-.857 146 .393 -.068 -.22 .09

Page 253
GOVERNMENT SUPPORT
Table A2.32. A frequency distribution table showing results for q2.14
Frequency Percent
Valid
Percent
Cumulative
Percent
Valid Strongly agree 72 49.0 49.0 49.0
Agree 65 44.2 44.2 93.2
Not sure 1 .7 .7 93.9
Disagree 3 2.0 2.0 95.9
Strongly disagree 6 4.1 4.1 100.0
Total 147 100.0 100.0
Table A2.33: A frequency distribution table showing results for q2.15
Frequency Percent
Valid
Percent
Cumulative
Percent
Valid Strongly agree 54 36.7 36.7 36.7
Agree 60 40.8 40.8 77.6
Not sure 16 10.9 10.9 88.4
Disagree 13 8.8 8.8 97.3
Strongly disagree 4 2.7 2.7 100.0
Total 147 100.0 100.0

Page 254
Table A2.34. A frequency distribution table showing results for q2.16
Frequency Percent
Valid
Percent
Cumulative
Percent
Valid Strongly agree 39 26.5 27.3 27.3
Agree 59 40.1 41.3 68.5
Not sure 21 14.3 14.7 83.2
Disagree 20 13.6 14.0 97.2
Strongly disagree 4 2.7 2.8 100.0
Total 143 97.3 100.0
Missing System 4 2.7
Total 147 100.0
Table A2.35. A frequency distribution table showing results for q2.17
Frequency Percent
Valid
Percent
Cumulative
Percent
Valid Strongly agree 8 5.4 5.4 5.4
Agree 75 51.0 51.0 56.5
Not sure 39 26.5 26.5 83.0
Disagree 19 12.9 12.9 95.9
Strongly disagree 6 4.1 4.1 100.0
Total 147 100.0 100.0

Page 255
Table A2.36: A table showing one-sample statistics for questions 2.14, 2.16 and 2.17
N Mean
Std.
Deviation
Std. Error
Mean
q2.14 Electricity load shading hampers the food
processing business in Zimbabwe.
147 1.68 .921 .076
q2.15 Electricity costs are a drawback to the food
processing business in Zimbabwe.
147 2.00 1.040 .086
q2.16 Government taxes are a drawback to the
food processing in Zimbabwe.
143 2.24 1.087 .091
q2.17 The government gives policy support to the
food processing sector in Zimbabwe
147 2.59 .927 .076
Table A2.37: A table showing one-sample test results for questions 2.14, 2.16 and 2.17
Test Value = 3
95% Confidence
Interval of the
Difference
t df
Sig. (2-
tailed)
Mean
Difference Lower Upper
q2.14 Electricity load shading
hampers the food processing business
in Zimbabwe.
-17.364 146 .000 -1.320 -1.47 -1.17
q2.15 Electricity costs are a drawback
to the food processing business in
Zimbabwe.
-11.655 146 .000 -1.000 -1.17 -.83
q2.16 Government taxes are a
drawback to the food processing in
Zimbabwe.
-8.382 142 .000 -.762 -.94 -.58
q2.17 The government gives policy
support to the food processing sector
in Zimbabwe
-5.337 146 .000 -.408 -.56 -.26

Page 256
GLOBAL FACTORS
Table A2.38. A frequency distribution table showing results for q2.18.
Frequency Percent
Valid
Percent
Cumulative
Percent
Valid Strongly agree 45 30.6 30.6 30.6
Agree 55 37.4 37.4 68.0
Not sure 25 17.0 17.0 85.0
Disagree 18 12.2 12.2 97.3
Strongly disagree 4 2.7 2.7 100.0
Total 147 100.0 100.0
Table A2.39. A frequency distribution table showing results for q2.19.
Frequency Percent
Valid
Percent
Cumulative
Percent
Valid Strongly agree 21 14.3 14.3 14.3
Agree 74 50.3 50.3 64.6
Not sure 22 15.0 15.0 79.6
Disagree 18 12.2 12.2 91.8
Strongly disagree 12 8.2 8.2 100.0
Total 147 100.0 100.0
Table A2.40. A frequency distribution table showing results for q2.20
Frequency Percent
Valid
Percent
Cumulative
Percent
Valid Strongly agree 27 18.4 18.4 18.4
Agree 60 40.8 40.8 59.2
Not sure 15 10.2 10.2 69.4
Disagree 24 16.3 16.3 85.7
Strongly disagree 21 14.3 14.3 100.0
Total 147 100.0 100.0
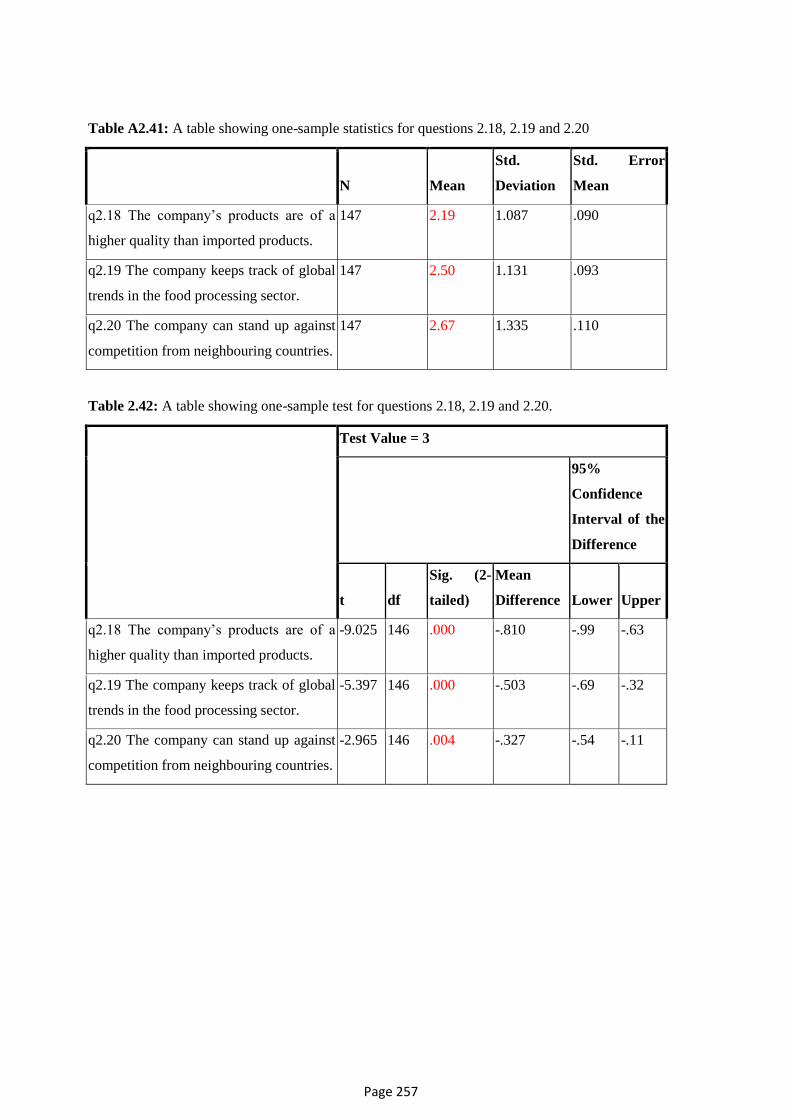
Page 257
Table A2.41: A table showing one-sample statistics for questions 2.18, 2.19 and 2.20
N Mean
Std.
Deviation
Std. Error
Mean
q2.18 The company’s products are of a
higher quality than imported products.
147 2.19 1.087 .090
q2.19 The company keeps track of global
trends in the food processing sector.
147 2.50 1.131 .093
q2.20 The company can stand up against
competition from neighbouring countries.
147 2.67 1.335 .110
Table 2.42: A table showing one-sample test for questions 2.18, 2.19 and 2.20.
Test Value = 3
95%
Confidence
Interval of the
Difference
t df
Sig. (2-
tailed)
Mean
Difference Lower Upper
q2.18 The company’s products are of a
higher quality than imported products.
-9.025 146 .000 -.810 -.99 -.63
q2.19 The company keeps track of global
trends in the food processing sector.
-5.397 146 .000 -.503 -.69 -.32
q2.20 The company can stand up against
competition from neighbouring countries.
-2.965 146 .004 -.327 -.54 -.11

Page 258
Critical success factors that influence technopreneurship in the food processing sector.
Table A2.43. A frequency distribution table showing results for q3.1
Frequency Percent
Valid
Percent
Cumulative
Percent
Valid Not really important 2 1.4 1.4 1.4
Neutral 2 1.4 1.4 2.8
Important 75 51.0 52.4 55.2
Extremely important 64 43.5 44.8 100.0
Total 143 97.3 100.0
Missing System 4 2.7
Total 147 100.0
Table A2.44. A frequency distribution table showing results for q3.2
Frequency Percent
Valid
Percent
Cumulative
Percent
Valid Not really important 2 1.4 1.4 1.4
Neutral 4 2.7 2.8 4.3
Important 57 38.8 40.4 44.7
Extremely important 78 53.1 55.3 100.0
Total 141 95.9 100.0
Missing System 6 4.1
Total 147 100.0

Page 259
Table A2.45. A frequency distribution table showing results for q3.3
Frequency Percent
Valid
Percent
Cumulative
Percent
Valid Not really important 4 2.7 2.9 2.9
Neutral 13 8.8 9.5 12.4
Important 59 40.1 43.1 55.5
Extremely important 61 41.5 44.5 100.0
Total 137 93.2 100.0
Missing System 10 6.8
Total 147 100.0
Table A2.46. A frequency distribution table showing results for q3.4
Frequency Percent
Valid
Percent
Cumulative
Percent
Valid Not really important 6 4.1 4.3 4.3
Neutral 20 13.6 14.2 18.4
Important 77 52.4 54.6 73.0
Extremely important 38 25.9 27.0 100.0
Total 141 95.9 100.0
Missing System 6 4.1
Total 147 100.0

Page 260
Table A2.47. A frequency distribution table showing results for q3.5
Frequency Percent
Valid
Percent
Cumulative
Percent
Valid Neutral 4 2.7 2.8 2.8
Important 64 43.5 45.4 48.2
Extremely important 73 49.7 51.8 100.0
Total 141 95.9 100.0
Missing System 6 4.1
Total 147 100.0
Table A2.48. A frequency distribution table showing results for q3.6
Frequency Percent
Valid
Percent
Cumulative
Percent
Valid Not really important 2 1.4 1.4 1.4
Neutral 6 4.1 4.3 5.7
Important 76 51.7 53.9 59.6
Extremely important 57 38.8 40.4 100.0
Total 141 95.9 100.0
Missing System 6 4.1
Total 147 100.0
Table A2.49. A frequency distribution table showing results for q3.7
Frequency Percent
Valid
Percent
Cumulative
Percent
Valid Neutral 2 1.4 1.4 1.4
Important 68 46.3 47.6 49.0
Extremely important 73 49.7 51.0 100.0
Total 143 97.3 100.0
Missing System 4 2.7
Total 147 100.0
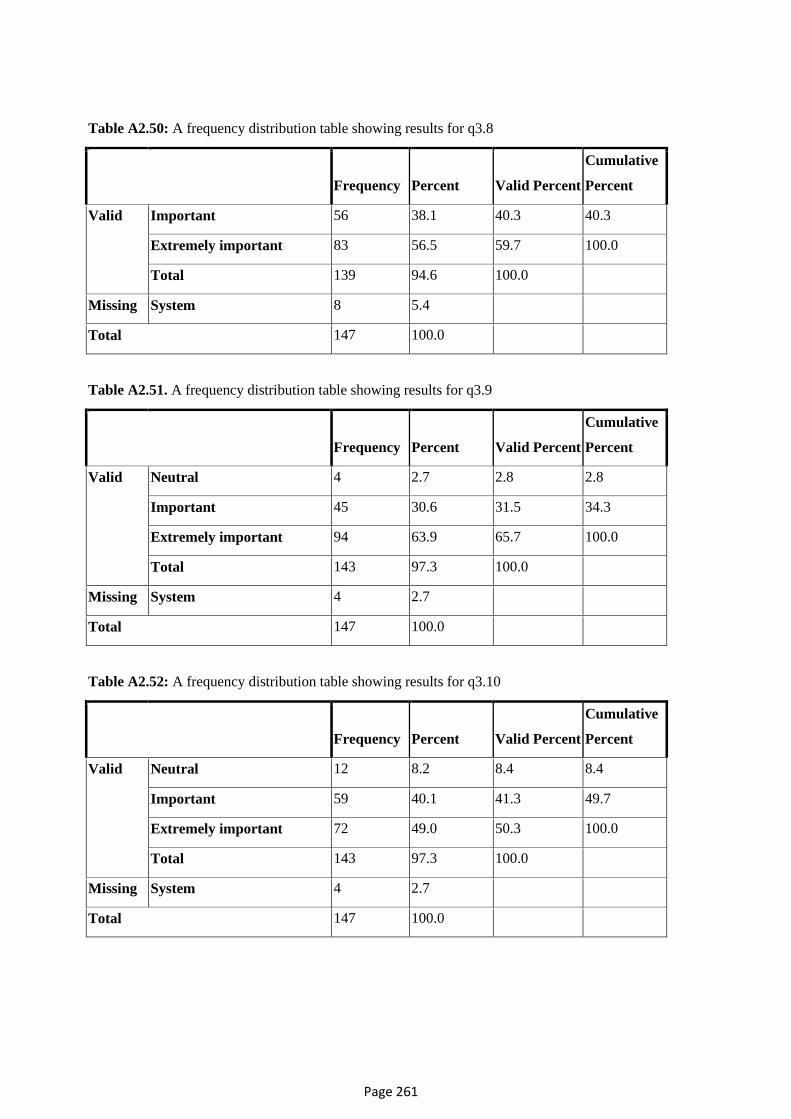
Page 261
Table A2.50: A frequency distribution table showing results for q3.8
Frequency Percent Valid Percent
Cumulative
Percent
Valid Important 56 38.1 40.3 40.3
Extremely important 83 56.5 59.7 100.0
Total 139 94.6 100.0
Missing System 8 5.4
Total 147 100.0
Table A2.51. A frequency distribution table showing results for q3.9
Frequency Percent Valid Percent
Cumulative
Percent
Valid Neutral 4 2.7 2.8 2.8
Important 45 30.6 31.5 34.3
Extremely important 94 63.9 65.7 100.0
Total 143 97.3 100.0
Missing System 4 2.7
Total 147 100.0
Table A2.52: A frequency distribution table showing results for q3.10
Frequency Percent Valid Percent
Cumulative
Percent
Valid Neutral 12 8.2 8.4 8.4
Important 59 40.1 41.3 49.7
Extremely important 72 49.0 50.3 100.0
Total 143 97.3 100.0
Missing System 4 2.7
Total 147 100.0

Page 262
Table A2.53: A frequency distribution table showing results for q3.11
Frequency Percent Valid Percent
Cumulative
Percent
Valid Neutral 8 5.4 5.7 5.7
Important 65 44.2 46.4 52.1
Extremely important 67 45.6 47.9 100.0
Total 140 95.2 100.0
Missing System 7 4.8
Total 147 100.0
Table A2.54: A frequency distribution table showing results for q3.12
Frequency Percent Valid Percent
Cumulative
Percent
Valid Neutral 2 1.4 1.4 1.4
Important 41 27.9 28.7 30.1
Extremely important 100 68.0 69.9 100.0
Total 143 97.3 100.0
Missing System 4 2.7
Total 147 100.0
Table A2.55: A frequency distribution table showing results for q3.13
Frequency Percent Valid Percent
Cumulative
Percent
Valid Not really important 4 2.7 2.8 2.8
Neutral 4 2.7 2.8 5.7
Important 34 23.1 24.1 29.8
Extremely important 99 67.3 70.2 100.0
Total 141 95.9 100.0
Missing System 6 4.1
Total 147 100.0

Page 263

Page 264
Table A2.56: A frequency distribution table showing results for q3.14
Frequency Percent Valid Percent
Cumulative
Percent
Valid Not really important 2 1.4 1.4 1.4
Neutral 10 6.8 7.0 8.4
Important 57 38.8 39.9 48.3
Extremely important 74 50.3 51.7 100.0
Total 143 97.3 100.0
Missing System 4 2.7
Total 147 100.0
Table A2.57: A frequency distribution table showing results for q3.15
Frequency Percent Valid Percent
Cumulative
Percent
Valid Neutral 14 9.5 9.8 9.8
Important 47 32.0 32.9 42.7
Extremely important 82 55.8 57.3 100.0
Total 143 97.3 100.0
Missing System 4 2.7
Total 147 100.0
Table A2.58: A frequency distribution table showing results for q3.16.
Frequency Percent Valid Percent
Cumulative
Percent
Valid Neutral 6 4.1 4.2 4.2
Important 38 25.9 26.6 30.8
Extremely important 99 67.3 69.2 100.0
Total 143 97.3 100.0
Missing System 4 2.7
Total 147 100.0

Page 265
Table A2.59: A frequency distribution table showing results for q3.17.
Frequency Percent Valid Percent
Cumulative
Percent
Valid Not really important 2 1.4 1.4 1.4
Neutral 4 2.7 2.8 4.2
Important 35 23.8 24.5 28.7
Extremely important 102 69.4 71.3 100.0
Total 143 97.3 100.0
Missing System 4 2.7
Total 147 100.0
Table A2.60: A frequency distribution table showing results for q3.18.
Frequency Percent Valid Percent
Cumulative
Percent
Valid Neutral 2 1.4 1.4 1.4
Important 44 29.9 30.8 32.2
Extremely important 97 66.0 67.8 100.0
Total 143 97.3 100.0
Missing System 4 2.7
Total 147 100.0

Page 266
Table A2.61: A frequency distribution table showing results for q3.19.
Frequency Percent Valid Percent
Cumulative
Percent
Valid Not at all important 2 1.4 1.4 1.4
Not really important 2 1.4 1.4 2.8
Neutral 18 12.2 12.6 15.4
Important 35 23.8 24.5 39.9
Extremely important 86 58.5 60.1 100.0
Total 143 97.3 100.0
Missing System 4 2.7
Total 147 100.0

Page 267
Table A2.62: A table showing one-sample statistics for questions 3.1 to 3.19.
N Mean
Std.
Deviation
Std. Error
Mean
q3.1 Internal processes 143 4.41 .596 .050
q3.2 Human Factor 141 4.50 .628 .053
q3.3 Venture Capital 137 4.29 .759 .065
q3.4 Partnerships 141 4.04 .764 .064
q3.5 Government Support 141 4.49 .556 .047
q3.6 Global factors 141 4.33 .629 .053
q3.7 Process Innovation 143 4.50 .529 .044
q3.8 Product Innovation 139 4.60 .492 .042
q3.9 Technological Innovation 143 4.63 .540 .045
q3.10 Business Innovation 143 4.42 .644 .054
q3.11 Daily/Monthly Production 140 4.42 .601 .051
q3.12 Quality of products 143 4.69 .495 .041
q3.13 Minimisation of costs 141 4.62 .683 .058
q3.14 Involvement of all workers 143 4.42 .686 .057
q3.15 Participation of all workers 143 4.48 .670 .056
q3.16 Team work 143 4.65 .560 .047
q3.17 Responsiveness to customer needs 143 4.66 .606 .051
q3.18 Skills development 143 4.66 .503 .042
q3.19 Dynamism to suit situations. 143 4.41 .866 .072

Page 268
Table A2.63: A table showing mean scores of critical success factors ordered from most important to
least important.
Critical success factor Mean
score
q3.12 Quality of products 4.69
q3.18 Skills development 4.66
q3.17 Responsiveness to customer needs 4.66
q3.16 Team work 4.65
q3.9 Technological Innovation 4.63
q3.13 Minimisation of costs 4.62
q3.8 Product Innovation 4.60
q3.7 Process Innovation 4.50
q3.2 Human Factor 4.50
q3.5 Government Support 4.49
q3.15 Participation of all workers 4.48
q3.11 Daily/Monthly Production 4.42
q3.10 Business Innovation 4.42
q3.14 Involvement of all workers 4.42
q3.1 Internal processes 4.41
q3.19 Dynamism to suit situations. 4.41
q3.6 Global factors 4.33
q3.3 Venture Capital 4.29
q3.4 Partnerships 4.04

Page 269
Table A2.64: A table showing one-sample test results for results of questions 3.1 to 3.19
Test Value = 3
95% Confidence
Interval of the
Difference
T df
Sig. (2-
tailed)
Mean
Difference Lower Upper
q3.1 Internal processes 28.192 142 .000 1.406 1.31 1.50
q3.2 Human Factor 28.286 140 .000 1.496 1.39 1.60
q3.3 Venture Capital 19.927 136 .000 1.292 1.16 1.42
q3.4 Partnerships 16.201 140 .000 1.043 .92 1.17
q3.5 Government Support 31.824 140 .000 1.489 1.40 1.58
q3.6 Global factors 25.184 140 .000 1.333 1.23 1.44
q3.7 Process Innovation 33.824 142 .000 1.497 1.41 1.58
q3.8 Product Innovation 38.252 138 .000 1.597 1.51 1.68
q3.9 Technological Innovation 36.104 142 .000 1.629 1.54 1.72
q3.10 Business Innovation 26.375 142 .000 1.420 1.31 1.53
q3.11 Daily/Monthly Production 28.004 139 .000 1.421 1.32 1.52
q3.12 Quality of products 40.687 142 .000 1.685 1.60 1.77
q3.13 Minimisation of costs 28.111 140 .000 1.617 1.50 1.73
q3.14 Involvement of all workers 24.746 142 .000 1.420 1.31 1.53
q3.15 Participation of all workers 26.352 142 .000 1.476 1.36 1.59
q3.16 Team work 35.247 142 .000 1.650 1.56 1.74
q3.17 Responsiveness to customer needs 32.685 142 .000 1.657 1.56 1.76
q3.18 Skills development 39.589 142 .000 1.664 1.58 1.75
q3.19 Dynamism to suit situations. 19.411 142 .000 1.406 1.26 1.55

Page 270
Feasibility of Technopreneurship in the food processing sector
Table A2.65: A frequency distribution table showing results for 4.1.
Frequency Percent Valid Percent
Cumulative
Percent
Valid Definitely yes 115 78.2 79.9 79.9
Yes, to some extent 24 16.3 16.7 96.5
Neutral 4 2.7 2.8 99.3
No not really 1 .7 .7 100.0
Total 144 98.0 100.0
Missing System 3 2.0
Total 147 100.0
Table A2.66: A frequency distribution table showing results for q4.2.
Frequency Percent Valid Percent
Cumulative
Percent
Valid Definitely yes 57 38.8 39.6 39.6
Yes, to some extent 48 32.7 33.3 72.9
Neutral 5 3.4 3.5 76.4
No not really 22 15.0 15.3 91.7
No, not at all 12 8.2 8.3 100.0
Total 144 98.0 100.0
Missing System 3 2.0
Total 147 100.0

Page 271
Table A2.67: A frequency distribution table showing results for q4.3
Frequency Percent Valid Percent
Cumulative
Percent
Valid Definitely yes 33 22.4 22.4 22.4
Yes, to some extent 61 41.5 41.5 63.9
Neutral 9 6.1 6.1 70.1
No not really 38 25.9 25.9 95.9
No, not at all 6 4.1 4.1 100.0
Total 147 100.0 100.0
Table A2.68: A frequency distribution table showing results for q4.4.
Frequency Percent Valid Percent
Cumulative
Percent
Valid Definitely yes 54 36.7 36.7 36.7
Yes, to some extent 25 17.0 17.0 53.7
Neutral 13 8.8 8.8 62.6
No not really 39 26.5 26.5 89.1
No, not at all 16 10.9 10.9 100.0
Total 147 100.0 100.0
Table A2.69: A frequency distribution table showing results for q4.5
Frequency Percent Valid Percent
Cumulative
Percent
Valid Definitely yes 32 21.8 21.8 21.8
Yes, to some extent 51 34.7 34.7 56.5
Neutral 38 25.9 25.9 82.3
No not really 20 13.6 13.6 95.9
No, not at all 6 4.1 4.1 100.0
Total 147 100.0 100.0

Page 272
Table A2.70: A frequency distribution table showing results for q4.6
Frequency Percent Valid Percent
Cumulative
Percent
Valid Definitely yes 68 46.3 46.9 46.9
Yes, to some extent 54 36.7 37.2 84.1
Neutral 1 .7 .7 84.8
No not really 10 6.8 6.9 91.7
No, not at all 12 8.2 8.3 100.0
Total 145 98.6 100.0
Missing System 2 1.4
Total 147 100.0
Table A2.71: A table showing one-sample statistics for questions 4.1, 4.2, 4.3, 4.4, 4.5 and 4.6.
N Mean
Std.
Deviation
Std. Error
Mean
q4.1 Is there enough demand for processed food products
in Zimbabwe?
144 1.24 .532 .044
q4.2 Does the company have the capacity to satisfy the
demand?
144 2.19 1.329 .111
q4.3 Does the company possess enough technology for
food processing?
147 2.48 1.213 .100
q4.4 Does the company have the capacity to acquire new
processing technology?
147 2.58 1.475 .122
q4.5 Does the company possess enough entrepreneurial
skills?
147 2.44 1.098 .091
q4.6 Can the company compete with existing food
products on the market?
145 1.92 1.225 .102
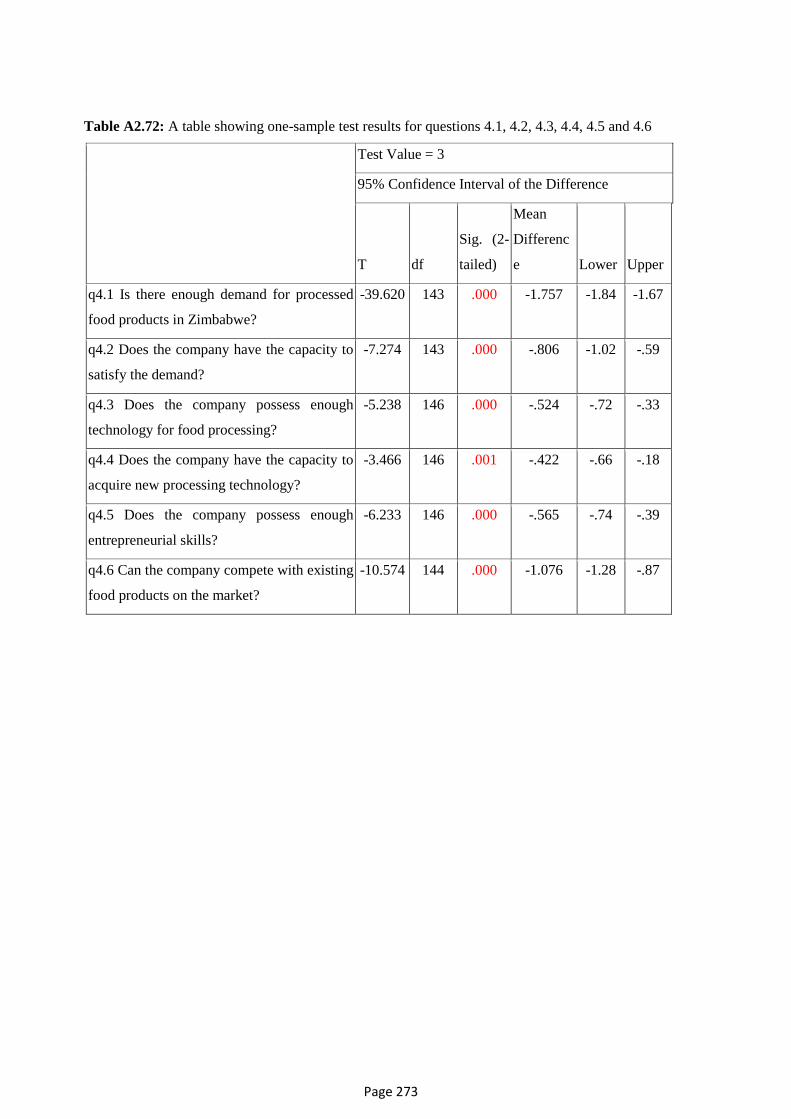
Page 273
Table A2.72: A table showing one-sample test results for questions 4.1, 4.2, 4.3, 4.4, 4.5 and 4.6
Test Value = 3
95% Confidence Interval of the Difference
T df
Sig. (2-
tailed)
Mean
Differenc
e Lower Upper
q4.1 Is there enough demand for processed
food products in Zimbabwe?
-39.620 143 .000 -1.757 -1.84 -1.67
q4.2 Does the company have the capacity to
satisfy the demand?
-7.274 143 .000 -.806 -1.02 -.59
q4.3 Does the company possess enough
technology for food processing?
-5.238 146 .000 -.524 -.72 -.33
q4.4 Does the company have the capacity to
acquire new processing technology?
-3.466 146 .001 -.422 -.66 -.18
q4.5 Does the company possess enough
entrepreneurial skills?
-6.233 146 .000 -.565 -.74 -.39
q4.6 Can the company compete with existing
food products on the market?
-10.574 144 .000 -1.076 -1.28 -.87

Page 274
ETHICAL CLEARANCE LETTER