factors influencing adoption of conservation agriculture
TRANSCRIPT

University of Arkansas, FayettevilleScholarWorks@UARK
Theses and Dissertations
8-2018
Factors Influencing Adoption of ConservationAgriculture in the Democratic Republic of theCongoWilly Mulimbi ByamunguUniversity of Arkansas, Fayetteville
Follow this and additional works at: http://scholarworks.uark.edu/etd
Part of the Agricultural Economics Commons
This Thesis is brought to you for free and open access by ScholarWorks@UARK. It has been accepted for inclusion in Theses and Dissertations by anauthorized administrator of ScholarWorks@UARK. For more information, please contact [email protected], [email protected].
Recommended CitationMulimbi Byamungu, Willy, "Factors Influencing Adoption of Conservation Agriculture in the Democratic Republic of the Congo"(2018). Theses and Dissertations. 2882.http://scholarworks.uark.edu/etd/2882

Factors Influencing Adoption of Conservation Agriculture in the
Democratic Republic of the Congo
A thesis submitted in partial fulfillment
of the requirements for the degree of
Master of Science in Agricultural Economics
by
Willy Mulimbi Byamungu
Université Catholique de Bukavu
Bachelor of Science in Agricultural Sciences, 2001
Université Catholique de Bukavu
Engineer Agronomist, General Agriculture, Crop Production, 2004
August 2018
University of Arkansas
This thesis is approved for recommendation to the Graduate Council.
_____________________________________
Lawton Lanier Nalley, Ph.D.
Thesis Director
_____________________________________ _____________________________________
Bruce L. Dixon, Ph.D.
Committee Member
Qiuqiong Huang, Ph.D.
Committee Member
_____________________________________
Heather A. Snell, Ph.D.
Committee Member

Abstract
The agricultural sector in the Democratic Republic of the Congo (DRC) is still struggling
to cope with its post-independence political and structural instability. From 1961 to 2000, the DRC
experienced a decrease of 34% and 37% in daily caloric intake and protein intake, respectively.
The DRC’s agriculture sector, led by women (who are the core of subsistence farming), is now
being targeted as a potential pathway out of poverty through sustainable development programs.
Empowering farmers to increase productivity by educating them to use conservation agriculture
(CA), a more sustainable alternative to the traditional slash-and-burn agricultural practice, could
contribute to reducing vulnerability, alleviate food insecurity, and fight poverty while being
ecologically sustainable. This study assesses the impact of the “Improving Agricultural
Productivity through No-Tillage Agriculture” program in the DRC from 2009 to 2012. This
program targeted vulnerable women who were victims in some capacity of the Congolese War.
Training on the sustainable CA practice was provided to 8,290 farmers in the Maniema province
of the DRC. The program goal was to increase agricultural productivity and sustainability through
CA adoption by improving crop yields and soil management and decreasing deforestation caused
by slash-and-burn.
Findings suggest that the location of the farm (being in the savannah or forest), training,
having accessed to credit, belonging to a farmers’ group, and being a vulnerable female, all drove
adoption to varying degrees and directions. Vulnerable women, the target for this project, were
found to be less likely to adopt CA. From this study’s findings, targeting vulnerable women who
are part of a farmers’ group may increase the number of vulnerable women who would adopt CA
in the future. The results of this study provide future CA projects with important information on
what the drivers of adoption are and what the perceived benefits of adoption by adopters. From

these two important pieces of information, future research and CA projects in the DRC can more
precisely focus on specific groups of producers based on location, gender, and other social
characteristics to both increase adoption of CA and market the specific benefits producers are
looking for more efficiently.

Acknowledgements
It would not have been possible to complete this work without the help and support of
many people I met in my professional and academic career. This thesis is the result of efforts and
contributions received from friends, and all those amazing farmers, colleagues, and educators.
Above all, I would like to thank my family for their everyday unconditional support and
prayers since I decided to come back to college. I owe a lot of gratitude to my wife, my children,
my brothers, my sister, and my parents to whom I also dedicate this work.
I would like to acknowledge the US Fulbright scholarship program for funding my Master
of Science degree, an incredible learning step in my academic career, and for opening me the door
to higher education in the United States.
I am deeply grateful to my advisor, Dr. Lawton Lanier Nalley, for his guidance and
encouragements and my thesis committee members, Dr. Bruce Dixon, Dr. Qiuqiong Huang and
Dr. Heather Snell, for their invaluable inputs. I am also extending my thankfulness to the
Agricultural Economics and Agribusiness Department at the University of Arkansas for hosting
me. To all the educators I met in class, in seminar, in the hallway or during social events, and the
faculty who eased my adjustment and supported, I say, sincerely, thank you.
It is also a pleasure to thank Catholic Relief Services – DRC program for their collaboration
and the approval to use their dataset, Caritas Developpement Kindu and Caritas Developpement
Kasongo for the wonderful support to farmers, and M. Saidi Mkomwa, the Executive Director of
African Conservation Tillage Network for his supportive thoughts. Finally, my greatest
appreciation goes to all the farmers of Kailo, Kasongo, and Kabambare territories in the DRC for
making all this possible because they chose conservation agriculture.

Table of Contents
Introduction ................................................................................................................................1
Research objectives ............................................................................................................... 10
Literature review ....................................................................................................................... 13
Factors driving CA adoption .................................................................................................. 13
Benefits of CA ....................................................................................................................... 14
CA in the DRC ...................................................................................................................... 15
Research site and data ............................................................................................................... 16
Maniema province ................................................................................................................. 16
Research data ........................................................................................................................ 17
Data processing ..................................................................................................................... 20
Model specifications ................................................................................................................. 20
Modeling CA adoption .......................................................................................................... 20
(i) Explanatory variables ................................................................................................. 20
(ii) Logit models ............................................................................................................... 25
Modeling the perceived benefits of CA .................................................................................. 29
(i) Explanatory variables ................................................................................................. 29
(ii) Dependent variables.................................................................................................... 30
(iii) Ordered logit models .................................................................................................. 31
Results & discussion ................................................................................................................. 35
CA adoption .......................................................................................................................... 35
(i) Model results description ............................................................................................ 35
(ii) Interpreting the impact of factors influencing CA adoption ......................................... 38
Benefits perceived from CA adoption .................................................................................... 49
Conclusion ................................................................................................................................ 58
References ................................................................................................................................ 63
Appendix .................................................................................................................................. 69
Table A1. Logit models results for factors influencing CA adoption. ..................................... 69
Table A2. List of variables selected from CRS dataset for stepwise analysis. ......................... 70
Table A3. Ordered logit models results for reliability of income from CA. ............................ 71
Table A4. Ordered logit models results for land under CA. .................................................... 71
Table A5. Ordered logit models results for food security status. ............................................. 71

List of Tables
Table 1. Number of farmers interviewed per village in 2015 by the Catholic Relief Services..... 17
Table 2. Farmers’ characteristics based on CA adoption, training, and agroecological zones ..... 19
Table 3. Explanatory variables, description, and expected outcome. .......................................... 24
Table 4. Explained variables, description, and hypothesized outcome........................................ 31
Table 5. Marginal effects of factors influencing CA adoption .................................................... 39
Table 6. Marginal effects on reliability of income from CA ....................................................... 51
Table 7. Marginal effects on land under CA .............................................................................. 54
Table 8. Marginal effects on food security status ....................................................................... 56
List of Figures
Figure 1. Map of Maniema province.......................................................................................... 16

1
Introduction
The agricultural sector in the Democratic Republic of the Congo (DRC) is still struggling
to cope with post-independence political and structural instability. Agricultural output fell between
1970 and 1980 due to zaïrianisation, a policy implemented by president Mobutu’s government
which nationalized all private companies, including those in the agricultural sector, in the DRC.
Tollens (2003) found that between 1961 and 2000, the DRC experienced increasing malnutrition.
Agricultural output and food security continued to decline with an economic crisis in the 1990s
when the DRC faced what Akitoby and Cinyabuguma (2004) call “the grip of an unprecedented
circle of hyperinflation, currency depreciation, increasing dollarization and financial
disintermediation, declining savings, deteriorating economic infrastructure, and broad-based
output decline” (p.7). The economic collapse was only compounded during the war between 1996
and 2006 (Tollens, 2004; Smoes, 2012). DRC citizens and the agricultural community are still
struggling to rebuild after an almost 20-year conflict that brought violence, insecurity,
displacement, political upheaval (the Famine Early Warning Systems Network [FEWSNET1],
2015), and increased poverty and food insecurity. During the DRC civil conflicts from 1996 to
2006, agricultural tools and inputs were both expensive and difficult to obtain. As such, instead of
investing in making existing agricultural land more fertile, agricultural communities practiced
“slash-and-burn” agricultural practices, whereby destroying forests to harvest the nutrients of
virgin soils. Women, the backbone of the agriculture sector in the DRC, were the largest victims
of the civil unrest through increased work responsibilities, domestic violence, rape, and being
widowed and left with the responsibility of caring for entire families. Currently, there is a
1 FEWSNET is a leading provider of early warning and analysis on acute food insecurity. Created in 1985 by the US
Agency for International Development (USAID) after devastating famines in East and West Africa, FEWS NET
provides objective, evidence-based analysis to help government decision-makers and relief agencies plan for and
respond to humanitarian crises. Find more at http://fews.net/.

2
conscious movement by the Government of the DRC (GoDRC) to empower women in the
agricultural sector throughout the DRC. Empowering women farmers to increase productivity by
educating them to use conservation agriculture (CA), a more sustainable alternative to slash-and-
burn, could contribute to reducing vulnerability, alleviate food insecurity, and fight poverty while
being ecologically sustainable. Educating women in CA could help reduce some burdens that years
of civil unrest have caused for women in the agricultural communities of the DRC. First, it would
allow for the reduction of labor, in that women would not have the arduous task of plowing or
clearing the field (slash-and-burn) to plant new crops. Second, by staying closer to their
communities, CA would reduce the chance a woman would encounter domestic violence or
potentially be raped. Lastly, by reducing slash-and-burn agriculture and introducing CA,
agricultural yields and subsequent profits could increase. Rebuilding the agricultural sector in the
DRC will be complicated and time consuming but must be holistic in nature to ensure a sustainable
(environmental, social, and economic) future. Programs that educate women in CA practices in
the DRC have the ability to make positive social, ecological, and economic changes.
In 2013, the World Bank stated that the DRC had the potential to have rapid and sustained
economic growth, reduce poverty, and improve its human development indicators (World Bank,
2013). However, today, the country is still low on the human development index, ranking 176th
out of 188 countries (United Nations Development Program [UNDP], 2016) and, despite its
abundance of natural resources, is consistently ranked among the poorest countries in the world.
In 2016, the Central Bank of the DRC (officially known as “Banque Centrale de la république
démocratique du Congo” [BCC]), reported that within the primary sector (agricultural, minerals,
and natural resource production and extraction), which accounted for 37% of the country’s GDP,
agriculture contributed 18.5%, while the mining sector accounted for 17.8% (BCC, 2017). The

3
agricultural industry in the DRC is often classified into two sectors: a ‘traditional’ and a ‘modern’
sector (Smoes, 2012). The traditional agriculture sector consists mainly of subsistence and
smallholders’ farmers, relies mostly on rain-fed agriculture, and provides 80% of the DRC food
supply despite its relatively low yields. The modern sector, which uses industrial practices, is
typically for the high-value export crops of sugarcane, coffee, cocoa, palm oil, cinchona, and
rubber (Smoes, 2012). Smoes’s description of the DRC agricultural sectors is supported by
FEWSNET (2015), which describes the agricultural sector in the DRC to be mostly informal and
“driven by small-scale activities.” The DRC’s 2013–2014 demographic health survey (DHS)
indicated that agriculture is the principal employment activity in the country, specifically in rural
areas where it employs 70% of the population (Ministry of Planning [MINPLAN], Ministry of
Health [MSP] & ICF International, 2014).
Agriculture in the DRC consists of many players, including large- and small-scale
producers, cash and staple crop production, and foreign direct investment. Of all the participants
in the agricultural community, the DRC Ministry of Agriculture (MINAGR) (2010) considers
women as the most important contributors due to their primary roles in agricultural production and
commitment to food security at both the household and community levels. In 2014, the DHS
reported that agriculture is the primary occupation for 58% of all women in the DRC, with this
percentage increasing to 66% for women between 45 and 49 years old who have more than five
children. In the rural areas, the same report found that 77% of women are involved in agriculture.
The majority of DRC women are self-employed, and they earn 63% of their in-kind and cash
revenue from agriculture compared to 17% for non-farming activities (MINPLAN et al., 2014).
The MINAGR (2010) recognized that women are also among the first victims of the country’s
long past of political and social instability. In 2012, Herderschee, Kaiser, and Mukoko reported

4
that women in the DRC were “disadvantaged relative to men,” a situation that was only intensified
by civil conflicts, despite some recent progress to reduce that inequality. A 2014 report by the
United States Agency for International Development (USAID) found that women face many types
of discrimination, exploitation, and exclusion in their communities throughout the DRC (USAID,
2014). Such inequalities, combined with weak healthcare and education systems and inadequate
economic rights, lead the DRC to earn a gender inequality index score of 0.663, which ranks the
country 153rd out of 157 countries (UNDP 2016 Human Development Report). According to the
DHS, the proportion of uneducated women is approximately twice as high as men (MINPLAN et
al., 2014). Rural women in the DRC are exposed to higher levels of poverty and food insecurity
and are more likely to fall victim to the DRC’s ongoing civil strife.
The poverty level in the DRC has been exacerbated by the ten years of civil discord. From
1996 to 2006, the country faced what Reyntjens (2009) calls “the Great African War,” which
directly/indirectly involved 13 African nations, the DRC national army, and multiple national and
foreign militias and rebel groups. This war initially aimed to overthrow president Mobutu, who
had ruled for 32 years. The country’s development efforts have been stifled by conflicts, which
became sporadic after 2006 and resulted in the continuing political instability which still
undermines most development projects today. USAID determined that more than 17 years of
conflict in the eastern DRC, an area including the provinces of Maniema, South and North Kivu,
and the former provinces of Katanga and Orientale, has led to the depletion of much of the area’s
resources and misled the country’s development plan (USAID, 2014). Otchia (2014), asserted that
the agriculture sector in DRC suffers from a lack of “development strategies,” combined with the
consequences of conflict that has led to widespread food insecurity in many parts of the country.
Otchia (2014) considers that the GoDRC has “abandoned” the agriculture sector. Throughout all
5
the civil conflicts and political instability since 1996, there has been one constant in the DRC: food
insecurity. Tollens (2003) claimed that, in the DRC, food insecurity is the consequence of poverty
brought on by civil conflict. From 1961 to 2000, the DRC experienced a decrease of 34% in daily
caloric intake and 37% in daily protein intake (Tollens, 2003). These large decreases in caloric and
protein intakes are a combination of civil and political unrest as well as a lack of investment in
agricultural productivity enhancements. Compounding matters, since the early 2000s, the DRC
has one of the world’s highest internal displacement due to the aforementioned civil conflicts
(Akakpo, Randriamamonjy, & Ulimwengu, 2014; NRC & IDMC, 2017). Due to the large number
of people displaced in one of many agroecological zones not similar to their homes, agricultural
productivity has diminished to the point of food insecurity in many parts of the DRC. The African
Development Bank (AfDB) (2013) stated that the armed violence which led to widespread internal
displacement was one of the primary drivers of increased food insecurity throughout the DRC. As
of February 2018, it was estimated there are approximately 4.6 million people experiencing food
insecurity, 2 million children who are acutely malnourished, and 4.5 million people were internally
displaced in the DRC (United Nations Office for the Coordination of Humanitarian Affairs
[OCHA], 2018), which is nearly 6% of total DRC population. The largest sector of the agricultural
workforce in the DRC, women, are also some of the most vulnerable members, due to large
communal displacements and sexual violence in and around conflict zones, host communities, and
refugee camps (MINPLAN & International Monetary Fund [IMF], 2013; USAID, 2014). To help
women who have been affected by displacement and/or the ongoing civil strife, the GoDRC and
donors have included women empowerment among their key program strategies, integrated gender
sensitivity as a cross-cutting theme, and required their implementing partners, recipients, and/or

6
contractors on the ground to comply with those aspects (USAID, 2014; MINAGR, 2013; AfDB,
2013; World Bank, 2013).
In the DRC, like in most low-income countries, agriculture is one of the primary sources
of employment and revenue. Improving agriculture, the backbone of the most African economies,
can be the catalyst for poverty reduction and can improve livelihoods across the entire continent
(Gates, 2015). For the DRC specifically, improving agricultural productivity and incomes also has
the potential of reducing the vulnerability of the poorest of the poor. Vulnerable youth in the DRC
have historically been predisposed to join armed groups or to leave villages for illegal mining
opportunities which mutually fuel civil conflicts keeping the country in the poverty cycle.
Herderschee et al. (2012) state that improving agricultural productivity is one of the best ways to
combat the DRC’s extreme poverty. The World Bank stated in 2013 that the DRC has not yet
intensively used its agriculture potential to enhance its citizens’ livelihoods and increase food
security. The World Bank views the “over 80 million ha of fertile and arable land” (p.8) as an
opportunity for large production of commodities such as maize, palm oil, soybean, and sugarcane
but the area planted to these crops is small and not irrigated, despite water resources, (World Bank,
2013) due to a lack of knowledge and infrastructure. In the DRC, the agricultural sector, compared
to other sectors including mining, has the potential to employ the largest numbers of new workers
and, generate income and value added, while improving vulnerable people’s lives (Tollens, 2004).
Agricultural productivity decreased by 60% in the DRC from 1960 to 2006 because of
political instability and farmers abandoning production due to civil strife (MINPLAN, 2013). The
post-independence crisis between 1960 and 1965 was indicative of periods of conflicts between
the president, the prime minister and the parliament, rebellions supported by mining companies,
the assassination of Patrice Lumumba, and the subsequent coup that brought Mobutu to power.
7
Since 1960, agricultural productivity has become stagnant, which has affected most of households’
subsistence system throughout the country (MINPLAN & IMF, 2013). A 2013 World Bank study
found that the weakening of the agriculture extension system throughout the DRC impeded the
dissemination of the best management practices, leading to reduced agricultural productivity, low
income, and increased food insecurity (World Bank, 2013). Smoes (2012) compiled the reasons
for what he views as the major weaknesses of the agriculture sector of the DRC. The list includes
the absence of finance/credit, underinvestment in agricultural research and development, obsolete
agriculture practices and materials, bad infrastructure, an absence of well-structured farmers’
entities, a weak and corrupted fiscal system, low investment, land issues, bad governance, and lack
of high quality data. From Smoes’ list, the lack of proper and adapted agriculture practices,
materials, and infrastructures coupled with the absence of an effective extension service has led to
low agricultural productivity. Slash-and-burn agriculture, a common farming practice in the DRC
which consists of slashing the vegetation and burning their residues to create new fertile farmland,
is still widely implemented in the DRC today. Slash-and-burn has detrimental effects on land,
accentuates deforestation (United Nations Environment Program [UNEP], 2011), and also
contributes to the degradation of aquatic ecosystems and biodiversity (National Institute of
Agricultural Extension Management [MANAGE], 2016). A 2009 Catholic Relief Services (CRS)
study found that in the province of Maniema, slash-and-burn agriculture makes women more
vulnerable, as it continuously forces them to walk further from their village to the farm which
increases their workloads and inherently exposes them to an increased possibility of rape.
Given the high incidences of food insecurity and the fact that increased agricultural
productivity has the potential to reduce poverty, the GoDRC has begun to focus on investing in
the agricultural sector. During the design of the “DRC’s National Agriculture Investment Plan

8
under the Comprehensive Africa Agriculture Development Programme (CAADP),” officially
known under the French acronym “PNIA”, in 2013, the GoDRC chose to focus on the
enhancement of agricultural productivity in a sustainable manner, taking into consideration the
environmental stress from slash-and-burn agriculture and the pivotal role in which women play in
productive agriculture (MINAGR, 2013). The GoDRC should invest in the implementation of CA
in an effort to enhance environmental sustainability and increase producer welfare, both from an
economic and social perspective. “CA is defined as a management system based on three
interlinked principles which are applied in a mutually reinforcing manner: (i) continuous no or
minimum physical soil mechanic disturbance, (ii) maintenance of permanent soil mulch cover, and
(iii) crop diversification in space and time” (Kassam, Mkomwa, & Friedrich, 2017).
As an innovative farming practice, CA was introduced in the DRC and piloted in 2009
in the Maniema province by CRS and its partners through a two-million-dollar Howard G. Buffet
Foundation (HGBF) funded program named “Kulima Pasipo Kutipula Udongo: Improving
Agricultural Productivity through No-Tillage Agriculture in Maniema Province,” also known as
the “NTA project.” CA was promoted by the NTA project as a potential solution to the issue of
slash-and-burn agriculture and its negative externalities on women farmers and the ecosystem
throughout central and eastern DRC. One of the founding principles of CA in the DRC is to
eliminate slash-and-burn agriculture, which has many positive externalities, but in the case of
DRC, two externalities are the primary drivers of adoption. First, the reduction of slash-and-burn
can reduce the agricultural work burden on women, as they do not have to continuously travel
further distances to cultivate fertile land. Second, by reducing the distance women have to travel
to farm it also reduces their chances of being put in vulnerable situations which are a byproduct of
the ongoing conflicts in central and eastern DRC. In a holistic sense, CA is recognized as a viable

9
concept for sustainable agriculture due to its potential comprehensive benefits in economic,
environmental, and social aspects of sustainability (Derpsch, 2007).
In 2018 the United Nations Food and Agriculture Organization (FAO) stated that CA has
the potential to improve production efficiency, expand agronomic soil productivity, and increase
the environmental and social benefits that could protect soil with the possibility to make agriculture
more sustainable. The economic benefits of CA are valued in terms of farmers’ time and labor
saved as compared to traditional slash-and-burn practices common in the DRC (CRS, 2012, 2015).
CRS (2015) found that farmers who adopted CA in Maniema spent 100%–200% less time weeding
their plots relative to those who did not implement CA. The reduction of weeding is a direct result
of fewer weeds attributed to a thick layer of mulch covering the ground (a practice encouraged in
CA in the DRC). Another economic benefit is the potential of enhanced yields (Lalani, Dorward,
Kassam, & Dambiro, 2017; CA Group at Cornell University, 2015). According to the FAO (2015),
the agronomic benefits of CA are mainly soil structure improvement and an increase in organic
matter, which ultimately results in more fertile land. As a result, water and nutrients are used more
efficiently and can potentially preserve the soil while also increasing farm production (FAO,
2015). Increased fertility with organic matter can both increase revenue (through higher yields)
and decrease costs (reducing the need for inorganic fertilizer). The environmental benefits, mostly
resulting from mulching and the reduction of deforestation attributed to slash-and-burn, are soil
protection against erosion and carbon sequestration, which makes CA perceived as a climate-smart
agriculture practice (Mkomwa, Kassam, Friedrich, & Shula, 2017). Covering the soil with mulch
contributes to water infiltration and increases organic matter (FAO, 2015; CA Group at Cornell
University, 2015). Together, these benefits can provide CA adopters the opportunity to improve
economic, social, and environmental sustainability at the farm level. In a country like the DRC,

10
where most of the population is involved in agriculture (and the majority of agricultural actors are
women), it would seem logical to analyze any practice that has the potential to reduce strenuous
work such as tillage and multiple weeding while preserving farm soils, reducing deforestation, and
reducing yield variability for staple crops such as cassava, rice, and maize. Furthermore, CA has
the real possibility of improving the livelihoods of women by allowing them to cultivate land closer
to their villages, thereby reducing the threat of domestic violence when traveling long distances.
Research objectives
This study uses primary data collected in 2015 by Catholic Relief Services (CRS) for the
ex-post evaluation study of the NTA project. The project was implemented from 2009 to 2012 and
aimed to improve small-scale farmers’ food security and natural resource base through CA
training. The training sessions were led by NTA project extension agents using Kiswahili visual
handouts and were implemented on demonstration sites located on community farms for groups
of less than 30 farmers (CRS, 2009). On the demonstration sites, CRS (2012, 2015) exposed
farmers to two plots: one with CA and the other with conventional local agricultural practices.
Cassava, rice, maize, peanuts, and cowpeas (the primary crops of the area) were found on all the
demonstration plots (CRS, 2012). As a group, farmers at each location learned, shared, and
discussed with peers and extension agents; welcomed other farmers of their community, during
field days, to visit and learn their experience; and were asked to apply the lessons on individual
and group plots (CRS, 2012, 2015). The NTA project specifically targeted single women displaced
or widowed by the Congolese war in Kabambare, Kailo, and Kasongo territories of the Maniema
province. Vulnerable women were targeted to both reduce their workload and reduce the
probability of domestic violence from having to travel far from their villages to farm. Training on
sustainable conservation agricultural (CA) practices was provided to 8,290 farmers in the Maniema

11
province of the DRC. The CRS’ ex-post evaluation study did a random stratified sampling
selection of 225 willing and voluntary households from seven and four villages, respectively, from
Kailo and Kasongo territories, in the area of implementation of the NTA project (CRS, 2015).
Not all farmers adopted CA after training because they perceived mulching and sowing in
the mulch to be too challenging, especially in the heavily forested part of Maniema (CRS, 2012,
2015). The NTA project management team took a year, starting in September 2009, combining
training with awareness campaigns while they interacted with local farmers asking them to test the
full CA package within their communities (CRS, 2012, 2015). From learning by seeing, the CA
training turned to learning by doing, and three years after NTA project closure in 2012, CRS
reported 71% CA adoption in Kailo and Kasongo. The present study chose to focus on those
aspects that were close to the goal of the NTA project that targeted women farmers’ vulnerability
in a post-conflict context. However, the results are still applicable to many rural contexts in the
DRC and in Sub-Saharan Africa where CA is being promoted.
The objective of this study was first to estimate the factors that drove adoption of CA in
the DRC via the NTA project. This study set out to explore how female adoption compared to
male adoption rates, given the project was targeted at vulnerable female farmers. Further, this
research wanted to determine what/if any benefits farmers derived through the adoption of the CA
practices. Because human capital can be transferred, the research also aimed to estimate the
perceived benefits to producers who may have adopted CA but did not receive formal training
from CRS and to compare those to the perceived benefits of farmers who actually received formal
training, that is, to capture if there were any spillover effects of the formal training.
The study is the first one of its kind for the DRC because CRS has been the pioneer of CA
in the country. Its relevance for agricultural research and development goes from policy design to

12
implementation, takes into consideration the important role of gender within DRC agriculture, and
fits in the current themes of sustainability and climate change. In a poor, post-conflict country
continuing to struggle with food insecurity and malnutrition such as the DRC, this study provides
important information to policy makers, NGOs and conservationists about why people adopt CA
and what the perceived benefits are for those who do.

13
Literature review
Factors driving CA adoption
Knowler and Bradshaw (2007) grouped the factors driving CA adoption into four
categories: “Farmer and farm household characteristics, farm biophysical characteristics, farm
financial/management characteristics, and exogenous factors” (p.33). Malawi, South Africa,
Swaziland, Tanzania, and Zimbabwe are the selected countries where CA is already adopted as
confirmed by FAO (2018) and where this review focused on studies which were less than five
years old that explored CA adoption in smallholders’ farmer communities. In these five countries,
CA was introduced and promoted between 1998 and 2008 by national governments, research
centers, and non-government organizations to enhance smallholders’ farmers’ crop productivity in
response to drought and soil erosion (Kassam, Friedrich, Shaxson, & Pretty, 2009; Mamkwe, 2013;
Mavunganidze, Madakadze, Mutenje, & Nyamangara, 2013; Chisenga, 2015; Mlenga & Maseko,
2015; Ntshangase, Muroyiwa, & Sibanda, 2018).
Mamkwe (2013) showed that in Tanzania gender, income, and land ownership were the
primary drivers of CA adoption. Male farmers were more likely to adopt CA than female, farmers
with high income were more likely to adopt CA than farmers with low income, and farmers who
own land were more likely to adopt CA than those renting land or using community land
(Mamkwe, 2013). In Malawi, Swaziland, South Africa and Zimbabwe, age, education, and
extension positively influenced CA adoption; specific drivers were gender and wealth for
Swaziland, a positive view of CA for South Africa, and labor, use of animal traction, and farm size
for Zimbabwe (Mavunganidze et al., 2013; Chisenga, 2015; Mlenga & Maseko, 2015; Ntshangase
et al., 2018). In addition, in Malawi, Chisenga (2015) showed that CA adoption, especially for
women farmers, is driven by the availability of farm labor, access to CA training, farm size, access
to farm inputs, and farmers’ group membership, while adoption is impeded by wrong CA

14
understanding, lack of extension support and financial rights, and farm smallness. The
dissimilitude in CA adoption drivers between Malawi, South Africa, Swaziland, Tanzania, and
Zimbabwe supports the Knowler and Bradshaw’s (2007) conclusion to customize the study of CA
adoption drivers to the location due to condition disparities, a view shared by Thierfelder,
Bunderson, and Mupangwa (2015) and stated by Corbeels et al. (2014) as “the need to tailor CA
interventions to the end users” (p.166). Total CA adoption is a process which unfolds in steps as
farmers typically adopt aspects of new innovations before adopting the entire package (Prager and
Lionberger, cited by Posthumus et al., 2011). Liu and Huang (2013) found that there are specific
factors related to the farm, the farmer, the technology, and institutions that play a role in the
adoption of soil conservation practices.
Benefits of CA
Even though Giller, Witter, Corbeels, and Tittonell (2009) stated studies’ findings about
the benefits of CA for smallholders’ farmers in Africa are conflicting, and Brouder and Gomez-
Mcpherson (2014) advised not to rush to concluding about better yields from CA, the majority of
results from reviewing the literature for this study shows that benefits are location- and
agroecological-based, and they seem to outnumber disadvantages. Unanimity seems to appear in
studies conducted to date saying that benefits of CA take time to be witnessed and demonstrating
that CA is a response to climate change and farmers’ vulnerability, CA reduces GHG emissions,
and CA provides better ecosystem functioning and services (Kassam et al., 2009; Derpsch,
Friedrich, Kassam, & Hongwen, 2010). The benefit of CA would be “particularly important” for
regions affected by the drought in Africa, as CA has the potential to hold subsurface moisture more
efficiently (Palm, Blanco-Canqui, DeClerk, Gatere, & Grace, 2014). CA meets smallholders’
farmers’ need to spend less time on agricultural production (per unit of land) because it reduces

15
intensive tasks such as tillage and weeding, and, as a result, more time is available to diversify
their livelihoods (Friedrich & Kienzle, 2008).
Focusing on the impact of CA on food security, Mango, Siziba, and Makate (2017)
demonstrated that CA did not change the food consumption score in Zimbabwe and Malawi due
to a limited area of CA land and producers not being able to apply the correct CA techniques, but
it had significantly improved the food consumption score in Mozambique. In Brazil, a FAO study
which considered CA an improved cropland management technology reported an increase in
average productivity and farm net income for maize, beans, bananas, and cassava in 2010 due to
CA (Branca, McCarthy, Lipper, & Jolejole, 2011). A study in Mozambique explored the benefits
of CA and found it provides better crop returns to smallholders’ farmers, especially the poorest,
when intercropping is also integrated (Lalani, Dorward, & Holloway, 2017). Numerous studies
comparing conventional tillage to CA in South Africa showed better maize yields under CA
(Sithole, Magwaza, & Mafongoya, 2016).
CA in the DRC
The literature is currently void on the drivers of adoption or the benefits subsequently
thereafter for CA in the DRC. The factors hypothesized driving CA adoption in the DRC were
chosen from the Knowler and Bradshaw list (2007) but also adapted to fit the gender context of
the agriculture sector in the DRC. Unlike other studies on factors driving CA adoption in Africa,
this research further explores the benefits of CA in the DRC. Furthermore, this study estimates the
benefits, in terms of food security and income reliability, perceived by adopters of CA in DRC.
Thus, this study is the first of its kind in that it uses primary data to both estimate the drivers and
the benefits of CA adoption in the DRC.

16
Research site and data
Maniema province
The research study took place in Kailo and Kasongo territories in the Maniema province
in the DRC, where seven and four villages, respectively, were sampled (Figure 1 and Table 1).
Maniema province has 132,250 square kilometers (51,062 sq. mi) and is located between 0° and
5° South latitude and 24° 30' and 28° 50' East longitude, a space that extends between the Lomami
river in the west and the mountain ranges of Eastern DRC (Omasombo T. et al., 2011). This
province has seven territories, Lubutu, Punia, Kailo (where Kindu, the provincial capital, is
located), Pangi, Kibombo, Kasongo and Kabambare. Furthermore, the province has a population
of 1,682,451 people in 2014, where 70% of the population is rural, and 60% and 65% of the women
and men are involved in agriculture, respectively (Omasombo T. et al., 2011; MINPLAN et al.,
2014). Maniema has a GINI coefficient of 0.34, less than the 0.4 national rate (MINPLAN et al.,
2014).
Figure 1. Map of Maniema province

17
MINPLAN et al. (2014) use the GINI coefficient here to illustrate population inequality in terms
of the level of economic well-being. Maniema was slightly under the national GINI of 0.4.
According to Omasombo T. et al. (2011), two thirds of Maniema province are classified as dense
rainforest, and one third is a shrub savannah.
Research data
The data used for this study were collected in 2015 by Catholic Relief Services (CRS) for
an ex-post evaluation study conducted three years after NTA project closure. CRS (2015) used a
structured household survey questionnaire to interview farmers in Kailo and Kasongo territories,
where the NTA project was implemented from 2009 to 2012. The household survey targeted both
NTA project beneficiaries (participants) and non-beneficiaries (non-participants). Based on a
population size of 5,800 farmers who participated in the NTA project in the two targeted territories,
CRS utilized a random stratified sampling method to select 225 households for the interviews
(CRS, 2015). Table 1 presents the breakdown of interviewees at village levels for the two
territories.
Table 1. Number of farmers interviewed per village in 2015 by the Catholic Relief Services
Territory Village Observations
Kailo (Forest) Enombe-Brigade 7
Enombe-Sakina 18
Lubangwana 10
Lubelenge 18
Nyoka 33
Kampala 29
Kimanga 13
128
Kasongo (Savannah) Kauta 43
Lukongo 15
Kionga 21
Kamonga 18
97
Source: CRS, 2015

18
From CRS’ dataset, the information used for this study can be grouped into four categories:
• Geographical context. The research site has two agroecological zones (regions): the forest in
Kailo territory and the savannah in Kasongo territory. Within each territory, the village in
which each participant’s farm is located is also taken into consideration. Enombe-Brigade,
Enombe-Sakina, Lubangwana, Lubelenge, Nyoka, Kampala, and Kimanga are the villages of
Kailo; and Kauta, Lukongo, Kionga, and Kamonga are the villages of Kasongo where
interviews took place.
• Socioeconomic opportunities. This category includes farmers’ access to credit, farmers’ group
membership, and farm size. CA adoption (did or did not adopt) and training (were trained
formally or were not trained formally) also fall into this category.
• Demographic characteristics. The research used household size and age, literacy
(literate/illiterate), and gender of the household head.
• Impact perception. This category assesses the benefits of CA adoption from farmers’
perspective. The information used for this category includes farmers’ apprehension about food
security status (decrease, stagnation, or increase); reliability of income from CA (not reliable,
less reliable, somehow reliable, or very reliable); and farmland under CA (decrease, stagnation,
or increase) as a result of adopting CA.
For the purpose of this study, farmers were disaggregated in terms of CA adoption, CA
training, and the two main agroecological zones, as illustrated in Table 2. Grouping the data
between CA adopters and non-adopters indicate statistically significant differences (p < 0.10)
between farm size, household size, proportions of farmers trained, living in the savannah, female

19
non-married, members of farmers’ groups, and those who had accessed credit (Table 2). Age and
literacy of the household head for the two categories were found to be statistically the same.
Table 2. Farmers’ characteristics based on CA adoption, training, and agroecological zones
Non-
adopters
(n=67)
Adopters
(n=158)
Trained
farmers
(n=181)
Untrained
farmers
(n=44)
Forest
region
(n=128)
Savannah
region
(n=97)
Means a
Farm size 0.725**
(0.768)
1.056
(1.731)
0.997
(1.630)
0.794
(0.895)
1.033
(1.419)
0.858
(1.636)
Age 41.672
(11.181)
43.804
(11.229)
43.514
(11.118)
41.750
(11.714)
43.328
(10.012)
42.959
(12.716)
Household size 9.373***
(4.396)
11.158
(4.388)
11.094***
(4.392)
8.705
(4.246)
10.367
(4.563)
10.969
(4.312)
Proportions (%) b
Adopt – – 83.978***
(0.368)
13.636
(0.347)
64.844*
(0.479)
77.320
(0.421)
Training 43.284***
(0.499)
96.203
(0.192) – – 85.256*
(0.357)
74.227
(0.440)
Savannah 32.836*
(0.473)
47.468
(0.501)
39.779*
(0.491)
56.818
(0.501) – –
Literacy 86.567
(0.344)
83.544
(0.372)
83.425
(0.373)
88.636
(0.321)
87.500*
(0.332)
80.412
(0.399)
Female non-married 17.910**
(0.386)
06.962
(0.255)
09.945
(0.300)
11.364
(0.321)
14.844**
(0.357)
04.124
(0.200)
Farmers’ group 35.821***
(0.483)
89.241
(0.311)
85.083***
(0.357)
25.000
(0.438)
72.656
(0.447)
74.227
(0.440)
Accessed credit 11.940***
(0.327)
63.924
(0.482)
58.564***
(0.494)
06.818
(0.255)
42.188**
(0.496)
56.701
(0.498)
Note:
• Significance codes ‘***’ p < 0.01, ‘**’ p < 0.05, ‘*’ p < 0.10
• a T-test applied to assess differences. b Chi-square test to assess differences.
In terms of differences between trained and untrained farmers, statistical differences were found
between household size, farmers who adopted CA, proportion of the sample living in the savannah,
proportion of the sample who were members of farmers’ groups and proportion of the sample who
had accessed credit. Farm size, age and literacy of the household head, and non-married female

20
farmers were found to be equivalent statistically between subsamples. Between farmers living in
villages located in the savannah and those living in the forest, statistical differences are noted for
those who adopted CA, who were trained, who were literate, who are female non-married, and
those who had accessed credit.
Data processing
The software RStudio (RStudio Team, 2016) was used for data analysis and estimation.
The computation using RStudio required the following packages: Stargazer (Hlavac, 2018) for
descriptive statistics, mass (Venables & Ripley, 2002) for the regression models; and erer (Sun,
2016), and oglmx (Caroll, 2017) for the marginal effects.
Model specifications
Modeling CA adoption
(i) Explanatory variables
For this study, a CA adopter was defined as a farmer living in the research area and,
applying the three CA principles (no-tillage, crop rotation, and mulching), whose farm was
observed by the surveyor and determined to be in compliance with CA. The following drivers were
hypothesized to explain CA adoption in the DRC.
Age
Age of the household head in years is a continuous (integer) variable. The variable age is
hypothesized to affect CA adoption. In the DRC, where life expectancy is estimated around 60
(World Bank, 2018), 67.8% of the population is less than 25 years old (MINPLAN et al., 2014).
Ntshangase et al. (2018) showed a positive influence of age on CA adoption in South Africa.

21
Household size
Household size is a continuous (integer) variable representing the household size, the total
number of family members living in the farmer’s home. Household size might provide a
demographic influence on CA adoption. The average household size in the DRC is 5.3 (MINPLAN
et al., 2014). Ntshangase et al. (2018) found that in South Africa, household size influences CA
adoption as larger households adopt more. However, that does not necessarily mean more available
labor. Moreover, for poor households, who represent a large group in Sub-Saharan Africa, CA
tends to be an “attractive option” (Lalani et al, 2017, p.144).
Farm size
This variable is continuous and accounts for the farmer’s total plot size used for farming.
Studies have shown that farm size influence on CA adoption can be positive, negative, or neutral
(Knowler & Bradshaw, 2007). In Lesotho, Malawi, and South Africa, for instance, it was found
that farm size has a direct effect in CA adoption decision making (Bisangwa, 2013; Chisenga,
2015; Ntshangase et al., 2018). Table 2 indicates there are statistical differences in farm sizes
between adopters and non-adopters. As such, this study added farm size in a regression framework
to see if this is causation or correlation.
Training
Training is a dummy variable used to isolate the influence of the complete CA training
provided by the NTA project. This variable takes the value 1 for farmers trained in CA and 0 for
untrained farmers. The lack of proper CA knowledge is reported among the barriers to CA adoption
(Giller et al., 2009; Kassam et al., 2009; Derpsch, 2007; Friedrich et al., 2010). In the agriculture

22
sector, farmers mostly have access to knowledge through the extension service, which is not
necessarily the case in the DRC, where non-government agriculture programs promoted CA.
Savannah
Savannah is a dummy variable used to test for location (agroecological zone) impact of
CA adoption in the DRC. This variable takes the value 1 for Kasongo territory, meaning the farm
is located in the savannah, and 0 for Kailo territory, meaning the farm is located in the forest.
Based on agroecological studies, Lee (2005) recommends a regional approach in promoting
farming technologies such as CA because they are “location-specific” and address “niche-type
constraints faced by farmers” (p.1327). Palm et al. (2014) also support Lee’s recommendation in
a study showing the influence of CA on ecosystem services in Sub Saharan Africa and South Asia.
Agroecological information types are linked to crop growth, development, and yield, and so would
impact the spread of CA say Sithole, Magwaza, and Mafongoya (2016), who observed CA impact
on maize yield in South Africa.
Literacy
Literacy is a dummy variable which takes the value 1 for literate farmers (farmers who can
read and write) and 0 for an illiterate farmer. This variable’s coefficient will measure the influence
of basic education on farmers’ adoption of CA. Farmers’ education may have a positive, negative,
or neutral influence on CA adoption (Knowler & Bradshaw, 2007). In this study, literacy is used
as a proxy for education. In the DRC, 15% of women compared to 4% of men have no formal
education (MINPLAN et al., 2014). Studies have shown a positive influence of women’s education
on food security (Penders and Staatz (2001), Smith and Haddad (2002), and Webb and Lapping
(2002) cited by Napoli, 2011).

23
Female non-married
Female non-married is a dummy variable taking the value 1 for a female, non-married
farmer, and 0 for any other farmer. This variable was defined to comply with the NTA project
goal, to help vulnerable women, and also to cross-check this CRS targeting approach influence on
CA adoption. Fifty-one percent of NTA project participants were women, and 30% were widows
(CRS, 2015). According to CRS (2015), the “single women and widower” pointed to labor-saving
as their key incentive to adopt CA. Agriculture is the main activity for six out of ten women in the
province of Maniema in the DRC (MINPLAN et al., 2014). Women in Maniema province have
been weakened by war and poverty, and low agriculture productivity worsens their plight (CRS,
2009). As such, this variable is one of the cornerstones of the study, in that it first looks if the NTA
project had the desired outcome of targeting and, ultimately, assisting women, and second if there
was a gender component to adoption.
Farmers’ group
Farmers’ group is a dummy variable taking the value 1 for farmers who are members of a
farmers’ group, and 0 for farmers not in a farmers’ group. In Malawi, membership in a farmers’
group has been reported as a driver of CA adoption (Chisenga, 2015). Bisangwa (2013) argues
that CA has “advantages that increase social capital through farmer[s’] groups,” when listing his
benefits of CA adoption in Lesotho. According to Silici (2009), “social interactions within a group
and among this and other groups” increase farmers’ knowledge and access to innovative
information, and, so affected CA adoption in Lesotho. In the DRC, where the government
extension service does not work well, the farmers’ group approach is considered an alternative.
Forming farmers’ groups as entry points in Maniema’s communities was chosen by the NTA

24
project to reach the “poorest farmers” at low cost and to prepare them for collective marketing, as
CA was expected to increase their crop production.
Accessed credit
Accessed credit is a dummy variable which takes the value 1 if the farmer had accessed
credit and 0 for the farmers who had not accessed credit. An important delineation needs to be
made between those who had “access to credit” and those who “accessed credit”. The dataset used
in this study only asked participants if they “accessed credit”, and did not denote those who may
have “access to credit” but were either turned down or did not apply for it. Access to credit is cited
as a constraint and/or a determinant to CA adoption (Giller et al., 2009; Giller et al., 2011;
Bisangwa, 2013; Chisenga, 2015; Thierfelder et al., 2015; Ntshangase et al., 2018). Increasing
access to formal and informal credit sources could help farmers surmount short-run liquidity
constraints which may be brought on by CA adoption (Lee, 2005).
Table 3 summarizes the explanatory variables used in the study with a brief description for
each with their expected impact based on previous literature.
Table 3. Explanatory variables, description, and expected outcome.
Variable Description and Measurement type Variable type
Expected
outcome
(+/-)
Age Age of head of the household (years) continuous +/–
Household size Farmer’s household size (number of people) integer +
Farm size Farmer’s land size (in hectare) continuous +/–
Training Training received on CA; Dummy, = 1 if the
farmer was trained in CA, = 0 if the farmer was
not trained in CA
categorical +
Savannah Agroecological zone where the farm is located; Dummy, = 1 means in the savannah (Kasongo),
= 0 means in the forest (Kailo)
categorical +/–

25
Table 4. Explanatory variables, description, and expected outcome (Cont.).
Variable Description and Measurement type Variable type
Expected
outcome
(+/-)
Literacy Farmer can read and write; Dummy, = 1 if the farmer
is literate, = 0 if the farmer is not literate categorical +/–
Female non-married Farmer is female and non-married/widow; Dummy, =
1 if the farmer is Female non-married, = 0 for any
married farmer
categorical +
Farmers’ group Farmers’ group membership; Dummy, = 1 if the farmer
is a farmers’ group member, = 0 if the farmer is not a
farmers’ group member
categorical +
Accessed credit Farmers had accessed credit; Dummy, = 1 if the farmer
had accessed credit, = 0 if he/she did not accessed
credit
categorical +
(ii) Logit models
Studies focusing on factors influencing CA adoption have used different methods of
analysis such as linear probability models, ordinary least squares, random effects, GLS, stepwise
regression, the Cragg model, logit model, probit model, multinomial logit model, non-parametric
chi-square test, and multiple classification analysis (Knowler & Bradshaw, 2007). Similar studies
conducted on small farms between 2013 and 2018 used logit and probit models in Tanzania, South
Africa, and Lesotho and multinomial logit models in Mozambique, Zimbabwe, and Zambia
(Bisangwa, 2013; Mkamkwe, 2013; Mavunganidze et al., 2013; Grabowski, 2015; Mlenga &
Maseko, 2015; Ntshangase et al., 2018).
For this study, CA adoption is considered as the choice made by a farmer to apply all three
components of CA technology (no-tillage, crop rotation, and mulching) simultaneously. The
farmer “faces a pair of choices” (p.721) and chooses one outcome, in this case, to adopt or not to
adopt (Greene, 2012). The dependent variable, adopt, is a binary response. A logit model was used
to explore how explanatory variables affect the probability of CA adoption occurrence (Mlenga &

26
Maseko, 2015). The probability for an individual farmer (i) adopting CA can be modeled as
follows (Greene, 2012):
𝑃𝑟𝑜𝑏 (𝑎𝑑𝑜𝑝𝑡𝑖 = 1 | 𝐱𝑖) = 𝑒(𝐱𝑖
′ 𝛽)
1 + 𝑒(𝐱𝑖′ 𝛽)
= 𝐹(𝐱𝑖 , 𝛽)
where xi is a vector of the independent variables listed in Table 3 above, β is the parameter vector
reflecting the changes in xi on the probability, and F is the logistic function taking on values strictly
between zero and one.
The marginal effect on the probability of adopting for a change in d, a binary independent
variable, is given by (Greene, 2012):
𝑀𝑎𝑟𝑔𝑖𝑛𝑎𝑙 𝑒𝑓𝑓𝑒𝑐𝑡 = 𝑃𝑟𝑜𝑏 [𝑎𝑑𝑜𝑝𝑡𝑖 = 1 | �̅�(𝑑), 𝑑 = 1] − 𝑃𝑟𝑜𝑏 [𝑎𝑑𝑜𝑝𝑡𝑖 = 1 | �̅�(𝑑), 𝑑 = 0]
where �̅�(𝑑) denotes the sample means of all the other variables in the model. This implies that the
marginal effects are evaluated with all other independent variables set at their sample means. The
formula for the marginal effect on the probability of adopting for one-unit change in a continuous
variable in xi, as given by Greene (2012, p.729), is
𝑀𝑎𝑟𝑔𝑖𝑛𝑎𝑙 𝐸𝑓𝑓𝑒𝑐𝑡 = 𝜕𝐹(𝐱𝑖, 𝛽)
𝜕𝐱𝑖= [
𝑑𝐹(𝐱𝒊 ′ 𝛽)
𝑑(𝐱𝑖′ 𝛽)
] × 𝛽
Also, knowing that for the logistic function F, F(z) = ez/(1+ez) and the computation of its derivative
gives dF/dz = F(z)*(1 – F(z)).
In this study’s approach, the estimation of a variety of model specifications establishes the
validity of the findings. Hence, four different versions of the full-sample model are estimated. In
addition, while it would be ideal if the parameters, β, were constant across the entire sample, our
a priori belief—backed up by empirical evidence shown shortly—is that the parameter vector, β,
(1)
(2)
(3)

27
is not constant across all observations. Consequently, models using samples that are subsets of
the full sample are estimated. Such a sorting gives more precise insights into farmers’ behavior.
These different perspectives looking at CA adoption lead to eight analytical models given below.
1. Full-sample – logit model (n = 225)
This model was specified to provide a baseline model without considering the geographical
context. In most of the eight models, the vector xi includes all variables except savannah and
villages selected by the researchers, so that the most basic full-sample model can be written as
𝑃𝑟𝑜𝑏 (𝑎𝑑𝑜𝑝𝑡𝑖 = 1 | 𝐱𝑖) = 𝐹 (
𝛽0 + 𝛽1 𝑎𝑔𝑒𝑖 + 𝛽2 ℎ𝑜𝑢𝑠𝑒ℎ𝑜𝑙𝑑 𝑠𝑖𝑧𝑒𝑖 + 𝛽3 𝑓𝑎𝑟𝑚 𝑠𝑖𝑧𝑒𝑖
+ 𝛽4 𝑡𝑟𝑎𝑖𝑛𝑖𝑛𝑔𝑖 + 𝛽5 𝑙𝑖𝑡𝑒𝑟𝑎𝑐𝑦𝑖 + 𝛽6 𝑓𝑒𝑚𝑎𝑙𝑒 𝑛𝑜𝑛 − 𝑚𝑎𝑟𝑟𝑖𝑒𝑑𝑖
+ 𝛽7 𝑓𝑎𝑟𝑚𝑒𝑟𝑠′𝑔𝑟𝑜𝑢𝑝𝑖 + 𝛽8 𝑎𝑐𝑐𝑒𝑠𝑠𝑒𝑑 𝑐𝑟𝑒𝑑𝑖𝑡𝑖
)
2. Agroecological zone – logit model (n = 225)
This model was specified to illustrate farmers’ behavior based on their agroecological
zones in a research area, where either the farm is located in the savannah or in the forest. The
conditions in the two zones are not the same, and zone likely impacts farming. The vector xi in (1)
here includes all variables in (4) plus a binary for zone, where the binary is one if the observation
is from the savannah.
3. Village level – logit model (n = 225)
This model was specified to illustrate farmers’ behavior allowing village-level differences.
The geography of the research area shows that the selected villages are in four different
collectivités, meaning four ethnic groups. This cultural-locational aspect may play a role in CA
adoption. The vector xi in (1) here includes all variables in (4) with ten additional binaries to
designate the village where the observation was taken. Enombe-Brigade was the baseline village.
(4)

28
4. Savannah region – logit model (n = 97)
This model was specified to illustrate farmers’ behavior only in the savannah. This model
is specified as (4), but only data collected in the savannah (Kasongo territory) are utilized in
estimation. The focus is to model the behavior of farmers in savannah conditions. By comparing
the estimated coefficient from this model to models (5) to (7), this study determines if the slope
coefficients vary in addition to the intercepts as in models (2) and (3).
5. Forest region – logit model (n = 128)
This model was specified to illustrate farmers’ behavior only in the forest. This model is
specified as (4), but only data collected in the forest (Kailo territory) are utilized in estimation. The
focus is to model the behavior of farmers in the forest conditions.
6. Trained group – logit model (n= 181)
This model was specified to isolate farmers’ behavior after being trained in CA by the NTA
project. This model is similar to (4) but uses a subset of the sample, including only trained farmers.
7. Untrained group – logit model (n = 44)
This model was specified to isolate how untrained farmers behave. This model is, like (1),
estimated using the subset of observations of untrained farmers. The vector xi as given in (1)
excludes the variables female non-married and literacy. It turned out that for untrained farmers,
there is very little variability in the dependent variable adopt but also little variability in literacy
and female non-married, indicating that, for untrained farmers, literacy and female non-married
are not related to CA-adoption decisions.

29
8. Full-sample without training – logit model (n = 225)
This model was specified as (1) but omits training. The purpose was to determine if the
parameters of other variables change when CA training received from the NTA project is omitted.
The focus is to show how farmers’ behavior on the entire research area is affected by training.
Some variations would be expected in coefficient estimates from their counterparts in (4). So, this
helps us understand the full impact of training both through its direct effect, 𝛽4 , and its indirect
effect via the changes in the other coefficients without training.
Modeling the perceived benefits of CA
This section focuses on farmers’ perceptions of the benefits of CA. The modeling approach
here is similar to econometric studies that explored agricultural technology adoption in West
Africa. In Burkina Faso, Guinea and Sierra Leone, Adesina and Zinnah (1993), and Adesina and
Baidu-Forson (1995) showed that the way farmers perceived improved varieties was an incentive
to adopt them. Farmers’ perceptions are subjective and, thereby, hard to explain how they are
formed. Modeling the perceived benefits of CA for farmers in the province of Maniema is a
practical attempt to learn and explain their individual behavior in this part of the DRC. From field
experience, smallholders’ farmers do not accept or believe in an innovation until they have
benefited from it or seen how it benefits their peers.
(i) Explanatory variables
To measure the perceived benefits of CA in 2015, three years after the completion of the
NTA project in the research area, adopt and savannah are the two targeted variables that explain
the variation in farmers’ perceptions of the various benefits of CA. The purpose here is to quantify
how perceptions vary as a result of whether farmers adopted CA or not and/or whether
agroecological conditions play alone or together with CA adoption a role in explaining farmers’

30
behavior. In 2015, “improving food security, [an] increase in revenue, and payment of school fees”
were reported by CRS as the key incentives for CA adoption. The dependent variables in the next
paragraph were used to measure farmers’ perception of CA benefits.
(ii) Dependent variables
Reliability of income from CA
The variable reliability of income from CA is a response to the question “Is the income
obtained from CA reliable?” The respondent was required to respond if he or she thought his or
her income from CA was ‘not reliable at all,’ ‘less reliable,’ ‘somehow reliable,’ or ‘very reliable’
in relation to not using CA. This structure restricted and ordered the answer making reliability of
income from CA an ordinally ranked variable. A study by Thierfelder et al. (2015) in Southern
Africa that explored smallholders’ farmers’ perceptions and CA showed that CA adoption leads to
an increase in farmers’ household income. The present study used farmers’ perception of income
reliability to assess the benefit of adopting CA.
Land under CA
The variable land under CA is a response to the question “Did the farmland area under CA
increase after the end of the NTA project?” The respondent was required to choose if the farmland
under CA has ‘increased,’ remained ‘static,’ or ‘decreased.’ This structure restricted and ordered
the answer while making this variable ordinally ranked. Land under CA is described as the
farmland on which CA is applied. It allows for an approximation of CA expansion on household
farms from a smallholders’ farmers’ perspective. Ntshangase et al. (2018) noted a decrease in farm
size due to CA adoption. This study aimed to check how the perception of CA expansion is related
to CA adoption.

31
Food security status
The variable food security status is a response to the question “What is the current (2015)
food security status compared to 2012?” The respondents were required to say if they thought their
food security status has ‘decreased,’ ‘stagnated,’ or ‘improved.’ This response structure results in
an ordinally ranked variable. Thierfelder et al. (2015) showed that CA adoption led to increases in
farmers’ household food security. The present study also used farmers’ perception to assess the
benefit of adopting CA on food security status.
Table 4 summarizes the list of dependent variables with a brief description for each, and
their hypothesized outcomes as a result of CA adoption based on existing literature.
Table 5. Explained variables, description, and hypothesized outcome.
Variable Description and Measurement type Variable type
CA
influence
(+/-)
Reliability of income from CA
Farmers’ perception of reliability of income
gained from the farm due to CA (1 = not
reliable at all, 2 = less reliable, 3 = somehow
reliable, 4 = very reliable)
categorical +
Land under CA Farmer’s perception of CA expansion on the
farmer’s land (1 = decreased, 2 = static 3 =
increased)
categorical +/–
Food security status Farmer’s perception of his own food security
status due to CA (1 = decreased, 2 = stagnated,
3 = improved)
categorical +
(iii) Ordered logit models
To explain perception levels as a function of adoption and region, an ordered logit model
is appropriate for the three variables in Table 4. According to Greene (2012), with an ordered logit
model someone “reveals the strength of [his/her] preference with respect to a single outcome”
(p.800).

32
The probability for an individual farmer (i) to select alternative j in 1, 2, …, j – 1 can be
modeled as following Cameron and Trivedi (2005):
𝑃𝑟𝑜𝑏 (𝑦𝑖 = 𝑗 | 𝐱𝑖) = 𝑃𝑟𝑜𝑏 (𝛼𝑗−1 < 𝑦𝑖∗ ≤ 𝛼𝑗 ) = 𝐹( 𝛼𝑗 − 𝐱𝑖
′𝛽) − 𝐹(𝛼𝑗−1 − 𝐱𝑖′𝛽)
where y represents one of the dependent variables: reliability of income from CA, land under CA,
or food security status; and y* an index model with single latent variable representing the starting
point (yi* = xi’β + ui). Given j alternatives for a particular y, the αj are the thresholds between
alternatives, xi is a vector holding the regressors (adopt and savannah), and F is a logistic function
F(z) = ez/(1+ez).
The marginal effects for the expression (5) are given by (Cameron & Trivedi, 2005):
𝑀𝑎𝑟𝑔𝑖𝑛𝑎𝑙 𝑒𝑓𝑓𝑒𝑐𝑡 = {𝐹′(𝛼𝑗−1 − 𝐱𝑖′𝛽) − 𝐹′( 𝛼𝑗 − 𝐱𝑖
′𝛽)} 𝛽
where F’ denotes the derivative of F and is interpreted as the change in the probability of selecting
alternative j as xi increased one unit. Also, 𝐹( 𝛼𝐽 − 𝐱𝑖′𝛽) = 1 and 𝐹( 𝛼0 − 𝐱𝑖
′𝛽) = 0, where J
denotes the highest alternative of the dependent variable.
Based on equation (5), five models of the three different perspectives (all research area,
agroecological zones, and training) examined the impact of CA adoption on each of the dependent
variables. The five analytical models are:
9. Full-sample – ordered logit model (n = 225)
This model estimates the influence of CA adoption and the agroecological context on the
benefits perceived by farmers in terms of reliable income, CA farmland expansion, and food
security at household level for the entire pooled dataset. Each of the explained variables (reliability
of income from CA, land under CA, and food security status) is regressed on adopt and savannah.
(5)
(6)

33
10. Savannah region – ordered logit model (n = 97)
This model isolates the influence of CA adoption only in the savannah region on the
benefits perceived by farmers in terms of reliable income, CA farmland expansion, and food
security. Each of the explained variables (reliability of income from CA, land under CA, and food
security status) is regressed on adopt. This model estimates the perceived benefits of CA adoption
in Kasongo territory.
11. Forest region – ordered logit model (n = 128)
This model isolates the influence of CA adoption only in the forest region on the benefits
perceived by farmers in terms of reliable income, CA farmland expansion, and food security. Each
of the explained variables (reliability of income from CA, land under CA, and food security status)
is regressed on adopt. This model estimates the perceived benefits of CA adoption in Kailo
territory.
12. Trained – ordered logit model (n = 181)
This model illustrates the influence of CA adoption and the agroecological context on the
benefits perceived by CA trained farmers in terms of reliable income, CA farmland expansion, and
food security. Each of the explained variables (reliability of income from CA, land under CA, and
food security status) is regressed on adopt and savannah. These models estimate the perceived
benefits of CA adoption for trained farmers.
13. Untrained – ordered logit model (n = 44)
This model illustrates the influence of CA adoption and the agroecological context on the
benefits perceived by CA untrained (those who did not go through formal CA training) farmers in

34
terms of reliable income, CA farmland expansion, and food security. Each of the explained
variables (reliability of income from CA, land under CA, and food security status) is regressed on
adopt and savannah. This model estimates perceived benefits of CA adoption only for untrained
farmers.
35
Results & discussion
CA adoption
(i) Model results description
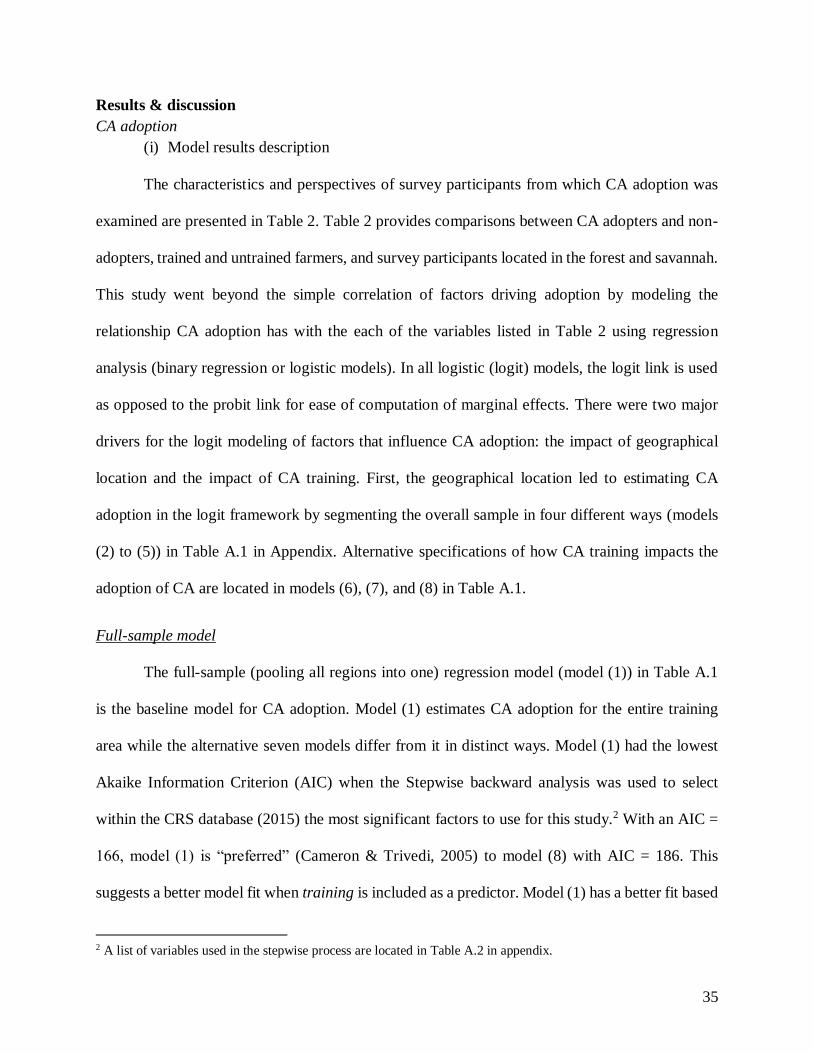
The characteristics and perspectives of survey participants from which CA adoption was
examined are presented in Table 2. Table 2 provides comparisons between CA adopters and non-
adopters, trained and untrained farmers, and survey participants located in the forest and savannah.
This study went beyond the simple correlation of factors driving adoption by modeling the
relationship CA adoption has with the each of the variables listed in Table 2 using regression
analysis (binary regression or logistic models). In all logistic (logit) models, the logit link is used
as opposed to the probit link for ease of computation of marginal effects. There were two major
drivers for the logit modeling of factors that influence CA adoption: the impact of geographical
location and the impact of CA training. First, the geographical location led to estimating CA
adoption in the logit framework by segmenting the overall sample in four different ways (models
(2) to (5)) in Table A.1 in Appendix. Alternative specifications of how CA training impacts the
adoption of CA are located in models (6), (7), and (8) in Table A.1.
Full-sample model
The full-sample (pooling all regions into one) regression model (model (1)) in Table A.1
is the baseline model for CA adoption. Model (1) estimates CA adoption for the entire training
area while the alternative seven models differ from it in distinct ways. Model (1) had the lowest
Akaike Information Criterion (AIC) when the Stepwise backward analysis was used to select
within the CRS database (2015) the most significant factors to use for this study.2 With an AIC =
166, model (1) is “preferred” (Cameron & Trivedi, 2005) to model (8) with AIC = 186. This
suggests a better model fit when training is included as a predictor. Model (1) has a better fit based
2 A list of variables used in the stepwise process are located in Table A.2 in appendix.

36
on its lower AIC value. With model (1), farmers’ group, training, accessed credit, and female non-
married are highly statistically significant (p < 0.01) and as such are likely strong drivers of CA
adoption. The influence of these four factors is positive for the first three factors and surprisingly
negative for female non-married. Age, farm size, household size, and literacy are statistically
insignificant (p > 0.10) in model (1).
Agroecological zones model
The agroecological zone regression model (model (2)) in Table A.1 adds the predictor
savannah, essentially testing if there are statistical differences in CA adoption between the two
agroecological zones. The AIC for model (2) is 155, indicating a better prediction of CA adoption
than model (1). With model (2), savannah, accessed credit, farmers’ group, training, and female
non-married are highly significant (p < 0.01) on CA adoption. The influence of these factors is
positive, except for female non-married, which has a negative influence on CA adoption. For
model (2), age, farm size, household size, and literacy are statistically insignificant. Given the
statistical significance (p < 0.01) of the savannah variable in Table A.1, model (2) indicates that
each region (forest and savannah) may need to be modeled separately.
Village level model
Model (3) on Table A.1 is built from model (1) with the inclusion of the locations of the
11 villages targeted in the research site. The AIC for model (3) is 158, which is inferior to model
(2) but still statistically superior to model (1), with respect to estimating factors of CA adoption.
This would indicate that, from a geographical context, it is statistically superior to use the
agroecological zones level over the village level model, though this may be due to the large
increase in number of parameters estimated. This also means there are unobserved parameters
(explanatory variables not included in the model) that make adoption more attractive in the

37
savannah. Furthermore, in model (3), farm size has a statistically significant influence (p < 0.10)
on CA adoption but is not as strong as accessed credit, farmers’ group, training, and female non-
married, which have a highly significant influence (p < 0.01). The influence of female non-married
and villages on CA adoption are negative. Age, household size, and literacy are not statistically
significant (p > 0.10).
Savannah and forest regions models
Model (4), using only observations from participants located in the savannah, and model
(5), using only those observations from participants located in the forest, in Table A.1 estimate,
respectively, CA adoption in the savannah and forest independently. The set of factors used for
model (1) is identical to those used on the subsets in models (4) and (5). Model (4) indicates that
in the savannah only training (if the participant was formally trained in CA) is statistically
significant (p < 0.01) on CA adoption, with the remaining variables being statistically insignificant
(p > 0.10). Model (5) indicates that in the forest, accessed credit, farmers’ group, training, and
female non-married have a high significant influence (p < 0.01) on CA adoption. Accessed credit,
farmers’ group, and training have a positive influence; female non-married was found to be a
deterrent to adoption. In model (5), age, farm size, household size, and literacy are not statistically
significant (p > 0.10). Models (4) and (5) provide evidence of differing factors of CA adoption
relevant to each (savannah and forest) regional location.
Trained group, untrained group, and full-sample without training models
The impact of CA training is approached by estimating models with only trained farmers
(model (6)), untrained farmers (model (7)), and all participants regardless of training (model (8)).
Models (1) to (5) have highlighted the robustness of training in influencing CA adoption
positively. Model (6) indicates that for those farmers who had completed formal CA training,

38
accessed credit, farmers’ group, and female non-married are statistically (p < 0.01) influential on
the adoption of CA, and only female non-married negatively (p < 0.01) affects adoption. For model
(7), none of the explanatory variables were found to be statistically significant (p > 0.10).
Furthermore, model (8) is model (1) with training removed. Model (8) indicates that accessed
credit, farmers’ group, and female non-married play a statistical role (p < 0.01) on CA adoption,
and only Female non-married has a negative influence. In model (8), age, farm size, household
size, and literacy are not statistically significant (p > 0.10). Model (8) shows how excluding
training makes CA adoption modeling different, with an increased AIC compared to model (1),
and model (6) and (7) make it clear that factors influencing CA adoption are not the same among
trained and untrained farmers. CA adoption among trained farmers, as shown by model (6), is
driven by having accessed credit, being in a farmers’ group, and being a female non-married, while
there is no any influence for untrained farmers (model (7)).
(ii) Interpreting the impact of factors influencing CA adoption
Table 5 presents the marginal effects for each logit model used to explain CA adoption.
Savannah
Savannah is highly significant (p < 0.01) in model (2). The coefficient given by model (2)
in Table 5 for savannah implies a farmer located in the savannah is 26.5% more likely to adopt
CA than farmers located in the forest, ceteris paribus. In Table 2, looking at farmer characteristics,
there are more CA adopters in the savannah (77%) than the forest (65%). The chi-square test shows
in Table 2 a significant difference (p < 0.10) between farmers adopting CA in the savannah versus
those located in the forest. It is important to highlight here that in the forest, CA was applied on 5-
10-years-old fallows that used the slash-and-burn practice, and not the virgin forest (CRS, 2012,
2015).

39
Table 6. Marginal effects of factors influencing CA adoption
Dependent variable =1 if the farmer adopted CA
(1) (2) (3) (4) (5) (6) (7) (8)
Full
sample
Agroecological
zone
Village level
Savannah region
Forest region
Trained group
Untrained group
Full
sample without
training
Savannah – 0.265***
(0.077) – – – – – –
Enombe - Sakina – – -0.787***
(0.195) – – – – –
Kamonga – – -0.052
(0.301) – – – – –
Kampala – – -0.702*
(0.296) – – – – –
Kauta – – -0.049
(0.271) – – – – –
Kimanga – – -0.832***
(0.144) – – – – –
Kionga – – -0.439
(0.547) – – – – –
Lubangwana – – -0.863***
(0.082) – – – – –
Lubelenge – – -0.655 .
(0.337) – – – – –
Lukongo – – -0.620
(0.403) – – – – –
Nyoka – – -0.587
(0.386) – – – – –
Age 0.006
(0.004)
0.004
(0.003)
0.002
(0.003)
0.001
(0.002)
0.008
(0.006)
0.002
(0.002)
0.004
(0.004)
0.004
(0.003)
Farm size 0.050
(0.040)
0.065
(0.041) 0.068 .
(0.038)
0.032
(0.040)
0.124
(0.077)
0.038
(0.030)
0.0007
(0.057)
0.042
(0.029)
Accessed credit 0.260***
(0.072)
0.197**
(0.069)
0.233**
(0.078)
0.107
(0.089)
0.277*
(0.109)
0.166**
(0.056)
0.198
(0.287)
0.317***
(0.064)
Farmers’ group 0.355***
(0.105)
0.319**
(0.107)
0.360**
(0.123)
0.096
(0.106)
0.422**
(0.131)
0.261*
(0.110)
0.157
(0.146)
0.467***
(0.091)
Household size -0.001
(0.009)
-0.002
(0.008)
-0.004
(0.007)
-0.007
(0.009)
0.003
(0.014)
-0.002
(0.005)
0.008
(0.011)
0.005
(0.008)
Female non-married -0.414**
(0.154) -0.299 .
(0.161)
-0.388*
(0.189)
-0.048
(0.169)
-0.416*
(0.164) -0.283 .
(0.149)
– -0.346*
(0.154)
Literacy -0.097
(0.075)
-0.046
(0.076)
-0.074
(0.057)
0.142
(0.164) -0.210 .
(0.115)
-0.063 .
(0.036)
– -0.110 .
(0.065)
Training 0.516***
(0.119)
0.671***
(0.112)
0.745***
(0.120)
0.521*
(0.2659)
0.690***
(0.112)
– – –
Note: • Significance codes ‘***’ 0.001 ‘**’ 0.01 ‘*’ 0.05 ‘.’ 0.1 ‘ ’ 1
• The marginal effects in this table derived from regression models in Table A1. (see Appendix)

40
Based on Knowler and Bradshaw’s (2007) listing of “factors affecting significantly” CA
adoption, the variable savannah would be included in the farm biophysical characteristics group.
An agroecological zone is an area of similar conditions in terms of temperature, soil characteristics,
and rainfall, factors listed by Knowler and Bradshaw (2007). The forest part of Maniema province
has an average annual rainfall of 1,600 mm and sandy-clay fertile soils while the savannah has an
average annual rainfall of 1,500 mm and moderately fertile soils consisting of more sand than clay
(FEWSNET, 2016). The results of this study show that agroecological conditions likely play a role
in CA adoption. In 2012, CRS reported that lower CA adoption in the forest may have been due
to the “existence of minerals and mining livelihood opportunities, insignificant reduction in
weeding labor where bush-fires are rampant, and inadequate skills and effort to manage the
vegetation during the first year of NTA project” (p.11). Beyond mining, the forest also offers more
livelihood options in terms of “hunting and wild food gathering” than the savannah (FEWSNET,
2016). That said, there also may be some other exogenous factors playing a role in CA adoption
in the savannah and forest. Nevertheless, the current result has clearly demonstrated that CA is
more likely in the savannah than forest.
Villages
Villages represents unobserved differences among villages. The 11 villages of the research
area are Enombe – Brigade, Enombe – Sakina, Kampala, Kimanga, Lubangwana, Lubelenge, and
Nyoka in the forest and Kamonga, Kauta, Kionga, and Lukongo in the savannah. Figure 1 shows
that the 11 villages fall into four ethnic groups areas: Wangengele, Wasongola, Mamba – Kasenga,
and Wazula. Enombe – Brigade is the baseline village. Enombe – Brigade and Kionga have the
highest CA adoption rate (86%). Two key lessons emerge from exploring the village level in model
(3) as presented in Table 5. First, there is no statistical significance (p > 0.10) for all villages in the

41
savannah region (Kasongo territory) relative to the baseline village. Second, for the villages in the
forest (Kailo territory), the CA adoption differs amongst villages. While the village Nyoka is not
statistically different (p > 0.10) compared to Enombe – Brigade, Table 5 illustrates that CA
adoption is 86% less likely to occur in Lubangwana, 83% less in Kimanga, 79% less in Enombe –
Sakina, 70% less in Kampala, and 66% less in Lubelenge compared to Enombe – Brigade. To
interpret this, the five villages in the forest tend to be less likely to adopt CA relative to the baseline
village. The inclusion of these villages made the intercept in model (3) statistically insignificant
and illustrated that there are significant differences among the unobserved factors among villages.
Because there are four different ethnic groups in the research area, it seemed evident that the
models should include village dummies which act as a proxy for ethnicities. It happens that the
location of CA farms in three out of four villages of Wangengele people and two out of three
villages of the Wasongola people negatively influence CA adoption, while in the villages of
Wazula and Mamba-Kasenga ethnic groups, location is not significant. Model (3) foregrounds the
influence of ethnicity on CA adoption, as there must be specific unobserved factors for each
location. CA is received differently by ethnic groups and this also expresses how farmers are
connected to their beliefs. The sociologic context has the potential to absorb and customize factors
influencing CA adoption. There may be some specific cultural and resources-access factors that
played a role in Maniema province.
CRS (2015), who did not use regression modeling but rather a Chi-square analysis, reported
that there was no relationship between village and CA adoption. CRS’ statement appears to be in
contradiction with this study’s findings. In the forest of Maniema province, artisanal mining is one
of the “coping strategies for poor households” (p.54) reported by FEWSNET (2016). That said,
the proximity of villages to mining sites together with other unknown exogenous factors can

42
possibly bring differences among villages and contribute to influence CA adoption at the village
level.
Age
As shown in Table 5, age of the household head is robustly insignificant (p > 0.10) across
all eight models. As such, age does not seem to affect CA adoption regardless of model
specification. From Table 2, the means comparison between groups using t-tests also show that as
a farmer characteristic, age of participants living in the savannah or forest, trained or untrained,
CA adopters or not is just an insignificant factor.
Like with CRS results, this study shows that age does not influence CA adoption in the
research area. This finding is consistent with Knowler and Bradshaw (2007) who showed that in
many cases the influence of age on CA adoption is typically insignificant regardless of the method
of analysis used. Looking at many chronic problems farmers still face in the DRC and their
consequences, it could be that age is actually being proxied by other variables (single women
farmers, member of farmers’ group, etc.).
Farm size
With the exception of the village level model (model (3)), farm size is consistently
insignificant (p > 0.10) across the other seven models. Model (3) in Table 5 indicates that a
marginal increase (one hectare) in farm size will increase the probability of adoption by 6.8%.
Model (3) highlights the variability of farm size across the villages in the research area. The
average farm size for the 11 villages ranges from 0.53 to 1.65 hectares. Looking at descriptive
statistics in Table 2 about farmers’ characteristics, the results of t-tests demonstrate the presence
of a statistical difference (p < 0.05) for farm size not between savannah and forest, or trained and

43
untrained farmers, but rather between CA adopters and non-adopters. CA adopters’ farm size is
30% larger than their non-adopters’ counterparts.
Farm size, as a “farm specific factor” (Liu and Huang, 2013) has already been included by
Knowler and Bradshaw (2007) in the “farm biophysical characteristics” group of factors driving
CA adoption. According to the two last scholars (Knowler and Bradshaw) who explored CA
adoption studies, farm size can have a positive, negative, or neutral influence on CA adoption.
There is no clear pattern or delineation between large- and small-scale producers. Mavunganidze
et al. (2013) found a positive influence of farm size on CA adoption by smallholders’ farmers in
Zimbabwe, while Ntshangase et al. (2018) demonstrated a negative influence with smallholders’
farmers in South Africa. However, this study shows that in Maniema province, farm size has a
positive influence on CA adoption only when village locations are included. This suggests more
research may be needed at the village level to assess the influence of land-related drivers on
adoption of CA.
Accessed credit
As shown in Table 5, accessed credit is robust and statistically significant (p < 0.01) across
all models except model (4) (that estimates CA adoption for farmers in savannah region only) and
model (7) (that estimates CA adoption for untrained farmers only), where it is not significant (p >
0.10). Model (1) in Table 5 indicates a farmer is 26% more likely to adopt CA if he/she has
accessed credit. In the same Table 5, the positive influence of accessed credit is 19.7% in model
(2), 23.3% in model (3), 27.7% in model (5), 18.1% in model (6), and 31.7% in model (8). Using
a Chi-square test (Table 2), it appears that there is a statistically significant difference (p < 0.05)
between CA adopters and non-adopters, trained and untrained farmers, and participants living in
the forest versus those in the savannah for accessed credit. Almost 64% of CA adopters, 59% of

44
farmers trained in CA, 42% farmers in the forest, and 57% farmers in the savannah had accessed
credit.
Knowler and Bradshaw (2007) included accessed credit in the “farm financial/
management characteristic” group of factors influencing CA adoption. Ntshangase et al. (2018),
Mamkwe (2013), Chisenga (2015), Bisangwa (2013) showed that limited access to credit reduced
CA adoption by smallholders’ farmers in South Africa, Tanzania, Malawi, and Lesotho,
respectively. The findings of this study demonstrate the positive role of having accessed credit on
CA adoption. CRS (2015) brought credit services into the research area with the Savings and
Internal Lending’s Communities (SILC) approach. SILC groups provided credit to smallholder
farmers “to purchase farm supplies – seeds and tools – albeit in small proportions” (CRS, 2015,
p.8). These results would suggest that improving financial options for poor farmers could be a
good approach to support integration of CA in the Maniema communities in DRC.
Farmers’ group
As illustrated in Table 5, farmers’ group has a positive statistical significance (p < 0.01)
on CA adoption across each model except model (4) (that estimates CA adoption for farmers in
savannah region only) and model (7) (that estimates CA adoption for untrained farmers only)
where it is not significant (p > 0.10). Model (1) in Table 5 indicates that a farmer is 35.5% more
likely to adopt CA if he/she is a member of a farmers’ group. Table 5 also indicates that being in
a farmers’ group increases the likelihood of adopting CA by 31.9% in model (2), 36.0% in model
(3), 42.2% in model (5), 22.3% in model (6), and 46.7% in model (8). Furthermore, Chi-square
test results in Table 2 display the significant difference (p < 0.01) between CA adopters and non-
adopters and trained and untrained farmers. Eighty-nine percent of CA adopters and 85% of trained
farmers are members of a farmers’ group.

45
Farmers’ group is similar to what Knowler and Bradshaw (2007) call “membership in [an]
organization such as a producers’ organization” and considered as an exogenous factor that
positively influences CA adoption. For Chisenga (2015), in Malawi, farmers’ group increased CA
adoption by women. Chisenga (2015) recommended the formation of mixed groups and the use of
farmers’ groups by extension services as a channel to promote CA. Even though two of the eight
models did not confirm the influence of farmers’ group membership, in the savannah and among
untrained farmers, the general consensus is that belonging to a farmers’ group increases CA
adoption. Ntshangase et al. (2018) had a similar finding in South Africa. Besides the social capital
a farmers’ group brings to smallholders’ farmers’ communities, it is also a strong platform for
learning and information sharing where extension service is low.
Household size
Household size is robustly insignificant (p > 0.10) across all eight models in impact on CA
adoption. These results are interesting, as it could be hypothesized that smaller households may be
more likely to adopt CA since it is potentially labor saving. However, the t-test results in Table 2
about farmer’s characteristics demonstrate that household size is statistically significant (p < 0.01)
between CA adopters and non-adopters and trained versus untrained farmers but not between
participants of the two agroecological zones (savannah and forest). CA adopters and trained
farmers have larger (11 members) average household size than CA non-adopters and untrained
farmers (9 members), respectively. This agrees with the CRS (2015) conclusion about CA adopters
and legitimize the presence of the factor household size in this research on CA adoption.
Instead of household size, Knowler and Bradshaw (2007) modeled “family labor” and
found it has positive influence on CA adoption. According to CRS (2015), in the research area,
“the farm operations are usually done using family rather than hired labor” (p.17). So, a higher

46
household size increases the potential labor resource. In Table 2, clustering the research
participants, the statistical difference noted for household size implies CA adopters and trained
farmers have potentially more labor than CA non-adopters and untrained farmers, respectively.
Mango et al. (2017) observed similarity in household size between CA adopters and non-adopters
in Zimbabwe, Malawi, and Mozambique. In Zimbabwe, where “family members are the main
sources of labor in rural areas” (p.1644), among cotton farmers, CA adopters tend to have 6–10
members in their household (Mavunganidze et al., 2013), which is a little bit less than the 11 found
in Maniema. In South Africa, Ntshangase et al. (2018) claimed that larger households influence
CA adoption, but members need to be “economically active,” meaning they provide farm labor a
view shared by Mamkwe (2013), who found that household size did not affect CA adoption in
Tanzania. Finally, besides its lack of influence, household size remains an important factor to
observe in modeling CA adoption not only because it is correlated with labor but also because it
may lead to more research on how household active and non-active members affect CA adoption.
Female non-married
Female non-married has a robust and negative statistical significance (p < 0.01) influence
on CA adoption across all models except model (4), where it is not statistically significant as
presented in Table 5. Model (1) in Table 5 indicates a non-married female farmer is 41.4% less
likely to adopt CA. Table 5 also says that a single woman farmer is 29.9% less likely to adopt CA
in model (2), 38.8% in model (3), 41.6% in model (5), and 34.6% in model (8). Chi-square results
in Table 2 also show that, as a farmer characteristic, female non-married is statistically different
(p < 0.05) between CA adopters and non-adopters and farmers in the savannah versus the forest.
Almost 18% of farmers who did not adopt CA are female non-married, and 15% female non-
married live in the forest versus 4% in the savannah.

47
The CRS targeting strategy in the implementation of the NTA project was to prioritize
“female headed households” (CRS, 2009, p.8) while giving particular attention to vulnerable
women (widows, single-women, or separated/divorced due to consequences of DRC conflicts and
poverty). Female non-married includes CRS-targeted vulnerable women farmers. In Maniema
province, where 60% women are involved in agriculture as reported by the DHS (2014), the
vulnerability of women is a result of many issues such as poverty, a weak healthcare system, low
education, bad governance, and consequences of conflicts. While assessing gender roles within
farmers’ communities in the NTA project targeted area, CRS (2009) highlighted two issues faced
by women: “the volume of work allocated to women on a daily basis, and the weak involvement
of women in decisions concerning the management of household resources” (p.4). With all this in
mind, the finding that female non-married farmers are less likely to adopt CA can provide
important information on how to possibly reprioritize their approach to getting vulnerable women
to adopt CA. It appears that the current approach was not effective (relative to getting married
females and men to adopt), and as such, a new strategy could be undertaken. In a CA adoption
study, Mamkwe (2013) noted that, in Tanzania, “widows, divorcees and unmarried women have
limited access to land.” The consequence of land shortage is a lower CA adoption by women
farmers (Mamkwe, 2013). There must be gender challenges, customs, and beliefs that interact with
CA adoption in farmers’ communities when a farmer happens to be female non-married. In
Malawi, Ward, Bell, Droppelmann, and Benton (2018) reported how CA adoption is more likely
to happen when there are more women than men in a farmer’s household. This supports including
exogenous factors related to culture, gender, and land management in a region as drivers of CA in
Sub-Saharan Africa.

48
Literacy
As shown in Table 5, literacy is robustly insignificant (p > 0.10) across all models. As a
result of modeling (see Table A.1), that literacy does not appear to affect CA adoption. However,
in Table 2 about farmers’ characteristics, using Chi-square test, literacy is statistically different (p
< 0.10) between participants located in the forest and those who are located in the savannah.
Eighty-eight percent of farmers in the forest are literate versus 80% in the savannah. Between CA
adopters and non-adopters or trained and untrained farmers, literacy is not significant (p > 0.10).
CRS (2015) also reported that “there was no significant association between CA adopters and the
level of education” (p.14).
Education and knowledge should play a positive role in the decision to adopt CA, but
studies show not only positive but also negative and neutral influence on CA adoption (Knowler
& Bradshaw, 2007). While in Lesotho, Malawi, South Africa, and Zimbabwe, education positively
influences CA adoption (Bisangwa, 2013; Chisenga, 2015; Ntshangase et al., 2018; Mavunganidze
et al.,2013), in Tanzania, it is insignificant (Mamkwe, 2013). The findings show that for a farmer
in the research area, being able to read and write does not motivate him to adopt or not adopt CA.
Perhaps the educated farmers in the forest are more interested in other livelihood opportunities and
not farming. The number of literate farmers in the forest appears to be higher than the savannah,
but farmers in the forest are less likely to adopt CA. Opportunities provided by the forest may have
a certain relationship with farmers’ education.
Training
If the producer had been formally trained (a dummy variable) was only included in models
(1) to (5). As shown in Table 5, training is robust and statistically significant (p < 0.01) on CA
adoption across all five models. Model (1) in Table 5 indicates that a farmer is 51.6% more likely

49
to adopt CA if he/she has received CA training from the NTA project. Also in Table 5, the positive
influence of training increases the likelihood of adoption of CA by 67.1% in model (2), 74.5% in
model (3), 52.1% in model (4), and 69.0% in model (5). Table 2 also illustrates that training is not
the same for CA adopters and non-adopters and the two agroecological zones. There are 17% more
untrained than trained farmers, the majority of trained farmers live in the forest (85%), and 96%
of CA adopters have been trained by the NTA project.
These results, with regard to training, are consistent with Bisangwa (2013) and Ntshangase
et al. (2018), who demonstrated that CA training positively influenced CA adoption in Lesotho
and South Africa, respectively. A similar result is also reported by Chisenga (2015), who claimed
that, in Malawi, “access to farmer training on CA” has a positive influence on CA adoption. This
research is case-specific as there are CA adopters who were not trained and CA non-adopters who
were trained, but also, literacy does not matter for both trained and untrained farmers. This
practically suggests there must be many lessons learned from NTA project field experience about
promotion and education about CA.
Benefits perceived from CA adoption
“Farmers are consumers of the products of agricultural research, and their subjective
preferences for characteristics of new agricultural technologies affect their adoption decisions”
(Adesina & Baidu-Forson, 1995). For the smallholders’ farmers in the Maniema province, CA is
a new practice in their milieu. The first part of this research explored various factors influencing
CA adoption. In this second part, this study estimates the perceived benefits of adopting CA. The
research hypothesis is that the willingness to adopt CA is motivated by the way farmers perceive
the benefits they derive from this technology. As a result of good perception about CA, there could
be more room for CA dissemination in rural communities.

50
For the purpose of this study, ordered logit regression was used to model smallholders’
farmers’ perception. The perception of CA benefits was assessed looking at CA adoption,
including the impact of geographical context, and the impact of CA training. Three kinds of
benefits are modeled here: reliability of income, area under CA, and food security status. For each
of these benefits, five ordered logit models are estimated. The full-sample ordered logit model
(model (a)) uses all the observations (225) and has adopt and savannah as regressors. The forest
ordered logit model (model (b)) and the savannah ordered logit model (model (c)) are two models,
each with one regressor (adopt) and for which the observations are segmented based on
agroecological zones, respectively, forest and savannah. The trained ordered logit model (model
(d)) and the untrained ordered logit model (model (e)) each has two regressors (adopt and
savannah), and the observations are segmented based on CA training into a subsample for trained
farmers and a subsample for untrained farmers, respectively.
Reliability of income from CA
The marginal effects on how smallholders’ farmers perceived income reliability as a CA
benefit are presented in Table 6 below.
Model (a) in Table 6 shows clearly that agroecological context (being in the savannah or
the forest) does not affect significantly (p > 0.10) farmers’ perception of a reliable income as a
result of applying CA. However, CA adoption significantly impacts these farmers’ perception. The
four levels of preferences for a reliable income from CA are highly significant (p < 0.01), with
negative effect for the three lower levels (“not reliable,” “less reliable,” and “somehow reliable”)
and positive effect for the highest level (“very reliable”). Table 6 implies CA adopters’ probability
of perceiving very reliable income rises by 0.41 relative to non-adopters. Table 6 shows that CA
adopters’ probability of getting “somehow reliable,” “less reliable,” and “not reliable” income

51
decreases, respectively, by 0.085, 0.102, and 0.223 compared to non-adopters. In terms of
preference for a reliable income from CA, it appears that smallholders’ farmers in the research
area are really demanding. They perceive the decision to adopt CA despite the agroecological
location as leading to a better income. For smallholders’ farmers, obtaining a high income due to
CA adoption should be a great incentive for the promotion and the dissemination of CA in the
DRC.
Table 7. Marginal effects on reliability of income from CA.
Dependent variable: Reliability of income from CA
Models
Not reliable
at all
Less
reliable
Somehow
reliable
Very
reliable
(a) Full sample Adopt -0.223***
(0.052)
-0.102***
(0.029)
-0.085**
(0.025)
0.410***
(0.063)
Savannah -0.006
(0.027)
-0.004
(0.017)
-0.006
(0.024)
0.016
(0.068)
(b) Forest region Adopt -0.196**
(0.060)
-0.078**
(0.029)
-0.095**
(0.033)
0.368***
(0.080)
(c) Savannah region Adopt -0.289**
(0.092)
-0.146*
(0.060)
-0.055
(0.041)
0.490***
(0.101)
(d) Trained farmers Adopt -0.008
(0.014)
-0.019
(0.031)
-0.037
(0.057)
0.064
(0.101)
Savannah -0.012
(0.009)
-0.029
(0.021)
-0.062
(0.044)
0.103
(0.072)
(e) Untrained
farmers
Adopt -0.332*
(0.162)
-0.015
(0.038)
0.033
(0.032)
0.314
(0.201)
Savannah -0.164
(0.149)
0.015
(0.020)
0.034
(0.035)
0.115
(0.105)
Note:
• Significance codes ‘***’ 0.001 ‘**’ 0.01 ‘*’ 0.05 ‘.’ 0.1 ‘ ’ 1
• The marginal effects in this table derived from regression models in Table A3. (see
Appendix)

52
Model (b) in Table 6 illustrates how, in the forest, CA adoption itself impacts farmers’
perception of a reliable income. The four preference levels for a reliable income from CA are
highly significant (p < 0.01), with negative effects for the three lower levels (“not reliable,” “less
reliable,” and “somehow reliable”) and a positive effect for the highest level (“very reliable”).
Model (b) says CA adopters’ probability of perceiving “very reliable” income rises by 0.37 relative
to non-adopters. In the same table, model (b) shows CA adopters’ probability of getting a
“somehow reliable,” “less reliable,” and “not reliable” income decreases, respectively, by 0.095,
0.078, and 0.196 compared to non-adopters. The magnitude of smallholders’ farmers’ preferences
for reliable income as they choose to adopt CA in model (b) is consistent with the results of model
(a). This model makes it clear that farmers’ preference in the forest focuses on the highest utility
level.
Model (c) in Table 6 illustrates how in the savannah, CA adoption impacts farmers’
perception of a reliable income as a result of applying CA. Three levels of preferences for a reliable
income from CA are highly significant (p < 0.01), with negative effect on the two lower levels
(“not reliable,” and “less reliable”) and positive effect for the highest level (“very reliable”). Model
(c) says CA adopters’ probability of perceiving “very reliable” income rises by 0.49 relative to
non-adopters. In the same table, model (c) shows CA adopters’ probability of getting “less
reliable” and “not reliable” income decreases, respectively, by 0.146 and 0.289 compared to non-
adopters. Having a “somehow reliable” income is insignificant. In terms of preference for a reliable
income from CA, smallholders’ farmers in the savannah show that they trust more in CA than their
forest counterpart (see model (b)) and even more than the average farmer of the research area.
Their choice for the best utility level must have been guided by a successful CA experience. Access
to a high income by adopting CA adoption help encourage CA in the savannah.

53
Models (d) and (e) in Table 6 result from segmenting the sample dataset in a group of
trained farmers and a group of untrained farmers, respectively. The two models provide little
information on how both CA adoption and agroecological context affect farmers’ perception of a
reliable income as a result of applying CA. However, model (e) indicates CA adopters’ probability
of perceiving a “not reliable at all” income among untrained farmers decreases by 0.33 relative to
non-adopters. This negative effect, however, favors the promotion of CA in the area, as it shows
there are farmers, especially among the “untrained,” who adopt CA even though they do not
perceive a reliable income benefit. The negative influence among untrained farmers should draw
CA promoters’ attention to how CA training is being implemented. There is a need to assess locally
and understand reasons behind untrained farmers’ choice.
Land under CA
The marginal effects on how smallholders’ farmers perceived the increase of farmland
under CA as a CA benefit are presented in Table 7 below.
The way smallholders’ farmers’ perceptions about the land under CA was modeled appears
not to illustrate any significance (p > 0.10) with models (a) to (d) in Table 7. However, model (e),
which provided untrained farmers’ perception, displays a statistical significance (p < 0.10),
especially due to CA adoption. Model (e) in Table 7 says, among untrained farmers and despite
their agroecological zone, CA adopters’ probability of perceiving “increased” land under CA rises
by 0.48 relative to non-adopters, and CA adopters’ probability of perceiving “decreased” land
under CA goes down by 0.30 relative to non-adopters. These results illustrate that untrained CA
adopters implicitly admit applying CA on their farms. Untrained farmers’ preference can also be
interpreted as CA adoption is decreasing slash-and-burn practice, which would be potentially a
socioenvironmental community benefit.

54
Table 8. Marginal effects on land under CA.
Dependent variable: Land under CA
Models decreased static increased
(a) Full sample Adopt -0.091
(0.090)
0.014
(0.023)
0.077
(0.068)
Savannah -0.040
(0.064)
0.003
(0.006)
0.037
(0.060)
(b) Forest region Adopt -0.154
(0.105)
0.037
(0.041)
0.117
(0.070)
(c) Savannah region Adopt 0.076
(0.147)
0.007
(0.033)
-0.083
(0.178)
(d) Trained farmers Adopt -0.081
(0.104)
0.013
(0.025)
0.067
(0.080)
Savannah -0.022
(0.069)
0.002
(0.006)
0.021
(0.063)
(e) Untrained
farmers
Adopt -0.297 .
(0.155)
-0.186
(0.287) 0.483 .
(0.262)
Savannah -0.068
(0.158)
-0.036
(0.080)
0.105
(0.221)
Note:
• Significance codes ‘***’ 0.001 ‘**’ 0.01 ‘*’ 0.05 ‘.’ 0.1 ‘ ’ 1
• The marginal effects in this table derived from regression models in Table A4. (see
Appendix)
Food security status
The marginal effects on how smallholders’ farmers perceived their food security status as
a CA benefit are presented in Table 8 below.
Model (a) in Table 8 illustrates how both agroecological context (being in the savannah or
the forest) and CA adoption impact smallholders’ farmers perception of their own food security.
The three ways respondents rated their food security is highly statistically significant (p < 0.01)

55
for CA adoption and statistically significant (p < 0.05) in the two agroecological zones. Model (a)
in Table 8 says CA adopters’ probability of perceiving “increased” food security status rises by
0.43 for those living in the savannah and 0.27 in the forest relative to non-adopters. However, the
CA adopters’ probability of perceiving “static” food security status decreases by 0.16 in the
savannah and 0.09 in the forest, and “decreased” food security status decreases by 0.27 in the
savannah and 0.18 in the forest. Farmers’ preference levels of their food security status are
motivated by CA adoption and agroecological context. In terms of impact, model (a) confirms
CRS’ (2015) claim about “improving food security” as a CA adoption incentive and even goes
beyond that by providing an agroecological-based influence of CA. Behind CA adoption decisions,
farmers show they want better food security.
Model (b) in Table 8 illustrates how in the forest CA adoption impacts farmers’ perception
of their own food security status as a result of applying CA. The three levels of the food security
responses are statistically significant (p < 0.10). In Table 8, model (b) implies in the forest CA
adopters’ probability of perceiving “increased” food security status rises by 0.26 relative to non-
adopters. However, the CA adopters’ probability of perceiving “static” and “decreased” food
security status decreases by 0.05 and 0.21, respectively. In the forest region of the research area,
model (b) confirms that farmers believe that their decision to adopt CA leads to a better food
security status.
Model (c) in Table 8 illustrates how CA adoption in the savannah impacts farmers’
perception of their own food security status as a result of applying CA. The three levels of the food
security responses are statistically significant (p < 0.05). In Table 8, model (c) implies CA
adopters’ probability of perceiving “increased” food security status in the savannah rises by 0.26
relative to non-adopters. However, the CA adopters’ probability of perceiving “static” and

56
“decreased” food security status decreases by 0.10 and 0.16, respectively. In the savannah region,
model (c) confirms that farmers believe their decision to adopt CA leads to a better food security
status. Farmers’ opinion about “increased” food security given by model (c) for the savannah is
consistent with what model (b) says for the forest, with a slightly higher magnitude, and confirms
the overall preference given by model (a).
Table 9. Marginal effects on food security status.
Dependent variable: Food security status
Models decreased static increased
(a) Full sample Adopt -0.179***
(0.047)
-0.086**
(0.028)
0.265***
(0.061)
Savannah -0.088*
(0.036)
-0.072*
(0.034)
0.160*
(0.065)
(b) Forest region Adopt -0.205**
(0.067) -0.051 .
(0.031)
0.256***
(0.069)
(c) Savannah region Adopt -0.158*
(0.076)
-0.099*
(0.042)
0.257*
(0.108)
(d) Trained farmers Adopt -0.110 .
(0.067)
-0.070*
(0.029)
0.180*
(0.091)
Savannah -0.086*
(0.038)
-0.086*
(0.043)
0.172*
(0.077)
(e) Untrained
farmers
Adopt -0.181
(0.112)
-0.063
(0.135)
0.244
(0.225)
Savannah -0.240 .
(0.130)
0.033
(0.072)
0.207*
(0.100)
Note:
• Significance codes ‘***’ 0.001 ‘**’ 0.01 ‘*’ 0.05 ‘.’ 0.1 ‘ ’ 1
• The marginal effects in this table derived from regression models in Table A5. (see
Appendix)

57
Model (d) in Table 8 illustrates how trained farmers perceive their own food security status
as a result of CA adoption in the two agroecological zones of the research area. The three ways
respondents appreciated their food security is statistically significant (p < 0.10) for CA adoption
and the two agroecological zones (p < 0.05). Model (d) in Table 8 says, among trained farmers,
CA adopters’ probability of perceiving “increased” food security status rises by 0.35 for those
living in the savannah and 0.18 in the forest relative to non-adopters. However, the CA adopters’
probability of perceiving “static” food security status for the same group of untrained farmers
decreases by 0.16 in the savannah and 0.07 in the forest, and “decreased” food security status
decreases by 0.20 in the savannah and 0.11 in the forest. Even though the coefficients in model (d)
are lower than those in model (a), the main results are consistent and have the same pattern for
both models. In order words, trained farmers in each of the two agroecological zones believe their
food security gets better as they adopt CA.
Model (e) in Table 8 shows how untrained farmers perceive their own food security status
as a result of CA adoption in the two agroecological zones of the research area. The three ways
respondents perceive their food security is not significant at all (p > 0.10) for CA adoption, but
there is a statistical significance (p < 0.10) for the two agroecological zones. In Table 8, Model (e)
suggests that among untrained farmers living in the savannah, CA adopters’ probability of
perceiving “increased” food security status rises by 0.21 relative to non-adopters, while the
probability of perceiving “decreased” food security status goes down by 0.24. It appears untrained
farmers’ food security preference is more guided by other factors, such as agroecological context,
and less by CA adoption. However, model (e) confirms that untrained farmers in the savannah may
also think that CA adoption contributes to a better food security status.

58
Conclusion
The DRC’s abundance of natural resources is not reflected in its people’s well-being and
the country’s overall economic performance. Despite multiple challenges, both endogenous and
exogenous, the agriculture sector in the DRC has the potential to make an economic difference
both at the micro (household level) and macro (economy-wide level), and could be able to play a
significant role in the country’s growth and development. Poverty and food insecurity, which are
not mutually exclusive but complementary issues, have been constant in the DRC since
independence due to periods of civil and economic instability in a country where agriculture is the
main activity for 70% people. Although women are at the forefront of agriculture in the DRC, they
have faced heavy social and economic pressures. Given the effects of war and political instability,
many women have lost husbands and now face the real danger of domestic and sexual violence as
they have to travel further and further away from their villages to find fertile land. Furthermore,
because of the long-standing practice of slash-and-burn agriculture, women who are now heading
households must undertake large amounts of heavy labor practices to provide food for their
families. These two factors (slash-and-burn and traveling far distances) are endogenous, as women
must travel further to find new land to slash-and-burn and doing so leaves them more vulnerable
to domestic violence as they must go further from their villages to farm.
In an effort to assist these vulnerable women, this study analyzed the innovative CA
practice promoted by the CRS’ NTA project in the province of Maniema in the DRC. The NTA
project set out to teach the community to practice CA, which could reduce the need for slash-and-
burn and enhance the use of fallows and old farmlands, as doing so could ensure women can farm
close to their homes. Thus, CA could reduce both labor requirements as well as situations where
women are made more vulnerable by having to travel long distances to provide food for their

59
families. This study explored CA adoption in smallholder farmers’ communities, while focusing
on vulnerable women involved in the agriculture sector. To do this, this study used actual data
from CRS to estimate the drivers of adoption of CA and the benefits obtained by those who
adopted. The models included factors related to spatial differences, being a member of a farmers’
group, having accessed credit, and if the farmer was formally trained in CA.
After a selection process that involved stepwise regression analysis, a total of ten variables
were chosen from the CRS dataset to estimate the drivers of adoption. The ten variables (factors)
are agroecological zones (savannah and forest), villages (Enombe – Brigade, Enombe – Sakina,
Kamonga, Kampala, Kauta, Kimanga, Kionga, Lubangwana, Lubelenge, Lukongo, and Nyoka),
age, farm size, accessed credit, farmers’ group, household size, female non-married, literacy, and
training. Binary logit models were estimated to explore the relationship of these factors with CA
adoption. The results of modeling CA adoption eight different ways looking at the full sample,
agroecological and location context, and the impact of training provided by the CRS’ project
suggested that the fact of being in the savannah or in the forest, accessing credit, being member of
a farmers’ group, and receiving training had a positive influence on CA adoption, while being a
female non-married farmer or living in certain villages had a negative influence on CA adoption.
These five variables are the key factors that drove adoption of CA in the territories of Kasongo
and Kailo in the province of Maniema, and there is a village-level influence that makes results
more specific. The other factors—age, household size, farm size, and literacy—did not show a
statistical influence but kept their important place in modeling because of their variability among
CA adopters and non-adopters, trained and untrained farmers, and farmers living in the savannah
versus the forest for three of them (household size, farm size and literacy).

60
This study focused on vulnerable women farmers, CRS’ targeted group in the
implementation of the NTA project. A close look at the criteria of vulnerability among women
farmers led this study to group the most vulnerable subgroups of widows, single mothers, and
divorced under “female non-married.” The factor “female non-married” reduces the probability of
adopting CA. In other words, female, non-married farmers tend to reject CA as shown by the
results of CA adoption modeling. CRS could use these results as a stepping stone for future
projects. These results are not to say that the project failed at reaching and helping vulnerable
women, only that they were less likely to adopt CA than less-vulnerable women. From this study’s
findings, targeting vulnerable women who are part of a farmers’ group or who also have accessed
credit may increase the number of vulnerable women who would adopt CA in the future. Future
studies may want to assess the challenges surrounding women farmers’ vulnerability with regards
to local customs and traditions. It is likely cultural aspects (such as customs and local beliefs), lack
of opportunities, poverty, and other DRC internal issues may have affected farmers differently and
were more disruptive for female non-married farmers.
This study approached the exploration of CA benefits in terms of farmers’ perception of
specific gains that resulted from CA. Farmers’ perception is subjective and, in the area of
agricultural technologies, it has been studied by Adesina and Zinnah (1993) and Adesina and
Baidu-Forson (1995) in West Africa, amongst others. Maniema smallholders’ farmers’ perception
was approached as a categorical but ordered response and used their view on income reliability,
food security status, and CA farmland expansion. The results of ordered logit modeling suggest
that farmers perceive CA adoption as strongly playing a positive role on their income reliability.
Similarly, the adoption of CA led to an increased perception of farmers’ food security. Finally, it
appeared that untrained farmers chose to adopt CA even though they do not positively appreciate

61
CA adoption influence on their income reliability and food security. These findings show farmers’
subjective views on income reliability and food security need to be included in a modeling process
that explores farmers’ incentives to adopt CA.
This study has isolated factors that drive CA adoption in the DRC and presented the
perceived benefits of those who adopted CA. CA as a solution to improving crop productivity is
new to the DRC, but as climate-smart agriculture practice, it could help mitigate climate change
via a reduction in slash-and-burn agricultural practices. This study is the first of its kind in that it
uses primary CA field data from the DRC and provides policy-makers, donors, development
agencies, and those who are designing and implementing agricultural enhancement programs in
the rural DRC important information on the following:
• Targeting more specific vulnerable farmers may not yield a strong CA adoption
response. Female, non-married farmers were less likely to adopt CA than male or
married counterparts, although they were specifically targeted. However, since we do
not know their adoption rate prior to the NTA project, we cannot say with any certainty
how effective the program truly was at increasing the adoption rate relative to males or
married farmers.
• If adoption by vulnerable farmers is the goal, an alternative education and gender
strategy may need to be explored. There is a need to explore more about challenges and
opportunities of empowering women in agriculture from their cultural and contextual
perspectives.
• Regions, in terms of agroecological zones, are different contexts. Future work may want
to target specific agricultural zones as CA adoption varied with locations. Future

62
research should focus on more localized factors that influence CA adoption even within
communities.
• Participation in farmers’ groups was related to greater CA adoption, especially in the
forest area, suggesting that great farmer cohesion could lead to more adoption.
• Those producers with accessed credit had a higher a CA adoption rate than those who
did not. A CA program should plan to use accessing credit options to increase CA
adoption in poor farmers’ communities.
• Perceived reliable income and food security due to CA are key incentives to adopt CA.
Farmers’ decision to adopt seems to be motivated by a clear purpose for their well-being.
This work should be viewed as the first step to a more holistically sustainable agricultural
approach to subsistence farming in the DRC. The results of this study provide future CA projects
with important information on what the drivers of adoption are and what the perceived benefits of
adoption are assumed to be. From these two important pieces of information, future research and
CA projects can more precisely focus on specific groups of producers in the DRC based on
location, gender, and other social characteristics to both increase adoption of CA and market the
specific benefits producers are looking for more efficiently. This study is part of a large social and
economic puzzle the DRC faces, but results from this study can start putting pieces of that puzzle
together to help future problem solvers.

63
References
Adesina, A. A., & Baidu-Forson, J. (1995). Farmers' perceptions and adoption of new
agricultural technology: Evidence from analysis in Burkina Faso and Guinea, West
Africa. Agricultural Economics, 13(1), 1-9. Retrieved from
https://www.sciencedirect.com/science/article/pii/0169515095011428
Adesina, A. A., & Zinnah, M. M. (1993). Technology characteristics, farmers' perceptions and
adoption decisions: A tobit model application in Sierra Leone. Agricutlural Economics,
9(4), 297-311. Retrieved from
https://www.sciencedirect.com/science/article/pii/0169515093900199
AfDB. (2013). Democratic Republic of the Congo : 2013 - 2017 Country Strategy Paper. AfDB.
Retrieved from https://www.afdb.org/fileadmin/uploads/afdb/Documents/Project-and-
Operations/Democratic%20Republic%20of%20Congo%20-%202013-2017%20-
%20Country%20Strategy%20Paper.pdf
Akakpo, K., Randriamamonjy, J., & Ulimwengu, J. (2014). Comprehensive Food Security and
Vulnerability Analysis (CFSVA) - Democratic Republic of the Congo. Rome, Italy: World
Food Program. Retrieved from https://www.wfp.org/content/democratic-republic-congo-
comprehensive-food-security-vulnerability-analysis-january-2014
Akitoby, B., & Cinyabuguma, M. (2004). Sources of growth in the Democratic Republic of the
Congo: A cointegration approach. IMF Working Paper, 114. Retrieved from
https://www.imf.org/external/pubs/ft/wp/2004/wp04114.pdf
BCC. (2017). Rapport Annuel 2016. Kinshasa, DRC: BCC.
Bisangwa, E. (2013). The Influence of Conservation Agriculture adoption on input demand and
maize production in Butha Buthe, Lesotho. University of Tennessee. Retrieved from
http://trace.tennessee.edu/utk_gradthes/2391/
Branca, G., McCarthy, N., Lipper, L., & Jolejole, M. C. (2011). Climate-smart agriculture: A
synthesis of empirical evidence of food security and mitigation benefits from improved
cropland management. Rome, Italy: FAO. Retrieved from http://agris.fao.org/agris-
search/search.do?recordID=XF2006449707
Brouder, S. M., & Gomez-Mcpherson, H. (2014). The impact of Conservation Agriculture on
smallholder agricultural yields: A scoping review of the evidence. Agriculture,
Ecosystems and Environment, 11-32.
CA Group at Cornell University . (2015). About CA. Retrieved March 6, 2018, from
Conservation Agriculture : Global Research and Resources:
http://mulch.mannlib.cornell.edu/index.html
Cameron, A. C., & Trivedi, P. K. (2005). Microeconometrics: Methods and applications.
Cambridge University Press.

64
Caroll, N. (2017). oglmx: Estimation of Ordered Generalized Linear Models. Retrieved from
https://CRAN.R-project.org/package=oglmx
Chisenga, C. M. (2015). Socio-economic factors associated with the adoption of Conservation
Agriculture among women farmers in Balaka District, Malawi. Purdue University.
Retrieved from https://docs.lib.purdue.edu/dissertations/AAI1597607/
Corbeels, M., De Graaff, J., Ndah, T. H., Penot, E., Baudron, F., Naudin, K., & ... Adolwa, I. S.
(2014). Understanding the impact and adoption of Conservation Agriculture in Africa: A
multi-scale analysis. Agriculture, Ecosystems and Environment, 155-170.
CRS. (2009). Kulima Pasipo Kutipula Udongo - Improving agricultural productivity through no-
tillage agriculture in Maniema province, Democratic Republic of the Congo. Kinshasa,
DRC (in the author’s possession): CRS.
CRS. (2012). No-tillage agriculture in Kailo, Kasongo, and Kabambare territories of Maniema -
Final evaluation report. Kinshasa, DRC (in the author’s possession): CRS.
CRS. (2015). No-tillage agriculture in Kailo, Kasongo and Kabambare territories of Maniema -
Ex post evaluation report. Kinshasa, DRC (in the author’s possession): CRS.
Derpsch, R. (2007). Extent of Conservation Agriculture adoption worldwide: Implications and
impact. Rome: FAO. Retrieved from http://www.fao.org/ag/ca/es/6c.html
Derpsch, R., Friedrich, T., Kassam, A. H., & Hongwen, L. (2010). Current status of adoption of
no-tillage farming in the world and some of its main benefits. International Journal of
Agricultural and Biological Engineering, 3(1), 1-25. Retrieved from
https://ijabe.org/index.php/ijabe/article/view/223
FAO. (2018). Conservation Agriculture - Overview. Retrieved March 06, 2018, from Food and
Agriculture Organization of the United Nations: http://www.fao.org/conservation-
agriculture/overview/what-is-conservation-agriculture/en/
FEWSNET. (2015). Democratic Republic of the Congo: Staple food market fundamentals.
Washington, DC: USAID. Retrieved from http://fews.net/southern-africa/democratic-
republic-congo/markets-trade/october-2015
FEWSNET. (2016). Consolidated report on the livelihood zones of the Democratic Republic of
the Congo. SADC - USAID. Retrieved from http://fews.net/southern-africa/democratic-
republic-congo/livelihood-description/december-2017-0
Friedrich, T., & Kienzle, J. (2008). Conservation Agriculture: Impact on farmers’ livelihoods,
labour, mechanization and equipment. Damascus, Syria.
Gates, B. &. (2015, January). GatesNotes - 2015 Gates Annual Letters. Retrieved from Our big
bet for the future: https://www.gatesnotes.com/2015-annual-letter?page=0&lang=en
Gelman, A., & Hill, J. (2007). Data analysis using regression and multilevel / hierarchical
models. Cambridge University Press.

65
Giller, K. E., Corbeels, M., Nyamangara, J., Triomphe, B., Affholder, F., Scopel, E., & Tittonell,
P. (2011). A research agenda to explore the role of conservation agriculture in African
smallholder farming systems. Field Crops Research, 468-472.
Giller, K. E., Witter, E., Corbeels, M., & Tittonell, P. (2009). Conservation Agriculture and
smallholder farming in Africa: The heretics' view. Field Crop Research, 23-34.
Grabowski, P. P. (2015). Promotion and adoption of Conservation Agriculture in Mozambique
and Zambia. Michigan State University. Retrieved from https://d.lib.msu.edu/etd/3360
Greene, W. H. (2012). Econometric analysis (7th ed.). Pearson.
Herderschee, J., Kaiser, K.-A., & Mukoko Samba, D. (2012). Resilience of an African giant:
Boosting growth and development in the Democratic Republic of the Congo. Washington,
DC: World Bank.
Hlavac, M. (2018). stargazer: Well-Formatted Regression and Summary Statistics Tables.
Bratislava, Slovakia: Central European Labour Studies Institute (CELSI). Retrieved from
https://CRAN.R-project.org/package=stargazer
Kassam, A. H., Friedrich, T., Shaxson, F., & Pretty, J. (2009). The spread of Conservation
Agriculture: Justification, sustainability and uptake. International Journal of Agricultural
Sustainability, 7(4), 292-320. Retrieved from
https://www.tandfonline.com/doi/abs/10.3763/ijas.2009.0477
Kassam, A. H., Mkomwa, S., & Friedrich, T. (2017). Conservation Agricutlure for Africa:
Building resilient farming systems in a changing climate. London, UK: CABI.
Knowler, D., & Bradshaw, B. (2007). Farmers' adoption of Conservation Agriculture: A review
and synthesis of recent research. Food Policy, 32(1), 25-48. Retrieved from
https://www.sciencedirect.com/science/article/pii/S0306919206000224
Lalani, B., Dorward, P., & Holloway, G. (2017). Farm-level economic analysis - Is Conservation
Agriculture helping the poor? Ecological Economics, 141, 144-153. Retrieved from
https://www.sciencedirect.com/science/article/pii/S0921800917301787
Lalani, B., Dorward, P., Kassam, A. H., & Dambiro, J. (2017). Innovation systems and farmer
perceptions regarding Conservation Agriculture in Cabo Delgado, Mozambique. In A. H.
Kassam, S. Mkomwa, & T. Friedrich, Conservation Agriculture for Africa: Building
resilient farming systems in a changing climate (pp. 100-126). London, UK: CABI.
Lee, D. (2005). Agricultural sustainability and technology adoption: Issues and policies for
developing countries. American Journal of Agricultural Economics, 87(5), 1325-1334.
Retrieved from https://www.jstor.org/stable/3697714?seq=1#page_scan_tab_contents
Liu, H., & Huang, Q. (2013). Adoption and continued use of contour cultivation in the highlands
of Southwest China. Ecological Economics, 91, 28 - 37.

66
Mamkwe, L. G. (2013). Factors influencing adoption of Conservation Agriculture in South
Uluguru Mountains in Morogoro region, Tanzania. Sokoine University of Agriculture.
Retrieved from http://suaire.suanet.ac.tz:8080/xmlui/handle/123456789/498
MANAGE. (2016). Demand analysis report - Democratic Republic of the Congo. Hyderabad,
India: MANAGE - USAID.
Mango, N., Siziba, S., & Makate, C. (2017). The impact of adoption of Conservation Agriculture
on smallholder farmers' food security in semi-arid zones of southern Africa. Agriculture
& Food Security, 6(32), 1-8. Retrieved from
https://agricultureandfoodsecurity.biomedcentral.com/articles/10.1186/s40066-017-0109-
5
Mavunganidze, Z., Madakadze, I. C., Mutenje, M. J., & Nyamangara, J. (2013). Factors affecting
the choice of conservation agriculture practices adopted by smallholder cotton farmers in
Zimbabwe. African Journal of Agricultural Research, 8(17), 1641-1649. Retrieved from
https://repository.up.ac.za/handle/2263/40546
MINAGR. (2010). Programme National de Securite Alimentaire. Kinshasa, DRC: MINAGR.
MINAGR. (2013). Plan National d'Investissement Agricole (PNIA) 2013 - 2020. Kinshasa,
DRC: MINAGR.
MINPLAN, & IMF. (2013). Democratic Republic of the Congo: Poverty Reduction Strategy
Paper. Washington, DC: IMF. Retrieved from
https://www.imf.org/external/pubs/ft/scr/2013/cr13226.pdf
MINPLAN, MSP, & ICF International. (2014). Enquete Demographique et de Sante en
Republique Democratique du Congo 2013 - 2014. Rockville, MA: MINPLAN, MSP and
ICF International.
Mkomwa, S., Kassam, A. H., Friedrich, T., & Shula, R. K. (2017). Conservation Agriculture in
Africa: An overview. In S. Mkomwa, A. H. Kassam, & T. Friedrich, Conservation
Agriculture for Africa: Building resilient farming systems in a changing climate (pp. 1-9).
London, UK: CABI.
Mlenga, D. H., & Maseko, S. (2015). Factors influencing adoption of Conservation Agriculture:
A case for increasing resilience to climate change and variability in Swaziland. Journal of
Environment and Earth Science, 5(22), 16-25. Retrieved from
http://www.academia.edu/20162787/Factors_Influencing_Adoption_of_Conservation_A
griculture_A_Case_for_Increasing_Resilience_to_Climate_Change_and_Variability_in_
Swaziland
Napoli, M. (2011). Towards a Food Insecurity Multidimensional Index (FIMI). Universita Degli
Studi Roma Tre. Retrieved from
http://www.fao.org/fileadmin/templates/ERP/uni/FIMI.pdf

67
NRC, & IDMC. (2017). DR Congo has world's highest number of people fleeing conflict
internally. Retrieved 04 06, 2018, from www.nrc.org: https://www.nrc.no/dr-congo-
crisis-sees-highest-global-internal-displacement
Ntshangase, N. L., Muroyiwa, B., & Sibanda, M. (2018, February). Farmers' perceptions and
Factors influencing adoption of no-till conservation agriculture by small-scale farmers in
Zashuke, Kwazulu-Natal Province. Sustainability, 10(555), 1-16. Retrieved from
http://www.mdpi.com/2071-1050/10/2/555
OCHA. (2018). Democratic Republic of the Congo. Retrieved from OCHA:
http://www.unocha.org/drc
Omasombo T., J., Nsanda B., L., Akilimali M., C., Kyaga, K. K., Omaka, T., Mpene N., Z., . . .
Laghmouch, M. (2011). Maniema : Espaces et Vies. Brussels, Belgium: Musee Royal de
l'Afrique Centrale (MRAC).
Otchia, C. S. (2014). Agricultural modernization, structural change and pro-poor growth: policy
options for the Democratic Republic of the Congo. Journal of Economics Structures, 3
(8), 1 - 43. Retrieved from
https://journalofeconomicstructures.springeropen.com/articles/10.1186/s40008-014-
0008-x
Palm, C., Blanco-Canqui, H., DeClerk, F., Gatere, L., & Grace, P. (2014). Conservation
Agriculture and ecosystem services: An overview. Agriculture, Ecosystems and
Environment, 87-105.
Posthumus, H., Pound, N., Andrieu, N., & Triomphe, B. (2011). Enhancing adoption of
conservation agriculture practices throught co-innovation platforms in Sub-Saharan
Africa. Resilient Food Systems for a Changing World. 5th World Congress Conservation
Agriculture and 3rd Farming Systems Design Conference. Brisbane, Australia.
Reyntjens, F. (2009). The Great African War: Congo and Regional Geopolitics, 1996 - 2006.
New York, NY: Cambridge University Press.
RStudio Team. (2016). RStudio: Integrated Development for R. Boston, MA: RStudio, Inc.
Retrieved from http://www.rstudio.com/
Silici, L. (2009). The Role of social capital in the adoption and the performance of Conservation
Agriculture. The practice of Likoti in Lesotho. Universita Degli Studi Roma Tre.
Retrieved from
https://vtechworks.lib.vt.edu/bitstream/handle/10919/69130/4280_Silici_social_capital_a
nd_conservation_a.pdf?sequence=1
Sithole, N. J., Magwaza, L. S., & Mafongoya, P. L. (2016). Conservation Agriculture and its
impat on soil quality and maize yield: A South African perspective. Soil & Tillage
Research, 162, 55-67. Retrieved from
https://www.sciencedirect.com/science/article/pii/S0167198716300575

68
Smoes, T. (2012). Agricultural development in the Democratic Republic of the Congo. Global
Growing Casebook : Insight into African Agriculture, 66 - 85.
Sun, C. (2016). erer: Empirical Research in Economics with R. Retrieved from https://CRAN.R-
project.org/package=erer
Thierfelder, C., Bunderson, W. T., & Mupangwa, W. (2015). Evidence and lessons learned from
long-term on-farm research on Conservation Agriculture systems in communities in
Malawi and Zimbabwe. Environments, 2(3), 317-337. Retrieved from
http://www.mdpi.com/2076-3298/2/3/317
Tollens, E. (2003). L'Etat actuel de la securite alimentaire en R.D.Congo: Diagnostic et
Perspectives. Leuven: Departement d'Economie Agricole et de l'Environnement -
K.U.Leuven. Retrieved from http://www.agr.kuleuven.ac.be/aee/clo/wp/tollens2003a.pdf
Tollens, E. (2004). Les defis: Securite Alimentaire et Cultures de Rente pour l'Exportation -
Principales Orientations et Avantages Comparatifs de l'Agriculture en R.D.Congo.
Leuven: Katholieke Uniersiteit Leuven. Retrieved from
http://www.agr.kuleuven.ac.be/aee/clo/wp/tollens2004a.pdf
UNDP. (2013). D.R.Congo agriculture investment opportunities brief - CAADP Investment
Facilitation Programme. Kinshasa: UNDP. Retrieved from
http://www.abghq.com/downloads/DRC.pdf
UNDP. (2016). Human Development Report - 2016. New York: UNDP. Retrieved from
http://hdr.undp.org/sites/default/files/2016_human_development_report.pdf
UNEP. (2011). The Democratic Republic of the Congo: Post - conflict Environmental
Assessment, Synthesis for Policy Makers. Nairobi, Kenya: UNEP. Retrieved from
https://postconflict.unep.ch/publications/UNEP_DRC_PCEA_EN.pdf
USAID. (2014). Country Development Cooperation Strategy (CDCS) 2014 - 2019 : Democratic
Republic of the Congo. Washington, DC: USAID. Retrieved from
https://www.usaid.gov/democratic-republic-congo/cdcs
Venables, W. N., & Ripley, B. D. (2002). Modern Applied Statistics with S. 4. New York, US:
Springer. Retrieved from http://www.stats.ox.ac.uk/pub/MASS4
Ward, P. S., Bell, A. R., Droppelmann, K., & Benton, T. G. (2018). Early adoption of
Conservation Agriculture practices: Understanding partial compliance in programs with
multiple adoption decisions. Land Use Policy, 27-37.
World Bank. (2013). Congo, Democratic Republic of - Country Assistance Strategy for the
period FY13 - FY16 (English). Washington, DC: World Bank. Retrieved from
http://documents.worldbank.org/curated/en/664211468246896400/Congo-Democratic-
Republic-of-Country-Assistance-Strategy-for-the-period-FY13-FY16

69
Appendix
Table A1. Logit models results for factors influencing CA adoption.
Dependent variable =1 if the farmer adopted CA
(1) (2) (3) (4) (5) (6) (7) (8)
Full
sample
Agroecological
zone
Village level
Savannah region
Forest region
Trained group
Untrained group
Full
sample without
training
Savannah – 2.007***
(0.677)
– – – – – –
Enombe - Sakina – – -4.256**
(1.952) – – – – –
Kamonga – – -0.402
(2.059) – – – – –
Kampala – – -3.667*
(1.950)
– – – – –
Kauta – – -0.390
(1.971) – – – – –
Kimanga – – -4.833**
(2.263) – – – – –
Kionga – – -2.286
(2.328) – – – – –
Lubangwana – – -5.597**
(2.206) – – – – –
Lubelenge – – -3.291*
(1.959) – – – – –
Lukongo – – -3.082
(2.155) – – – – –
Nyoka – – -3.060
(1.984) – – – – –
Age 0.034
(0.022)
0.030
(0.023)
0.019
(0.025)
0.023
(0.043)
0.038
(0.029)
0.027
(0.026)
0.047
(0.043)
0.027
(0.019)
Land 0.305
(0.251)
0.461
(0.304)
0.587*
(0.352)
0.687
(0.991)
0.573
(0.365)
0.464
(0.392)
0.007
0.622)
0.263
(0.185)
Accessed credit 1.604***
(0.492)
1.411***
(0.519)
1.973***
(0.656)
1.890
(1.386)
1.360**
(0.595)
1.716***
(0.539)
1.384
(1.499)
1.997***
(0.466)
Farmers’ group 1.796***
(0.485)
1.794***
(0.506)
2.217***
(0.602)
1.454
(1.010)
1.852***
(0.610)
1.891***
(0.549)
1.312
(1.019)
2.349***
(0.436)
Household size -0.008
(0.057)
-0.013
(0.057)
-0.039
(0.063)
-0.162
0.143)
0.016
(0.065)
-0.024
(0.066)
0.083
(0.120)
0.034
(0.051)
Female non-
married -1.905***
(0.675)
-1.536**
(0.684)
-2.081**
(0.813)
-0.757
(1.922)
-1.778**
(0.768)
-1.925***
(0.713) – -1.629**
(0.647)

70
Table A1. Logit models results for factors influencing CA adoption (Cont.).
Dependent variable =1 if the farmer adopted CA
(1) (2) (3) (4) (5) (6) (7) (8)
Full
sample
Agroecol
ogical zone
Village
level
Savannah
region
Forest
region
Trained
group
Untrained
group
Full sample
without training
Literate -0.678
(0.616)
-0.357
(0.633)
-0.783
(0.711)
1.790
(1.502)
-1.194
(0.853)
-1.004
(0.704) – -0.813
(0.567)
Training 2.463***
(0.563)
3.449***
(0.727)
4.121***
(0.962)
4.221***
(1.385)
3.553***
(1.182) – – –
Constant -3.640***
(1.203)
-5.201***
(1.410)
-1.556
(2.217)
-3.533
(2.320)
-5.295***
(1.889)
-0.663
(1.254)
-5.282**
(2.474)
-2.253**
(1.036)
Observations 225 225 225 97 128 181 44 225
Log Likelihood -74.056 -67.946 -60.216 -17.413 -47.416 -57.905 -15.272 -85.249
Akaike Inf. Crit. 166.113 155.892 158.432 52.826 112.832 131.809 42.545 186.498
Note: *p < 0.1; **p < 0.05; ***p < 0.01
Table A2. List of variables selected from CRS dataset for stepwise analysis.
Variables
• Accessed credit
• Adequate contact
with field agent
• Age
• Age squared
• Amount saved
• Aware of NTA
project
• Distance to the
nearest market
• Education
• Farm size
• Farm size squared
• Farmers’ group
membership
• Female non-married
farmer
• Food security
improved as primary
benefit
• Food security status
• Frequency of meeting
• Frequency of selling
farm products
• Frequency of SILC
meetings Gender
• Group marketing
• Home improvement
as primary benefit
• Household size
• Household source of
income for farming
• Income Improved
Benefit1
• Income reliable from
NTA
• Land cultivated
• Land under CA
• Literate
• Ln Farm size
• NTA services
• Number of Boys
• Number of Chickens
• Number of Children
• Number of Girls
• Number of Goats
• Number of male
adults
• Number of male
elderly
• Number of meals par
day 3 years after NTA
project 2015
• Number of meals par
day at the end of NTA
project 2012
• Number of meals par
day before NTA
project 2009
• Number of meeting
after NTA project
closure
• Number of months of
food insecurity 3 years
after NTA project
2015
• Number of months of
food insecurity at the
end NTA project 2012
• Number of months of
food insecurity before
NTA project 2009
• Number of Sheep
• Participant
• Percentage of
children
• Percentage of elderly
• Percentage of women
• Purchase asset as
primary benefit
• Reduced workload
• School fees as
primary benefit
• Similar project in the
area
• Start business as
primary benefit
• Storage loss
• Store products
• Trained
• Village
• Year of joining NTA
project
• Yearly income
average
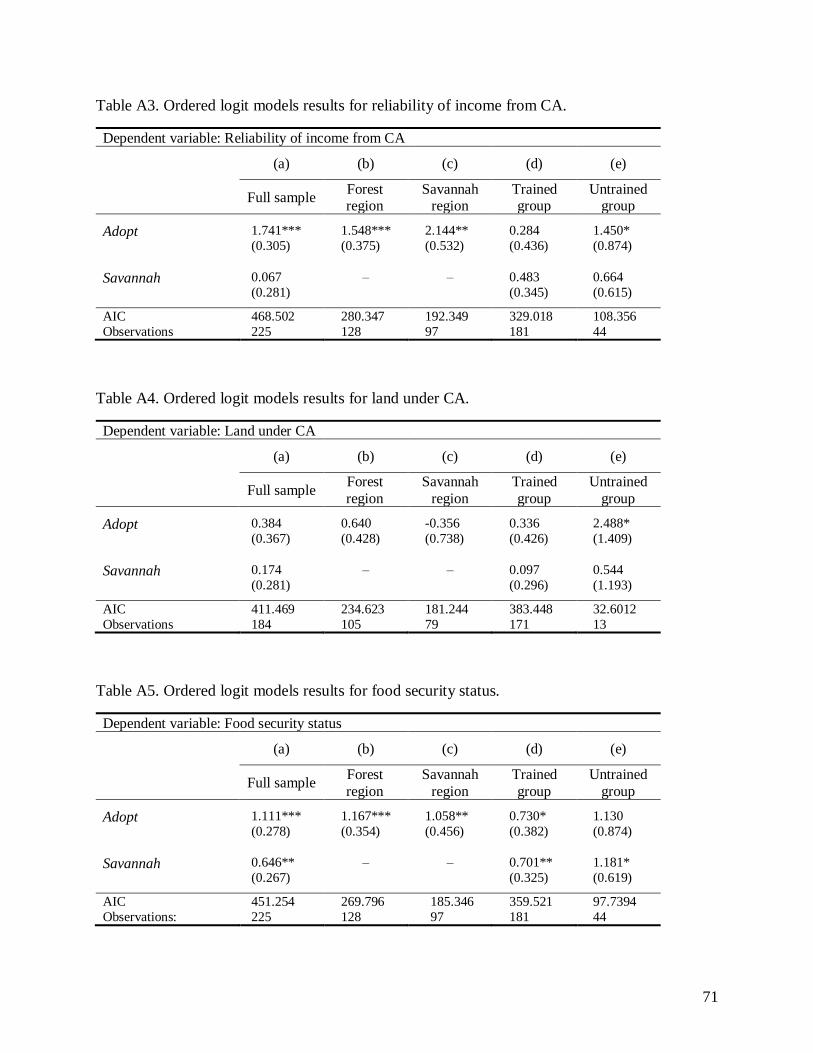
71
Table A3. Ordered logit models results for reliability of income from CA.
Dependent variable: Reliability of income from CA
(a) (b) (c) (d) (e)
Full sample
Forest region
Savannah region
Trained group
Untrained group
Adopt 1.741***
(0.305)
1.548***
(0.375)
2.144**
(0.532)
0.284
(0.436)
1.450*
(0.874)
Savannah 0.067
(0.281)
– – 0.483
(0.345)
0.664
(0.615)
AIC
Observations
468.502
225
280.347
128
192.349
97
329.018
181
108.356
44
Table A4. Ordered logit models results for land under CA.
Dependent variable: Land under CA
(a) (b) (c) (d) (e)
Full sample
Forest
region
Savannah
region
Trained
group
Untrained
group
Adopt 0.384
(0.367)
0.640
(0.428)
-0.356
(0.738)
0.336
(0.426)
2.488*
(1.409)
Savannah 0.174
(0.281)
– – 0.097
(0.296)
0.544
(1.193)
AIC
Observations
411.469
184
234.623
105
181.244
79
383.448
171
32.6012
13
Table A5. Ordered logit models results for food security status.
Dependent variable: Food security status
(a) (b) (c) (d) (e)
Full sample
Forest
region
Savannah
region
Trained
group
Untrained
group
Adopt 1.111***
(0.278)
1.167***
(0.354)
1.058**
(0.456)
0.730*
(0.382)
1.130
(0.874)
Savannah 0.646**
(0.267) – – 0.701**
(0.325)
1.181*
(0.619)
AIC
Observations:
451.254
225
269.796
128
185.346
97
359.521
181
97.7394
44