factors influencing intention to quit among bank...
TRANSCRIPT
Factors Influencing Intention to Quit Among Bank
Employees in Malaysia
Cha Xin Yi
A research project submitted in partial fulfillment of the
requirement for the degree of
Master of Business Administration
Universiti Tunku Abdul Rahman
Faculty of Accountancy and Management
October 2012
Factors Influencing Intention to Quit Among Bank
Employees in Malaysia
By
Cha Xin Yi
This research project is supervised by:
Cheah Lee Fong
Lecturer
Department of International Business
Faculty of Accountancy and Management
_____________________________________________________________________
___________________________________________________________________________
iii
Copyright @2012
ALL RIGHTS RESERVED. No part of this paper may be reproduced, stored in a
retrieval system, or transmitted in any form or by any means, graphic, electronic,
mechanical, photocopying, recording, scanning, or otherwise, without the prior
consent of the authors.
_____________________________________________________________________
___________________________________________________________________________
iv
DECLARATION
I hereby declare that:
(1) This MKMA25106 Research Project is end result of my own work and that
due acknowledgement has been given in the references to all sources of
information be they printed, electronic, or personal.
(2) No portion of this research project has been submitted in support of any
application for any other degree or qualifications of this or any other
university, or other institutes of learning.
(3) The word count of this research project is 19, 317
Name of Student : Cha Xin Yi
Student ID : 09UKM07938
Signature :
Date :
_____________________________________________________________________
___________________________________________________________________________
v
ACKNOWLEDGEMENT
I would like to take this opportunity to acknowledge the contribution of a number of
people for their support and efforts in making this research a great success.
First of all, I would like to express gratitude to my supervisor, Ms Cheah Lee Fong
(Department of International Business) for her guidance, feedback and suggestion
throughout this research. Her guidance and support are the most valued in
completing this research project. I appreciate for all her contribution and advice in
completion of this research.
I would like to express my deepest gratitude towards the respondents. I am very
grateful to them for spending their precious time to complete my questionnaire.
I would like to extend my greatest appreciation to my friends, course mates, and
colleagues who had patiently helped me in completing this research.
Last but not least, I would like to express my sincere appreciation to my family for
their undivided love and support.
_____________________________________________________________________
___________________________________________________________________________
vi
TABLE OF CONTENTS
Page
Copyright Page……………………………………………………………….……….iii
Declaration………………………………………………………………….…………iv
Acknowledgements…………………………………………………………..………...v
Table of Contents………………………………………………………………..…….vi
List of Tables………………...………………………………………………………xiii
List of Figures……………………………………………………………………….xvii
Abstract………………………………………………………………..……………xviii
Chapter 1 INTRODUCTION…………………….…………………………….…..1
1.1 Background of Study…….………………………………….………....2
1.1.1 Retail Banking……………………………………..……….….2
1.1.2 Business Banking……….………………………………..........3
1.1.3 Investment Banks...……..………….………………..………...3
1.2 Problem Statement………….………….……...…………………….….6
1.3 Objectives of the Study………..……………………..………………....7
1.3.1 General Objective………………………..……………………7
1.3.2 Specific Objective……..……...…………………………….…7
_____________________________________________________________________
___________________________________________________________________________
vii
1.4 Significant of Study………………..…….…………………….….…...8
1.5 Organization of the Research……………………….……….………….9
1.6 Conclusions…...…………..………………………………….………..11
Chapter 2 LITERATURE REVIEW…………….……………………….………12
2.0 Introduction………………..…………………………………….……12
2.1 Job Attitudes and Organizational Attitude Theory….….………....….12
2.1.1 Job Satisfaction…………..……...……………………..…….14
2.1.2 Organization Commitment…………………..…………..…..16
2.2 Organization Justice………….....………………………………….…19
2.2.1 Distributive Justice……….…………………………………19
2.2.2 Procedural Justice…………………………………………...21
2.3 Empowerment…….….……..…………………………………….….22
2.4 Perceived Alternatives Employment Opportunities..……………..…25
2.5 Stress….…….…………..……………………………………….…...26
2.5.1 Occupational Stress...................................................................28
2.6 Intention to Quit…………………….………………………..….…..29
2.7 Conclusions……………….………………………………..….…….30
_____________________________________________________________________
___________________________________________________________________________
viii
Chapter 3 METHODOLOGY………..…..……………...……………..………...31
3.0 Introduction………………………………………….………….……..31
3.1 Theoretical Framework…………….…………………………….……31
3.2 Hypothesis Development……………….……………………….…….32
3.3 Research Design…….………………………………………………...33
3.4 Data Collection…...…………………………………………….…......34
3.4.1 Primary Data………….………………………….…….…….34
3.4.2 Secondary Data…………….………………………….….….35
3.5 Sampling Design………………………………………………….…...35
3.5.1 Target Population………………………………………….…35
3.5.2 Sample Size…..….………………………………………..…35
3.5.3 Sampling Technique……….….……………………….…….36
3.6 Research Instrument………….…………………..…………………...36
3.6.1 Measurement Scale……………………….………………….40
3.6.1.1 Nominal Scale………………………...…………...40
3.6.1.2 Ordinal Scale……………………...…………….…40
3.6.1.3 Likert Scale…………………………...…………...41
3.7 Pilot Test………………..………………….…………………………..41
3.8 Data Processing…………..….…………….…………………………...42
_____________________________________________________________________
___________________________________________________________________________
ix
3.8.1 Descriptive Analysis……………….…………………….….42
3.8.2 Reliability Analysis…….……..…………………………….43
3.8.3 Multiple Regression Analysis………………..………….…..43
3.8.4 Pearson’s Bivariate Correlation Analysis…………………...44
3.8.5 Comparative Analysis………….……………….……….…..44
3.8.5.1 Independent-Samples T-Test…….………..……...44
3.8.5.2 One-Way ANOVA Analysis.…….……..……..….45
3.8.6 Mediator Analysis……….……....…………………….……45
3.9 Conclusions……......…..….……………..………………………….….46
Chapter 4 RESEARCH RESULT AND FINDING..……………....……………..47
4.0 Introduction………..…………………………………………………...47
4.1 Descriptive Analysis…..………………………………………….……47
4.1.1 Frequency of Respondents Based on Gender………...…….…48
4.1.2 Frequency of Respondents Based on Marital Status…...……...49
4.1.3 Frequency of Respondents Based on Age of Respondents…...50
4.1.4 Frequency of Respondents Based on Education Level……......51
4.1.5 Frequency of Respondents Based on Job Level…..….....….......52
4.1.6 Frequency of Respondents Based on Years of Working
Experience……………...………..…...………………...……...53
_____________________________________________________________________
___________________________________________________________________________
x
4.1.7 Frequency of Respondents Based on Number of Years with
Current Organization…………………...……………….…......54
4.1.8 Frequency of Respondents Based on Income ……..…..…...…55
4.1.9 Frequency of Respondents Based on Current Salary Scheme....56
4.2 Outcome of Reliability Analysis……………………….……………….…56
4.3 Hypotheses Testing………………………………………………………..58
4.3.1 H1: There is a significant difference between age group and
intention to quit (p<0.05)…………………....……….….……..58
4.3.2 H2: There is a significant difference between number of
years with current organization and intention to quit (p<0.05)
……………………………………………………………………....61
4.3.3 H3: There is a significant difference between education
level and intention to quit (p<0.05)………....…..…..……...……..64
4.3.4 H4: There is a significant difference between gender and
intention to quit (p<0.05)…….…..……..……………….….....67
4.3.5 H5: There is a significant relationship between
empowerment and intention to quit (p<0.05)……...……….....69
4.3.6 H6: There is a significant relationship between organization
justice and intention to quit (p<0.05)……………………..…...70
4.3.7 H7: There is a significant relationship between perceived
alternative employment opportunities and intention to quit
(p<0.05)……………………………………………….…….….71
4.3.8 H8: There is a significant relationship between occupational
stress and intention to quit (p<0.05)…….………………..……72
4.4 Multiple Linear Regression Analysis…...………………………….….…..73

_____________________________________________________________________
___________________________________________________________________________
xi
4.5 Mediation Analysis…………….……………………………………….…76
4.5.1 Mediation Effect between Empowerment and Intention to
Quit…………………………………………….…………..…..76
4.5.2 Mediation Effect between Organization Justice and Intention to
Quit………………………………………………….…………79
4.5.3 Mediation Effect between Perceived Alternative Employment
and Intention to Quit…………………………………….………….81
4.5.4 Mediation Effect between Occupational Stress and Intention
To Quit…………………………………………….….……….83
4.6 Conclusions……………...……………………………………………….….85
Chapter 5 DISCUSSION AND CONCLUSION………………..…………….....86
5.0 Introduction……..……….…………………………………………....86
5.1 Discussion of Major Findings…………...………………………...….86
5.1.1 Findings on the Hypotheses…………….……………….…...87
5.2 Implications………..………...…………………………………..….100
5.2.1 Empowerment ………………………………………….......101
5.2.2 Organization Justice…………………………………..…….101
5.2.3 Perceived Alternative Employment Opportunities…….…...102
5.2.4 Occupational Stress…………………..………………….…..103
5.3 Limitations of Study………….………….…………………….……104
5.4 Recommendations for Future Research……….……..……….…….105
5.5 Conclusions……………….…….……………………………..……106
_____________________________________________________________________
___________________________________________________________________________
xii
References…………………………………………….………………….……….…107
Appendices……….…………………………………………………………...……..131
_____________________________________________________________________
___________________________________________________________________________
xiii
LIST OF TABLES
Page
Table 1 Reliability Analysis Result for Pilot Test 57
Table 2 Gender of the Respondents 48
Table 3 Marital Status of the Respondents 49
Table 4 Age of Respondents 50
Table 5 Educational Level of the Respondents 51
Table 6 Job Level of the Respondents 51
Table 7 Years of Working Experience of the Respondents 53
Table 8 Number of Years with Current Organization 54
Table 9 Income 55
Table 10 Current Salary Scheme 56
Table 11 ANOVA (Age Group and Intention to Quit) 58
Table 12 Post Hoc Test (Age Group and Intention and Quit) 59
Table 13 ANOVA (Number of Years with Current Organization
and Intention to Quit)
61
Table 14 Post Hoc Test (Number of Years with Current
Organization and Intention to Quit)
62
Table 15 ANOVA (Education Level and Intention to Quit) 64
Table 16 Post Hoc Test (Education Level and Intention to Quit) 65
Table 17 Group Statistics (Gender and Intention to Quit) 67
_____________________________________________________________________
___________________________________________________________________________
xiv
Table 18
Independent Sample T-Test
(Gender and Intention to Quit)
68
Table 19 Pearson Correlations
(Empowerment and Intention to Quit)
69
Table 20 Pearson Correlations
(Organization Justice and Intention to Quit)
70
Table 21 Pearson Correlations
(Perceived Alternative Employment Opportunities and
Intention to Quit)
71
Table 22 Pearson Correlations
(Occupational Stress and Intention to Quit)
72
Table 23 Model Summary of Independent Variables 73
Table 24 ANOVAb
of Independent Variables 74
Table 25 Coefficientsa
of Independent Variables 75
Table 26 Coefficientsa for Mediation Effect between
Empowerment and Intention to Quit(1)
77
Table 27 Coefficientsa for Mediation Effect between
Empowerment and Intention to Quit(2)
77
Table 28 Coefficientsa for Mediation Effect between
Empowerment and Intention to Quit(3)
78
Table 29 Mediation Effect of Job Attitudes between
Empowerment and Intention to Quit Using Sobel Test
78
Table 30 Coefficientsa for Mediation Effect between Organization
Justice and Intention to Quit (1)
79
_____________________________________________________________________
___________________________________________________________________________
xv
Page
Table 31 Coefficientsa for Mediation Effect between Organization
Justice and Intention to Quit (2)
79
Table 32 Coefficientsa for Mediation Effect between Organization
Justice and Intention to Quit (3)
80
Table 33 Mediation Effect between Organization Justice and
Intention to Quit Using Sobel Test
80
Table 34 Coefficientsa for Mediation Effect between
Perceived Alternative Employment Opportunities and
Intention to Quit (1)
81
Table 35 Coefficientsa for Mediation Effect between Perceived
Alternative Employment Opportunities and Intention to
Quit (2)
81
Table 36 Coefficientsa for Mediation Effect between Perceived
Alternative Employment Opportunities and Intention to
Quit (3)
82
Table 37 Mediation Effect between Perceived Alternative
Employment Opportunities and Intention to Quit Using
Sobel Test
82
Table 38 Coefficientsa for Mediation Effect between
Occupational Stress and Intention to Quit (1)
83
Table 39 Coefficientsa for Mediation Effect between
Occupational Stress and Intention to Quit (2)
83
_____________________________________________________________________
___________________________________________________________________________
xvi
Page
Table 40 Coefficientsa for Mediation Effect between
Occupational Stress and Intention to Quit (3)
84
Table 41 Mediation Effect between Occupational Stress and
Intention to Quit Using Sobel Test
84
_____________________________________________________________________
___________________________________________________________________________
xvii
LIST OF FIGURES
Page
Figure 1 Theoretical Framework of Factors Influencing Intention
to Quit Among Bank Employees in Malaysia
31
Figure 2 Mean Plots (Age Group and Intention to Quit) 60
Figure 3 Mean Plots (Number of Years with Current Organization
and Intention to Quit)
63
Figure 4 Mean Plots (Education Level and Intention to Quit) 66
_____________________________________________________________________
___________________________________________________________________________
xviii
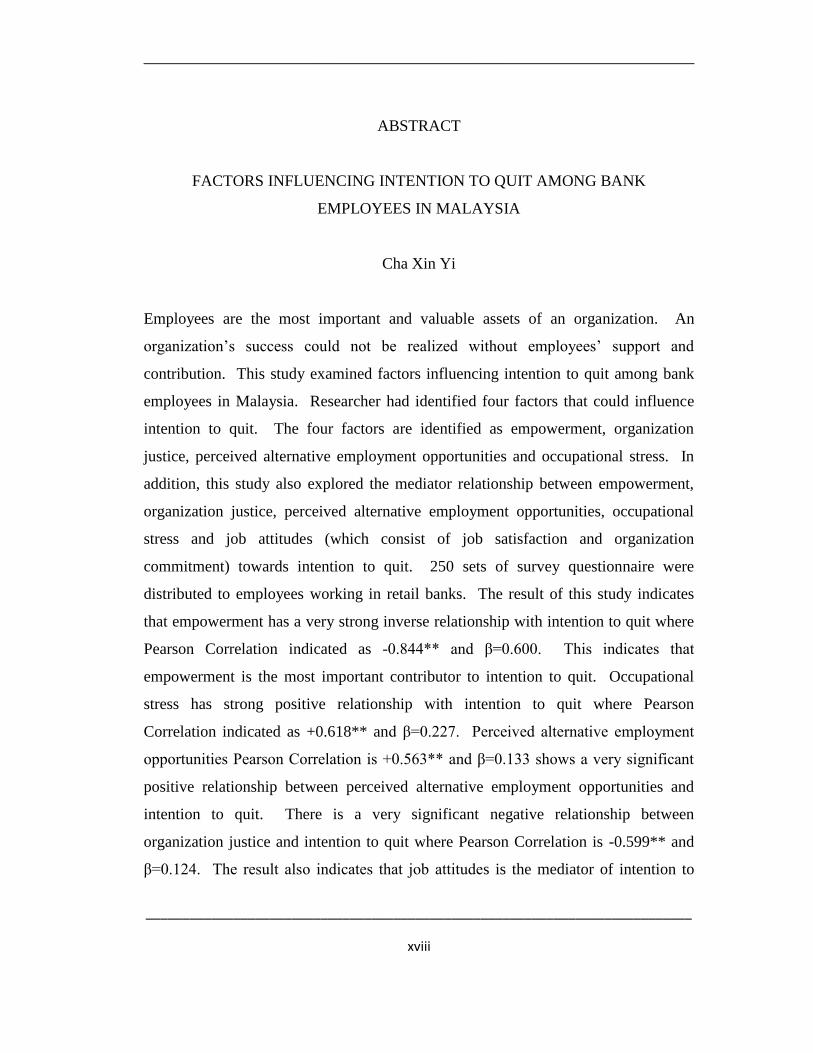
ABSTRACT
FACTORS INFLUENCING INTENTION TO QUIT AMONG BANK
EMPLOYEES IN MALAYSIA
Cha Xin Yi
Employees are the most important and valuable assets of an organization. An
organization’s success could not be realized without employees’ support and
contribution. This study examined factors influencing intention to quit among bank
employees in Malaysia. Researcher had identified four factors that could influence
intention to quit. The four factors are identified as empowerment, organization
justice, perceived alternative employment opportunities and occupational stress. In
addition, this study also explored the mediator relationship between empowerment,
organization justice, perceived alternative employment opportunities, occupational
stress and job attitudes (which consist of job satisfaction and organization
commitment) towards intention to quit. 250 sets of survey questionnaire were
distributed to employees working in retail banks. The result of this study indicates
that empowerment has a very strong inverse relationship with intention to quit where
Pearson Correlation indicated as -0.844** and β=0.600. This indicates that
empowerment is the most important contributor to intention to quit. Occupational
stress has strong positive relationship with intention to quit where Pearson
Correlation indicated as +0.618** and β=0.227. Perceived alternative employment
opportunities Pearson Correlation is +0.563** and β=0.133 shows a very significant
positive relationship between perceived alternative employment opportunities and
intention to quit. There is a very significant negative relationship between
organization justice and intention to quit where Pearson Correlation is -0.599** and
β=0.124. The result also indicates that job attitudes is the mediator of intention to
_____________________________________________________________________
___________________________________________________________________________
xix
quit with partial mediation effect. At the end of this project, several implications to
managers are presented.
___________________________________________________________________________
___________________________________________________________________________
Page 1 of 183
CHAPTER ONE
INTRODUCTION
1.0 Introduction
Employees are important human assets of an organization as high productivity
and performance of most organizations could not be realized without
employees’ support and contribution. The availability and sustainability of the
right type of human resource at the right time and right place is the essence to
every organization’s success. The long term well maintained employer-
employees’ relationship not only ensures sustainability and competitive
advantage over rivalry, it also promotes good organizational culture and
motivation at the workplace. Therefore, staffing and maintaining well trained
and committed employees in any organization are hallmark of the
management at all times.
In general, an unhappy and dissatisfied employee will not remain long in the
organization neither he nor she will be able to provide the best services for
the customers. A satisfied and happy employee will always smile while on
the way to work and strive his best to do his job. The employees working in
the banks, particularly the executives and the tellers, are the
ambassadors of the bank. Their duties are not only limited at processing
transactions and servicing the customers over the counter but at the same time
creating a rewarding experience for each customers so that the customers will
___________________________________________________________________________
___________________________________________________________________________
Page 2 of 183
continue to patron the bank and thus repeatedly generating profit for the bank
(either in terms of deposits or all type of loans).
One must reconcile that voluntary turnover among bank employees is a past
and present problem for bank management. Unfortunately, the factors
influencing the intention to quit among bank employees in Malaysia
remain unknown. This study aims to investigate the factors influencing the
intention to quit among the bank employees in Malaysia.
1.1 Background of Study
The term “financial institution” encompasses a broad range of institutions
such as retail banks, commercial banks, investment banks, among others.
Below are some general definition and classification in banking.
1.1.1 Retail Banking
Retail banking is defined as the provision of services to individuals and small
businesses where the financial institutions are dealing in large volumes of low
value transactions (Lewis & Davis, 1987). Individual consumers deal with the
bank’s employee in carry out their banking transaction every day. Positions
involving frontline customer services, office and administrative, operations
make up a significant number of employments in the banking industry. Our
study shall focus on this definition.
___________________________________________________________________________
___________________________________________________________________________
Page 3 of 183
1.1.2 Business Banking
Business banking is defined as financial dealings with an institution that
provides business loans, credit, savings and checking accounts specifically for
companies. Business banking is also known as commercial banking and only
deals with businesses (Levis & Davis, 1987).
1.1.3 Investment Banks
Banks that deals with capital markets is known as an investment bank (Levis
& Davis, 1987).
Financial institutions are crucial to the growth of economy in a particular
country. They act as the nerve centre of the economy (Oreoluwa & Oludele,
2010). In the past few years, Malaysia financial system has witnessed
significant changes in terms of its structures, management techniques and
regulatory environment. Both internal and external factors such as banking
deregulation, increase competitive pressure, technology innovation are taking
place at both the national and global macro-environment of banking calls for a
dynamic change in banking management.
The banking industry in Malaysia is facing deregulation and globalization
since year 2000 (“Consolidation of Domestic Banking Institutions”, 2000).
Deregulation is defined as the removal or relaxation of previously enacted
public laws that exert control over business and industry. This is because
Government rules and regulation limits competition, growth and development
of the free market economy (Levis & Davis, 1987). The banking industry is
moving towards free market. New entrants such as foreign banks are
___________________________________________________________________________
___________________________________________________________________________
Page 4 of 183
permitted to enter the banking industry. This increased number of players in
market creates intense competition in the banking industry.
In order to compete with the foreign banks, Bank Negara has initiated
merger programs. As a recap, Malaysia bank’s merger and rationalization of
branches was initiated as early as mid 1980’s when the banking industry was
badly hit by the 1985 – 1986 economic recession. Following the 1997-1998
Asian financial crisis gave the much needed push for the banking industry to
merge. The merger programs undertaken by the Malaysia banking system
was proposed by the Central Bank in year 1999 and the completion of
formation of 10 anchor banking groups was completed in year 2000
(“Consolidation of Domestic Banking Institutions”, 2000).
A merger is a combination of two companies where one loses its corporate
existence, and the surviving company acquires both the assets and the
liabilities of merged company (Fauzias, 2003). The main objective of merger
was to create bigger and stronger domestic banks that are able to compete
with foreign banks when the financial sector is liberalized under the World
Trade Organization Agreement (“WTO”) (Sufian & Habibullah, 2009).
To a certain degree, bank merger will cause system disruption and technical
default. System disruption and technical default cause long queue lines, more
stress on customers and employees and increase the risk of losing both the
customer and the employee (Oreoluwa & Oludele, 2010). The operational
framework of the bank also requires bank workers to resume early and close
very late and weekend banking. According to Christina (2011), an article in
The Star, 2011 –“All work and no play” quoted that the Branch Secretary of
National Union Bank Employees (“NUBE”) Kuala Lumpur commented that
___________________________________________________________________________
___________________________________________________________________________
Page 5 of 183
bank employees work late because they don’t have choice. The nature of
banking work and the working environment of the employees in branch outlet
in the day to day banking could trigger occupational stress and intention to
quit.
According to Oxford Dictionary, the word “rationalize” means to reform an
industry by eliminating waste in labour, time and material. The larger
financial institutions are aiming to reduce the overall size of their network
while maintaining and even increasing their market shares. The key
activities includes closure of non-profitable branches that offers little promise
or improvement, relocating the branches that are under performing due to poor
retail location and downgrade or upgrade the level of service provision
supplied. The rationale behind rationalization of branches is to provide a cost-
effective delivery service system (Greenland, 1994). The relocation of
branches and movement of staffs could trigger intention to quit as the staff
has to travel very far from home to work on daily basis.
Besides that, the financial services salesperson working in retail banks is
facing different set of challenges. Financial services salespersons are
susceptible to a high degree of job stress (Montgomery, Blodgett & Barnes,
1996) and job dissatisfaction. An article reported by one the major newspaper
provided us with some clues on the event happening in the banking sector.
The Malaysian Industrial Development Finance Berhad (“MIDF”)
indicated weaker economic outlook, coupled with slower loan growth, margin
compression and higher credit cost had lead to some research houses to
downgrade the local banking sector (Dhesi, 2011). The financial services
salesperson may face short term pressure from management to meet sales
quotas (Montgomery, Blodgett, & Barnes, 1996).
___________________________________________________________________________
___________________________________________________________________________
Page 6 of 183
As a result, financial services salespersons may be tempted to ignore the best
interests of their customers and focus on generating commissions for the
organization in order to retain their jobs. Therefore, financial services
salespersons could be vulnerable to occupational stress and intention to quit
(Chonko, Howell, & Bellinger, 1986).
1.2 Problem Statement
Generally, the nature of work in banks is very busy and demanding. The
bank’s structure is hierarchical, bureaucratic and heavily regulated. For
branch outlet, the normal working hours is from 8.45am to 5.45pm. However,
in most circumstances, employees are required to work for longer hours such
as to facilitate the loading and unloading of ATMs, Cash Deposit Machines
(“CDM”) and Cheque Deposit Machine (“CQM”) during public holidays.
The working environment of the employees in branch outlet deals with
volume of customers in the day to day banking. There are high and
continuous interactions with customers. Employees who stay longer in the
organization will build up good relationship with the customers in the long
run. They are well versed with the product knowledge, experience in handling
customers and understand the customers’ need. Thus, frequent turnover will
some how causes uneasiness to the customers and disruption of services.
According to an interview with Dr Yeah Kim Leng, RAM Holdings Group
Chief Economist quoted that the performance of the Malaysia banking
industry is likely to be moderate next year in line with the economy (“Banking
sector performance”, 2011). With the moderate performance outlook of the
___________________________________________________________________________
___________________________________________________________________________
Page 7 of 183
banking industry, the likelihood of getting good promotion and incremental
in salary could be beyond reach. Could it be the low salary, the long working
hours, high sales quota coupled with the current economic epidemic that
triggered intention to quit? There is a crucial need to have more
comprehensive studies on the factors that influence the intention to quit
among bank employees. The results of this study will give a new perspective
to the findings of the previous studies on the issue of intention to quit of the
bank employees. The main purpose of this research is to explore the factors
influence the intention to quit among bank employees in Malaysia.
1.3 Objectives of the Study
The objectives of the study are as follows:-
1.3.1 General Objective
It investigates the relationship of empowerment, organization justice,
perceived alternative employment opportunities, occupational stress and its
relationship with intention to quit among bank employees in Malaysia. To
investigate the relationship whether job attitudes, which consists of job
satisfaction and organization commitment, is the mediator of intention to quit.
1.3.2 Specific Objective
1. To examine the relationship between organization justice and intention to quit;
2. To examine the relationship between empowerment and intention to quit;
___________________________________________________________________________
___________________________________________________________________________
Page 8 of 183
3. To examine the relationship between perceived alternative employment
opportunities and intention to quit;
4. To examine the relationship between occupational stress and intention to quit;
and
5. To examine whether job attitudes is the mediator of intention to quit.
1.4 Significant of Study
1. Understanding the variables (organization justice, empowerment, perceived
alternative employment opportunities, occupational stress, job attitudes and
intention to quit) on the bank employees is necessary for the organization to
identify the possible reasons to quit and to draw up proper talent retention
program;
2. Understanding the insight of the variables may help the company in reducing
the employees’ turnover cost. Regardless of the type of organization, turnover
is disruptive and harmful to the organization. This is because organizations
rely so heavily on human factor (Stohr, Self, & Lovrich, 1992). Recruitment,
testing, selection and training of new staff are expensive (Kiekbusch, Price, &
Theis, 2003).
3. Employees turnover will disrupts the social networks and contacts that staff
members develop over time with inmates and other employees (Mitchell,
Mackenzie, Styve, & Gover, 2000). Employee morale can be impacted by
turnover (Byrd, Cochran, Silverman, & Blount, 2000; Stohr, Self, & Lovrich,
1992). Operational functions are disrupted due to insufficient staffing which
typically leads to overworking of the staff that remains.
___________________________________________________________________________
___________________________________________________________________________
Page 9 of 183
1.5 Organization of the Research
The format and style adopted by this thesis is in compliance with University
of Tunku Abdul Rahman. The research consists of three main sections
namely the preliminary matters, the main contents and the closing matters.
The preliminary matters include the title page, supervisor page, copyright
page, declaration, acknowledgements, table of contents, list of tables, list of
figures, and abstracts.
The main contents are organized into five major chapters:-
Chapter One: Introduction
Chapter One previews the research study. These include background of the
study, problem statement, research objectives, significant of the study,
scope of study, and organization of the thesis.
Chapter Two: Literature Review
Chapter Two provides the literature review of the study. This chapter
provides a review of the literature and past research related to the topic under
study. It also presents discussion of the review relating to aspects in the study
namely organization justice, empowerment, perceived alternative
employment opportunities, occupational stress, job attitude and intention to
quit. This encompasses relevant review from the previous study about of the
subject matter. The literatures were extracted from publications of journals,
books and articles as references for this research.
___________________________________________________________________________
___________________________________________________________________________
Page 10 of 183
Chapter Three: Research Method
Chapter Three discusses the methodology used in the study as well as
statistical analyses involved. It provides a discussion on the theoretical
framework of the studies.
Chapter Four: Research Results
Chapter Four presents the results of the analyses on collected data in this
study correspond to the objectives mentioned earlier. It presents a complete
account of the findings. The descriptive statistics of the unit of analysis in the
study are presented. In addition, interpretation of results and discussion on the
significance of such findings are discussed.
Chapter Five: Discussion and Conclusions
Chapter Five concludes the findings of the study and provides
recommendation for future research. Discussion includes the interpretation
of the results and whether the hypotheses are supported by the data.
Possible reasons are given if the hypotheses are not being supported by the
data. Implications to managers are given accordingly. It also highlights the
weakness and limitations of the study. Lastly, conclusions of the research
study which includes predictions, future trends and what further research is
needed for a deeper understanding of the topic in question.
___________________________________________________________________________
___________________________________________________________________________
Page 11 of 183
1.6 Conclusion
This chapter provides the overview of this research project. It describes the
background and issues of intention to quit among bank employees in
Malaysia, research questions, objectives, significant of study and
organization of this research project. It also provides some general outlook on
retail banking industry in Malaysia. The purpose is to provide reader a brief
picture of the study. On next chapter, past researchers’ studies will be
discussed to identify theoretical framework and potential hypotheses for this
research project.
___________________________________________________________________________
___________________________________________________________________________
Page 12 of 183
CHAPTER TWO
LITERATURE REVIEW
2.0 Introduction
In this chapter, it focuses on literature review of the past studies done by other
researchers to provide the foundation background and basis for the research
project. It laid out the theories supporting the research project and served as
guidance to the development of the theoretical framework and hypotheses.
2.1 Job Attitudes and Organizational Attitude Theory
According to Ajzen & Fishbein (1977), attitude are directed at entities that
may be defined by four different elements including attitude toward targets
(dogs), toward actions (eating spaghetti), toward contexts (in a local
restaurant), toward times (in the next three months), or toward any
combination of elements. They suggest that attitude with different targets are
distinct. Organizational attitude may reflect more general employment
policies and practices. In contrast, job attitudes may reflect the type of work,
tasks, and immediate supervision experienced by the employee on the job.
Thus, an employee may feel quite positively about the job because of the
immediate experience of the job, but feel negatively towards the
___________________________________________________________________________
___________________________________________________________________________
Page 13 of 183
organization due to policies regarding pay scales or promotion (Shore,
Newton, & Thornton III, 1990).
These positive or negative feelings about jobs and organizations then
contribute to more specific attitude such as job satisfaction or organizational
commitment. That is, feelings of liking or disliking your job
(satisfaction) can be distinguished from feelings of attachment to the job
(commitment), though these attitude should certainly be related since they
have the same focus (i.e the organization) (Ajzen & Fishbein, 1977).
Several researchers (e.g Wiener & Vardi, 1980), proposed that job and
organizational attitude produce different work outcomes. Porter, Steers,
Mowday, & Boulian (1974) suggested that attitude towards the organization
may be more important than job attitudes in the employee’s decision to leave
the organization. Wiener & Vardi (1980) hypothesized that when the object
of the commitment was the employing organization, the most likely behavior
to be affected by commitment would be organization –oriented behaviour
such as turnover intentions. Similarly, the most likely for behaviour to be
affected by job involvement would be task-oriented behavior such as work
effect and performance.
Drawing on the attitude theory, Harrison, Newman, & Roth (2006), derived
that job attitudes are combination of job satisfaction and organization
commitment, which provides powerful prediction of more integrative
behavioral criteria such as focal performance, contextual performance,
lateness, absence and turnover. According to Harrison, Newman, & Roth,
(2006), a combination of these two constructs captures an employee’s general
attitude towards their job and is important for understanding work behaviour.
___________________________________________________________________________
___________________________________________________________________________
Page 14 of 183
Based on the above literature, our research is to test if job attitudes act as the
mediator of intention to quit.
2.1.1 Job Satisfaction
Locke (1976) defined job satisfaction is a pleasurable or positive emotional
state, resulting from the appraisal of one’s job or job experience. It is an
affective or emotional response toward various facets of one’s job. Smith,
Kendall, & Hulin (1969) defined job satisfaction as the feelings a worker has
about his/her job. Job satisfaction is defined as “an effective reaction to a job
that results from the incumbent’s comparison of actual outcomes with those
that are desired” (Cranny, Smith, & Stone, 1992, p.1).
Many theorist have tried to explain job satisfaction and its’ influence such as
the work of Maslow’s Hierarchy of Needs (1943), Hertzberg’s Two Factor
(Motivator-Hygiene) (1968), Adam’s Equity Theory (1965), Porter and
Lawler’s (1968) modified of Vroom’s (1964) VIE Model, Locke’s (1969)
Discrepancy Theory, Hackman and Oldham’s (1976) Job Characteristic
Model, Locke’s (1976) Range of Affect Theory, Bandura’s (1977) Social
Learning Theory, and Landy’s (1978) (Opponent Process Theory).
According to Hertzberg’s Two Factor (Motivator-Hygiene) Theory (1968)
suggest that satisfaction and dissatisfaction stem from different groups of
variables (motivators) and hygiene factors. According to this theory, people
were satisfied with aspects of their jobs that had to do with the work itself or
to outcomes directly resulting from it. Promotion, opportunities for personal
growth, recognition, responsibility and achievement are referred as
motivators.
___________________________________________________________________________
___________________________________________________________________________
Page 15 of 183
By contrast, dissatisfaction was associated with the conditions surrounding the
job, such as working conditions, pay, security, relations with others, rather
than the work itself are referred as hygiene factors. The Hertzberg Theory has
often been linked to that of Maslow’s Theory of Hierarchy of Needs which
suggests that there are higher order needs and lower order needs.
According to Dawal, Taha, & Ismail (2009), when employees are satisfied
with their jobs, they generally work harder and perform better. However, if
the job satisfaction is low, it will deter employees’ work commitment by
spending less time and effort and increase the intentions to withdraw
themselves either from the job or organization (Cohen & Golan, 2007). The
withdrawals either from the job or organization could be reflected via
decreased performance or increased absenteeism (Firth, Mellor, Moore, &
Loquet, 2004) while others through actual quitting (Park & Kim, 2009).
According to Bernstein & Nash (2008), job satisfaction has emotional,
cognitive and behavioural component. The emotional component refers to
feelings regarding the job such as excitement. The cognitive component of
job satisfaction refers to beliefs regarding one’s job such as feeling that one’s
job is mentally demanding and challenging. Behavioral component includes
actions in relation to their work such as pretending to be ill to avoid work.
Cotton & Tuttle (1986) identified three categories of causes of employee
turnover:-
Work-related factors (for example: job satisfaction, pay, performance,
organizational commitment);
Individual factors (for example: age, education, sex, job tenure);and
___________________________________________________________________________
___________________________________________________________________________
Page 16 of 183
External factors (for example: unemployment rates, employment
perceptions, union presence)
According to Martins & Coetzee (2007), job satisfaction is described as one of
those experiences of work that make it less likely that an employee will think
about leaving even if there are available opportunities. If job satisfaction is
absent and other opportunities are available, turnover could increase (Martins
& Coetzee, 2007). Hence, job satisfaction is viewed as a reaction to a job,
what an individual seeks in job in comparison to the actual outcomes that the
job provides (Rothman & Coetzer, 2002).
Job satisfaction is an indicator of organizational effectiveness (Rothman &
Coetzer, 2002), and it is influenced by organizational and personal factors.
The optimal function of an organization depends on the level of job
satisfaction of employees. This indicates to us the importance of job
satisfaction.
Numerous western studies have generally supported a negative relationship
between job satisfaction and employee turnover (Griffeth, Hom, & Gaertner,
2000; Kinicki, Schriesheim, McKee-Ryan, & Carson, 2002; Price & Mueller,
1986). Improving employees’ job satisfaction thus appears to be instrumental
for decreasing employee turnover (Rust, Stewart, Miller, & Pielack, 1996).
2.1.2 Organization Commitment
According to Porter, Crampon, & Smith (1976), organizational commitment
was defined as the relative strength of an individual’s identification with and
___________________________________________________________________________
___________________________________________________________________________
Page 17 of 183
involvement in a particular organization. It can be characterized with three
factors:-
A strong belief in and acceptance of the organization’s goals and values;
A willingness to exert considerable effort on behalf of the organization; and
A strong desire to maintain membership in the organization
By this definition, commitment represents something beyond mere passive
loyalty to an organization. It involves an active relationship with the
organization such that individuals are willing to give something of themselves
in order to contribute to the organization’s well being. Hence, commitment
could be inferred not only from the expressions of an individual’s beliefs and
opinions but also from his or her actions (Mowday, Steers, & Porter, 1979).
An expansion of the organizational commitment theory by Meyer & Allen
(1991) incorporated both the attitudinal and behavioral approaches and their
complementary relationship. Meyer & Allen (1991) expand the concept of
commitment to include desire (Affective Commitment), need (Continuance
Commitment), and obligation to remain (Normative Commitment):-
Affective Commitment refers to the to the employees emotional
attachment to, identification with, and involvement in the organization.
Employees with a strong affective commitment continue employment with
the organization because they want to do so;
Continuance Commitment refers to an awareness of the costs associated
with leaving the organization. Employees remain with an organization
because they need to do so;
___________________________________________________________________________
___________________________________________________________________________
Page 18 of 183
Normative Commitment refers to a feeling of obligation to continue
employment. Employees with a high level of normative commitment feel
that they ought to remain with the organization
Among the three forms of commitment, affective commitment may be
considered most desirable for an organization, as employees with high
affective commitment are more likely to willingly contribute to the
organizational performance and even do more than it is expected from them
(Kazlauskaite, Buciuniene, & Turauskas, 2006).
Organizational commitment and job satisfaction have theoretical and
empirical commonalities (Harrison et al, 2006). In Meyer & Allen’s (1991)
three dimensional re-conceptualization, affective commitment is the most
strongly overlapping with constitutive and operational definition with
attitude. Hulin (1991) noted considerable theoretical overlap between
affective commitment and overall job satisfaction, remarking that the only
clear difference between the two is the conceptual target. The target of job
satisfaction is one’s position or work role; the target of affective commitment
is the entire organization (Hulin, 1991: 489).
Affective commitment and satisfaction have a strong correlation (Meyer,
Stanley, Herscovitch, & Topolnytsky, 2002). Judge, Thoreson, Bono, &
Patton (2001) argued that one can conceptualize both job satisfaction and
organizational commitment as an underlying overall job attitude. Hence, it is
reasonable to treat job satisfaction and attitudinal commitment as specific
reflections of a general attitude, the fundamental evaluation of one’s job
experience.
___________________________________________________________________________
___________________________________________________________________________
Page 19 of 183
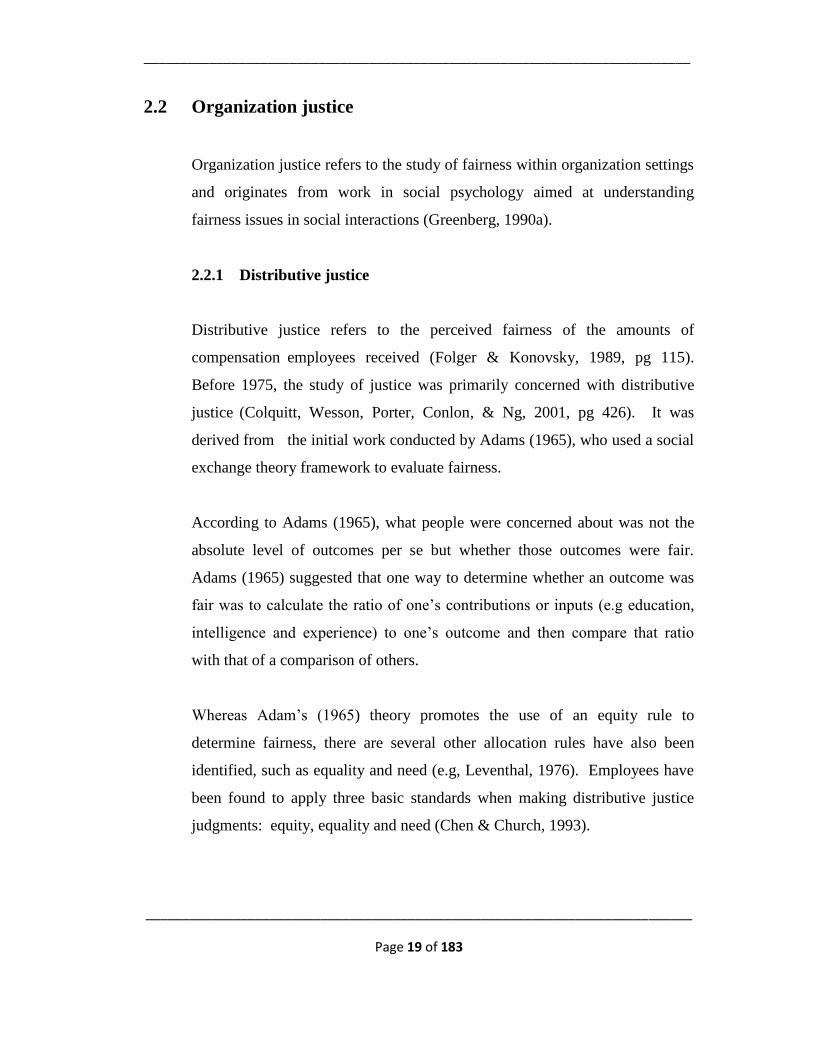
2.2 Organization justice
Organization justice refers to the study of fairness within organization settings
and originates from work in social psychology aimed at understanding
fairness issues in social interactions (Greenberg, 1990a).
2.2.1 Distributive justice
Distributive justice refers to the perceived fairness of the amounts of
compensation employees received (Folger & Konovsky, 1989, pg 115).
Before 1975, the study of justice was primarily concerned with distributive
justice (Colquitt, Wesson, Porter, Conlon, & Ng, 2001, pg 426). It was
derived from the initial work conducted by Adams (1965), who used a social
exchange theory framework to evaluate fairness.
According to Adams (1965), what people were concerned about was not the
absolute level of outcomes per se but whether those outcomes were fair.
Adams (1965) suggested that one way to determine whether an outcome was
fair was to calculate the ratio of one’s contributions or inputs (e.g education,
intelligence and experience) to one’s outcome and then compare that ratio
with that of a comparison of others.
Whereas Adam’s (1965) theory promotes the use of an equity rule to
determine fairness, there are several other allocation rules have also been
identified, such as equality and need (e.g, Leventhal, 1976). Employees have
been found to apply three basic standards when making distributive justice
judgments: equity, equality and need (Chen & Church, 1993).
___________________________________________________________________________
___________________________________________________________________________
Page 20 of 183
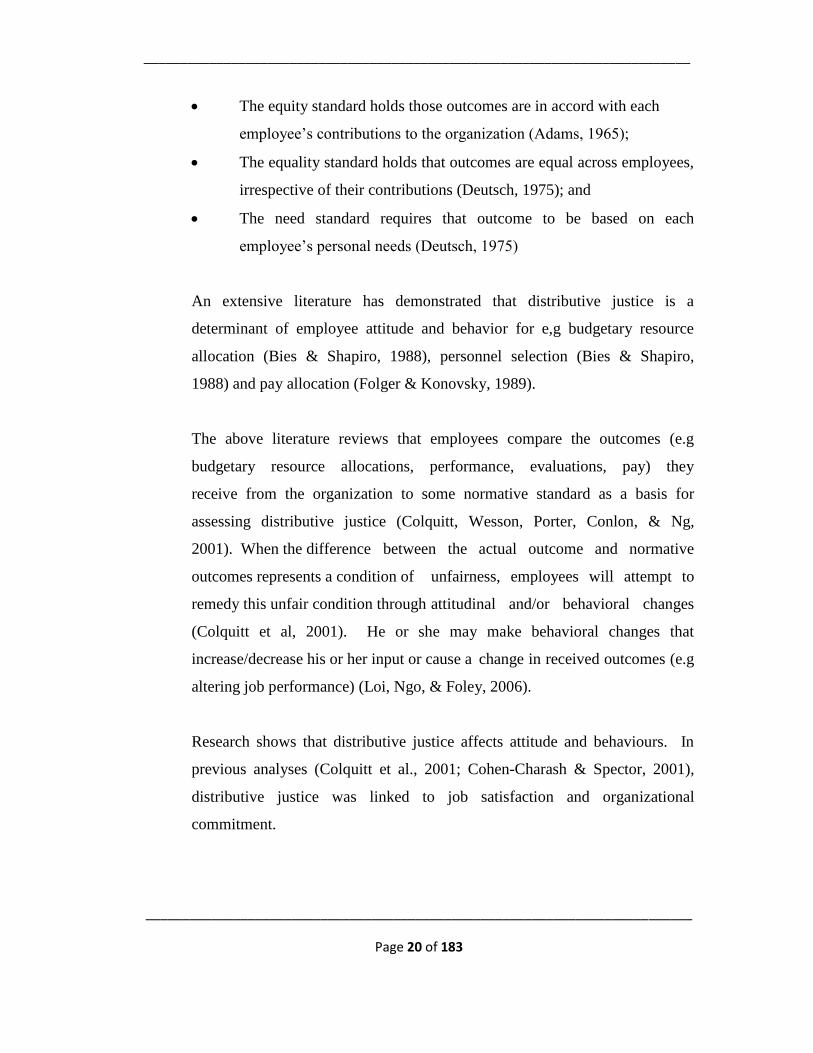
The equity standard holds those outcomes are in accord with each
employee’s contributions to the organization (Adams, 1965);
The equality standard holds that outcomes are equal across employees,
irrespective of their contributions (Deutsch, 1975); and
The need standard requires that outcome to be based on each
employee’s personal needs (Deutsch, 1975)
An extensive literature has demonstrated that distributive justice is a
determinant of employee attitude and behavior for e,g budgetary resource
allocation (Bies & Shapiro, 1988), personnel selection (Bies & Shapiro,
1988) and pay allocation (Folger & Konovsky, 1989).
The above literature reviews that employees compare the outcomes (e.g
budgetary resource allocations, performance, evaluations, pay) they
receive from the organization to some normative standard as a basis for
assessing distributive justice (Colquitt, Wesson, Porter, Conlon, & Ng,
2001). When the difference between the actual outcome and normative
outcomes represents a condition of unfairness, employees will attempt to
remedy this unfair condition through attitudinal and/or behavioral changes
(Colquitt et al, 2001). He or she may make behavioral changes that
increase/decrease his or her input or cause a change in received outcomes (e.g
altering job performance) (Loi, Ngo, & Foley, 2006).
Research shows that distributive justice affects attitude and behaviours. In
previous analyses (Colquitt et al., 2001; Cohen-Charash & Spector, 2001),
distributive justice was linked to job satisfaction and organizational
commitment.
___________________________________________________________________________
___________________________________________________________________________
Page 21 of 183
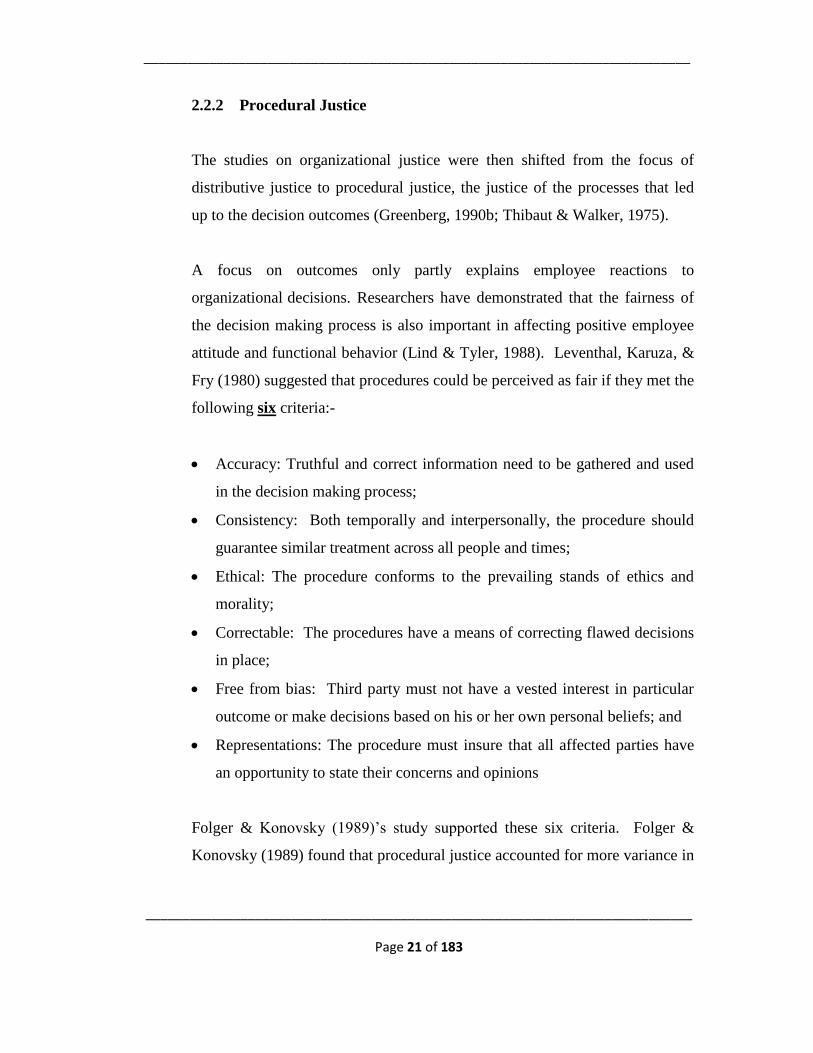
2.2.2 Procedural Justice
The studies on organizational justice were then shifted from the focus of
distributive justice to procedural justice, the justice of the processes that led
up to the decision outcomes (Greenberg, 1990b; Thibaut & Walker, 1975).
A focus on outcomes only partly explains employee reactions to
organizational decisions. Researchers have demonstrated that the fairness of
the decision making process is also important in affecting positive employee
attitude and functional behavior (Lind & Tyler, 1988). Leventhal, Karuza, &
Fry (1980) suggested that procedures could be perceived as fair if they met the
following six criteria:-
Accuracy: Truthful and correct information need to be gathered and used
in the decision making process;
Consistency: Both temporally and interpersonally, the procedure should
guarantee similar treatment across all people and times;
Ethical: The procedure conforms to the prevailing stands of ethics and
morality;
Correctable: The procedures have a means of correcting flawed decisions
in place;
Free from bias: Third party must not have a vested interest in particular
outcome or make decisions based on his or her own personal beliefs; and
Representations: The procedure must insure that all affected parties have
an opportunity to state their concerns and opinions
Folger & Konovsky (1989)’s study supported these six criteria. Folger &
Konovsky (1989) found that procedural justice accounted for more variance in
___________________________________________________________________________
___________________________________________________________________________
Page 22 of 183
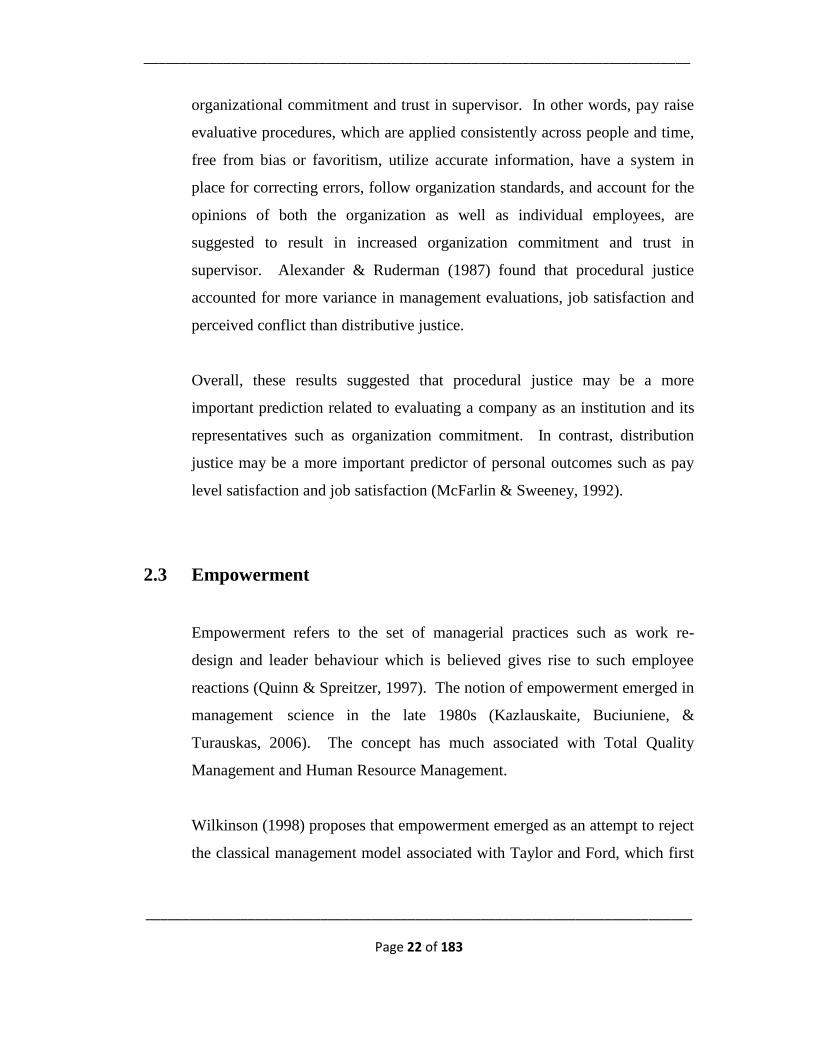
organizational commitment and trust in supervisor. In other words, pay raise
evaluative procedures, which are applied consistently across people and time,
free from bias or favoritism, utilize accurate information, have a system in
place for correcting errors, follow organization standards, and account for the
opinions of both the organization as well as individual employees, are
suggested to result in increased organization commitment and trust in
supervisor. Alexander & Ruderman (1987) found that procedural justice
accounted for more variance in management evaluations, job satisfaction and
perceived conflict than distributive justice.
Overall, these results suggested that procedural justice may be a more
important prediction related to evaluating a company as an institution and its
representatives such as organization commitment. In contrast, distribution
justice may be a more important predictor of personal outcomes such as pay
level satisfaction and job satisfaction (McFarlin & Sweeney, 1992).
2.3 Empowerment
Empowerment refers to the set of managerial practices such as work re-
design and leader behaviour which is believed gives rise to such employee
reactions (Quinn & Spreitzer, 1997). The notion of empowerment emerged in
management science in the late 1980s (Kazlauskaite, Buciuniene, &
Turauskas, 2006). The concept has much associated with Total Quality
Management and Human Resource Management.
Wilkinson (1998) proposes that empowerment emerged as an attempt to reject
the classical management model associated with Taylor and Ford, which first
___________________________________________________________________________
___________________________________________________________________________
Page 23 of 183
and foremost, relied on the standardization of production, economy of scale,
and labour division. According to Wilkinson (1998), there are two main
sources of empowerment. Firstly, the emergence of empowerment was
inspired to some extent by the humanistic approach to management and
increased employee expectations regarding the quality of working life.
Secondly, the shift to customized production and flattening of organizational
structures has to led to a considerably greater focus on people as a resource
and necessity to give the latter more decision making authority in meeting
customer needs and expectations.
Conger & Kanungo (1988) distinguished two empowerment constructs:
relational and motivational. They define the first one as a process of sharing
power i.e formal authority or control over an organization’s resources, with
subordinates. From this perspective, empowerment is viewed as the
implementation of certain organizational processes. As a motivational
construct, empowerment is defined as “a process of enhancing feelings of
self-efficacy among organizational members through the identification of
conditions that foster powerlessness and through their removal by both formal
organizational practices and informal techniques of providing efficacy
information” (Conger & Kanungo, 1988, p.474)
Thomas & Velthouse (1990) further developed Conger & Kanungo’s
motivational approach to empowerment. They proposed the idea of
empowerment being a multifaceted concept and defined it as intrinsic task
motivation consisting of four cognitive components: impact, competence,
meaningfulness, and choice (the latter was termed by Spreitzer (1995a) as
self-determination). In their model, impact refers to the degree to which an
employee can influence outcomes at work; competence indicated
___________________________________________________________________________
___________________________________________________________________________
Page 24 of 183
meaningfulness concerns the value of the task goal as perceived by an
individual in relation to his/her own ideals or standards; and choice is
understood as an employee’s causal responsibility for his/her actions
(Thomas & Velthouse, 1990).
Menon (2001) argued that the concept of empowerment means a lot more than
a simple managerial practice of delegation suggests grouping different
approaches to empowerment under three broad categories: act (giving power
to employees, process (processes leading to empowerment), and psychological
state. Hence, the act of empowering concerns the employer while the process
and state perspectives focus on the employee.
The practice of empowerment in an organization entails the delegation of
decision making responsibilities down the hierarchical levels, which
incorporates job redesign where it allows the employees more autonomy to
make decisions about how they go about their daily activities and control over
their work (Carless, 2004). For this reason, empowerment is described as
“high involvement” management (Spreitzer, 1996) as it includes many other
initiatives such as job enrichment, self-management, teamwork quality circles
and total quality management.
The motive of empowerment is very clear which is to enhance effectiveness at
work. It is through empowerment practice, organization hope to promote
motivation, initiative, implicit knowledge, flexibility, involvement and
commitment required from employees (Foy, 1994; Lawler, 1992). Research
found that empowering management practices demonstrate stronger job
satisfaction and organizational commitment, and thus empowerment helps to
___________________________________________________________________________
___________________________________________________________________________
Page 25 of 183
lead to lower turnover intention (Humborstad & Perry, 2011; Kazlauskaite et
al., 2006)
2.4 Perceived Alternatives Employment Opportunities
Perceived alternative employment opportunities refers to an individual’s
perception of the availability of alternative jobs in the organization’s
environment (Price & Mueller, 1986), and it is the function of labour market
conditions. Research has substantiated that the perceptions or expectations of
finding a different job have upon the turnover decision (e.g Hom & Griffeth,
1988). Generally, people do not engage in job search activities unless they
expect that it will be successful.
Another perspective by Rothwell & Arnold (2007), coined the term perceived
employability which concerns the individual’s belief about how easy it is to
find new employment. It is a parallel with the concepts of perceived ease of
movement (March & Simon, 1958) and perceived alternatives (Mobley,
Griffeth, Hand, & Meglino, 1979). The reason for the commonly assumed
relationship between perceived employability and intention to quit is that
employees may be more inclined to quit when they believe that they can quit
without substantial losses (De Cuyper, Mauno, Kinnunen, & Makikangas,
2011).
In contrast, less employable employees may be less likely to consider quitting
given that acting upon their intention carries the risk of unemployment and
underemployment. The term employability literally combines the word
employment and ability; ability in this case reflecting the employee’s stock of
___________________________________________________________________________
___________________________________________________________________________
Page 26 of 183
skills and competences relative to labour market demand (De Cuyper, Mauno,
Kinnune, & Makikangas, 2011). The concept of perceived employability is
mostly measured in terms of quantity and/or quality of job alternatives (Steel
& Griffeth, 1989).
The argument as to why perceived employability may trigger intention to
quit is grounded on the literature about the changing work life and new career
models (De Cuyper et al., 2011). The changing work life induced feelings of
job insecurity among the workers (De Cuyper & De Witte, 2008). Some of
the workers feel that they can no longer rely on their employer to provide
ongoing employment. They have learned to manage their own career, and to
become “employable”. The workers no longer feel an obligation to be loyal in
exchange for the security offered by the employer, which may stimulate
quitting the organization when other opportunities come along.
2.5 Stress
Every individual experienced stress in their daily life. Stress is a common
element in any kind of job that people do. A mild stress could stimulate
individuals towards higher level of achievement. However, when stress
becomes too severe, it can become dangerous due to its physical,
psychological and behavioural harmful effects on the individual.
The word stress originally derived from the Latin word stringere, which
refers to draw tight, to describe hardships and or affliction (Cartwright &
Cooper, 1997). It occur when individuals’ physical and emotion do not
match with their job demands, constraints and or opportunities (Leka,
___________________________________________________________________________
___________________________________________________________________________
Page 27 of 183
Griffiths, & Cox, 2004). There are two major types of stress which are
eustress (good stress) and distress (bad stress) (Fevre, Matheny, & Kolt, 2003;
Selye, 1984).
Eustress is defined as individuals who have experienced moderate and low
stress levels. Individuals who are experiencing eustress will be able to meet
job demands which lead to positive work life. Distress is defined as
individuals who have experienced high stress levels. Distressed individuals
will not able to meet job demands. The inability to meet job demands could
de-motivate them and subsequently their quality of work life deteriorates
(Fevre, Matheny, & Kolt, 2003; Leka, Griffiths, & Cox, 2004).
According to Selye (1984), individuals constantly strive to achieve a balance
between the good forces of eutress and the destructive forces of distress.
However, an acceptable stress level differs from one person to the other. It
exists within the person’s personal and internal experience, which is the
experience of the individual (Selye, 1984). Hence, stress is an internal
experience of an individual arising from his or her ability to adapt to
internal and external pressure.
According to Materson (1980), there are many causes of stress such as
workload, cuts in staff, change at work, long working hours, lack of
supervision, inadequate training, inappropriate working conditions, too heavy
responsibilities and poor relations with colleagues. Another researcher
Ganster & Logan (2005) identified key factors such as work environment,
management support, workload determines how stressful the work can be and
its effect on employee physical and mental health.
___________________________________________________________________________
___________________________________________________________________________
Page 28 of 183
2.5.1 Occupational Stress
In an organization context, occupational stress is also known as job stress or
work stress. The terms has been used interchangeably, but it refers to the same
meaning (Larson, 2004). Physiological stress and psychological stress are
identified as two major dimension of occupational stress. Physiological stress
is viewed as the physiological reaction of the body such as migraine, chest
pain, sleep disturbance, smoking habits and various kind of stress behaviour
that could trigger at workplace (Crithcley, Rothshtein, Nagai,
O’Doherty, Mathias, & Dolan, 2004). Psychological stress refers to
emotional reaction such as anxiety, burnout, depression and tension as a result
of unable to cope with job demand (Antoniou, Davidson, & Cooper, 2003).
According to Fairbrother & Warn (2003), the ability to manage both
physiological and psychological stresses has significant impact on job
satisfaction. Job satisfaction is higher when the employees have the ability to
control their physiological stress, psychological stress while performing their
job (Antoniou, Davidson, & Cooper, 2003; Fairbrother & Warn, 2003).
According to Siu (2002), there is significant evidence to suggest that chronic
and high levels of occupational stress is related to job dissatisfaction,
absenteeism, stress-related injury and intention to quit. The negative effects
of occupational stress include impaired performance or a reduction in
productivity, diminishing levels of customer service, health problems,
industrial accidents, alcohol and drug use and purposefully destructive
behaviors (Wright & Smye, 1996).
___________________________________________________________________________
___________________________________________________________________________
Page 29 of 183
Bank employees could be under stress due to many antecedents. Occupational
environment organizational structure and policies, role and task demands have
been identified as determining factor in the level of stress (Dhamangadan,
1988). A study conducted by Khattak, Khan, Ayas Ul Haq, Muhammad Arif,
& Minhas (2001) in retail banks suggested that “the workplace is potentially
an important source of stress because of the amount of time they spent in their
respective banks.” Hence, occupation of the individuals could be major source
of stress in the given circumstances.
2.6 Intention to Quit
Intention to quit is a manifestation of actual turnover (Mohd Makhbul, Mohd
Radzuan, & Mohamad Hasun, 2011). Aijen (1991) indicated that intention to
quit act as a predictor to the action of real turnover because of the theory of
planned behaviour. According to the theory, behavioral intention is a good
predictor of an actual intention (Aijen, 1991).
It is learned that intention to quit will lead to actual turnover (Cohen & Golan,
2007; Shore & Martin 1989). Bluedorn (1982) and Price & Mueller (1981)
recommended to use of turnover intention over actual turnover because actual
turnover is more difficult to predict than intentions as there are many external
factors that affect turnover behavior. Intention to quit is probably the most
important and immediate antecedent of turnover intentions (Bluedorn, 1982).
Employees within organization will intend to quit their jobs at some
point in time. When an employee feels that the organization he or she works
for does not fulfill his or her needs anymore (as suggested by Maslow’s
___________________________________________________________________________
___________________________________________________________________________
Page 30 of 183
Hierarchy of Needs, 1943), intention to quit would trigger one’s mind.
According to Carmeli (2005), employees’ intention to quit comprises of
thinking to quit and intention to quit. As the feelings to quit triggered one’s
mind, turnover intentions would be displayed (Hanisch & Hulin, 1991).
Individual’s intention to quit is portrayed through job search behaviours such
as contacting employment agencies, preparing curriculum vitae, submitting
curriculum vitae to various employers and actually attending interviews
(Spector, 1997).
2.7 Conclusion
In this chapter, it covers the review of past studies. Articles are adopted to
construct the theoretical framework and hypotheses. The findings of past
researchers are used to support the postulate hypotheses and relationship
between those variables and mediator. The explanation of research
methodology such as questionnaire design, method analysis and research
instrument will be presented in next chapter.
___________________________________________________________________________
___________________________________________________________________________
Page 31 of 183
CHAPTER THREE
METHODOLOGY
3.0 Introduction
This section will explain the theoretical framework, hypothesis, data and
methodology of our study.
3.1 Theoretical Framework
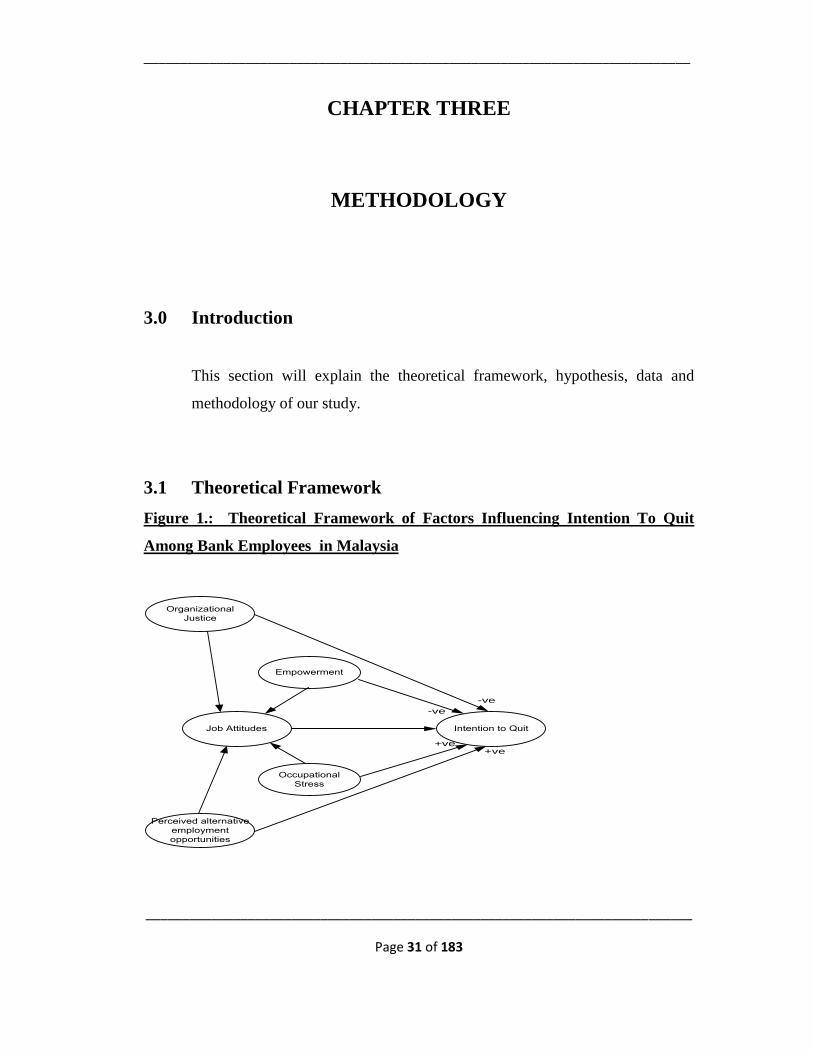
Figure 1.: Theoretical Framework of Factors Influencing Intention To Quit
Among Bank Employees in Malaysia
Organizational
Justice
Empowerment
Job Attitudes Intention to Quit
Occupational
Stress
Perceived alternative
employment
opportunities
-ve
+ve+ve
-ve
___________________________________________________________________________
___________________________________________________________________________
Page 32 of 183
The theoretical framework addresses the relationship between organization
justice, empowerment, perceived alternatives employment opportunities and
occupational stress towards intention to quit. This study will explore if job
attitudes is the mediator towards intention to quit. This study will also explore
the significant difference between age group, number of years with current
organization, education level, gender and intention to quit.
3.2 Hypothesis Development
From the research model discussed above, hypotheses were developed for this
research.
H1: There is a significant difference between age group and intention to quit
(p<0.05)
H2: There is a significant difference between number of years with current
organization and intention to quit (p<0.05)
H3: There is a significant difference between education level and intention to
quit (p<0.05)
H4: There is a significant difference between gender and intention to quit
(p<0.05)
H5: There is a significant relationship between empowerment and intention to
quit (p<0.05)
___________________________________________________________________________
___________________________________________________________________________
Page 33 of 183
H6: There is a significant relationship between organization justice and
intention to quit (p<0.05)
H7: There is a significant relationship between perceived alternative
employment opportunities and intention to quit (p<0.05)
H8: There is a significant relationship between occupational stress and
intention to quit (p<0.05)
H9: Job attitudes will mediate the relationship between empowerment and
intention to quit
H10: Job attitudes will mediate the relationship between organization justice
and intention quit
H11: Job attitudes will mediate the relationship between perceived alternative
employment opportunities and intention to quit
H12: Job attitudes will mediate the relationship between occupational stress
and intention to quit
3.3 Research Design
Research Design is a master plan which acts as a guide in conducting the
research project. The research project is design based on quantitative
approach, which concerning on measuring phenomena by collecting,
___________________________________________________________________________
___________________________________________________________________________
Page 34 of 183
analyzing numerical data and applying statistic test (Hair, Money, Samouel, &
Page, 2007).
This research project is using descriptive and inferential analysis. Descriptive
analysis is used to describe the characteristic of population or phenomena
(Zikmund, 2003). Inferential analysis is used to explain hypothesis.
Inferential analysis provides the bases for predictions, forecasts, and estimate
that are used to transform information into knowledge (Hair, Black, Babin,
Anderson, & Thatham, 2006).
3.4 Data Collection
In this research project, it adopts primary data collection method. It used first
hand data collected through survey questionnaires. The data acquiring
process was segmented into a few stages; namely, identification of areas for
questionnaire distribution, distribution of questionnaires, reminding
respondents of questionnaire dateline, gathering of questionnaire and
analyzing of data.
3.4.1 Primary Data
Primary data were data collected from the original sources for specific
purpose. Attainment of primary data in this research was accomplished
through distribution of questionnaires to Malaysian respondents.
___________________________________________________________________________
___________________________________________________________________________
Page 35 of 183
3.4.2 Secondary Data
Secondary data are existing information, which do not require direct access to
the respondents. These data refers journals of past research works, articles
from media, relevant websites, as well as other periodicals from libraries.
3.5 Sampling Design
3.5.1 Target Population
Target population is the specific, complete groups that are relevant to the
research project (Zikmund, 2003). The aim of this research is to identify the
factor influence intention to quit among bank employees in Malaysia. The
target population for this research will be the employees working in retail
banks in Klang Valley, Malaysia. It will be distributed to 250 bank
employees working in Klang Valley as Klang Valley has the highest
concentration of banks.
3.5.2 Sample Size
Sample size is the number of respondents to be included in the study. The
sample size consists of 250 employees. Factors such as cost and time were
major considerations in choosing the sample size. From the total of 250
questionnaires, 199 were collected (79.6% response rate). Thus, the analysis
will be based on the data from this total number of questionnaires.
___________________________________________________________________________
___________________________________________________________________________
Page 36 of 183
3.5.3 Sampling Technique
According to Hair, Black, Babin, Anderson, & Thatham (2006), there are two
sampling technique in collecting sample which is probability sampling
technique and non-probability sampling technique. Non-probability sampling
is defined as a sampling technique that not every element of the target
population has a chance of being selected, in which units of the sample
selected on the basis of personal judgment or convenience (Hair et al., 2006).
The sampling technique used in this research project is convenience sampling
which is under non-probability sampling. This is a sampling procedure used
to obtain data from those persons who were easily available. This method
is also able to obtain a large number completed questionnaire quickly,
conveniently and economically.
3.6 Research Instrument
Questionnaire survey is the most common method and it has been adopted in
this research project. The questionnaire consists of eight sections (see
Appendix A): Demographic Information (Section I), Empowerment (Section
II), Organization Justice (Section III), perceived alternative employment
opportunities (Section IV), organization commitment (Section V), Job
Satisfaction (Section VI), Occupational Stress (Section VII) and Intention to
Quit (section VIII).
___________________________________________________________________________
___________________________________________________________________________
Page 37 of 183
Section I consists of questions that would provide information about the
respondents. This section of the questionnaires comprised of demographic
data such as gender, age group, education level, number of years with current
organization, working experience and income level.
Section II of the questionnaires contained questions that covered
empowerment. The questionnaires on empowerment were adapted from
Hayes (1994). The respondents were asked to indicate whether empowerment
leads to their intention to quit in each items based on Likert Scale rated
varying from 1 to 5 (1= strongly disagree and 5=strongly agree).
Section III examines organization justice affecting intention to quit. Three
statements: (1) “In my organization, I am fairly rewarded for the amount of
effort I have put in”; (2) “I am able to express my views about my job” and
(3) “I received the evaluation that I deserved” were modified from
Greenberg & Baron (2008). Four statements: (1) “The evaluation
reflected the quality of my performance”; (2) “The company used consistent
standards in evaluating your performance”; (3) “The company gave me
feedback that helped me to learn how well I am doing”; (4) “The company
made clear of what was expected from me as an employee” were adapted
from Magner, Johnson, & Elfrink (1994). One statement “The company
obtained accurate information about my performance” was modified from
Folger & Konovsky (1989).
Section IV deals with the employees’ perceived alternative employment
opportunities towards intention to quit. First statement “If I quit my current
job, the chances that I would be able to find another job which is as good as,
or better than my present one is high” was adapted from Mowday, Koberg, &
___________________________________________________________________________
___________________________________________________________________________
Page 38 of 183
McArthur (1984). Second statement “If I leave this job, I would have
another job as good as this one within one month” was adapted from Billings
& Wemmerus (1983). Third statement “There is no doubt in my mind that I
can find a job that is at least as good as the one I now have” was adapted from
Arnold & Feldman (1982). The statements “Given my age, education, and the
general economic condition, the chance of attaining suitable position in some
other organization is slim” and “The chance of finding another job that
would be acceptable is high” were adapted from Michaels & Spector (1982).
Perceived alternative employment opportunities was measured using
five-point Likert Scale varying from 1 to 5 (1=strongly agree and 5=strongly
disagree) to assess respondents’ perceptions towards alternative employment
opportunities available in the market.
Section V of the questionnaires contained questions that covered organization
commitment. Five statements: (1) “I am willing to put in a great deal of effort
beyond the normal expectation in order to help this organization to be
successful”; (2) “I talk up this organization to my friends as a great
organization to work for”; (3) “I would accept almost any type of job
assignment in order to keep working for this organization”; (4) “I am
extremely glad that I chose this organization to work for over others I was
considering at the time I joined”; (5) I really care about the fate of this
organization were adapted from Mowday, Steers, & Porter (1979). Three
statements: (1) “It would be very hard for me to leave my organization right
now, even I wanted to”; (2) Too much in my life would be disrupted if I
decided I to leave my organizations now”; (3) “I was taught to believe in the
value of remaining loyal to the organization” were adapted from Allen &
Meyer (1990). Respondents indicated on a five-point Likert Scale varying
___________________________________________________________________________
___________________________________________________________________________
Page 39 of 183
from 1 to 5 (1=strongly agree and 5=strongly disagree) on their
commitment towards current organization.
Section VI deals with the employees’ job satisfaction towards their job. The
eight statements from this studies where adapted from Firth, Mellor, Moore,
& Loquet (2004). Job satisfaction was measured using five-point Likert Scale
varying from 1 to 5 (1=very satisfied and 5=strongly dissatisfied) to assess
respondents’ agreement towards their job satisfaction such as salary, job
security, recognition received for work done.
Section VII tends to investigate the degree of occupational stress experience
by the employees towards their job duties and responsibilities. The statements
on the occupational stress were absorbed from Firth, Mellor, Moore, &
Loquet (2004). Occupational stress were measured with eight items (e.g I feel
emotionally drained by my job). Respondents indicated on a five-point Likert
Scale varying from 1 to 5 (1=almost always and 5=almost Never) the degree
to which they experienced each of these occupational stress symptoms.
Section VIII tends to explore the level of intention on employees in quitting
their current job. Respondents are given the option to choose their answers
using Likert Scale varying from 1 to 5 (1=very often and 5==rarely or
never). Three statements “How often do you think of leaving your present
job”; “How likely are you to look for a new job within the next year?” and “I
would consider joining other organization, if the opportunities arise” were
taken from Firth et al, (2004).
___________________________________________________________________________
___________________________________________________________________________
Page 40 of 183
3.6.1 Measurement Scale
There are few type of measurement scales, the most common will be nominal
scale, ordinal scale, interval scale and ratio scale. In this research, nominal
scale, ordinal scale and ratio scale had been used to measure the research
questionnaire.
3.6.1.1 Nominal Scale
A nominal scale uses numbers as labels to identify and classify the
individuals, objects, or events on a scale (Hair et al, 2006). It is the simplest
type of scale by placing data into the related categories. The demographic
information is measured by nominal scale includes gender, highest education
level, and job level.
3.6.1.2 Ordinal Scale
An ordinal scale is a ranking scale (Hair et al., 2006) such as preferences or
rankings. A Likert Scale is also a type of ordinal scale. It allows
respondents to indicate their level of agreement or disagreement such as
“strongly agree”, “agree”, “neutral”, “disagree” and “strongly disagree”. In
this research study, demographic information such as age group is measured
by ordinal scale.
___________________________________________________________________________
___________________________________________________________________________
Page 41 of 183
3.6.1.3 Likert Scale
Likert scale is a level of measurement of attitude designed to allow
respondents to indicate how strongly they agree or disagree with constructed
statement that range from positive to negative towards an attitudinal object
(Zikmund, 2003). Likert (1932) developed the principle of measuring attitude
by requesting respondents to respond to a series of statements about a topic,
the extent to which they agree with them. Usually, five Likert Scale is the
most common and widely used in research questionnaire. The
respondents chose from five alternative options: “strongly disagree”,
“disagree”, “neither agree nor disagree”, “agree” and “strongly agree” from
each statement. Each of the five responses would have a numerical value
which would be used to measure the attitude under study. The value can be
summed up to measure the participant’s overall attitude.
3.7 Pilot Test
A pilot test is a small scale of date collection before the actual data is
collected from respondents. The purpose of pilot test is to ensure that the
questionnaire is fully understood by the respondents. At the same time, it
also identifies problems that may arise as well as to test its reliability and
validity.
In this research project, a pilot test was conducted before the actual survey.
Pilot testing acts as a tool to help researcher in identifying problems and
makes necessary adjustment and amendment.
___________________________________________________________________________
___________________________________________________________________________
Page 42 of 183
3.8 Data Processing
After the collection of data, data were filtered to segregate those incomplete
information or unusable data due to incomplete questionnaires. The
remaining 199 set of questionnaires were used for data processing using
several types of data analysis techniques to convert the quantitative data.
The analysis results allow research to further interpret the data and justify the
hypotheses. All the analyses are done using SPSS 17 computer software
programme as SPSS enables researchers to calculate and analyze the
quantitative data in a more effective and efficient manner. The method of
analysis used in this research includes descriptive analysis, Pearson’s
Bivariate Correlation Analysis, Multiple Linear Regression, One Way
ANOVA Analysis, Independent-Samples T-Test and mediation analysis.
3.8.1 Descriptive Analysis
According to Hair et al. (2006), descriptive statistics include graphical and
numerical procedures that are used to summarize and process data and
transform data into information. In this research study, it is used to analyze
the demographic and general data. The results of descriptive analysis can be
presented using table in the form of bar chart, pie chart, line chart and others
for analysis. In this research project, the descriptive analysis is used to
analyze the respondent’s demographic information.
___________________________________________________________________________
___________________________________________________________________________
Page 43 of 183
3.8.2 Reliability Analysis
Reliability is the degree to which measures are free from errors and therefore
yield consistent results (Zikmund, 2003). Low reliability indicates the
imperfection in the measuring process that influenced the research project in
different ways each time when the measurement is taken (Zikmund, 2003).
The reliability test is to ensure the question asked is able to measure the
variables. Reliability is indicated by Cronbach’s Apha or Coefficient Apha
(Hair, Babin, Money, & Samouel. 2003).
3.8.3 Multiple Regression Analysis
There are two types of regression analyses which is univariate and bivariate
analysis. Bivariate regression analysis is adopted in this research project.
Multiple regression is a type of bivariate regression analysis. Multiple
regression is used to analyze the relationship between a single dependent and
several independent variables. Formula for multiple regression is stated as
follows:-
Y= a+ b1 X1 + b2X2 + b3X3 +….. bnXn
Where: Y= Predicted Variable
a= Constant value, the value of Y when the line cuts Y axis all X
value=0
b= The slope, or change in Y for any corresponding change in one
unit of X
___________________________________________________________________________
___________________________________________________________________________
Page 44 of 183
X= The Variable use to predict Y
The F-statistics is used to determine if the overall regression model is
statistically significant.
3.8.4 Pearson’s Bivariate Correlation Analysis
Correlation is a statistical measure of the co-variation, or association between
two variables (Zikmund, 2003). It indicates the direction and significant of
the bivariate relationship of the variables in the study. The significant or
strength of the relationship can be determined by looking at the (*) or (**)
sign, which mean that there is significant relationship or very significant
relationship between the variables tested.
3.8.5 Comparative Analysis
Comparative analysis requires comparison of pertinent population parameter
for each population. Depending on the number of groups (populations)
involved. Two frequently used statistical techniques are Independent-Samples
T-Test and One-Way ANOVA Analysis.
3.8.5.1 Independent-Samples T-Test
A T-Test is used to test the hypothesis that the mean scores from two samples
of groups such as male and female) on some interval or ration scaled variables
significantly differ from each other. It assumes that the two groups are
normally distributed and that their variance is equal.
___________________________________________________________________________
___________________________________________________________________________
Page 45 of 183
3.8.5.2 One-Way ANOVA Analysis
This method compares the mean of sample more than two populations or
group to determine if the differences are statistically significant. The total
variance observed is placed in two classes namely: within group variations
and between group variation.
In our research project, the One-Way ANOVA analysis is used to analysis the
significance difference of age group, education level and number years with
current organization.
3.8.6 Mediator analysis
The moderating variable is one that has a strong contingent effect on the
independent variable-dependent variable relationship. The presence of a
third variable (the moderating variable) modifies the original relationship
between the independent and the dependent variables (Sekaran & Bougie,
2009).
The Sobel test will be used to analyze the effect carried by the mediator
between independent variables and dependent variable. Before performing
Sobel test, regression analysis needs to be performed.
MacKinnon & Dwyer (1993) outlined three simple steps to test the mediation
effect. Generally the steps require three regression analysis:-
___________________________________________________________________________
___________________________________________________________________________
Page 46 of 183
Conduct a simple regression model on independent variable predicting
the mediator;
Conduct a multiple regression model on independent variable and
mediator predicting the dependent variable
Conduct a simple regression model on independent variable predicting
the dependent variable.
When the third step of regression model is insignificant, it means there is a
pure or full mediation effect. This means that the effect of mediator is too
strong and the independent variable only will affect dependent variable
when the mediator exists. When the independent variable and mediator have
strong effect towards dependent variable, it will be partial mediation effect.
3.9 Conclusions
This chapter consists of the construction of research instrument. It begins
with the methods of analysis from questionnaire design until the type of data
analysis method. In the next chapter, data analysis techniques are performed
to interpret the information collected from the questionnaire surveys. All the
results will be presented in table or chart form to ensure easy
presentation and fast readings.
___________________________________________________________________________
___________________________________________________________________________
Page 47 of 183
CHAPTER 4
RESEARCH RESULT AND FINDING
4.0 Introduction
Chapter 3 has introduced the research instrument on how data were being
conducted and analyzed. In this chapter, researcher will interpret the data
using the selected statistical analysis scale.
All results were obtained from the output of SPSS 17 computation analysis
software. The presentation of the results in this chapter includes descriptive
analysis, simple linear regression and mediation analysis. Conclusion will be
presented at the end of this chapter.
4.1 Descriptive Analysis
Although 250 sets of questionnaires have been distributed but only 199 sets
are completed and returned (79.6% response rate). The rest of the
questionnaires have been filtered due to the reason of incompleteness. In this
section, several profile are presented such as the overview description of
respondents’ demographic information including gender, age group, highest
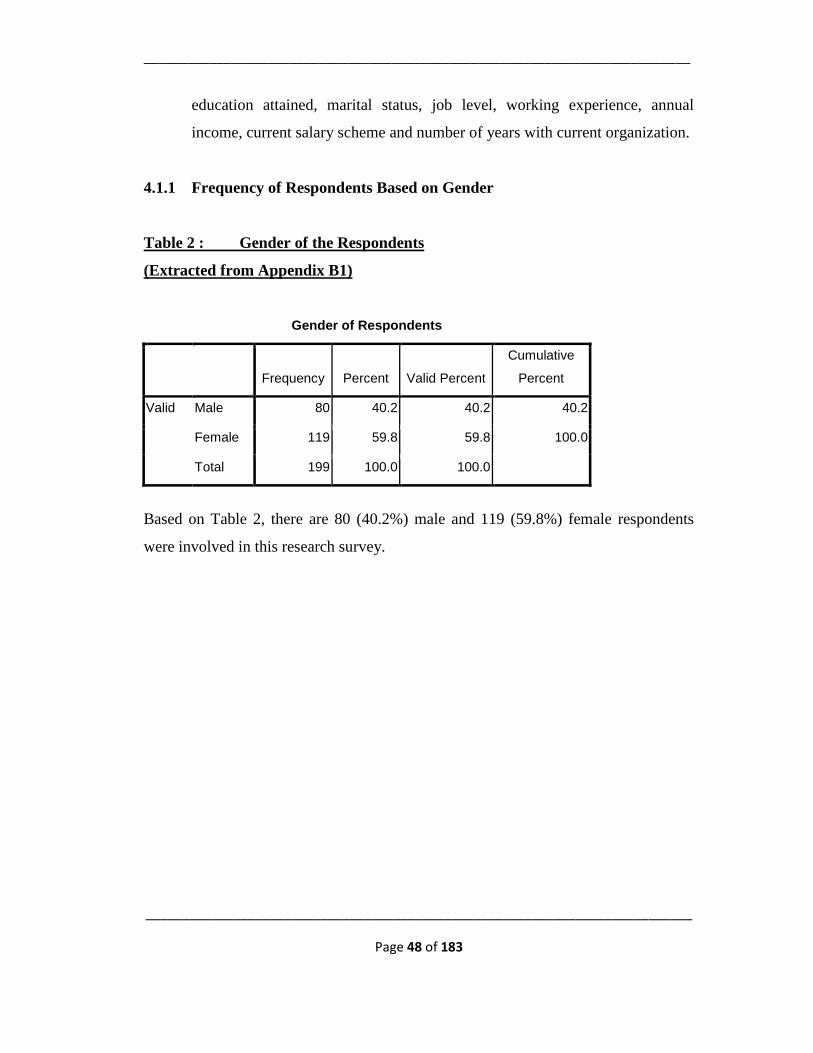
___________________________________________________________________________
___________________________________________________________________________
Page 48 of 183
education attained, marital status, job level, working experience, annual
income, current salary scheme and number of years with current organization.
4.1.1 Frequency of Respondents Based on Gender
Table 2 : Gender of the Respondents
(Extracted from Appendix B1)
Gender of Respondents
Frequency Percent Valid Percent
Cumulative
Percent
Valid Male 80 40.2 40.2 40.2
Female 119 59.8 59.8 100.0
Total 199 100.0 100.0
Based on Table 2, there are 80 (40.2%) male and 119 (59.8%) female respondents
were involved in this research survey.
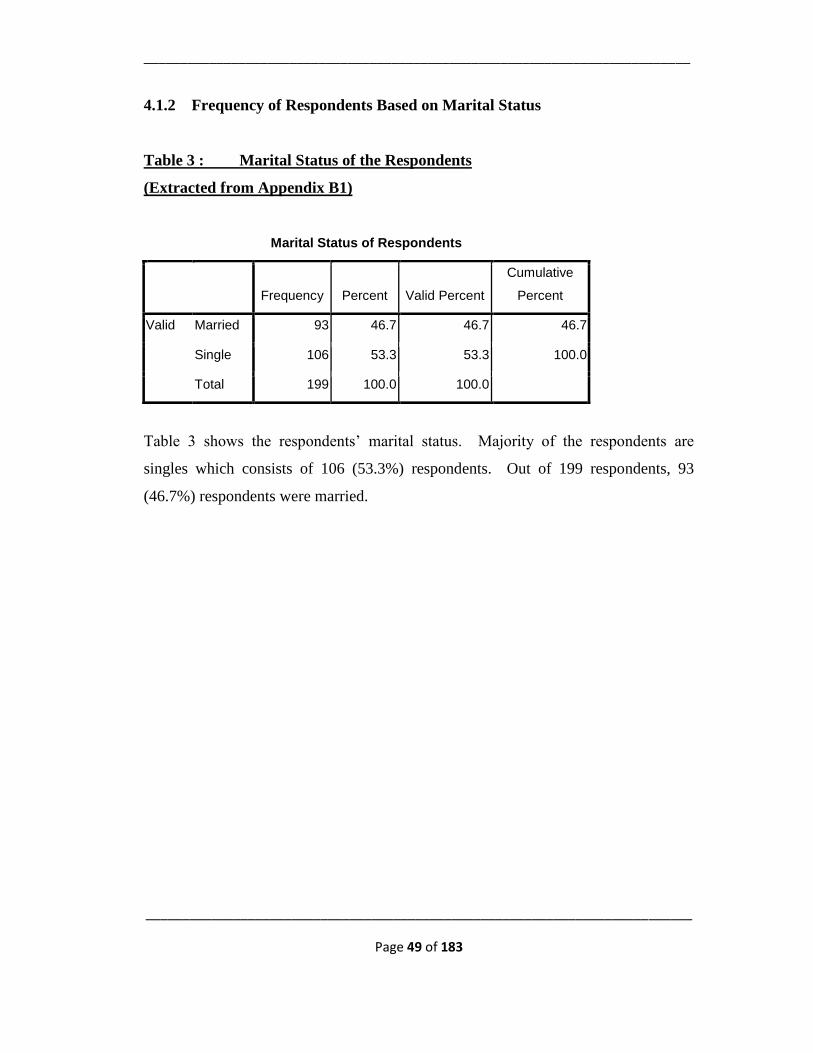
___________________________________________________________________________
___________________________________________________________________________
Page 49 of 183
4.1.2 Frequency of Respondents Based on Marital Status
Table 3 : Marital Status of the Respondents
(Extracted from Appendix B1)
Marital Status of Respondents
Frequency Percent Valid Percent
Cumulative
Percent
Valid Married 93 46.7 46.7 46.7
Single 106 53.3 53.3 100.0
Total 199 100.0 100.0
Table 3 shows the respondents’ marital status. Majority of the respondents are
singles which consists of 106 (53.3%) respondents. Out of 199 respondents, 93
(46.7%) respondents were married.
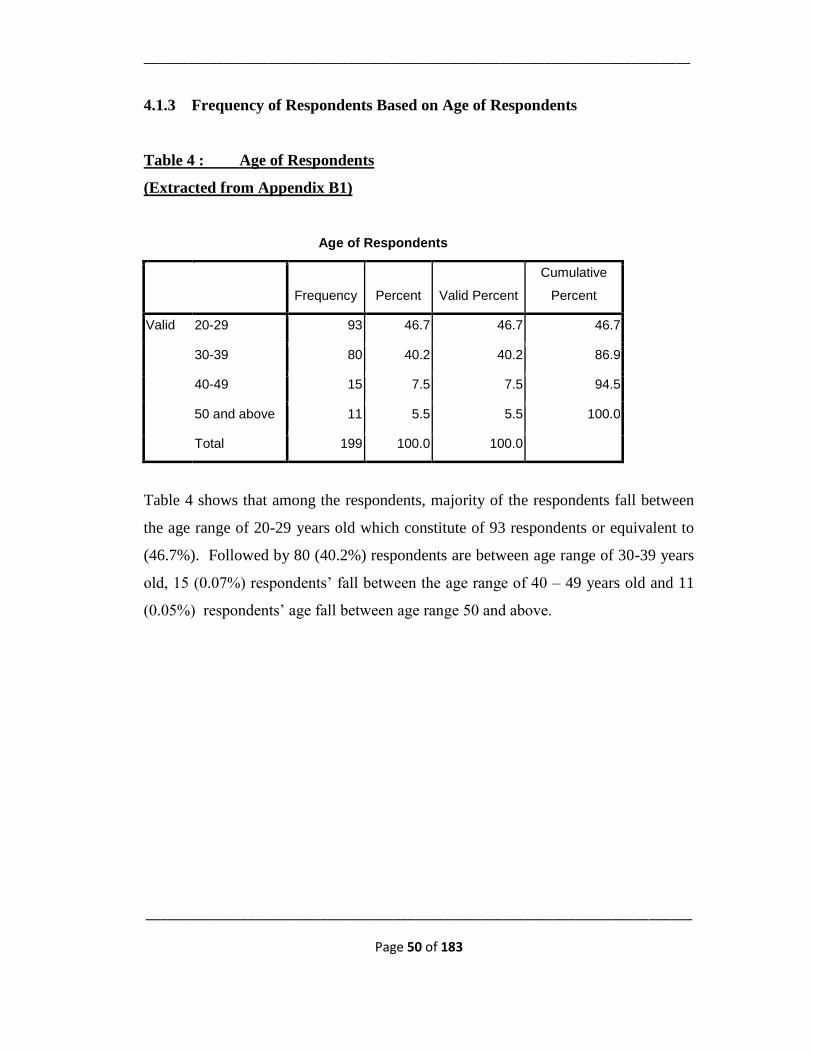
___________________________________________________________________________
___________________________________________________________________________
Page 50 of 183
4.1.3 Frequency of Respondents Based on Age of Respondents
Table 4 : Age of Respondents
(Extracted from Appendix B1)
Age of Respondents
Frequency Percent Valid Percent
Cumulative
Percent
Valid 20-29 93 46.7 46.7 46.7
30-39 80 40.2 40.2 86.9
40-49 15 7.5 7.5 94.5
50 and above 11 5.5 5.5 100.0
Total 199 100.0 100.0
Table 4 shows that among the respondents, majority of the respondents fall between
the age range of 20-29 years old which constitute of 93 respondents or equivalent to
(46.7%). Followed by 80 (40.2%) respondents are between age range of 30-39 years
old, 15 (0.07%) respondents’ fall between the age range of 40 – 49 years old and 11
(0.05%) respondents’ age fall between age range 50 and above.
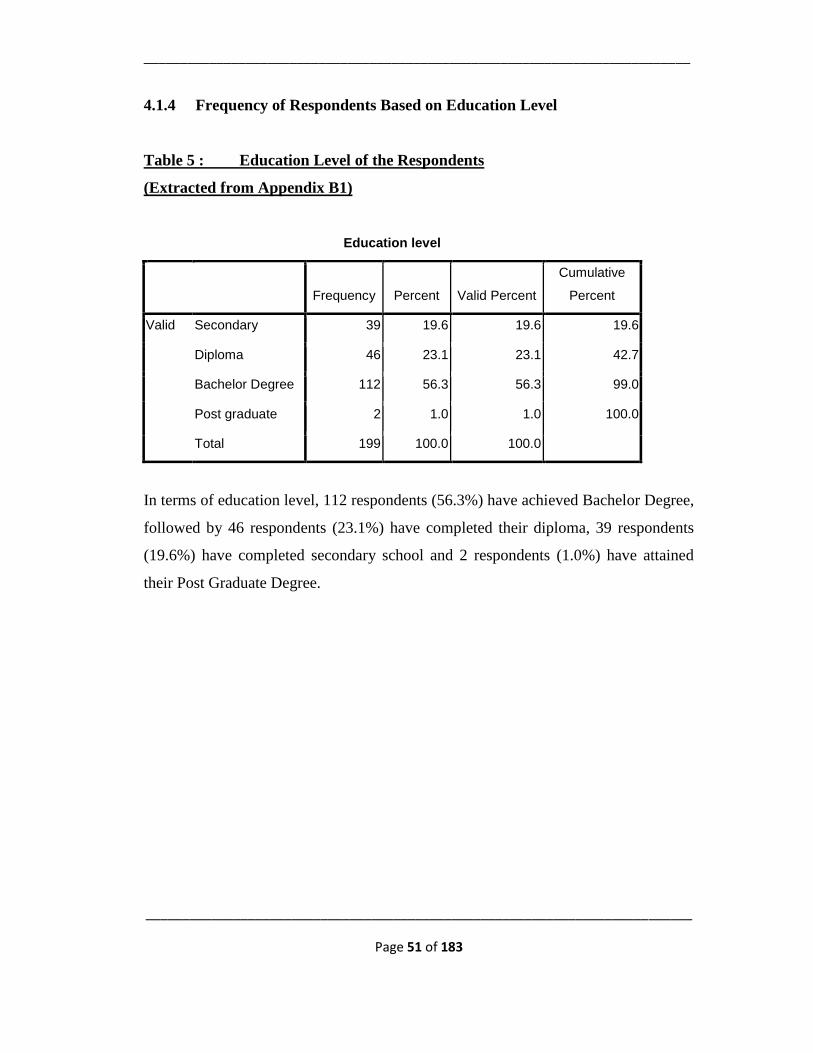
___________________________________________________________________________
___________________________________________________________________________
Page 51 of 183
4.1.4 Frequency of Respondents Based on Education Level
Table 5 : Education Level of the Respondents
(Extracted from Appendix B1)
Education level
Frequency Percent Valid Percent
Cumulative
Percent
Valid Secondary 39 19.6 19.6 19.6
Diploma 46 23.1 23.1 42.7
Bachelor Degree 112 56.3 56.3 99.0
Post graduate 2 1.0 1.0 100.0
Total 199 100.0 100.0
In terms of education level, 112 respondents (56.3%) have achieved Bachelor Degree,
followed by 46 respondents (23.1%) have completed their diploma, 39 respondents
(19.6%) have completed secondary school and 2 respondents (1.0%) have attained
their Post Graduate Degree.
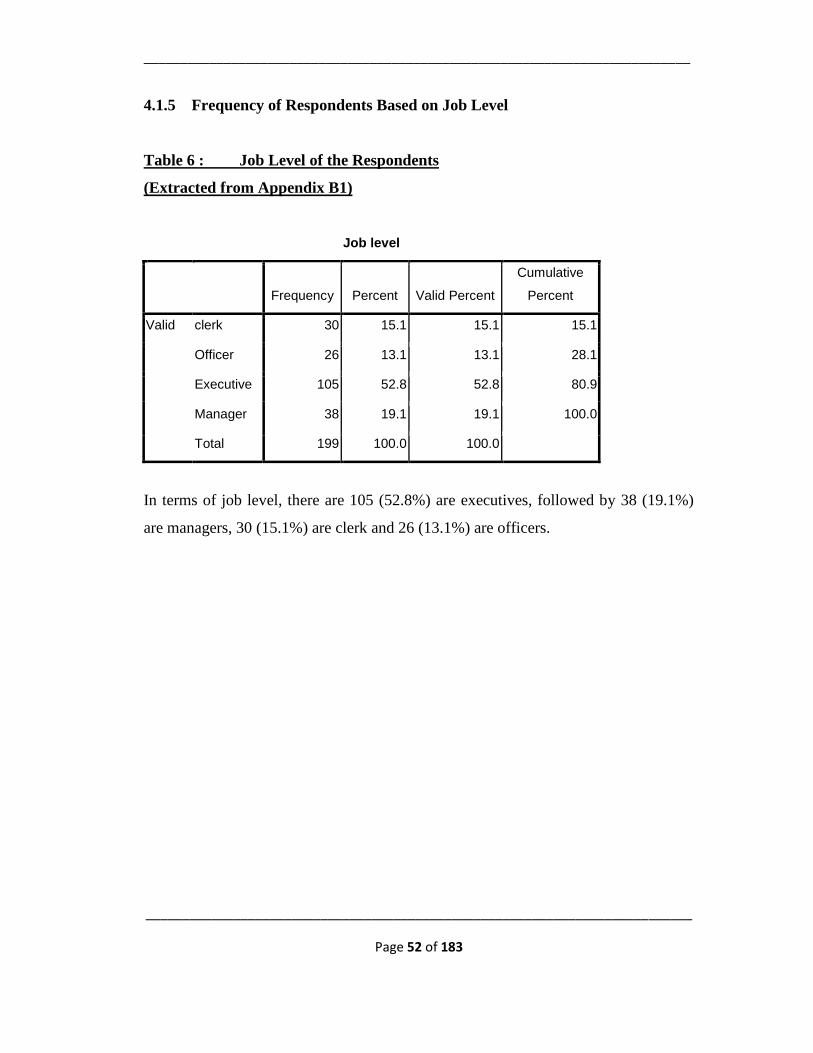
___________________________________________________________________________
___________________________________________________________________________
Page 52 of 183
4.1.5 Frequency of Respondents Based on Job Level
Table 6 : Job Level of the Respondents
(Extracted from Appendix B1)
Job level
Frequency Percent Valid Percent
Cumulative
Percent
Valid clerk 30 15.1 15.1 15.1
Officer 26 13.1 13.1 28.1
Executive 105 52.8 52.8 80.9
Manager 38 19.1 19.1 100.0
Total 199 100.0 100.0
In terms of job level, there are 105 (52.8%) are executives, followed by 38 (19.1%)
are managers, 30 (15.1%) are clerk and 26 (13.1%) are officers.
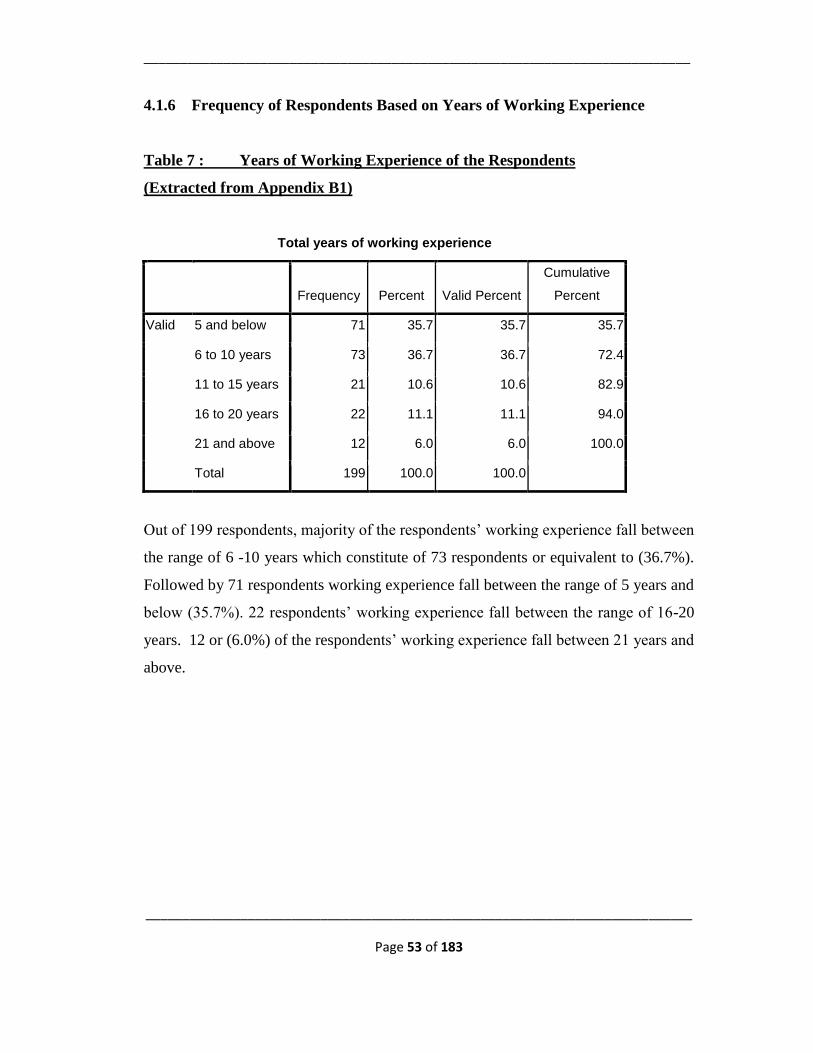
___________________________________________________________________________
___________________________________________________________________________
Page 53 of 183
4.1.6 Frequency of Respondents Based on Years of Working Experience
Table 7 : Years of Working Experience of the Respondents
(Extracted from Appendix B1)
Total years of working experience
Frequency Percent Valid Percent
Cumulative
Percent
Valid 5 and below 71 35.7 35.7 35.7
6 to 10 years 73 36.7 36.7 72.4
11 to 15 years 21 10.6 10.6 82.9
16 to 20 years 22 11.1 11.1 94.0
21 and above 12 6.0 6.0 100.0
Total 199 100.0 100.0
Out of 199 respondents, majority of the respondents’ working experience fall between
the range of 6 -10 years which constitute of 73 respondents or equivalent to (36.7%).
Followed by 71 respondents working experience fall between the range of 5 years and
below (35.7%). 22 respondents’ working experience fall between the range of 16-20
years. 12 or (6.0%) of the respondents’ working experience fall between 21 years and
above.
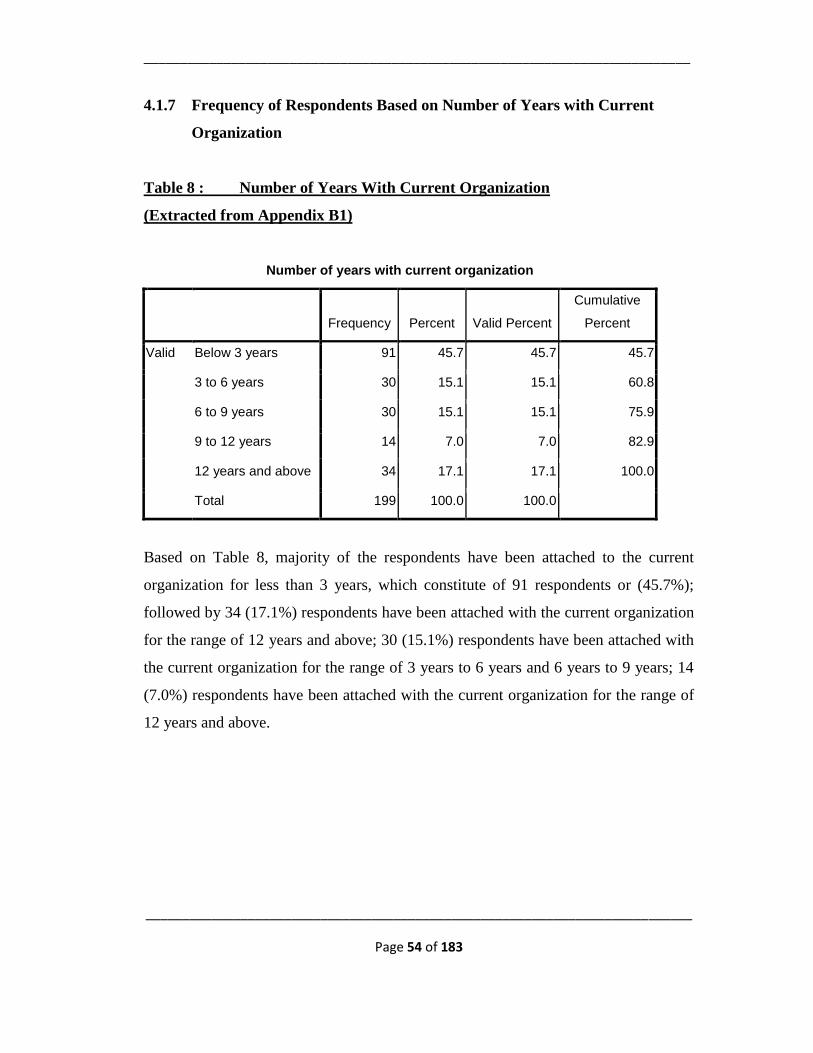
___________________________________________________________________________
___________________________________________________________________________
Page 54 of 183
4.1.7 Frequency of Respondents Based on Number of Years with Current
Organization
Table 8 : Number of Years With Current Organization
(Extracted from Appendix B1)
Number of years with current organization
Frequency Percent Valid Percent
Cumulative
Percent
Valid Below 3 years 91 45.7 45.7 45.7
3 to 6 years 30 15.1 15.1 60.8
6 to 9 years 30 15.1 15.1 75.9
9 to 12 years 14 7.0 7.0 82.9
12 years and above 34 17.1 17.1 100.0
Total 199 100.0 100.0
Based on Table 8, majority of the respondents have been attached to the current
organization for less than 3 years, which constitute of 91 respondents or (45.7%);
followed by 34 (17.1%) respondents have been attached with the current organization
for the range of 12 years and above; 30 (15.1%) respondents have been attached with
the current organization for the range of 3 years to 6 years and 6 years to 9 years; 14
(7.0%) respondents have been attached with the current organization for the range of
12 years and above.
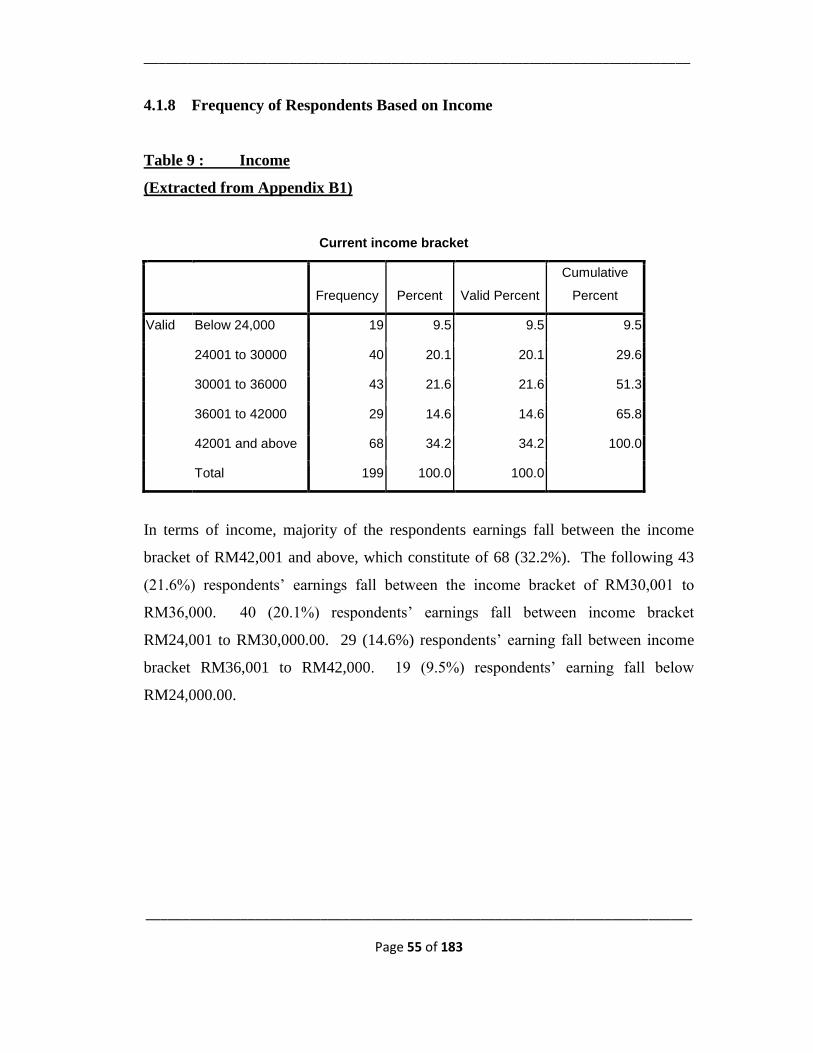
___________________________________________________________________________
___________________________________________________________________________
Page 55 of 183
4.1.8 Frequency of Respondents Based on Income
Table 9 : Income
(Extracted from Appendix B1)
Current income bracket
Frequency Percent Valid Percent
Cumulative
Percent
Valid Below 24,000 19 9.5 9.5 9.5
24001 to 30000 40 20.1 20.1 29.6
30001 to 36000 43 21.6 21.6 51.3
36001 to 42000 29 14.6 14.6 65.8
42001 and above 68 34.2 34.2 100.0
Total 199 100.0 100.0
In terms of income, majority of the respondents earnings fall between the income
bracket of RM42,001 and above, which constitute of 68 (32.2%). The following 43
(21.6%) respondents’ earnings fall between the income bracket of RM30,001 to
RM36,000. 40 (20.1%) respondents’ earnings fall between income bracket
RM24,001 to RM30,000.00. 29 (14.6%) respondents’ earning fall between income
bracket RM36,001 to RM42,000. 19 (9.5%) respondents’ earning fall below
RM24,000.00.
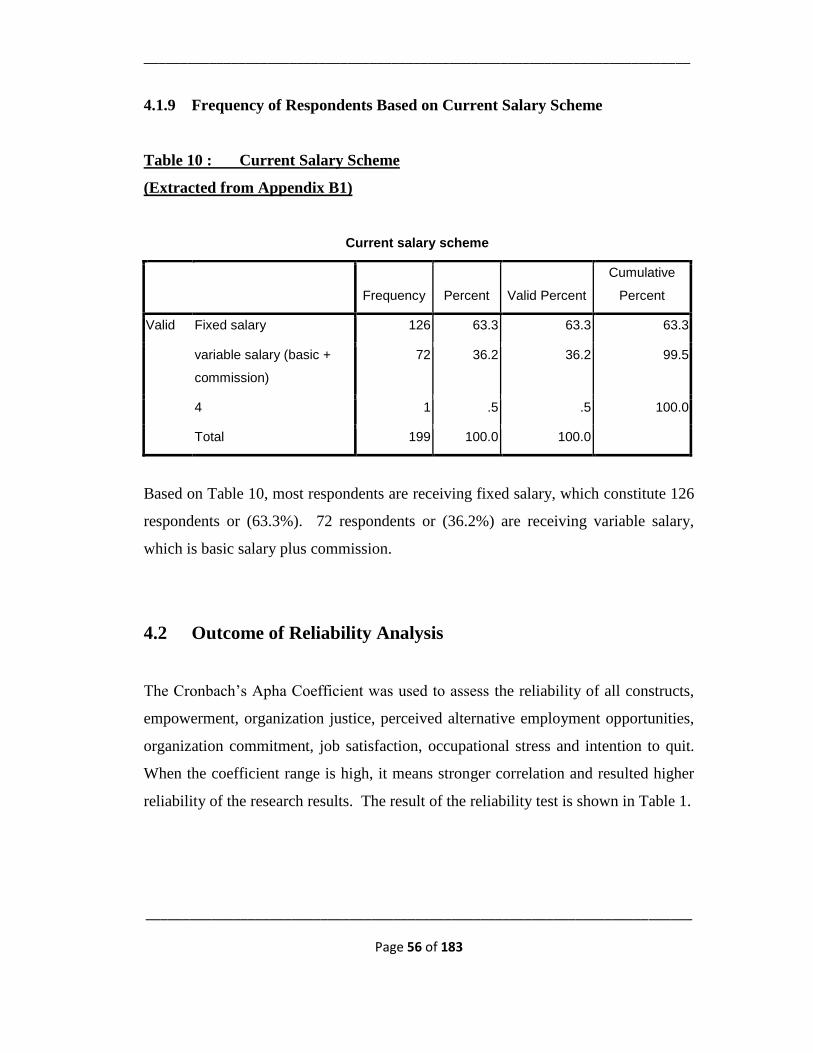
___________________________________________________________________________
___________________________________________________________________________
Page 56 of 183
4.1.9 Frequency of Respondents Based on Current Salary Scheme
Table 10 : Current Salary Scheme
(Extracted from Appendix B1)
Current salary scheme
Frequency Percent Valid Percent
Cumulative
Percent
Valid Fixed salary 126 63.3 63.3 63.3
variable salary (basic +
commission)
72 36.2 36.2 99.5
4 1 .5 .5 100.0
Total 199 100.0 100.0
Based on Table 10, most respondents are receiving fixed salary, which constitute 126
respondents or (63.3%). 72 respondents or (36.2%) are receiving variable salary,
which is basic salary plus commission.
4.2 Outcome of Reliability Analysis
The Cronbach’s Apha Coefficient was used to assess the reliability of all constructs,
empowerment, organization justice, perceived alternative employment opportunities,
organization commitment, job satisfaction, occupational stress and intention to quit.
When the coefficient range is high, it means stronger correlation and resulted higher
reliability of the research results. The result of the reliability test is shown in Table 1.
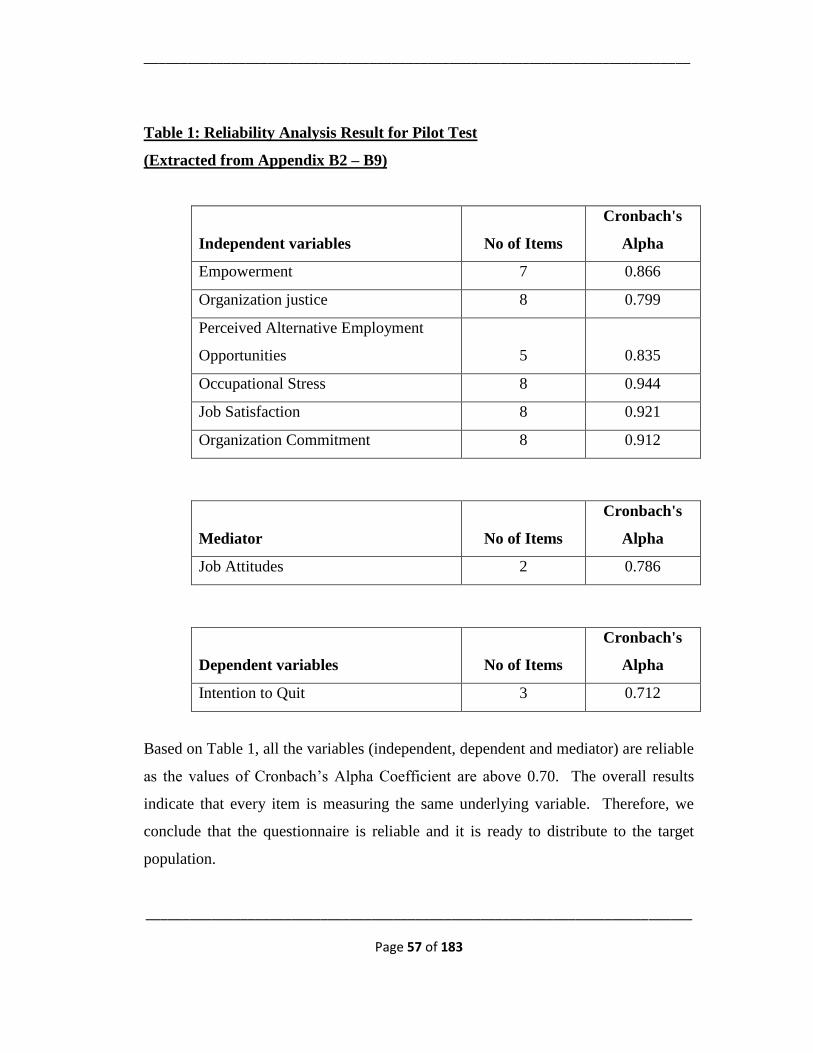
___________________________________________________________________________
___________________________________________________________________________
Page 57 of 183
Table 1: Reliability Analysis Result for Pilot Test
(Extracted from Appendix B2 – B9)
Independent variables No of Items
Cronbach's
Alpha
Empowerment 7 0.866
Organization justice 8 0.799
Perceived Alternative Employment
Opportunities 5 0.835
Occupational Stress 8 0.944
Job Satisfaction 8 0.921
Organization Commitment 8 0.912
Mediator No of Items
Cronbach's
Alpha
Job Attitudes 2 0.786
Dependent variables No of Items
Cronbach's
Alpha
Intention to Quit 3 0.712
Based on Table 1, all the variables (independent, dependent and mediator) are reliable
as the values of Cronbach’s Alpha Coefficient are above 0.70. The overall results
indicate that every item is measuring the same underlying variable. Therefore, we
conclude that the questionnaire is reliable and it is ready to distribute to the target
population.
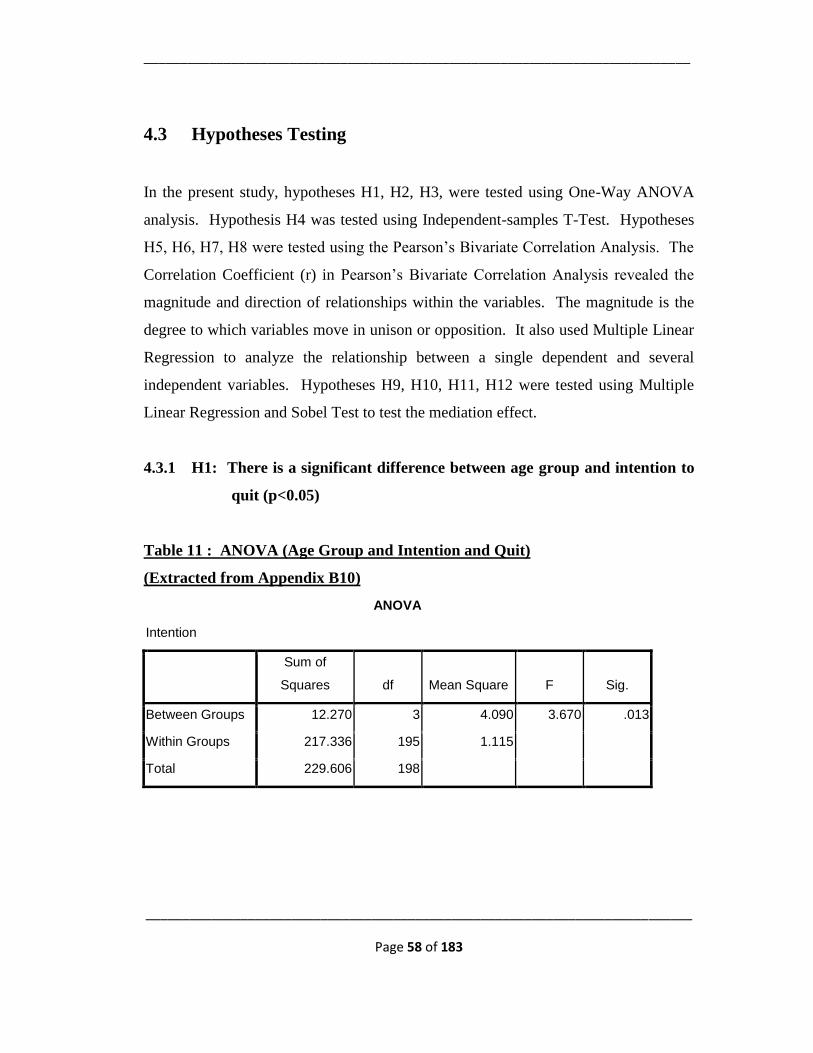
___________________________________________________________________________
___________________________________________________________________________
Page 58 of 183
4.3 Hypotheses Testing
In the present study, hypotheses H1, H2, H3, were tested using One-Way ANOVA
analysis. Hypothesis H4 was tested using Independent-samples T-Test. Hypotheses
H5, H6, H7, H8 were tested using the Pearson’s Bivariate Correlation Analysis. The
Correlation Coefficient (r) in Pearson’s Bivariate Correlation Analysis revealed the
magnitude and direction of relationships within the variables. The magnitude is the
degree to which variables move in unison or opposition. It also used Multiple Linear
Regression to analyze the relationship between a single dependent and several
independent variables. Hypotheses H9, H10, H11, H12 were tested using Multiple
Linear Regression and Sobel Test to test the mediation effect.
4.3.1 H1: There is a significant difference between age group and intention to
quit (p<0.05)
Table 11 : ANOVA (Age Group and Intention and Quit)
(Extracted from Appendix B10)
ANOVA
Intention
Sum of
Squares df Mean Square F Sig.
Between Groups 12.270 3 4.090 3.670 .013
Within Groups 217.336 195 1.115
Total 229.606 198
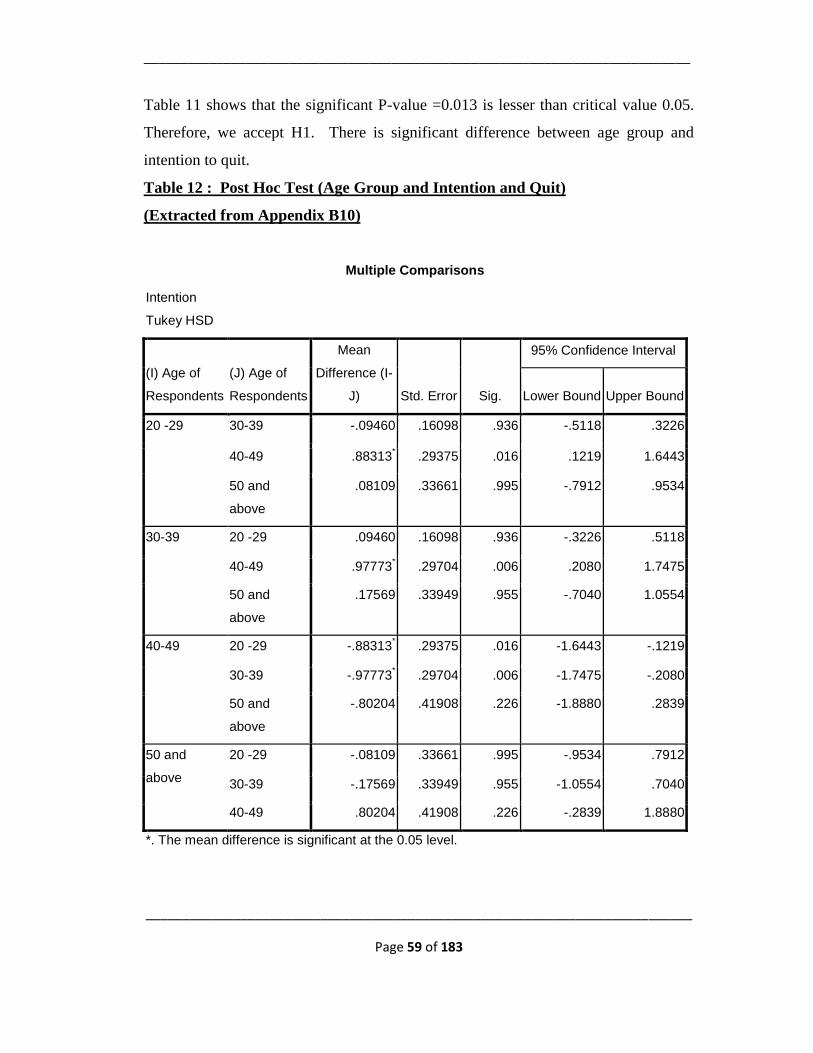
___________________________________________________________________________
___________________________________________________________________________
Page 59 of 183
Table 11 shows that the significant P-value =0.013 is lesser than critical value 0.05.
Therefore, we accept H1. There is significant difference between age group and
intention to quit.
Table 12 : Post Hoc Test (Age Group and Intention and Quit)
(Extracted from Appendix B10)
Multiple Comparisons
Intention
Tukey HSD
(I) Age of
Respondents
(J) Age of
Respondents
Mean
Difference (I-
J) Std. Error Sig.
95% Confidence Interval
Lower Bound Upper Bound
20 -29 30-39 -.09460 .16098 .936 -.5118 .3226
40-49 .88313* .29375 .016 .1219 1.6443
50 and
above
.08109 .33661 .995 -.7912 .9534
30-39 20 -29 .09460 .16098 .936 -.3226 .5118
40-49 .97773* .29704 .006 .2080 1.7475
50 and
above
.17569 .33949 .955 -.7040 1.0554
40-49 20 -29 -.88313* .29375 .016 -1.6443 -.1219
30-39 -.97773* .29704 .006 -1.7475 -.2080
50 and
above
-.80204 .41908 .226 -1.8880 .2839
50 and
above
20 -29 -.08109 .33661 .995 -.9534 .7912
30-39 -.17569 .33949 .955 -1.0554 .7040
40-49 .80204 .41908 .226 -.2839 1.8880
*. The mean difference is significant at the 0.05 level.
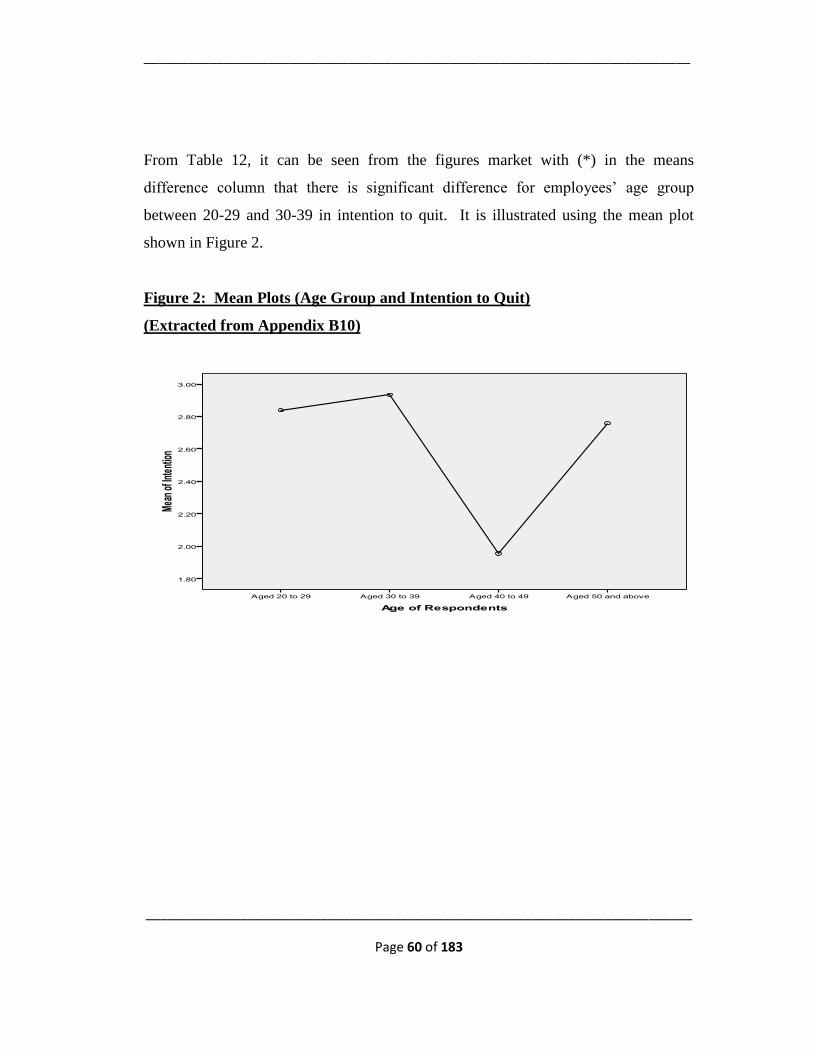
___________________________________________________________________________
___________________________________________________________________________
Page 60 of 183
From Table 12, it can be seen from the figures market with (*) in the means
difference column that there is significant difference for employees’ age group
between 20-29 and 30-39 in intention to quit. It is illustrated using the mean plot
shown in Figure 2.
Figure 2: Mean Plots (Age Group and Intention to Quit)
(Extracted from Appendix B10)
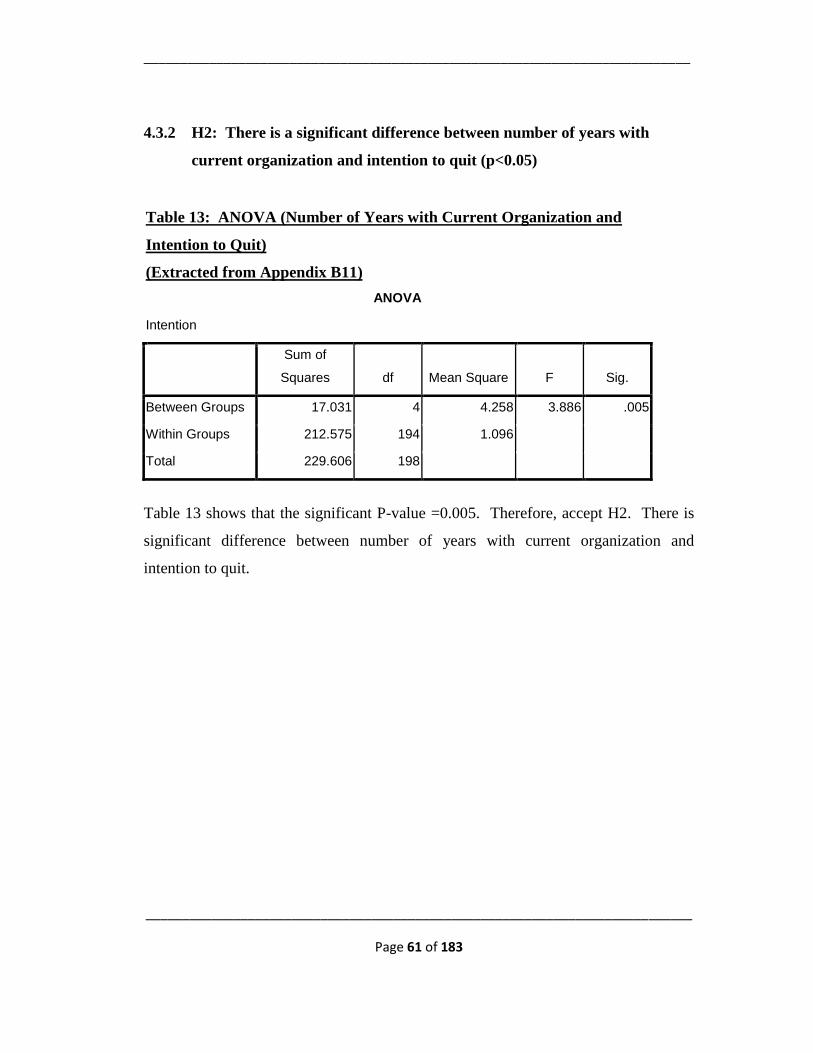
___________________________________________________________________________
___________________________________________________________________________
Page 61 of 183
4.3.2 H2: There is a significant difference between number of years with
current organization and intention to quit (p<0.05)
Table 13: ANOVA (Number of Years with Current Organization and
Intention to Quit)
(Extracted from Appendix B11)
ANOVA
Intention
Sum of
Squares df Mean Square F Sig.
Between Groups 17.031 4 4.258 3.886 .005
Within Groups 212.575 194 1.096
Total 229.606 198
Table 13 shows that the significant P-value =0.005. Therefore, accept H2. There is
significant difference between number of years with current organization and
intention to quit.
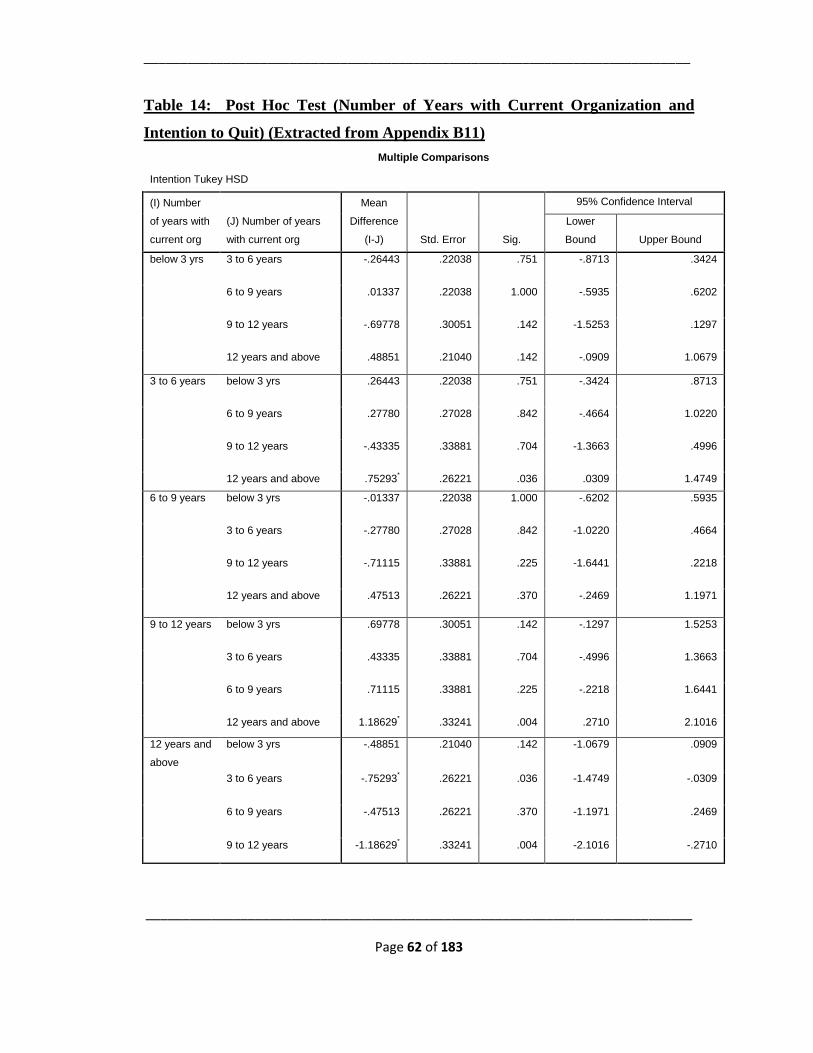
___________________________________________________________________________
___________________________________________________________________________
Page 62 of 183
Table 14: Post Hoc Test (Number of Years with Current Organization and
Intention to Quit) (Extracted from Appendix B11)
Multiple Comparisons
Intention Tukey HSD
(I) Number
of years with
current org
(J) Number of years
with current org
Mean
Difference
(I-J) Std. Error Sig.
95% Confidence Interval
Lower
Bound Upper Bound
below 3 yrs 3 to 6 years -.26443 .22038 .751 -.8713 .3424
6 to 9 years .01337 .22038 1.000 -.5935 .6202
9 to 12 years -.69778 .30051 .142 -1.5253 .1297
12 years and above .48851 .21040 .142 -.0909 1.0679
3 to 6 years below 3 yrs .26443 .22038 .751 -.3424 .8713
6 to 9 years .27780 .27028 .842 -.4664 1.0220
9 to 12 years -.43335 .33881 .704 -1.3663 .4996
12 years and above .75293* .26221 .036 .0309 1.4749
6 to 9 years below 3 yrs -.01337 .22038 1.000 -.6202 .5935
3 to 6 years -.27780 .27028 .842 -1.0220 .4664
9 to 12 years -.71115 .33881 .225 -1.6441 .2218
12 years and above .47513 .26221 .370 -.2469 1.1971
9 to 12 years below 3 yrs .69778 .30051 .142 -.1297 1.5253
3 to 6 years .43335 .33881 .704 -.4996 1.3663
6 to 9 years .71115 .33881 .225 -.2218 1.6441
12 years and above 1.18629* .33241 .004 .2710 2.1016
12 years and
above
below 3 yrs -.48851 .21040 .142 -1.0679 .0909
3 to 6 years -.75293* .26221 .036 -1.4749 -.0309
6 to 9 years -.47513 .26221 .370 -1.1971 .2469
9 to 12 years -1.18629* .33241 .004 -2.1016 -.2710
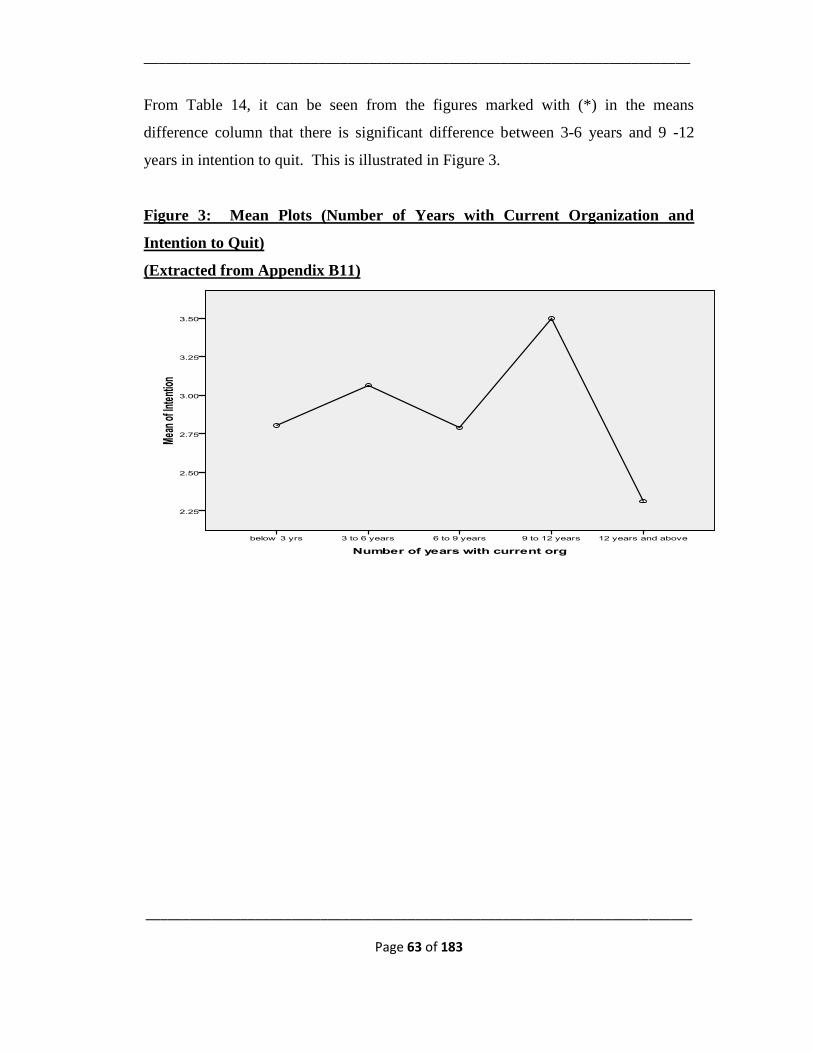
___________________________________________________________________________
___________________________________________________________________________
Page 63 of 183
From Table 14, it can be seen from the figures marked with (*) in the means
difference column that there is significant difference between 3-6 years and 9 -12
years in intention to quit. This is illustrated in Figure 3.
Figure 3: Mean Plots (Number of Years with Current Organization and
Intention to Quit)
(Extracted from Appendix B11)
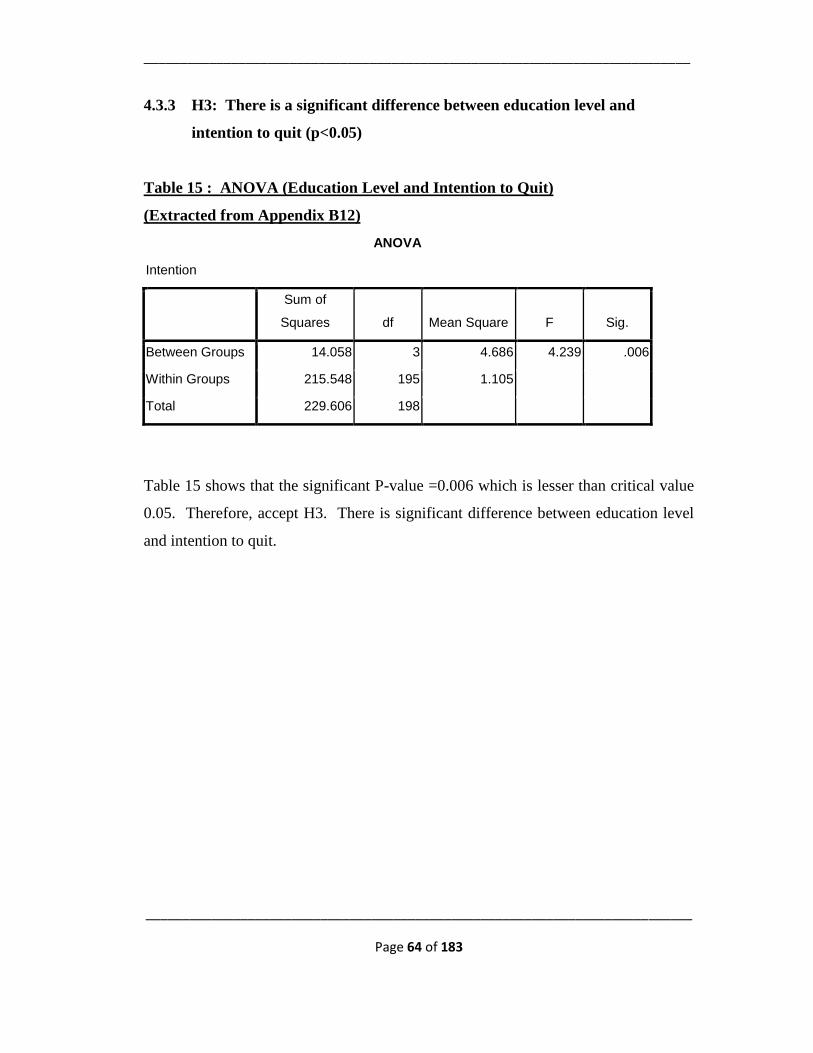
___________________________________________________________________________
___________________________________________________________________________
Page 64 of 183
4.3.3 H3: There is a significant difference between education level and
intention to quit (p<0.05)
Table 15 : ANOVA (Education Level and Intention to Quit)
(Extracted from Appendix B12)
ANOVA
Intention
Sum of
Squares df Mean Square F Sig.
Between Groups 14.058 3 4.686 4.239 .006
Within Groups 215.548 195 1.105
Total 229.606 198
Table 15 shows that the significant P-value =0.006 which is lesser than critical value
0.05. Therefore, accept H3. There is significant difference between education level
and intention to quit.
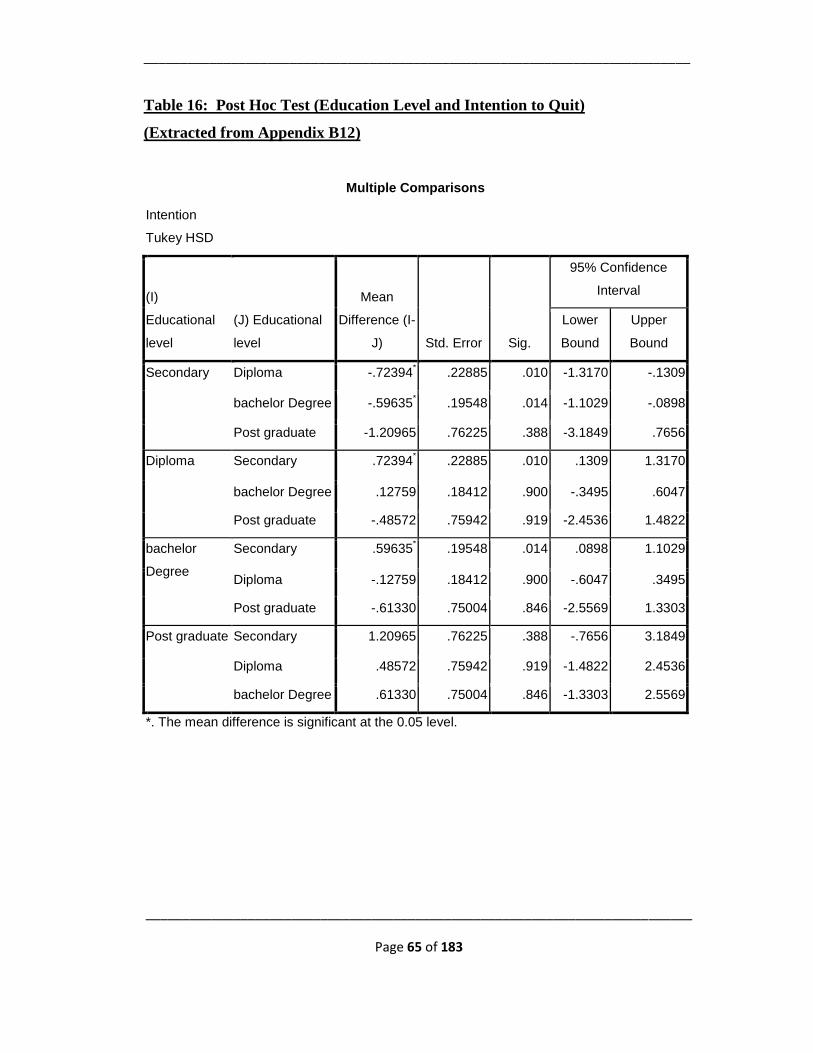
___________________________________________________________________________
___________________________________________________________________________
Page 65 of 183
Table 16: Post Hoc Test (Education Level and Intention to Quit)
(Extracted from Appendix B12)
Multiple Comparisons
Intention
Tukey HSD
(I)
Educational
level
(J) Educational
level
Mean
Difference (I-
J) Std. Error Sig.
95% Confidence
Interval
Lower
Bound
Upper
Bound
Secondary Diploma -.72394* .22885 .010 -1.3170 -.1309
bachelor Degree -.59635* .19548 .014 -1.1029 -.0898
Post graduate -1.20965 .76225 .388 -3.1849 .7656
Diploma Secondary .72394* .22885 .010 .1309 1.3170
bachelor Degree .12759 .18412 .900 -.3495 .6047
Post graduate -.48572 .75942 .919 -2.4536 1.4822
bachelor
Degree
Secondary .59635* .19548 .014 .0898 1.1029
Diploma -.12759 .18412 .900 -.6047 .3495
Post graduate -.61330 .75004 .846 -2.5569 1.3303
Post graduate Secondary 1.20965 .76225 .388 -.7656 3.1849
Diploma .48572 .75942 .919 -1.4822 2.4536
bachelor Degree .61330 .75004 .846 -1.3303 2.5569
*. The mean difference is significant at the 0.05 level.
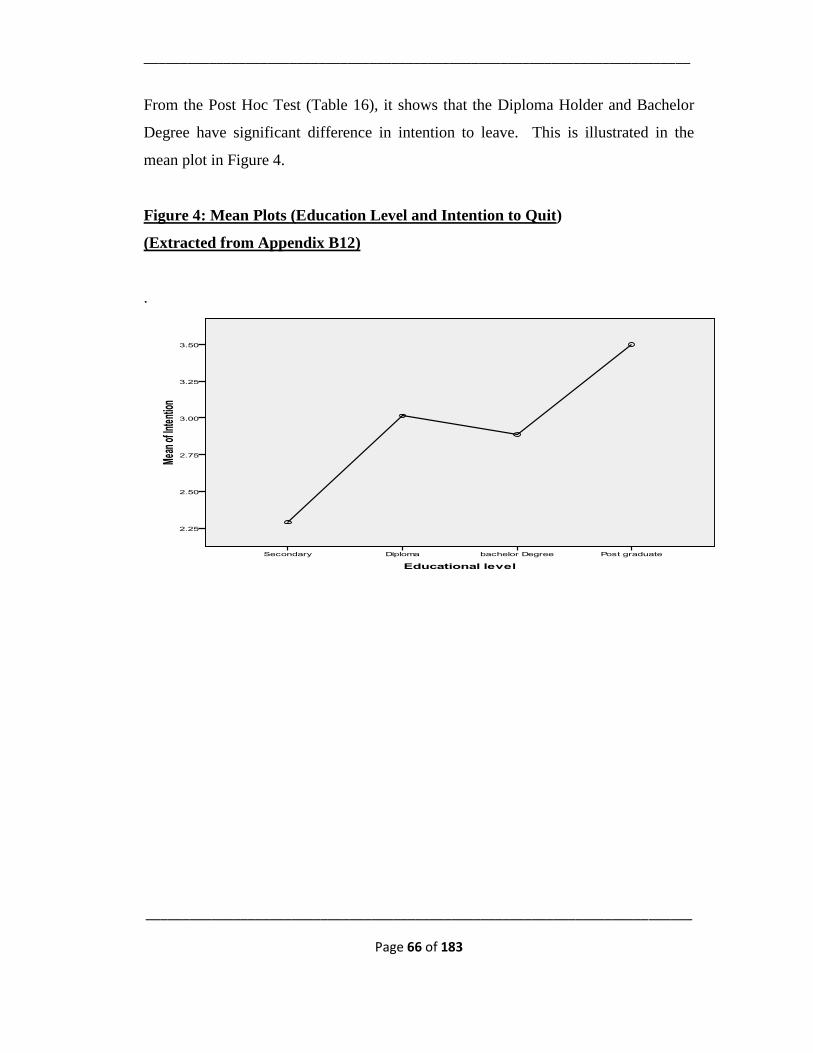
___________________________________________________________________________
___________________________________________________________________________
Page 66 of 183
From the Post Hoc Test (Table 16), it shows that the Diploma Holder and Bachelor
Degree have significant difference in intention to leave. This is illustrated in the
mean plot in Figure 4.
Figure 4: Mean Plots (Education Level and Intention to Quit)
(Extracted from Appendix B12)
.
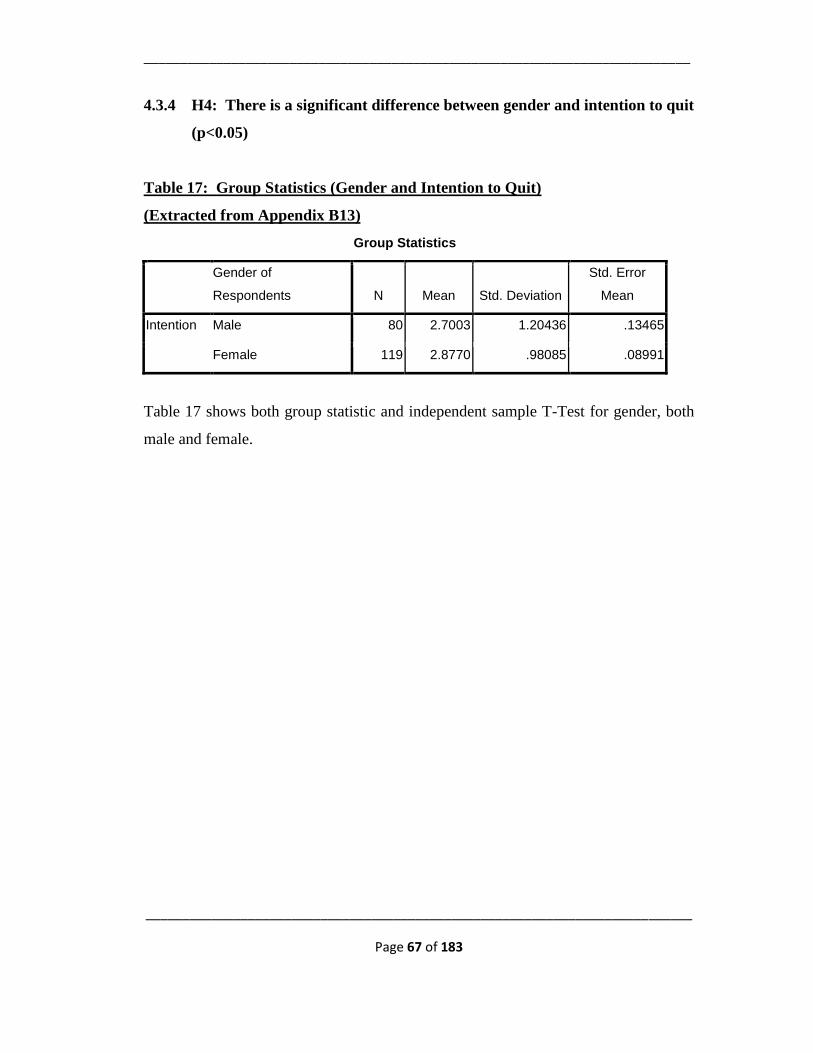
___________________________________________________________________________
___________________________________________________________________________
Page 67 of 183
4.3.4 H4: There is a significant difference between gender and intention to quit
(p<0.05)
Table 17: Group Statistics (Gender and Intention to Quit)
(Extracted from Appendix B13)
Group Statistics
Gender of
Respondents N Mean Std. Deviation
Std. Error
Mean
Intention Male 80 2.7003 1.20436 .13465
Female 119 2.8770 .98085 .08991
Table 17 shows both group statistic and independent sample T-Test for gender, both
male and female.
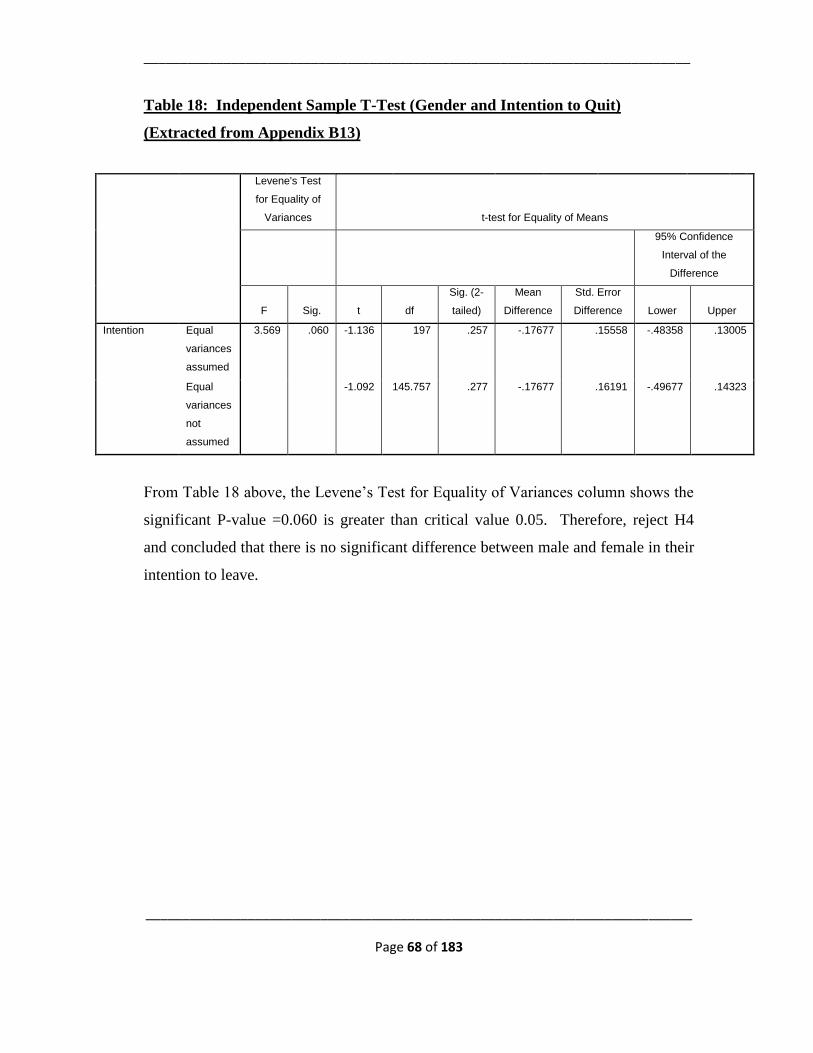
___________________________________________________________________________
___________________________________________________________________________
Page 68 of 183
Table 18: Independent Sample T-Test (Gender and Intention to Quit)
(Extracted from Appendix B13)
Levene's Test
for Equality of
Variances t-test for Equality of Means
95% Confidence
Interval of the
Difference
F Sig. t df
Sig. (2-
tailed)
Mean
Difference
Std. Error
Difference Lower Upper
Intention Equal
variances
assumed
3.569 .060 -1.136 197 .257 -.17677 .15558 -.48358 .13005
Equal
variances
not
assumed
-1.092 145.757 .277 -.17677 .16191 -.49677 .14323
From Table 18 above, the Levene’s Test for Equality of Variances column shows the
significant P-value =0.060 is greater than critical value 0.05. Therefore, reject H4
and concluded that there is no significant difference between male and female in their
intention to leave.
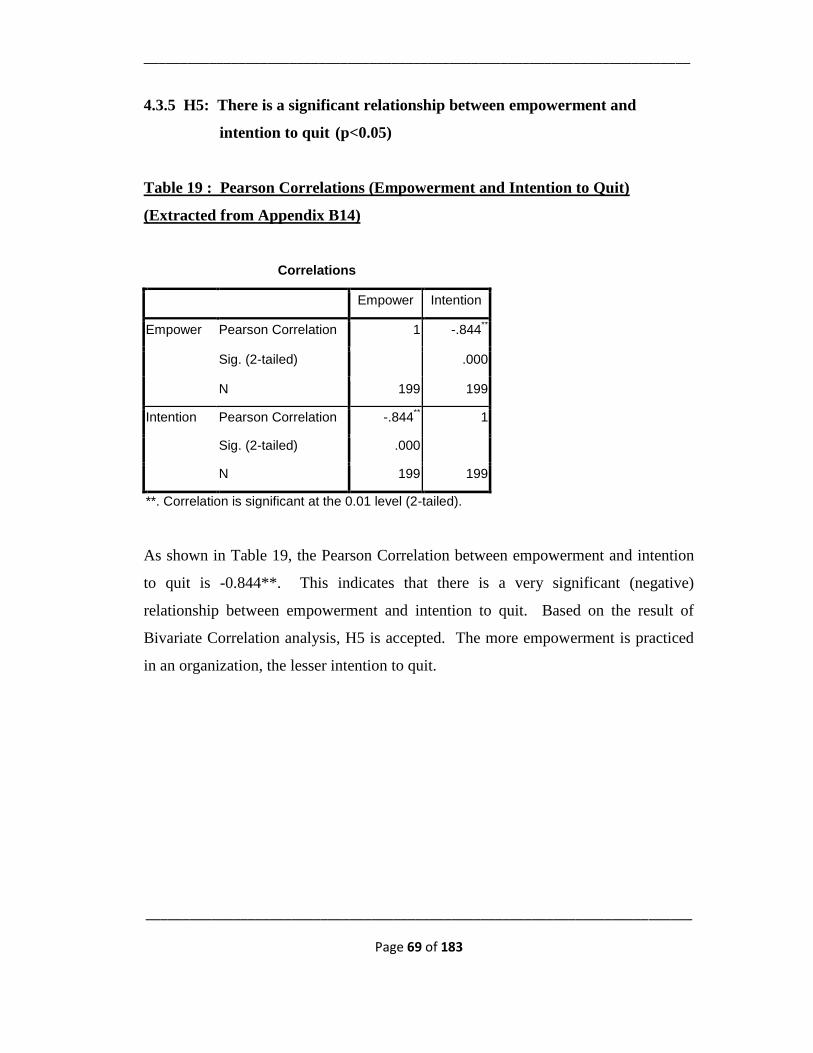
___________________________________________________________________________
___________________________________________________________________________
Page 69 of 183
4.3.5 H5: There is a significant relationship between empowerment and
intention to quit (p<0.05)
Table 19 : Pearson Correlations (Empowerment and Intention to Quit)
(Extracted from Appendix B14)
Correlations
Empower Intention
Empower Pearson Correlation 1 -.844**
Sig. (2-tailed) .000
N 199 199
Intention Pearson Correlation -.844** 1
Sig. (2-tailed) .000
N 199 199
**. Correlation is significant at the 0.01 level (2-tailed).
As shown in Table 19, the Pearson Correlation between empowerment and intention
to quit is -0.844**. This indicates that there is a very significant (negative)
relationship between empowerment and intention to quit. Based on the result of
Bivariate Correlation analysis, H5 is accepted. The more empowerment is practiced
in an organization, the lesser intention to quit.
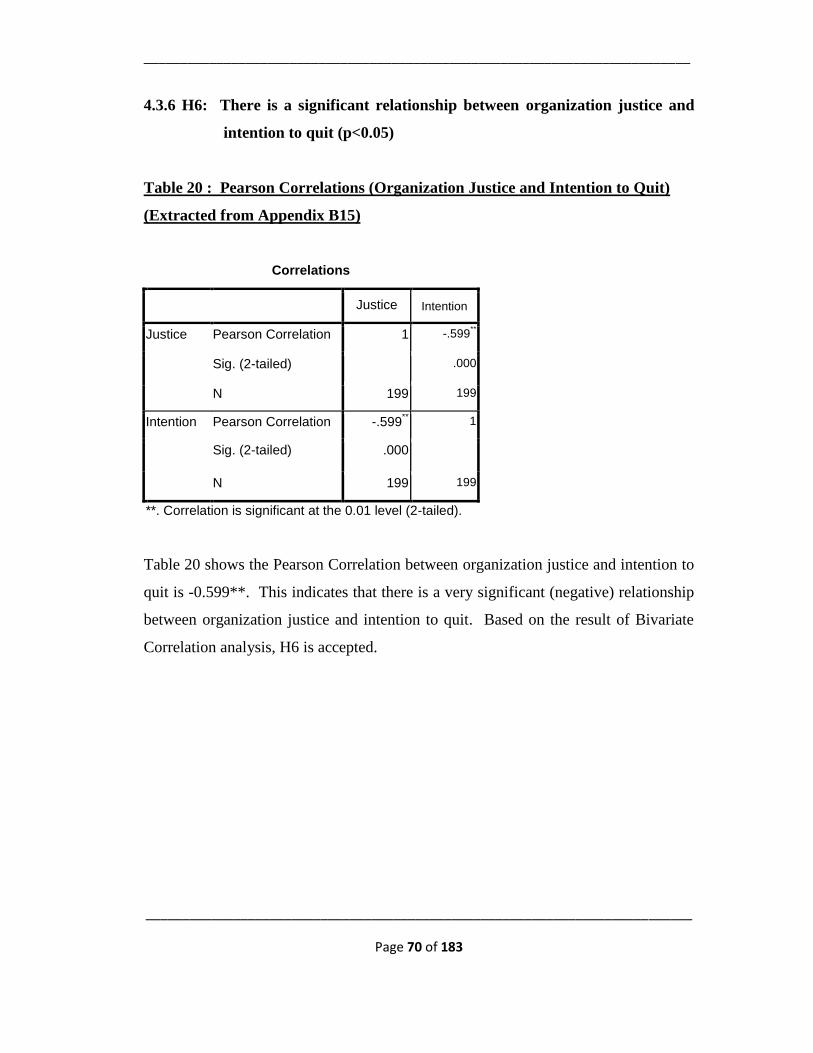
___________________________________________________________________________
___________________________________________________________________________
Page 70 of 183
4.3.6 H6: There is a significant relationship between organization justice and
intention to quit (p<0.05)
Table 20 : Pearson Correlations (Organization Justice and Intention to Quit)
(Extracted from Appendix B15)
Correlations
Justice Intention
Justice Pearson Correlation 1 -.599**
Sig. (2-tailed) .000
N 199 199
Intention Pearson Correlation -.599** 1
Sig. (2-tailed) .000
N 199 199
**. Correlation is significant at the 0.01 level (2-tailed).
Table 20 shows the Pearson Correlation between organization justice and intention to
quit is -0.599**. This indicates that there is a very significant (negative) relationship
between organization justice and intention to quit. Based on the result of Bivariate
Correlation analysis, H6 is accepted.
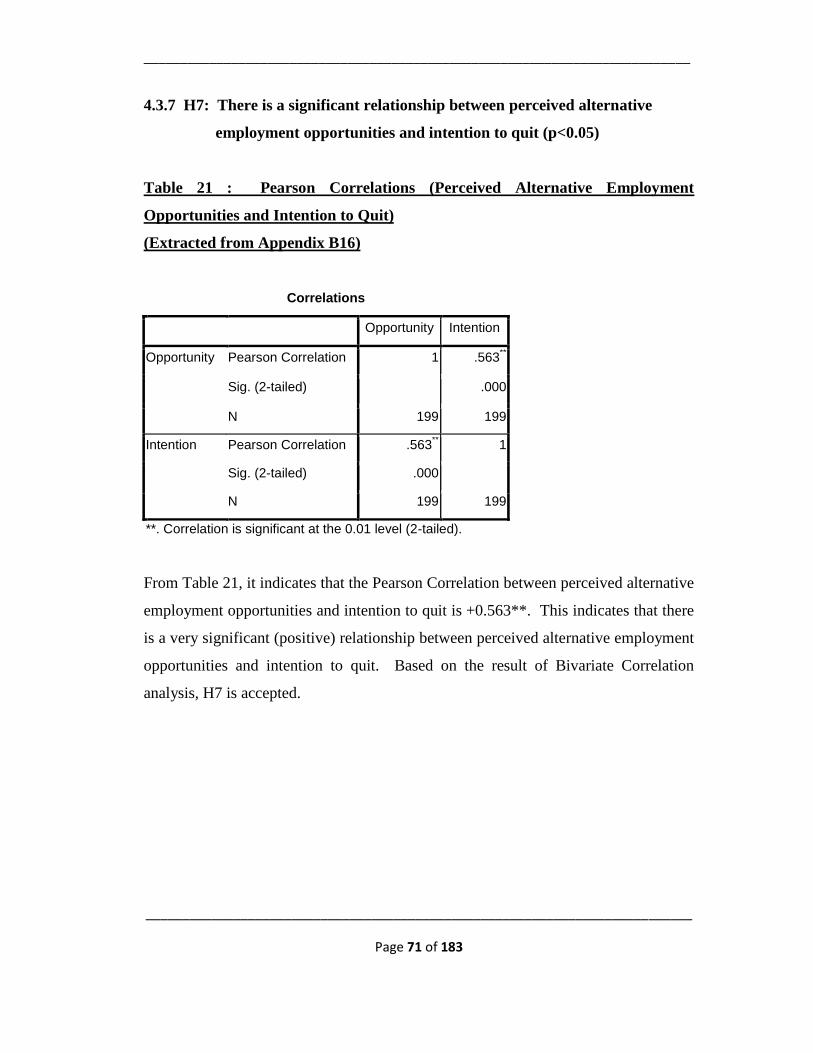
___________________________________________________________________________
___________________________________________________________________________
Page 71 of 183
4.3.7 H7: There is a significant relationship between perceived alternative
employment opportunities and intention to quit (p<0.05)
Table 21 : Pearson Correlations (Perceived Alternative Employment
Opportunities and Intention to Quit)
(Extracted from Appendix B16)
Correlations
Opportunity Intention
Opportunity Pearson Correlation 1 .563**
Sig. (2-tailed) .000
N 199 199
Intention Pearson Correlation .563** 1
Sig. (2-tailed) .000
N 199 199
**. Correlation is significant at the 0.01 level (2-tailed).
From Table 21, it indicates that the Pearson Correlation between perceived alternative
employment opportunities and intention to quit is +0.563**. This indicates that there
is a very significant (positive) relationship between perceived alternative employment
opportunities and intention to quit. Based on the result of Bivariate Correlation
analysis, H7 is accepted.
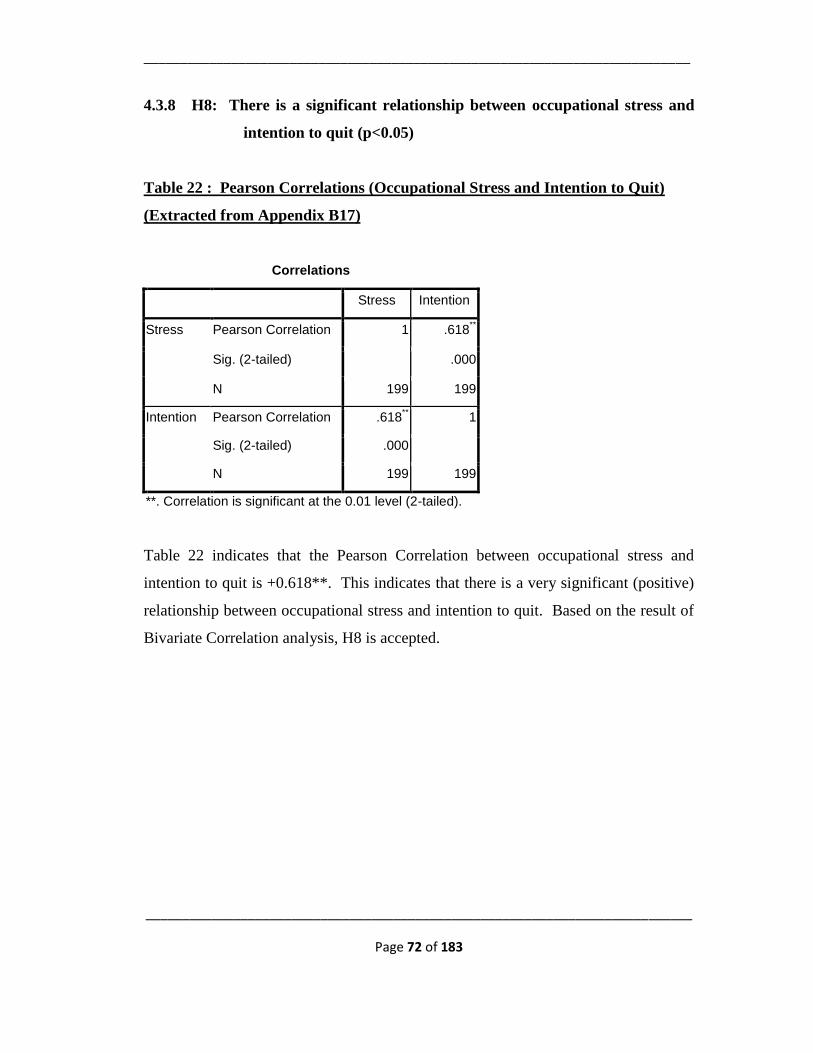
___________________________________________________________________________
___________________________________________________________________________
Page 72 of 183
4.3.8 H8: There is a significant relationship between occupational stress and
intention to quit (p<0.05)
Table 22 : Pearson Correlations (Occupational Stress and Intention to Quit)
(Extracted from Appendix B17)
Correlations
Stress Intention
Stress Pearson Correlation 1 .618**
Sig. (2-tailed) .000
N 199 199
Intention Pearson Correlation .618** 1
Sig. (2-tailed) .000
N 199 199
**. Correlation is significant at the 0.01 level (2-tailed).
Table 22 indicates that the Pearson Correlation between occupational stress and
intention to quit is +0.618**. This indicates that there is a very significant (positive)
relationship between occupational stress and intention to quit. Based on the result of
Bivariate Correlation analysis, H8 is accepted.
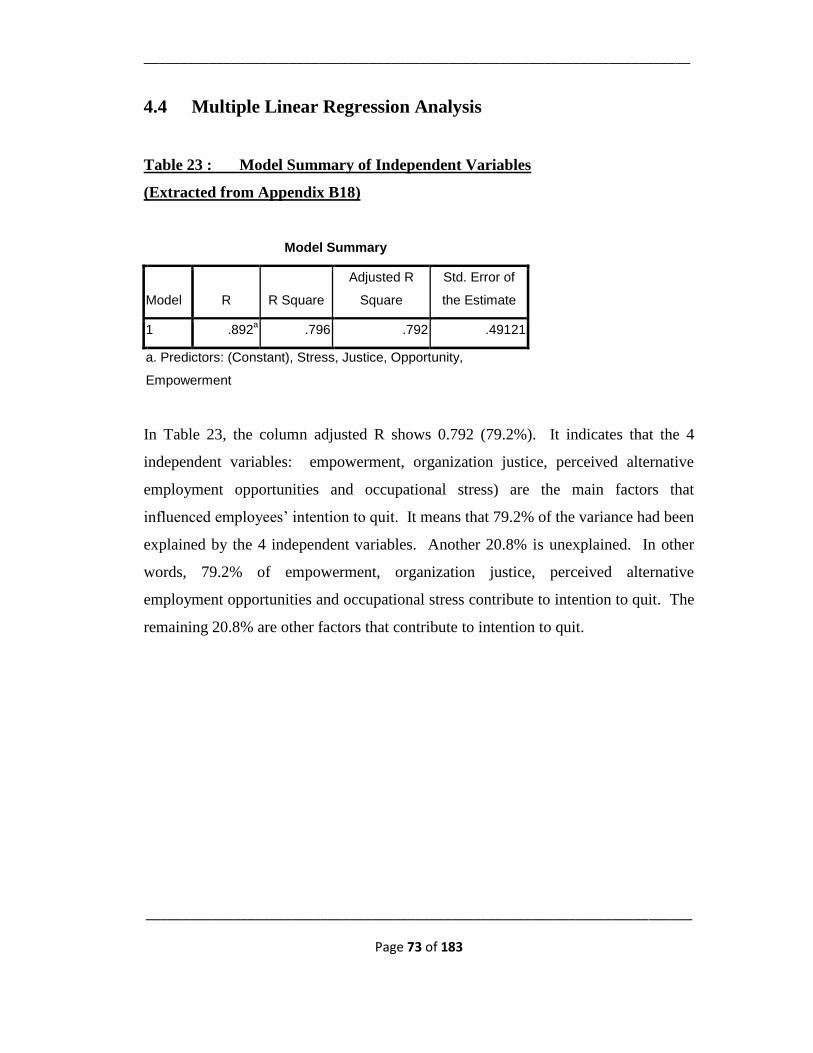
___________________________________________________________________________
___________________________________________________________________________
Page 73 of 183
4.4 Multiple Linear Regression Analysis
Table 23 : Model Summary of Independent Variables
(Extracted from Appendix B18)
Model Summary
Model R R Square
Adjusted R
Square
Std. Error of
the Estimate
1 .892a .796 .792 .49121
a. Predictors: (Constant), Stress, Justice, Opportunity,
Empowerment
In Table 23, the column adjusted R shows 0.792 (79.2%). It indicates that the 4
independent variables: empowerment, organization justice, perceived alternative
employment opportunities and occupational stress) are the main factors that
influenced employees’ intention to quit. It means that 79.2% of the variance had been
explained by the 4 independent variables. Another 20.8% is unexplained. In other
words, 79.2% of empowerment, organization justice, perceived alternative
employment opportunities and occupational stress contribute to intention to quit. The
remaining 20.8% are other factors that contribute to intention to quit.
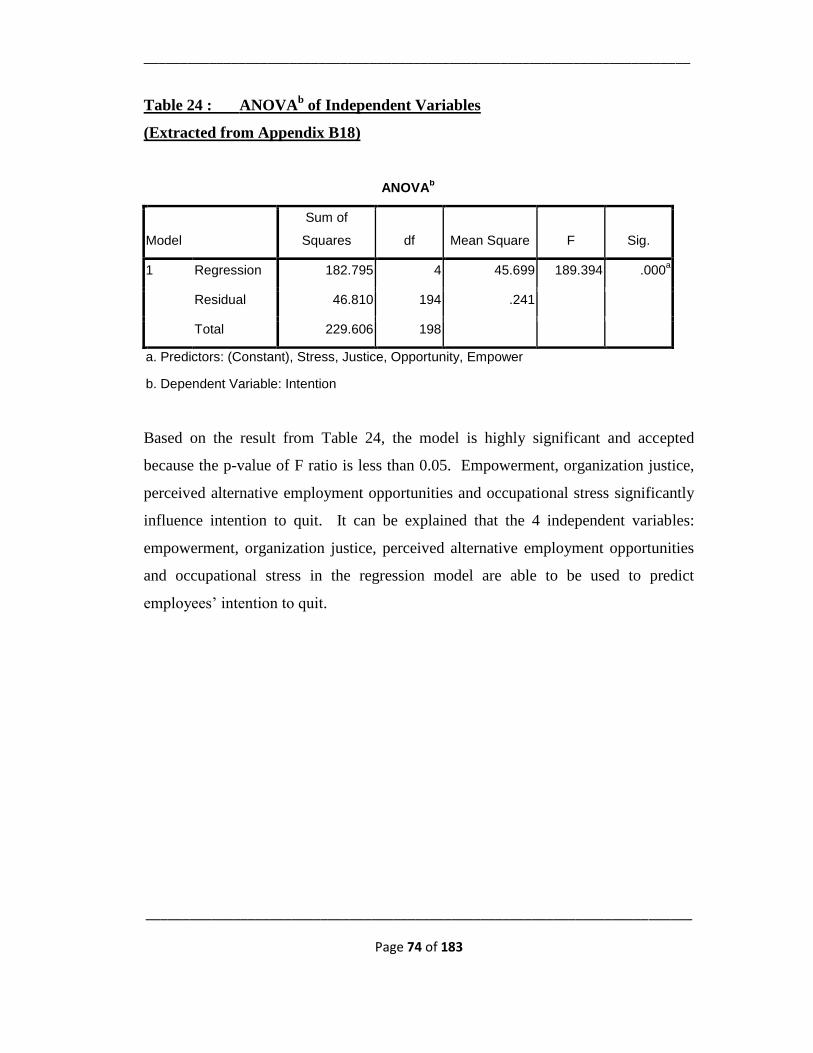
___________________________________________________________________________
___________________________________________________________________________
Page 74 of 183
Table 24 : ANOVAb of Independent Variables
(Extracted from Appendix B18)
ANOVAb
Model
Sum of
Squares df Mean Square F Sig.
1 Regression 182.795 4 45.699 189.394 .000a
Residual 46.810 194 .241
Total 229.606 198
a. Predictors: (Constant), Stress, Justice, Opportunity, Empower
b. Dependent Variable: Intention
Based on the result from Table 24, the model is highly significant and accepted
because the p-value of F ratio is less than 0.05. Empowerment, organization justice,
perceived alternative employment opportunities and occupational stress significantly
influence intention to quit. It can be explained that the 4 independent variables:
empowerment, organization justice, perceived alternative employment opportunities
and occupational stress in the regression model are able to be used to predict
employees’ intention to quit.
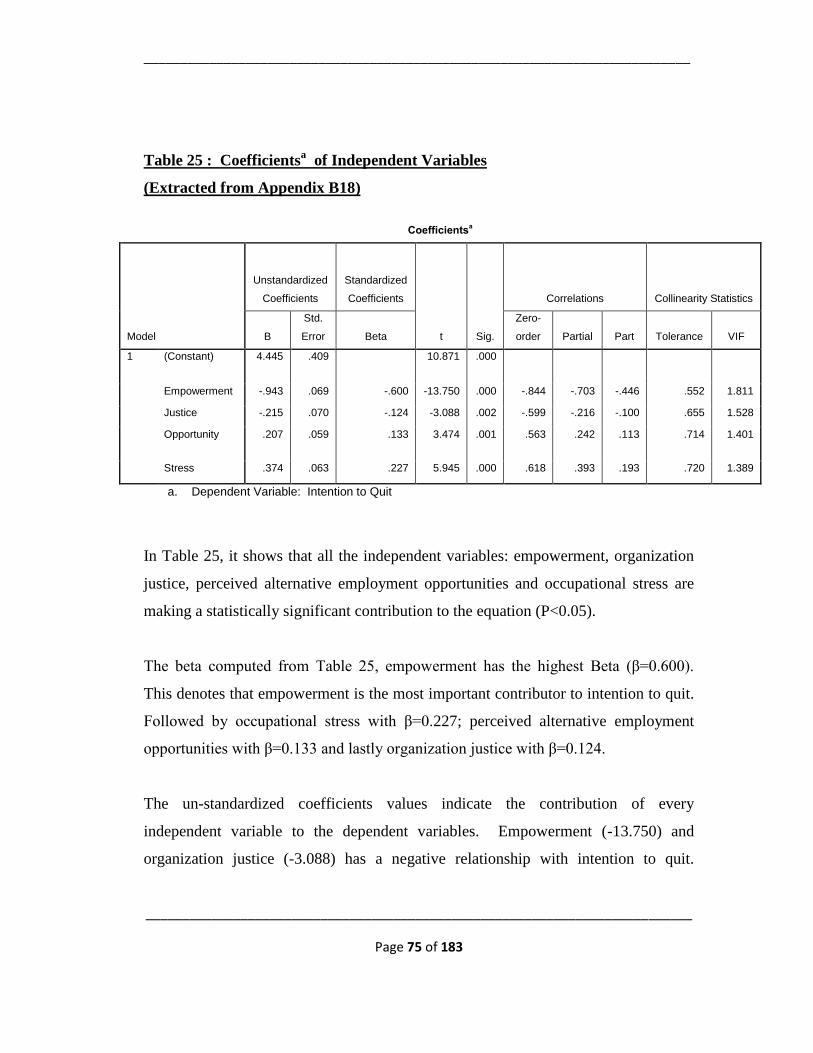
___________________________________________________________________________
___________________________________________________________________________
Page 75 of 183
Table 25 : Coefficientsa
of Independent Variables
(Extracted from Appendix B18)
Coefficientsa
Model
Unstandardized
Coefficients
Standardized
Coefficients
t Sig.
Correlations Collinearity Statistics
B
Std.
Error Beta
Zero-
order Partial Part Tolerance VIF
1 (Constant) 4.445 .409
10.871 .000
Empowerment -.943 .069 -.600 -13.750 .000 -.844 -.703 -.446 .552 1.811
Justice -.215 .070 -.124 -3.088 .002 -.599 -.216 -.100 .655 1.528
Opportunity .207 .059 .133 3.474 .001 .563 .242 .113 .714 1.401
Stress .374 .063 .227 5.945 .000 .618 .393 .193 .720 1.389
a. Dependent Variable: Intention to Quit
In Table 25, it shows that all the independent variables: empowerment, organization
justice, perceived alternative employment opportunities and occupational stress are
making a statistically significant contribution to the equation (P<0.05).
The beta computed from Table 25, empowerment has the highest Beta (β=0.600).
This denotes that empowerment is the most important contributor to intention to quit.
Followed by occupational stress with β=0.227; perceived alternative employment
opportunities with β=0.133 and lastly organization justice with β=0.124.
The un-standardized coefficients values indicate the contribution of every
independent variable to the dependent variables. Empowerment (-13.750) and
organization justice (-3.088) has a negative relationship with intention to quit.
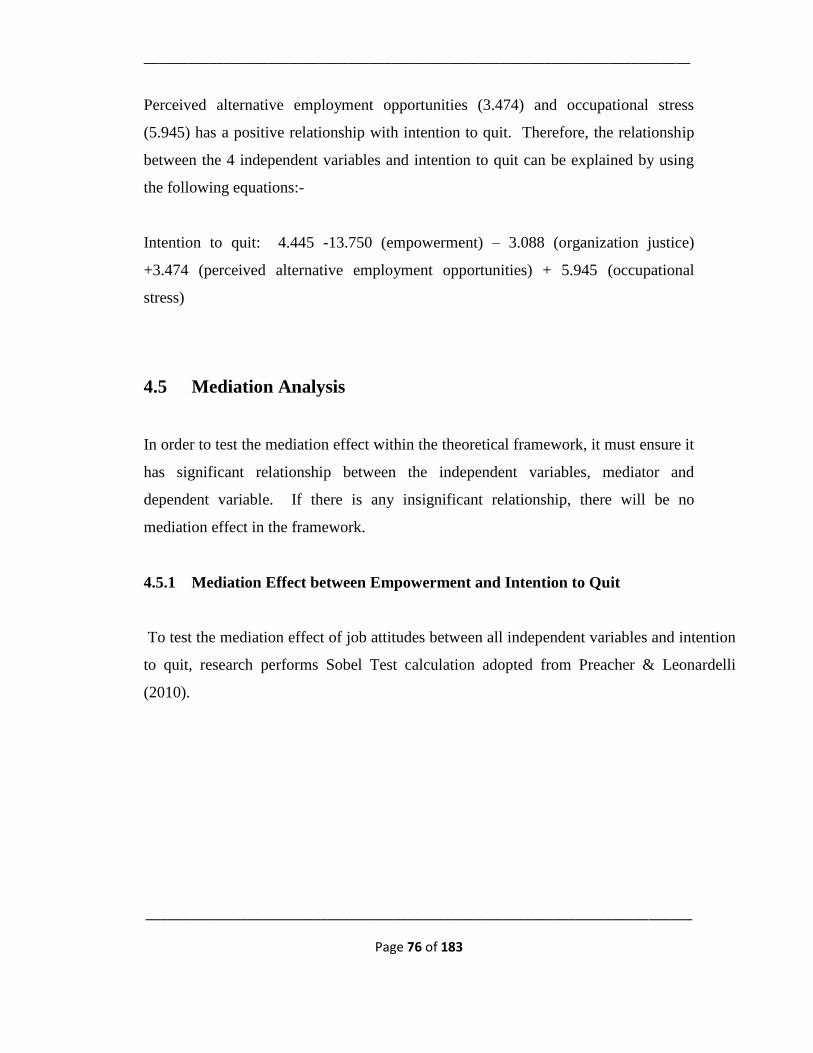
___________________________________________________________________________
___________________________________________________________________________
Page 76 of 183
Perceived alternative employment opportunities (3.474) and occupational stress
(5.945) has a positive relationship with intention to quit. Therefore, the relationship
between the 4 independent variables and intention to quit can be explained by using
the following equations:-
Intention to quit: 4.445 -13.750 (empowerment) – 3.088 (organization justice)
+3.474 (perceived alternative employment opportunities) + 5.945 (occupational
stress)
4.5 Mediation Analysis
In order to test the mediation effect within the theoretical framework, it must ensure it
has significant relationship between the independent variables, mediator and
dependent variable. If there is any insignificant relationship, there will be no
mediation effect in the framework.
4.5.1 Mediation Effect between Empowerment and Intention to Quit
To test the mediation effect of job attitudes between all independent variables and intention
to quit, research performs Sobel Test calculation adopted from Preacher & Leonardelli
(2010).
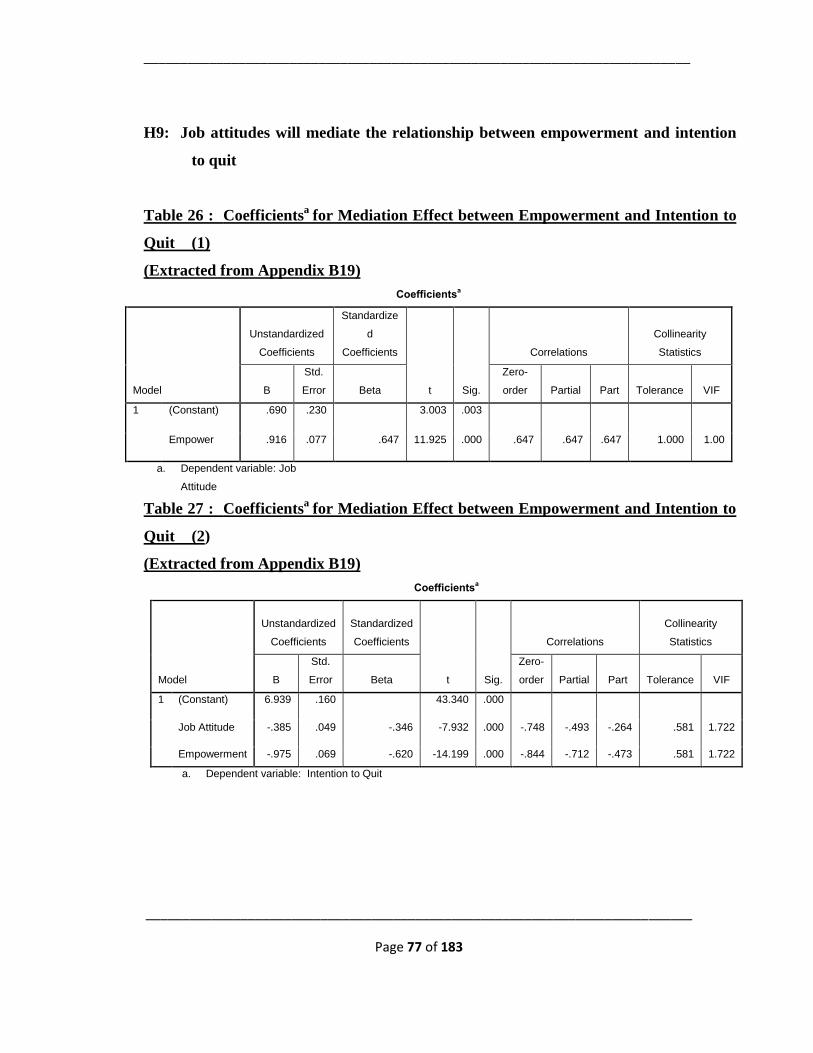
___________________________________________________________________________
___________________________________________________________________________
Page 77 of 183
H9: Job attitudes will mediate the relationship between empowerment and intention
to quit
Table 26 : Coefficientsa
for Mediation Effect between Empowerment and Intention to
Quit (1)
(Extracted from Appendix B19)
Coefficientsa
Model
Unstandardized
Coefficients
Standardize
d
Coefficients
t Sig.
Correlations
Collinearity
Statistics
B
Std.
Error Beta
Zero-
order Partial Part Tolerance VIF
1 (Constant) .690 .230 3.003 .003
Empower .916 .077 .647 11.925 .000 .647 .647 .647 1.000 1.00
a. Dependent variable: Job
Attitude
Table 27 : Coefficientsa
for Mediation Effect between Empowerment and Intention to
Quit (2)
(Extracted from Appendix B19)
Coefficientsa
Model
Unstandardized
Coefficients
Standardized
Coefficients
t Sig.
Correlations
Collinearity
Statistics
B
Std.
Error Beta
Zero-
order Partial Part Tolerance VIF
1 (Constant) 6.939 .160 43.340 .000
Job Attitude -.385 .049 -.346 -7.932 .000 -.748 -.493 -.264 .581 1.722
Empowerment -.975 .069 -.620 -14.199 .000 -.844 -.712 -.473 .581 1.722
a. Dependent variable: Intention to Quit
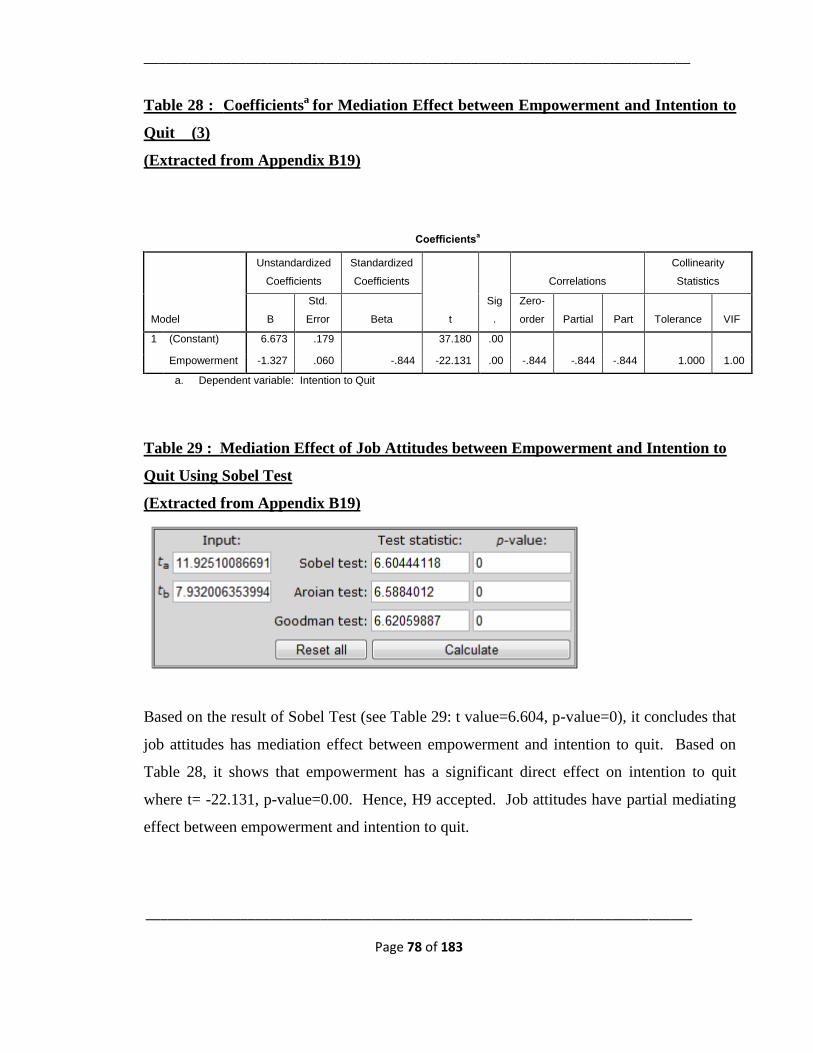
___________________________________________________________________________
___________________________________________________________________________
Page 78 of 183
Table 28 : Coefficientsa
for Mediation Effect between Empowerment and Intention to
Quit (3)
(Extracted from Appendix B19)
Coefficientsa
Model
Unstandardized
Coefficients
Standardized
Coefficients
t
Sig
.
Correlations
Collinearity
Statistics
B
Std.
Error Beta
Zero-
order Partial Part Tolerance VIF
1 (Constant) 6.673 .179 37.180 .00
Empowerment -1.327 .060 -.844 -22.131 .00 -.844 -.844 -.844 1.000 1.00
a. Dependent variable: Intention to Quit
Table 29 : Mediation Effect of Job Attitudes between Empowerment and Intention to
Quit Using Sobel Test
(Extracted from Appendix B19)
Based on the result of Sobel Test (see Table 29: t value=6.604, p-value=0), it concludes that
job attitudes has mediation effect between empowerment and intention to quit. Based on
Table 28, it shows that empowerment has a significant direct effect on intention to quit
where t= -22.131, p-value=0.00. Hence, H9 accepted. Job attitudes have partial mediating
effect between empowerment and intention to quit.
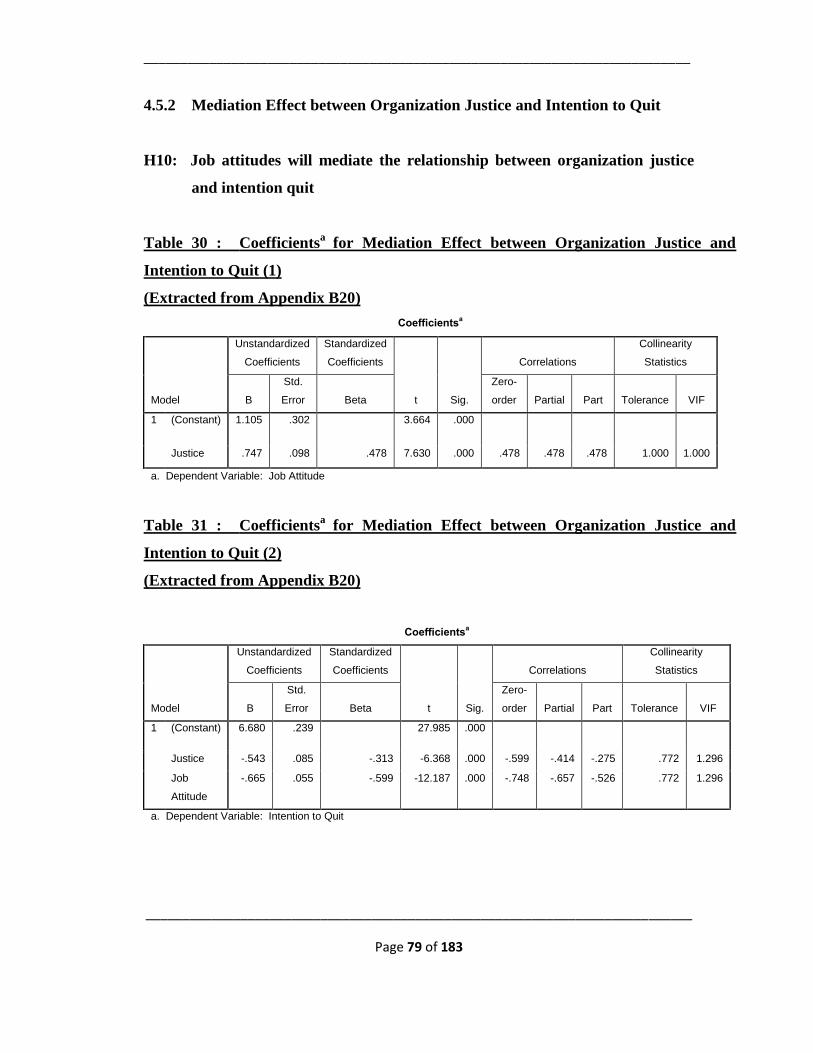
___________________________________________________________________________
___________________________________________________________________________
Page 79 of 183
4.5.2 Mediation Effect between Organization Justice and Intention to Quit
H10: Job attitudes will mediate the relationship between organization justice
and intention quit
Table 30 : Coefficientsa
for Mediation Effect between Organization Justice and
Intention to Quit (1)
(Extracted from Appendix B20)
Coefficientsa
Model
Unstandardized
Coefficients
Standardized
Coefficients
t Sig.
Correlations
Collinearity
Statistics
B
Std.
Error Beta
Zero-
order Partial Part Tolerance VIF
1 (Constant) 1.105 .302
3.664 .000
Justice .747 .098 .478 7.630 .000 .478 .478 .478 1.000 1.000
a. Dependent Variable: Job Attitude
Table 31 : Coefficientsa
for Mediation Effect between Organization Justice and
Intention to Quit (2)
(Extracted from Appendix B20)
Coefficientsa
Model
Unstandardized
Coefficients
Standardized
Coefficients
t Sig.
Correlations
Collinearity
Statistics
B
Std.
Error Beta
Zero-
order Partial Part Tolerance VIF
1 (Constant) 6.680 .239
27.985 .000
Justice -.543 .085 -.313 -6.368 .000 -.599 -.414 -.275 .772 1.296
Job
Attitude
-.665 .055 -.599 -12.187 .000 -.748 -.657 -.526 .772 1.296
a. Dependent Variable: Intention to Quit
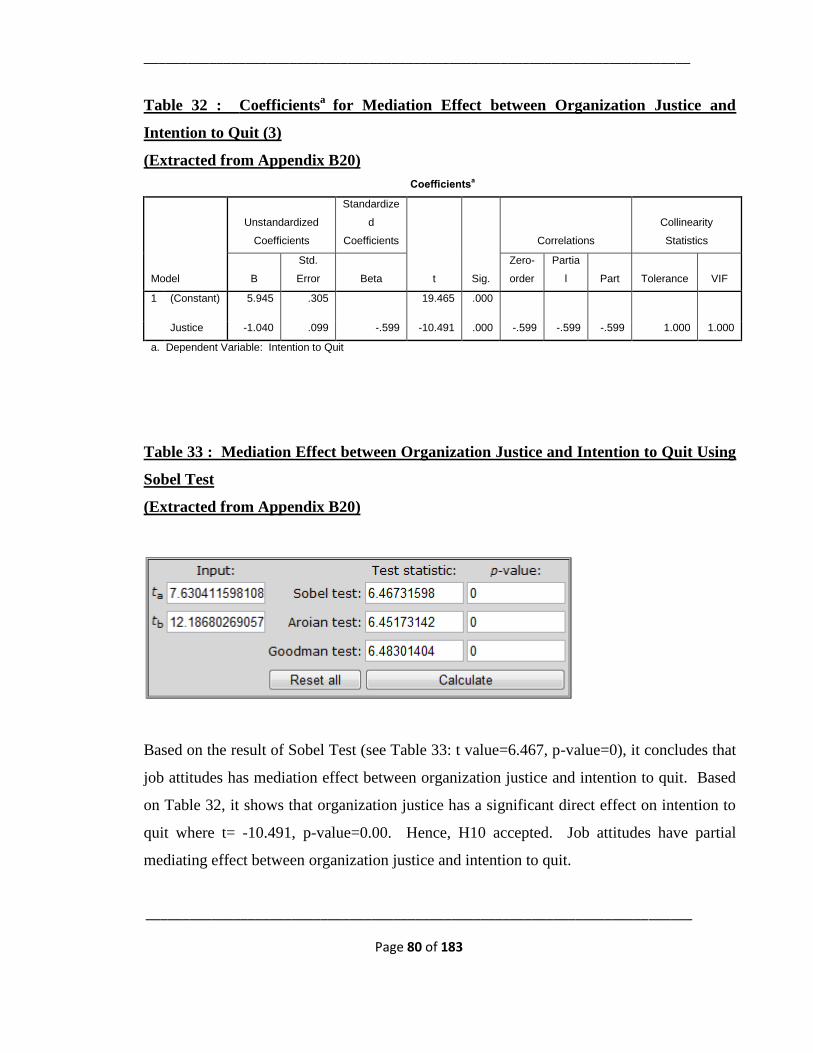
___________________________________________________________________________
___________________________________________________________________________
Page 80 of 183
Table 32 : Coefficientsa
for Mediation Effect between Organization Justice and
Intention to Quit (3)
(Extracted from Appendix B20)
Coefficientsa
Model
Unstandardized
Coefficients
Standardize
d
Coefficients
t Sig.
Correlations
Collinearity
Statistics
B
Std.
Error Beta
Zero-
order
Partia
l Part Tolerance VIF
1 (Constant) 5.945 .305 19.465 .000
Justice -1.040 .099 -.599 -10.491 .000 -.599 -.599 -.599 1.000 1.000
a. Dependent Variable: Intention to Quit
Table 33 : Mediation Effect between Organization Justice and Intention to Quit Using
Sobel Test
(Extracted from Appendix B20)
Based on the result of Sobel Test (see Table 33: t value=6.467, p-value=0), it concludes that
job attitudes has mediation effect between organization justice and intention to quit. Based
on Table 32, it shows that organization justice has a significant direct effect on intention to
quit where t= -10.491, p-value=0.00. Hence, H10 accepted. Job attitudes have partial
mediating effect between organization justice and intention to quit.
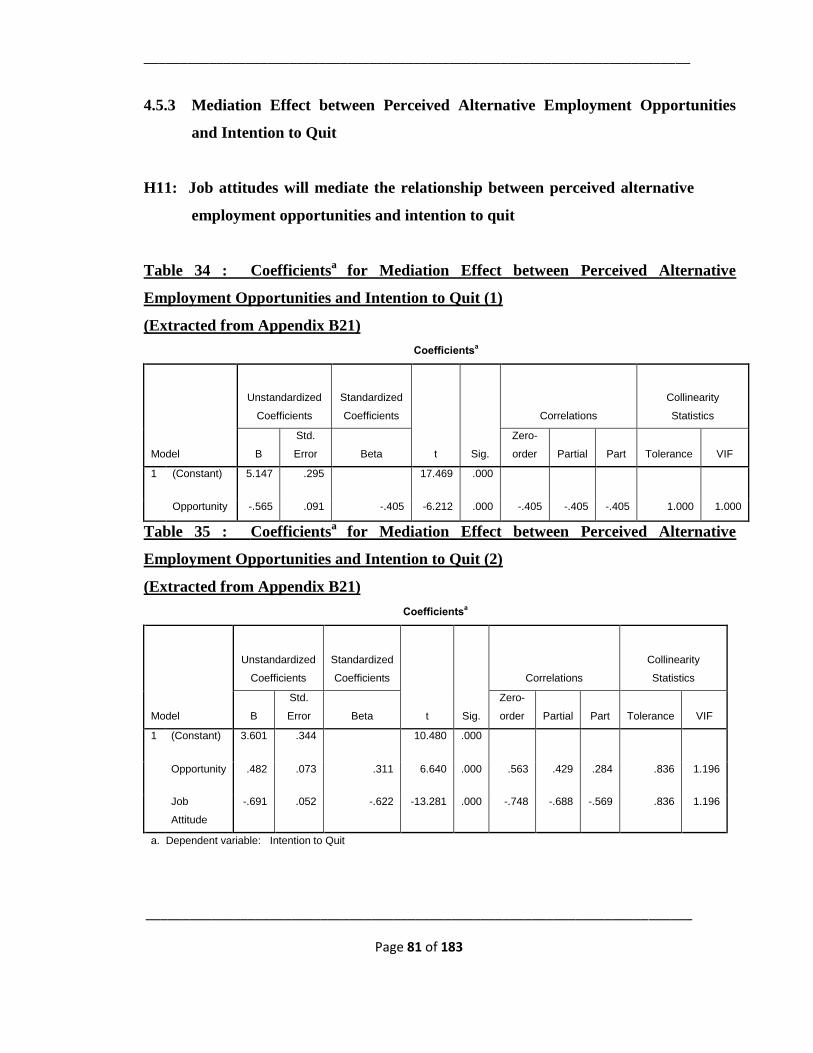
___________________________________________________________________________
___________________________________________________________________________
Page 81 of 183
4.5.3 Mediation Effect between Perceived Alternative Employment Opportunities
and Intention to Quit
H11: Job attitudes will mediate the relationship between perceived alternative
employment opportunities and intention to quit
Table 34 : Coefficientsa
for Mediation Effect between Perceived Alternative
Employment Opportunities and Intention to Quit (1)
(Extracted from Appendix B21)
Coefficientsa
Model
Unstandardized
Coefficients
Standardized
Coefficients
t Sig.
Correlations
Collinearity
Statistics
B
Std.
Error Beta
Zero-
order Partial Part Tolerance VIF
1 (Constant) 5.147 .295
17.469 .000
Opportunity -.565 .091 -.405 -6.212 .000 -.405 -.405 -.405 1.000 1.000
Table 35 : Coefficientsa
for Mediation Effect between Perceived Alternative
Employment Opportunities and Intention to Quit (2)
(Extracted from Appendix B21)
Coefficientsa
Model
Unstandardized
Coefficients
Standardized
Coefficients
t Sig.
Correlations
Collinearity
Statistics
B
Std.
Error Beta
Zero-
order Partial Part Tolerance VIF
1 (Constant) 3.601 .344
10.480 .000
Opportunity .482 .073 .311 6.640 .000 .563 .429 .284 .836 1.196
Job
Attitude
-.691 .052 -.622 -13.281 .000 -.748 -.688 -.569 .836 1.196
a. Dependent variable: Intention to Quit
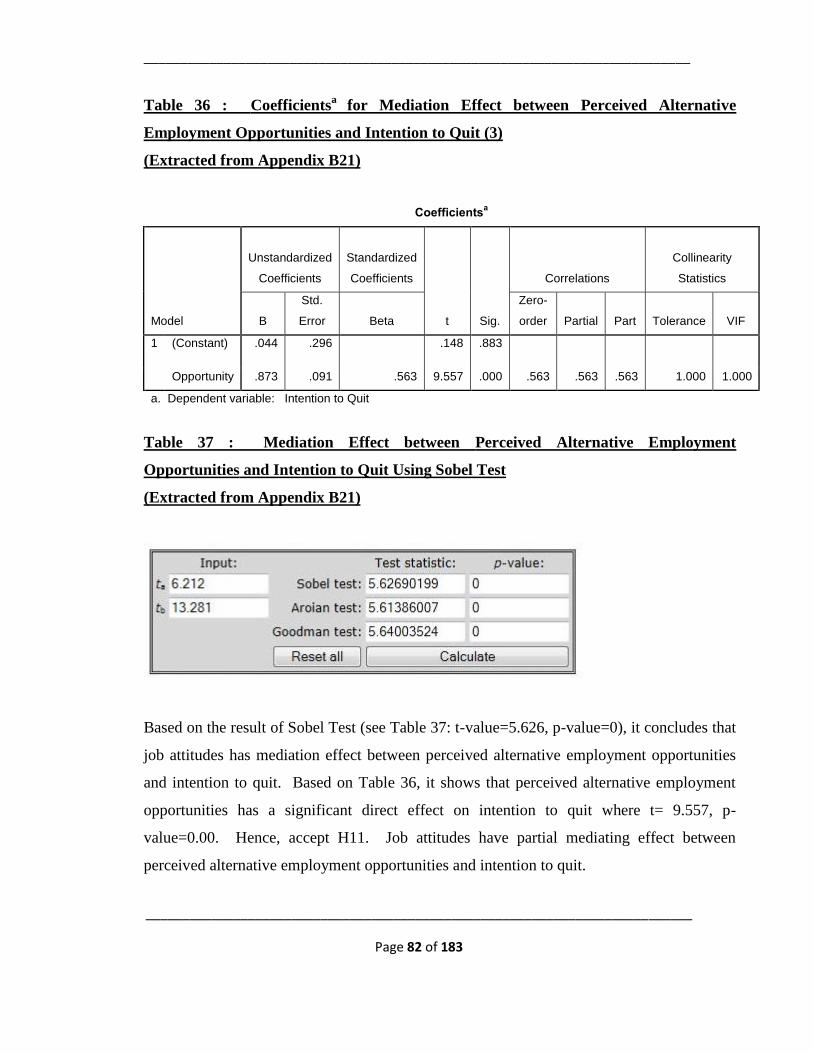
___________________________________________________________________________
___________________________________________________________________________
Page 82 of 183
Table 36 : Coefficientsa
for Mediation Effect between Perceived Alternative
Employment Opportunities and Intention to Quit (3)
(Extracted from Appendix B21)
Coefficientsa
Model
Unstandardized
Coefficients
Standardized
Coefficients
t Sig.
Correlations
Collinearity
Statistics
B
Std.
Error Beta
Zero-
order Partial Part Tolerance VIF
1 (Constant) .044 .296 .148 .883
Opportunity .873 .091 .563 9.557 .000 .563 .563 .563 1.000 1.000
a. Dependent variable: Intention to Quit
Table 37 : Mediation Effect between Perceived Alternative Employment
Opportunities and Intention to Quit Using Sobel Test
(Extracted from Appendix B21)
Based on the result of Sobel Test (see Table 37: t-value=5.626, p-value=0), it concludes that
job attitudes has mediation effect between perceived alternative employment opportunities
and intention to quit. Based on Table 36, it shows that perceived alternative employment
opportunities has a significant direct effect on intention to quit where t= 9.557, p-
value=0.00. Hence, accept H11. Job attitudes have partial mediating effect between
perceived alternative employment opportunities and intention to quit.
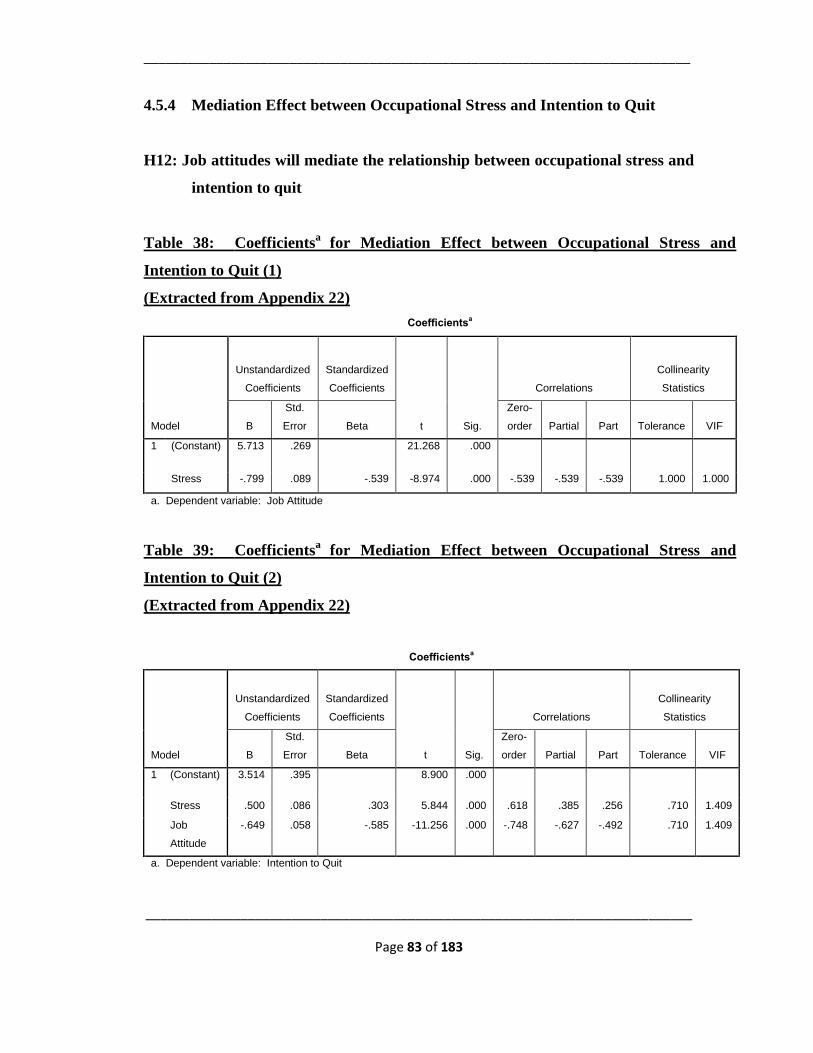
___________________________________________________________________________
___________________________________________________________________________
Page 83 of 183
4.5.4 Mediation Effect between Occupational Stress and Intention to Quit
H12: Job attitudes will mediate the relationship between occupational stress and
intention to quit
Table 38: Coefficientsa
for Mediation Effect between Occupational Stress and
Intention to Quit (1)
(Extracted from Appendix 22)
Coefficientsa
Model
Unstandardized
Coefficients
Standardized
Coefficients
t Sig.
Correlations
Collinearity
Statistics
B
Std.
Error Beta
Zero-
order Partial Part Tolerance VIF
1 (Constant) 5.713 .269
21.268 .000
Stress -.799 .089 -.539 -8.974 .000 -.539 -.539 -.539 1.000 1.000
a. Dependent variable: Job Attitude
Table 39: Coefficientsa
for Mediation Effect between Occupational Stress and
Intention to Quit (2)
(Extracted from Appendix 22)
Coefficientsa
Model
Unstandardized
Coefficients
Standardized
Coefficients
t Sig.
Correlations
Collinearity
Statistics
B
Std.
Error Beta
Zero-
order Partial Part Tolerance VIF
1 (Constant) 3.514 .395
8.900 .000
Stress .500 .086 .303 5.844 .000 .618 .385 .256 .710 1.409
Job
Attitude
-.649 .058 -.585 -11.256 .000 -.748 -.627 -.492 .710 1.409
a. Dependent variable: Intention to Quit
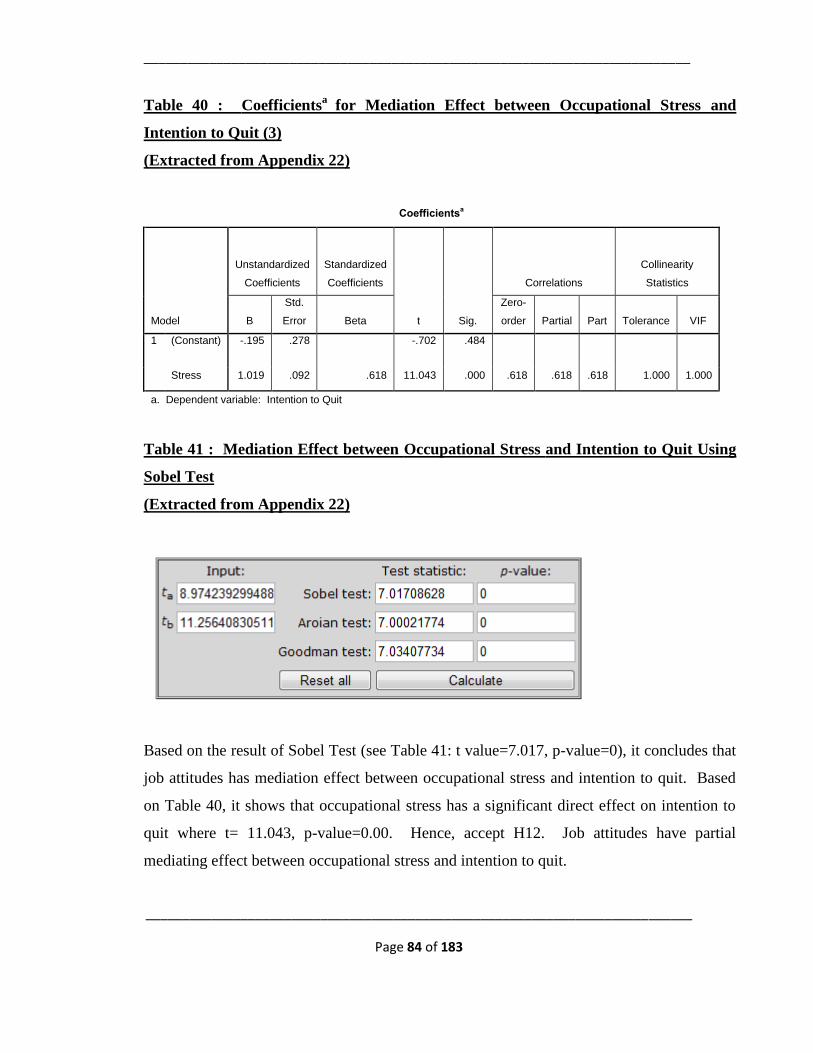
___________________________________________________________________________
___________________________________________________________________________
Page 84 of 183
Table 40 : Coefficientsa
for Mediation Effect between Occupational Stress and
Intention to Quit (3)
(Extracted from Appendix 22)
Coefficientsa
Model
Unstandardized
Coefficients
Standardized
Coefficients
t Sig.
Correlations
Collinearity
Statistics
B
Std.
Error Beta
Zero-
order Partial Part Tolerance VIF
1 (Constant) -.195 .278
-.702 .484
Stress 1.019 .092 .618 11.043 .000 .618 .618 .618 1.000 1.000
a. Dependent variable: Intention to Quit
Table 41 : Mediation Effect between Occupational Stress and Intention to Quit Using
Sobel Test
(Extracted from Appendix 22)
Based on the result of Sobel Test (see Table 41: t value=7.017, p-value=0), it concludes that
job attitudes has mediation effect between occupational stress and intention to quit. Based
on Table 40, it shows that occupational stress has a significant direct effect on intention to
quit where t= 11.043, p-value=0.00. Hence, accept H12. Job attitudes have partial
mediating effect between occupational stress and intention to quit.
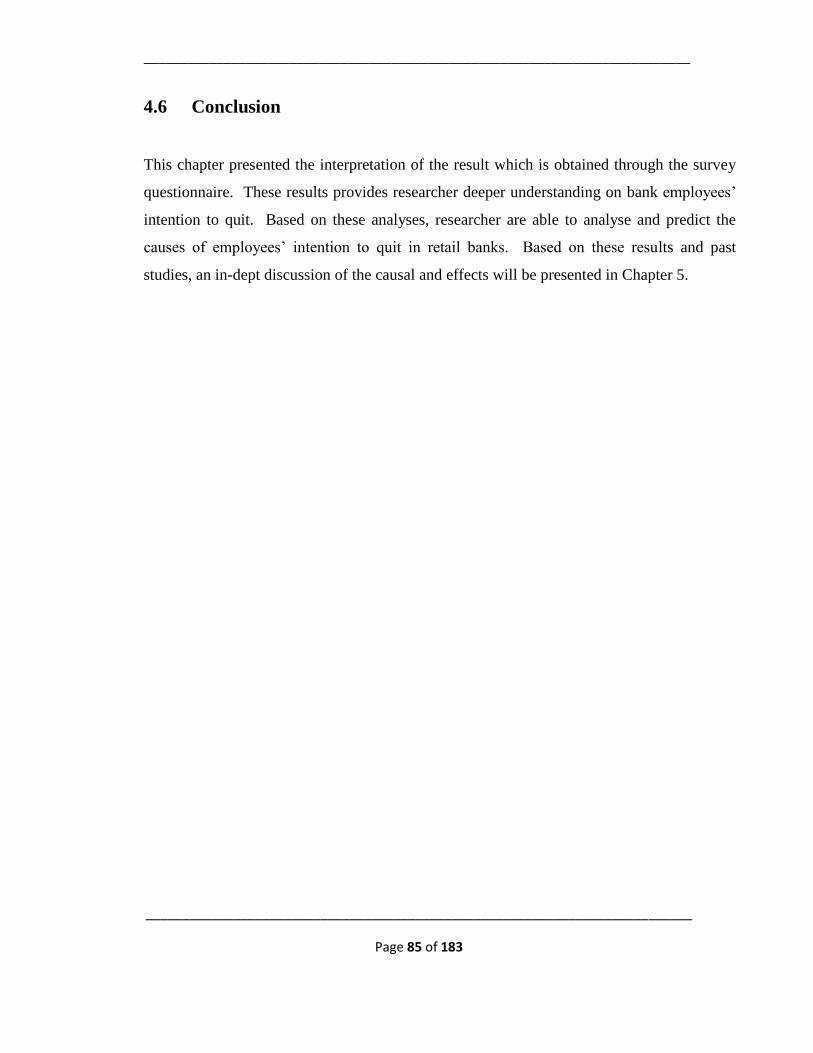
___________________________________________________________________________
___________________________________________________________________________
Page 85 of 183
4.6 Conclusion
This chapter presented the interpretation of the result which is obtained through the survey
questionnaire. These results provides researcher deeper understanding on bank employees’
intention to quit. Based on these analyses, researcher are able to analyse and predict the
causes of employees’ intention to quit in retail banks. Based on these results and past
studies, an in-dept discussion of the causal and effects will be presented in Chapter 5.
___________________________________________________________________________
___________________________________________________________________________
Page 86 of 183
CHAPTER 5
DISCUSSION AND CONCLUSION
5.0 Introduction
In this chapter, an in-depth discussion and summary of the research findings will be
presented by researcher. The discussion and conclusion will be linked to research
objective that had been discussed in Chapter 1. Through current and past literatures
coupled with these research findings, it provides valuable insight for employers to
address employees’ intention to quit and develop effective employees’ retention
strategy. Lastly, conclusion will be presented at the end of this chapter.
5.1 Discussion of Major Findings
This research project mainly aims to investigate the factors influencing the intention
to quit among the bank employees in Malaysia. Based on the research finding in the
previous chapter, researcher makes an in-depth discussion to discuss the
phenomenon. It will also link to research objectives to provide a clear understanding
towards intention to quit among bank employees.
___________________________________________________________________________
___________________________________________________________________________
Page 87 of 183
5.1.1 Findings on the Hypotheses
H1: There is a significant difference between age group and intention to quit
(p<0.05)
Based on Table 11, the P=value=0.013 which is lesser than critical value 0.05.
Therefore H1 is accepted. There is a significant difference between age group and
intention to quit. The Post Hoc Test indicated that there is significant difference for
employees’ age group between 20-29 and 30-39 in intention to quit. This age group
represents the younger workers. The younger workers have grown up in a very
different career landscape (Ng & Feldman, 2009).
Research has found that the younger workers are more prone to changing their jobs
when opportunities tagged along due to their ability of attaining higher tertiary of
education and aggressiveness in moving up the career ladder. The younger workers
are more likely to consider if an organization will provide them with opportunities to
develop a wide range of job skills (Finegold, Mohrman, & Spreitzer, 2002; Rowe &
Snizek, 1995). Moreover, younger workers face more difficulties identifying their
career goals and trying to find a job that meets all their criteria for acceptability.
Hence, they are more willing than older workers to move on to new employment
opportunities (Dunegan, 1993).
According to Ng & Feldman (2009), there are underlying changes in individuals’
emotional experiences, preferred social relationships and self-concepts as an
individual aged. Older workers are more likely than younger workers to experience
positive emotions at work and value familiar social relationships. The older workers
are more susceptible to experience positive emotions and less susceptible to
experience negative emotions as compared to younger workers. Hence, the older
___________________________________________________________________________
___________________________________________________________________________
Page 88 of 183
workers are less likely to leave their jobs when they face adversity at work. The older
workers adjust themselves to difficult circumstances (Brandstadter & Renner, 1990).
Secondly, many older adults valued of having quality social relationships with
spouses, family and friends in order to make a successful transition to old age because
these social relationships offer fulfillment of status and affiliation needs (Sterns &
Gray, 1999; Steverink & Lindenberg, 2006).
At the same time, the older workers are less likely to feel confident about getting
similar or comparable jobs in the external labour market. Researchers have observed
that middle aged and older workers increasingly value their job security (Igbaria,
Kassicieh, & Silver, 1999). This could be due to older workers still face some age
discrimination in the market place even though age discrimination may not be as
great as it was 30 years ago (Weiss & Maurer, 2004).
Ng & Feldman (2007) argued that the organizations that provide handsome
compensation and extrinsic rewards such as pensions scheme and benefits exert
strong embedding forces on long-tenured workers also discourage them to seek out
for new employment opportunities. Compared to younger workers, the older workers
also less likely to feel satisfy with their new jobs in terms of pay and benefits
(Mallinckrodt, 1990). Hence, they are less likely to leave their current employment
due to fear of losing the attractive compensation. Moreover, the older workers are
less likely to find quality replacement jobs as their younger colleagues do in the
market (Feldman, Leana, & Bolino, 2002).
Another explanation provided by Park & Gursoy (2011) in relations to age and
intention to quit, is that there are generational differences in regards to work values,
attitudes, personality traits and expectations in life. A generation can be defined as a
group of individuals of similar age who share historical experience within the same
___________________________________________________________________________
___________________________________________________________________________
Page 89 of 183
time period (Ryder, 1965). Baby Boomers (“Boomers”) who born from 1946 to
1964) where their idealism is remain loyal and committed to an organization, value
work more than younger generations and see work as central to their lives than
younger generations (Smola & Sutton, 2002). The Boomers are now slowly being
replaced by the younger generation, known as Generation X (“Gen X”) and
Generation Y (“Millennials”). In our research study, it also reflects that the Boomers
are slowing replaced by Gen X and Millennials, where the majority age group of our
respondents fall between the age range of 20-29 years old which constitute of 93
respondents or equivalent to 46.7% (which categorized as “Millennial”). Followed
by 80 or 40.2% respondents are between age range of 30-39 years old (which
categorized as “Gen X”). There are only 15 or 0.07% respondents fall between the
age range of 40 – 49 years old and 11 or 0.05% respondents’ age fall between age
range 50 and above (which categorized as “Boomers”).
Gen X who born from 1965 to 1980 is currently dominant the workforce as Boomers
is retiring. Gen X characteristics are shaped by some of the critical events such as
economic recessions in early and late 1970s and early 1980s where there are high
unemployment (Twenge, Campbell, Hoffman, & Lance, 2010). As a result, Gen X
are likely to be independent and individualistic, placing more value on their own
career than being loyal to an organization (Beutell & Wittig-Berman, 2008). Instead
of looking for job security, Gen X actively pursuit challenging jobs and better
opportunities to develop their own career (Kupperschmidt, 2000) as they have higher
external locus of control (Twenge, Zhang, & Im, 2004) and self-esteem (Twenge &
Campbell, 2001). Hence, Gen X will not hesitate to leave the organization when
better opportunities tagged along, which leads to intention to quit.
Gen Y or Millennials are the youngest generations. The millennial generation has
been characterized by the economic prosperity, advancement in technologies through
___________________________________________________________________________
___________________________________________________________________________
Page 90 of 183
the internet, social networking and globalization. Gen Y valued high leisure work
values (Twenge. Campbell, Hoffman, & Lance, 2010) and low work centrality.
Millennials have higher expectations about promotions and pay rise in workplace
(Ng, Schweitzer, & Lyons, 2010). Millennials placed greater value on meaningful
and fulfilling work and not tolerant of less challenging work (Lancaster & Stillman,
2002). Hence, if an organization fails to provide learning and growth development
environment to the Millennials, this could trigger intention to quit.
H2: There is a significant difference between number of years with current
organization and intention to quit (p<0.05)
Based on Table 13, it indicates that the significant P-value =0.005. Therefore, H2 is
accepted. There is significant difference between number of years with current
organization and intention to quit. As discussed above, organizations provides
handsome compensation and extrinsic rewards such as pension scheme and benefits
for long-tenured workers to discourage the employees to seek out for new
employment opportunities (Ng & Feldman, 2007). As number of years attached with
current organization increased, the desire to leave decreased.
Becker (1960) associates this cost as “sunken costs”. As a person spends more time
within an organization, it also means that he/she has invested more and more time and
effort in the organization. These “sunken costs” bind the person to continued
employment. Employees, who are covered by the retirement system and who have
vested long time in the system are less likely to sacrifice the compensation by quitting
their jobs.
___________________________________________________________________________
___________________________________________________________________________
Page 91 of 183
H3: There is a significant difference between education level and intention to
quit (p<0.05)
The significant P-value=0.006 which is lesser than critical value 0.05 (see Table 15)
shows significant difference between education level and intention to quit. Therefore,
H3 is accepted. This is consistent with the findings Cotton & Tuttle (1986) where
higher tertiary of education (e.g Diploma holders and Bachelor Degree holders)
contributes to intention to quit due to better job opportunities available in the market.
Similarly, more educated persons have higher expectations in their life. They have
different needs and higher goals that are unlikely to be met by staying long in an
organization (Jurik & Musheno, 1986).
H4: There is a significant difference between gender and intention to quit
(p<0.05)
The Levene’s Test for Equality of Variances column shows the P-value is 0.060 is
greater than critical value 0.05. Therefore, reject H4 and concluded that there is no
significant difference between male and female in their intention to leave. This is
consistent with the study by Rosin & Korabik (1991) where there is no gender
difference in their intention to quit. This could attribute to the socio-economic and
cultures of Malaysia. In Malaysia, males and females attained the equal level of
education and job level.
H5: There is a significant relationship between empowerment and intention to
quit (p<0.05)
As shown in Table 19, the Pearson Correlation between empowerment and intention
to quit is -0.844**. This indicates that there is a very strong (inverse) relationship
___________________________________________________________________________
___________________________________________________________________________
Page 92 of 183
between empowerment and intention to quit. Secondly, the beta computed from
Table 25 indicated that empowerment has the highest Beta (β=0.600). Hence,
empowerment is the most important contributor to intention to quit.
Empowerment was based on the movement of power down an organization’s
hierarchy (Menon, 2001) where sources of power could be legal (control of office,
normative (control of symbolic rewards); remunerative (control of material rewards);
coercive (control of punishment); and/or knowledge/expertise (control of
information) (Conger & Kanungo, 1988). Empowerment incorporates job redesign
where it allows the employees more autonomy to make decisions about how they go
about their daily activities and control over their work (Carless, 2004).
The motive of empowerment is very clear which is to enhance effectiveness at work.
It is through empowerment practice, organization hope to promote motivation,
initiative, implicit knowledge, flexibility, involvement and commitment required
from employees (Foy, 1994; Lawler, 1992). Research found that empowering
management practices demonstrate stronger job satisfaction and organizational
commitment, and thus empowerment helps to lead to lower turnover intention
(Humborstad & Perry, 2011; Kazlauskaite et al., 2006)
H6: There is a significant relationship between organization justice and
intention to quit (p<0.05)
The correlation between organization justice and intention to quit is -0.599**. This
indicates that there is a very significant (negative) relationship between organization
justice and intention to quit. Among the variables, organization justice has the lowest
beta with β=0.124. The outcome is consistent with the study of Choong, Wong, &
___________________________________________________________________________
___________________________________________________________________________
Page 93 of 183
Tioh (2010) where distributive justice was related to job satisfaction and this support
a significant negative relationship to intention to quit.
Employees were more satisfied when they were fairy rewarded for their genuine
contributions to the organization and consistent with the reward policies. The reward
many include a variety of benefits and perquisites other than monetary gains.
Findings implied that the higher level of employees’ perception towards fairness to
the means used to determine outcomes (procedural justice) and fairness of the
outcomes employees receive (distributive justice) tends to reduce intention to quit
(Choong, Wong, & Tioh, 2010).
H7: There is a significant relationship between perceived alternative
employment opportunities and intention to quit (p<0.05)
The Pearson Correlation between perceived alternative employment opportunities and
intention to quit is +0.563**. This indicates that there is a very significant (positive)
relationship between perceived alternative employment opportunities and intention to
quit. The beta (β) for perceived alternative employment opportunities is β=0.133;
ranked the third after occupational stress where β=0.227.
Argument as to why perceived alternative employment opportunities may trigger
intention to quit is about the changing work life. The changing work life has induced
feelings of job insecurity among employees (De Cuyper & De Witte, 2008). The
employees feel that they can no longer rely on their employer to provide ongoing
employment. They have learned to manage their own career. This group of
employees, known as Gen X, no longer feels an obligation to be loyal in an
organization in exchange for the security offered by the employer and hence leads to
intention to quit.
___________________________________________________________________________
___________________________________________________________________________
Page 94 of 183
As explained, Gen X are likely to be independent and individualistic, placing more
value on their own career than being loyal to an organization (Beutell & Wittig-
Berman, 2008). Instead of looking for job security, Gen X actively pursuit
challenging jobs and better opportunities to develop their own career
(Kupperschmidt, 2000) as they have higher external locus of control (Twenge, Zhang,
& Im, 2004) and self-esteem (Twenge & Campbell, 2001). As and when there are
better opportunities knock at their door, Gen X are optimistic and confident to forge
forward towards new employment.
According to Sullivan (1999), the emerging of new career models or so called the
“boundaryless career” as compared to traditional career model could contribute to
intention to quit. Traditional career model is defined as professional advancement
within one or two firms. Boundaryless career is defined as a sequence of job
opportunities that go beyond the boundaries of a single employment setting
(DeFillippi & Arthur, 1996, p. 116). Some of the characteristic of boundaryless
career includes: portable skills, knowledge and abilities across multiple firms (Arthur,
Claman, & DeFillippi, 1995) and on the job learning (McCall, Lombardon, &
Morrision, 1988).
The boundaryless employee is typically highly employable (Briscoe & Hall, 2006;
DeFillippi & Arthur, 1994). He or she engages in job-hopping search of attractive
jobs, or pursuing his or her own values (Sullivan, 1999). The boundaryless employee
is less committed to one organization (De Grip, Van Loo, & Sanders, 2004; Elman &
O’Rand, 2002; Pearce & Randel, 2004), which then fosters intentions to quit. The
lesser commitment they have within an organization and the more they perceived
there are many alternatives employment opportunities available in the market, they
___________________________________________________________________________
___________________________________________________________________________
Page 95 of 183
will actively search for jobs, attending job interviews and move forward towards new
employment.
H8: There is a significant relationship between occupational stress and
intention to quit (p<0.05)
The Pearson Correlation between occupational stress and intention to quit is
+0.618** (see Table 22). This indicates that there is a very significant (positive)
relationship between occupational stress and intention to quit. From Table 25, it
indicated that occupational stress’s β=0.227, ranked the second highest beta after
empowerment.
According to Oberlechner & Nimgade (2005), financial workers may be particularly
prone to mental stress. A number of specific aspects of their work may expose the
finance professionals to increased levels of stress such as bonus incentive schemes
(Levi, 1972), intense time pressures (Kahn & Cooper, 1993), work functions (Kahn &
Cooper, 1993; Rodahl, 1989), job security, relationship with customers and role
conflicts. Whilst these aspects are within their control, there are other aspects that
beyond their control such as economic climate and government regulations
(Montgomery et al., 1996). Some of these regulations are deregulations, merger and
acquisition, rationalization coupled with weaker economic outlook on banking sector
which resulted in tightening of financing criterion and affecting loan growth. These
are some of the indicators of the presence of occupational stress in the banking
environment which could have adversely affect banks. A recognition of early signal
and adoption of appropriate coping strategy by both management and the employees
themselves is necessary in order to avoid the impact of occupational stress on the
employees and the organization.
___________________________________________________________________________
___________________________________________________________________________
Page 96 of 183
H9: Job attitude will mediate the relationship between empowerment and
intention to quit
Based on the result of Sobel Test (see Table 29: t value=6.604, p-value=0), it
concludes that job attitude has mediation effect between empowerment and intention
to quit. Based on Table 28, it shows that empowerment has a significant direct effect
on intention to quit where t=-22.131, p-value=0.00. Job attitudes has partial
mediating effect between empowerment and intention to quit. This is consistent with
the findings of Humborstad & Perry (2011) where job attitudes (which consists of job
satisfaction and organization commitment) is the mechanism that helps empowerment
that lead to lower intention to quit among the employees. Managers use
empowerment to allow workers to solve problems lead to higher autonomy and
control over their work. However, manager must also include actions that foster job
satisfaction and organization commitment to ensure that empowerment would reduce
intention to quit.
Job satisfaction such as work environment include the supervisors practicing open
door policy to encourage different ideas and opinions so that the employees would
feel more committed to their work as their voices are being heard and their
contributions would have impact on their company’s performance (Tian-Foreman,
2009). In term of commitment, it would involve emotional commitment to be part of
the “family” in the organization. This means that give employees a sense of
belonging to the organization by sharing values would make them feel emotionally
attached and be “part of the family”. With emphases on the job satisfaction and
commitment, empowerment would become more effective in retaining the talent.
Therefore, empowering management practices will demonstrate higher job
___________________________________________________________________________
___________________________________________________________________________
Page 97 of 183
satisfaction and organization commitment and help empowerment to lead to lower
intention to quit.
H10: Job attitude will mediate the relationship between organization justice
and intention quit
Based on the result of Sobel Test (see Table 33: t value=6.467, p-value=0), it
concludes that job attitude has mediation effect between organization justice and
intention to quit. Based on Table 32, it shows that organization justice has a
significant direct effect on intention to quit where t=-10.491, p-value=0.00. Job
attitudes has partial mediating effect between organization justice and intention to
quit.
According to Choong et al., (2010), the employees with higher job satisfaction
believed that the organization would have tremendous future in the long run and
therefore care about the quality of their work. Hence, the employees were more
committed to the organization, have higher retention rates and higher productivity
(Ishigaki, 2004). Committed employees more likely remained in the employment of
the company longer, resisted competitive job offers, did not actively look for other
employment and recommend the company to others as a good place to work.
H11: Job attitude will mediate the relationship between perceived alternative
employment opportunities and intention to quit
Based on the result of Sobel Test (see Table 37: t value=5.626, p-value=0), it
concludes that job attitude has mediation effect between perceived alternative
___________________________________________________________________________
___________________________________________________________________________
Page 98 of 183
employment opportunities and intention to quit. Based on Table 36, it shows that
perceived alternative employment opportunities has a significant direct effect on
intention to quit where t=9.557, p-value=0.00. Job attitudes has partial mediating
effect between perceived alternative employment opportunities and intention to quit
The turnover model includes the aspects related to ability to move and the aspect
related to the desirability to move (March & Simon, 1958). The idea of turnover is a
function of not only the worker’s ability to move but also include his or her desire to
move. According to Trevor (2001), the desire to move is based on dissatisfaction
with the present job. Dissatisfied workers may be more motivated to leave their job,
less committed to their job and more inclined to quit. In other words, job satisfaction
may bind the worker to their organization.
Mobley (1977) supports the idea that job satisfaction will mediate the intention to
quit. Firstly, the employee evaluates the existing job, the result of which is either job
satisfaction or dissatisfaction. Dissatisfaction, however, stimulates lesser
commitment on the existing job and the thoughts of quitting. In turn, the employee
evaluates job search alternatives and the cost of quitting. If the dissatisfied employee
further believed that an acceptable alternative can be found and the cost of quitting is
not prohibitive, the employee then evaluates the available employment alternative and
compare with the present job. If the comparison favors an alternative, the employee
decides to resign and leaves the job.
___________________________________________________________________________
___________________________________________________________________________
Page 99 of 183
H12: Job attitude will mediate the relationship between occupational stress and
intention to quit
Based on the result of Sobel Test (see Table 41: t value=7.017, p-value=0), it
concludes that job attitude has mediation effect between occupational stress and
intention to quit. Based on Table 40, it shows that occupational stress has a
significant direct effect on intention to quit where t= 11.043, p-value=0.00. Job
attitude has partial mediating effect between occupational stress and intention to quit.
Organization commitment has been found to be a stress moderator (e.g Begley &
Czajka, 1993). According to Begley & Czajka (1993), commitment buffered the
relationship between occupational stress and job displeasure (including job
dissatisfaction, intention to quit and irritation at work). It is established that due to
their positive attitudes, committed employees are less distressed by occupational
stressors and therefore they perceive less stress (Siu, 2002). That is, stress increased
job displeasure only when commitment was low.
Previous research has attributed the indirect or moderating effect of commitment
towards occupational stress. Kobasa, Maddi, & Kahn (1982) supported that
commitment protects individuals from the negative effects of stress because it enables
them to attach direction and meaning to their work. Mowday, Porter, & Steers (1982)
explained that organization commitment can provide people with stability and a
feeling of belonging.
___________________________________________________________________________
___________________________________________________________________________
Page 100 of 183
5.2 Implications
Employees have always been the key asset of an organization. Their departures could
have significant effect on the implementations of the organization’s business plan and
decline in productivity. To understand more on bank employees’ intention to quit,
manager must understand factors influencing intention to quit and the antecedents of
job attitudes that affecting the behaviours.
5.2.1 Empowerment
From our research findings, it clearly indicated that empowerment is the most
important factor affecting intention to quit.
Empowerment incorporates job redesign where it allows the employees more
autonomy to make decisions about how they go about their daily activities and
control over their work (Carless, 2004). Empowerment helps to enhance
effectiveness at work. Through empowerment practice, organization hope to promote
motivation, initiative, implicit knowledge, flexibility, involvement and commitment
required from employees (Foy, 1994; Lawler, 1992).
According to Potter (1994), one of the most effective ways to develop the best out of
their people is to empower them. Porter (1994) suggested that empowerment should
be undertaken in three other issues: alignment, competence and the ability to act. By
alignment means everyone in the organization should understand the nature of their
job objective. Competence means the competencies and abilities of the people in
completing the task and lastly the ability to act where task is delegated to the people
according to their level of competence. The manager’s role then is to provide
coaching and feedback on the employees’ performance. With this, a well empowered
___________________________________________________________________________
___________________________________________________________________________
Page 101 of 183
management will enhance effectiveness and efficiencies in workplace. As a result,
employees demonstrate stronger job satisfaction and organizational commitment, and
thus empowerment helps to lead to lower turnover intention. Therefore, managers
should pay extra attention on how to practice empowerment at workplace.
5.2.2 Organization Justice
Organization justice is found as one of the factors that contributed to intention to quit
among bank employees. Employees will have greater satisfaction when they feel that
they were fairy rewarded for their genuine contributions to the organization and
consistent with the reward policies. The reward many include a variety of benefits
and perquisites other than monetary gains (Choong et al., 2010).
According to Cole & Flint (2004), employees were found having higher job
satisfaction (and hence greater equity and feeling being treated fairly) in their
workplace with flexible plans than those in traditional benefit plans. Flexible plans
involved allocating employer contribution amount by choosing benefits and coverage
levels. Therefore, employees were able to have control over benefit outcomes such as
life insurance, long-term disability, health insurance, life insurance, dental insurance
and pensions. Employers were becoming facilitators rather than providers of benefits
in the flexible benefit plan. This may provide a higher perceived value of benefits
because the employees become more aware of the value of their benefits.
Besides that, this kind of consistent treatment meant that all employees had the
opportunity to make benefit choices and supplied with accurate information in
making their benefit decisions. In this way, organizations take proactive approach to
understand how employees determine their perceptions of procedural and distributive
justice and design a benefit plan accordingly. The organizations then reap the
___________________________________________________________________________
___________________________________________________________________________
Page 102 of 183
benefits including improving employees’ intention to quit, increased employees
satisfaction and enhanced ability to hire.
5.2.3 Perceived Alternative Employment Opportunities
In our study, perceived alternative employment opportunities contribute to intention
to quit. The perception of the employees about other better opportunities available in
the market will foster intention to quit, especially among the younger workers,
identified as Gen X and Millennial. Gen X and Millennial have lesser commitment
within an organization and is likely to quit when better opportunities tagged along
given their higher tertiary of education. It is even prominent if the Gen X employees
are knowledge worker come along with expertise and experience at work. When they
perceived there are many alternatives employment opportunities available in the
market, they will actively search for jobs, attending job interviews and move forward
towards new employment at anytime (Park & Gursoy, 2011).
Learning and development opportunities are crucial to reduce intention to quit among
Gen X and Millennial. Organization must establish a supportive learning and
working climate. In general, it refers to an environment wherein the employees both
learn and work (Govaerts, Kyndt, Dochy, & Baert, 2011). Employees who felt that
they are no longer learning and growing will begin to look externally for new job
opportunities (Rodriguez, 2008). Walker (2001) identified seven factors which can
encourage retention-compensation and appreciation of work performed; the provision
of challenging work, opportunities to learn, positive relationship with colleagues;
recognition of capabilities and performance contributions; good work life balance;
and good communication within the organizations. Echols (2007) suggests that
combined with selective promotion and salary action, the learning and development
___________________________________________________________________________
___________________________________________________________________________
Page 103 of 183
process exert a strong retention activity and reduce intention to quit among
employees.
5.2.4 Occupational Stress
Managers should pay extra attention with regards to occupational stress at workplace
as our research indicates that occupational stress has a very significant (positive)
relationship with intention to quit and ranked the second highest beta with β=0.227, a
crucial factor that influence intention to quit right after empowerment in such that the
managers cannot choose to ignore.
With relation to occupational stress, Deery (2008) suggested that there are number of
actions that can be adopted by the organization to reduce stress at workplace such as
determining the correct staffing levels so that staff are not overloaded; allowing
adequate break during the day; staff functions that involve families; providing health
and well-being access opportunities such as gymnasiums; encouraging sound
management practices; providing adequate resources for staff to undertake their jobs
properly, flexible work arrangements; reward for staff for completing their tasks; and
provision for mandatory leave and day-off. This is also recognized as a type non-
monetary reward system that compliments the monetary reward system.
With this, it is hope that this research can serve as a guide to managers and
organizations to improve on the factors that triggered intention to quit.
___________________________________________________________________________
___________________________________________________________________________
Page 104 of 183
5.3 Limitations of Study
Researcher discovered some limitations in this research project. The limitations had
been identified for improvement of future research in the relevant field.
First, searching for voluntary respondents to participate in this survey was a challenge
because as quitting a company (whether intentionally or unintentionally) is a sensitive
issue. The employees may worry if their employers may found out on their intention
to quit and would prejudice against them in their workplace should they stayed on
with the current company. Hence, this may affect the accuracy of the research
findings.
Secondly, as convenience sampling was employed in this study, the findings might
not reflect the general population as this type of sampling is of non-probability.
Thirdly, this research is conducted on the employees working in the retail banks in
Klang Valley. The research project has covers limited area. Questionnaire survey
based on location might not accurately reflect the attitudes and intention. The
limitation of coverage and location representation may cause the research finding
unable to generalize into large samples.
___________________________________________________________________________
___________________________________________________________________________
Page 105 of 183
5.4 Recommendations for Future Research
For future research, several suggestions can be considered to provide a wider and in-
depth research to measure job attitudes and intention to quit.
According to Table 23, the column adjusted R shows 0.792 (79.2%). It indicates that
only 79.2% of intention to quit had been predicted by the 4 independent variables
(empowerment, organization justice, perceived alternative employment opportunities
and occupational stress). There could be other factors or variables that should be
explored in the future. Some of the “push” factors are such as organization change,
organization support, feeling undervalued, relocation and mobility of staff. Other
factors that “pull” individuals away from a job which relates to new opportunity such
as career advancement, higher pay rise, greater autonomy, and head-hunted by other
competitors. Others may stay put with the current employment due to cost of leaving
the current organization is greater than the new opportunities offered such as stock
options and pensions scheme. Some may experience decrease in value in life should
they change job such as life disruptions, family commitments and health problems.
Future research may also focus on demographic factors such as particular age group
in relation with intention to quit. In this study researcher found a significant
difference for employees’ age group between 20-29 and 30-39 and intention to quit.
This research also concludes that there is no gender difference in their intention to
quit. An in-depth research should be conducted to study gender and socio-economic
and cultures of Malaysia in relations to intention quit.
___________________________________________________________________________
___________________________________________________________________________
Page 106 of 183
5.5 Conclusions
Overall, the present study provides further evidence in revealing the intentions to quit
among the employees is largely influenced by empowerment and occupational stress.
Job attitudes partially mediate the effect of intention to quit. For managers who are
concerned about the impact of intention to quit and possible turnover, these variables
are factors over which they have some control and can be adjusted such as work
overloaded. Managers and supervisors who empower and delegate work will
promote efficient working environment. Employees have more autonomy to make
decisions about how they go about their daily activities and control over their work
will increase job satisfaction and commitment. This helps in reduce work stress
atmosphere in the organization. Through implementation of company policies,
organization can provide support in creating a decent working environment. This in
turn may reduce intention to quit, and subsequent turnover, therefore help the
organization to reduce a considerable amount of financial cost and effort involved in
recruitment, induction and training.
___________________________________________________________________________
___________________________________________________________________________
Page 107 of 183
REFERENCES
Adams, J.S. (1965). Inequity in social exchange. In L. Berkowitz (Ed.), Advances in
experimental social psychology (pp. 267-299). New York: Academic Press.
Ajen, I. (1991). The theory of planned behavior. Organizational Behavior and
Human Decision Processes. 50, 179-211.
Ajzen, I., & Fishbein, M. (1977). Attitude-behavior Relations: A theoretical analysis
and review of empirical research. Psychological Bulletin, 84 (5), 888-918.
Alexander, S., & Ruderman, M. (1987). The role of procedural and distributive
justice in organizational behavior. Social Justice Research, 1, 177-198.
Allen, N.J., & Meyer, J.P. (1990). The measurement and antecedents of effective,
continuance and normative commitment to the organization. Journal of
Occupational Psychology, 63, 1-18.
Antoniou, A.S.G., Davidson, M.J., & Cooper, C.L. (2003). Occupational stress, job
satisfaction and health state in male and female junior hospital doctors in
Greece. Journal of Managerial Psychology, 18(6), 592-621.
Arnold, H.J., & Feldman, D.C. (1982). A multivariate analysis of the determinants of
job turnover. Journal of Applied Psychology, 67, 350-360.
Arthur, M.B., Claman, P.H., & DeFillippi, R.J. (1995). Intelligent enterprise,
intelligent careers. Academy of Management Executive, 9(4), 7-20.
___________________________________________________________________________
___________________________________________________________________________
Page 108 of 183
Bandura, A. (1977). Self-efficacy: Toward a unifying theory of behavioral change.
Psychological Review, 84(2), 191-21.
Banking sector performance likely to moderate next year (2011, December 24).
TheStarOnline. Retrieved January 26, 2012 from
http://biz.thestar.com.my/news/story.asp?file=/2011/12/24/business/10154590
&sec=busine…
Becker, H.S. (1960). Notes on the concept of commitment. American Journal of
Sociology, 66, 32-42.
Begley, T., & Czajka, J. (1993). Penal analysis of the moderating effects of
commitment on satisfaction, intent to quit and health following organizational
change. Journal of Applied Psychology, 78, 552-556.
Bernstein, D.A., & Nash, P.W. (2008). Essentials of psychology (4th
ed.). New York,
NY: Houghton Mifflin.
Beutell, N.J., & Wittig-Berman, U. (2008). Work-family conflict and work-family
synergy for generation X, baby boomers, and matures. Journal of
Managerial Psychology, 23(5), 507.
Bies, R.J., & Shapiro, D.L. (1988). Voice and justification: Their influence on
procedural fairness judgments. Academy of Management Journal, 31, 676-
685.
___________________________________________________________________________
___________________________________________________________________________
Page 109 of 183
Billings, R., & Wemmerus, V. (1983). The role of alternatives in process models of
withdrawal. Proceedings of the 26th
Annual Conference of the Midwestern
Academy of Management, Kalamazoo, MI, pp. 18-29.
Bluedorn, A.C. (1982). A unified model of turnover from organizations. Human
Relations, 35(2), 135-153.
Brandstadter, J., & Renner, G. (1990). Tenacious goal pursuit and flexible goal
adjustment: Explication and age-related analysis of assimilative and
accommodative strategies of coping. Psychology and Aging, 5, 58-67.
Briscoe, J.P., & Hall, D.T. (2006). The interplay of boundaryless and protean careers:
combination and implications. Journal of Vocational Behavior, 69, 4-18.
Byrd, T.G., Cochran, J.K., Silverman, I.J., & Blount, W.R. (2000). Behind bars: An
assessment of the effects of job satisfaction, job-related stress, and anxiety on
jail employees’ inclinations to quit. Journal of Crime and Justice, 23, 69-93.
Carless, S.A. (2004). Does psychological empowerment mediate the relationship
between psychological climate and job satisfaction? Journal of Business and
Psychology, 18(4).
Carmeli, A. (2005). The relationship between organizational culture and withdrawal
intentions and behavior. International Journal of Manpower, 26(2), 177 -195.
Cartwright, S., & Cooper, C.L. (1997). Managing workplace stress. Thousand Oaks,
California: Sage Publications.
___________________________________________________________________________
___________________________________________________________________________
Page 110 of 183
Chen, Y., & Church, A.H. (1993). Reward allocation preferences in groups and
organizations. The International Journal of Conflict Management, 4(1), 25-
59.
Chonko, L.B., Howell, R.D., & Bellinger, D.N. (1986). Congruence in sales force
evaluations: relation to sales force perceptions of conflict and ambiguity.
Journal of Personal Selling & Sales Management, 6(1), 35-47.
Choong K.F., Wong, E.S.K., & Tioh, N.H. (2010). The impact of organizational
justice on employee’s job satisfaction: The Malaysian companies
Perspectives. American Journal of Economics and Business Administration,
2(1), 56-63.
Christina, C. (2011, December 4). All work and no play. TheStarOnline. Retrieved
January 26, 2012, from
http://thestar.com.my/news/story.asp?file=/2011/12/4/nation/9971370&s
ec=nation
Cohen, A., & Golan, R. (2007). Predicting absenteeism and turnover intentions by
past absenteeism and work attitudes: An empirical examination of female
employees in long term nursing care facilities. Career Development
International. 12 (5), 416-432.
Cohen-Charash, Y., & Spector, P.E. (2001). The role of justice in organizations: A
meta-analysis. Organizational Behavior and Human Decision Processes,
86(2), 278-321.
___________________________________________________________________________
___________________________________________________________________________
Page 111 of 183
Cole, N.D., & Flint, D.H. (2004). Perceptions of distributive and procedural justice in
employee benefits: flexible versus traditional benefit plans. Journal of
Managerial Psychology, 19(1), 19-30.
Colquitt, J.A., Wesson, M.J., Porter, C.O.L.H., Conlon, D.E., & Ng, K.Y. (2001).
Justice at the Millennium: A meta-analytic review of 25 years of
organization justice research. Journal of Applied Psychology, 86(3), 425-445.
Conger, J.A., & Kanungo, R.N. (1988). The Empowerment Process: Integrating
theory and practice. The Academy of Management Review, 13(3), 471-482.
Consolidation of Domestic Banking Institutions. (2000, February 14). Bank Negara
Malaysia. Retrieved March 18, 2012, from
http://www.bnm.gov.my/index.php?ch=8&pg=14&ac=&print=1
Cotton. J.L., & Tuttle, J.M. (1986). Employee turnover: A meta-analysis and review
with implications for research. The Academy of Management Review, 11(1),
55-70.
Cranny. C.J., Smith, P.C., & Stone, E.F. (1992). Job satisfaction: How people feel
about their jobs and how it affects their performance. New York: Lexington
Books.
Crithchley, H.D., Rothshtein, P., Nagai, Y., O’Doherty, J., Mathias, C.J., & Dolan,
R.J. (2004). Activity in the human brain predicting differential heart rate
responses to emotional facial expressions. NeuroImage, 24, 751-762.
___________________________________________________________________________
___________________________________________________________________________
Page 112 of 183
Dawal, S.Z., Taha, Z., & Ismail, Z. (2009). Effect of job organization on job
satisfaction among shop floor employees in automotive industries in
Malaysia. International Journal of Industrial Ergonomics. 39, 1-6.
De Cuyper, N., & De Witte, H. (2008). Job insecurity and employability among
temporary workers: A theoretical approach based on the psychological
contract. In K. Naswall, J. Hellgren & M. Sverke (Eds). The individual in the
changing working life (pp. 88 -107). Cambridge, UK: Cambridge, University
Press.
De Cuyper, N., Mauno, S., Kinnunen, U., & Makikangas, A. (2011). The role of job
resources in the relation between perceived employability and turnover
intention: A prospective two- sample study. Journal of Vocational Behavior,
78, 253-263.
Deery, M. (2008). Talent management, work-life balance and retention strategies.
International Journal of Contemporary Hospitality Management, 20(7),
792-806.
DeFillippi, R.J., & Arthur, M.B. (1994). The boundaryless career: A competency
based perspective. Journal of Organizational Behavior, 15, 307-324.
DeFillippi, R.J., & Arthur, M.M. (1996). Boundaryless contexts and careers: A
competency Based Perspecitive. In Arthur, M.B. and D. Rousseau (Ed.),
The Boundaryless Career. Oxford, UK: Oxford University Press.
___________________________________________________________________________
___________________________________________________________________________
Page 113 of 183
DeGrip, A., Van Loo, J., & Sanders, J. (2004). The industry employability index:
Taking account of supply and demand characteristics. International Labour
Review, 143, 211-233.
Deutsch, M. (1975). “Equity, equality, and need: What determines which value will
be used as the basis of distributive justice?”, Journal of Social Issues, 31, 137-
150.
Dharmangadan, B. (1988). Stress at work: a comparison of five occupations,
Psychological Studies, 33(3), 162-169.
Dhesi, D. (2011, December 30). Research houses downgrade banking sector.
TheStarOnline. Retrieved January 26, 2012, from
http://biz.thestar.com.my/news/story.asp?file=/2011/9/30/business/9602151&
sec=business
Dunegan, K.J. (1993). Framing, cognitive modes, and image theory: Toward an
understanding of a glass half full. Journal of Applied Psychology, 78, 491-
503.
Echols, M.E. (2007). Learning’s role in talent management. Chief Learning Officer,
6(10), 36-40.
Elman, C., & O’Rand, A.M. (2002). Perceived job insecurity and entry into work-
related education and training among adult workers. Social Science Research,
31, 49-76
___________________________________________________________________________
___________________________________________________________________________
Page 114 of 183
Fairbrother, K., & Warn, J. (2003). Workplace dimensions, stress & job satisfaction.
Journal of Managerial Psychology, 18(1), 8-21.
Fauzias, M.N. (2003). Malaysian merger & acquisition: theory and selected cases
(2nd
ed): Malaysia: Prentice Hall.
Feldman, D.C., Leana, C.R., & Bolino, M.C. (2002). Underemployment and relative
deprivation among re-employed executives. Journal of Occupational and
Organizational Psychology, 75, 453-471.
Fevre, M.L., Matheny, J., & Kolt, G.S. (2003). Eustress, distress and interpretation in
occupational stress. Journal of Managerial Psychology, 18(7), 726-744.
Firth, L., Mellor, D.J., Moore, K.A., & Loquet, C. (2004). How can managers reduce
employee intention to quit? Journal of Managerial Psychology, 19(2), 170-
187.
Finegold, D., Mohrman, S., & Spreitzer, G.M. (2002). Underemployment and relative
deprivation among re-employed executives. Journal of Occupational and
Organizational Psychology, 75, 453-471.
Folger, R., & Konovsky, M.A. (1989). Effects of procedural and distributive justice
on reactions to pay raise decisions. Academy of Management Journal, 32,
115-130.
Foy, N. (1994). Empowering people at work. Aldershot: Gower.
___________________________________________________________________________
___________________________________________________________________________
Page 115 of 183
Ganster, D.C., & Logan, M.S. (2005). An experimental evaluation of a control
intervention to alleviate job-related stress. Journal of Management, 31(1), 90-
107.
Govaerts, N., Kyndt, E., Dochy, F., & Baert, H. (2011). Influence of learning and
working climate on the retention of talented employees. Journal of Workplace
Learning, 23(1), 35-55.
Greenberg, J. (1990a). Employee theft as a reaction to underpayment inequity: The
hidden cost of pay cuts. Journal of Applied Psychology, 75(5), 561-568.
Greenberg, J. (1990b). Organizational justice: yesterday, today and tomorrow.
Journal of Management, 16, 399-432.
Greenberg, J. & Baron, R.A. (2008). Behavior in organizations (9th
Ed). Upper
Saddle River, New Jersey: Prentice-Hall.
Greenland, S.J. (1994). Rationalization and restructuring in the financial services
sector. International Journal of Retail & Distribution Management, 22 (6),
21-28.
Griffeth, R.W., Hom, P.W., & Gaertner, S. (2000). A meta-analysis of antecedents
and correlates of employee turnover: update, moderator tests, and research
implications for the next millennium. Journal of Management, 26(3), 463-
488.
Hackman, J.R., & Oldham, G.R. (1976). Motivation through the design of work: Test
of a theory. Organizational Behavior and Human Performance, 16, 250-279.
___________________________________________________________________________
___________________________________________________________________________
Page 116 of 183
Hair, J.F., Jr., Babin, B., Money, A.H., & Samoeul, P. (2003). Essentials of Business
Research Methods. United States of America: John Wiley & Sons, Inc.
Hair, J.F., Black, W.C., Babin, B.J., Anderson, R., & Thatham, R.L. (2006).
Multivariate Data Analysis (6th
edition). Upper Saddle River, NJ: Prentice-
Hall.
Hair, Jr., J.F., Money, A.H., Samouel, P., & Page, M. (2007). Research methods for
business. Chichester: John Wiley & Sons.
Hanisch, K.A., & Hulin, C.L. (1991). General attitudes and organizational
withdrawal: An evaluation of a causal model. Journal of Vocational Behavior,
37, 60-78.
Harrison, D.A., Newman, D.A., & Roth, P.L. (2006). How important are job
attitudes? Meta-analytic comparisons of integrative behavioral outcomes and
time sequences. Academy of Management Journal, 49(2), 305 – 325.
Hayes, B.E. (1994). “How to measure empowerment”. Quality Progress, pp.68-78.
Herzberg. F. (1968). One more time: how do you motivate employees? Harvard
Business Review, pp.52 -62.
Hom, P., & Griffeth, R.W. (1988). Locus of control and delay of gratification as
moderators of employee turnover. Journal of Applied Social Psychology, 18:
1318: 1333.
___________________________________________________________________________
___________________________________________________________________________
Page 117 of 183
Hulin, C.L. (1991). Adaptation, persistence, and commitment in organizations. In
M.D. Dunnette & L.M. Hough (Eds), Handbook of Industrial and
Organization Psychology (2nd
ed.) (pp. 445-505). Palo Alto, CA: Consulting
Psychologist Press.
Humborstad, S.I.W., & Perry, C. (2011). Employee empowerment, job satisfaction
and organizational commitment. Chinese Management Studies, 5(3).
Ishigaki, D. (2004). Effective management through measurement. Retrieved January
26, 2012 from http://www.ibm.com/developerworks/rational/library/4786.html
Iqbaria, M. Kassicieh, S.K., & Silver, M. (1999). Career orientations and career
success among research, and development and engineering professionals.
Journal of Engineering and Technology Management, 15, 29-54.
Jamshed K. Khattak., Muhammad A. Khan., Ayaz Ul Haq., Muhammad Arif., &
Amjad A. Minhas. (2011). Occupational stress and burnout in Pakistan’s
banking sector. African Journal of Business Management. 5(3), 810-817.
Judge, T.A., Thoreson, C.J., Bono, J.E., & Patton, G.K. (2001). The job satisfaction –
job performance relations-ship: A qualitative and quantitative review.
Psychological Bulletin, 127, 376-407.
Jurik, N.C., & Musheno, M. (1986). The internal crisis of corrections:
Professionalization and the work environment. Justice Quarterly, 3, 457-480.
___________________________________________________________________________
___________________________________________________________________________
Page 118 of 183
Kahn, H., & Cooper, C.L. (1993). Mental health, job satisfaction, alcohol intake and
occupational stress among dealers in financial markets. Stress Medicine, 6,
285-298.
Kazlauskaite, R., Buciuniene, I., & Turauskas, L. (2006). Building employee
commitment in the hospitality industry. Baltic Journal of Management,
1(3), 300-314.
Kiekbusch, R., Price, W., & Thesis, J. (2003). Turnover predictions: Causes of
employee turnover in sheriff-operated jails. Criminal Justice Studies, 16, 67-
76.
Kinicki, A.J., Schriesheim, C.A., Mckee-Ryan, F.M., & Carson, K.P. (2002).
Assessing the Construct Validity of the Job Descriptive Index: A review and
meta-analysis. Journal of Applied Psychology, 87(1), 14-32.
Kirkman, B.L., & Rosen, B. (1999). Beyond self-management: Antecedents and
consequences of team empowerment. The Academy of Management Journal,
42(1), 58-74.
Kobasa, S.C., Maddi, S.R., & Kahn, S. (1982). Hardiness and health: A prospective
study. Journal of Personality and Social Psychology, 42, 168-177.
Kupperschmidt, B.R. (2000). Multigeneration employees: Strategies for effective
management. The Health Care Manager, 19(1), 65-hyhen.
___________________________________________________________________________
___________________________________________________________________________
Page 119 of 183
Lancaster, L.C., & Stillman, D. (2002). When generations collide: who they are, why
they clash, how to solve the generational puzzle at work. New York, NY:
HarperCollins Publishers, Inc.
Landy, F.J. (1978). An opponent process theory of job satisfaction. Journal of
Applied Psychology, 63, 533-547.
Larson, L.L. (2004). Internal auditors and job stress. Managerial Auditing Journal,
19(9), 1119-1130.
Laventhal, G.S. (1976). The distribution of rewards and resources in groups and
organization. In L. Berkowitz & W. Walster (Eds). Advances in Experimental
Social Psychology (pp. 91-131). New York: Academic Press.
Laventhal, G.S., Karuza, J., & Fry, W.R. (1980). Beyond fairness: A theory of
allocation preferences. In. G. Mikula (Ed). Justice and Social Interaction (pp.
167-218). New York: Springer Verlag.
Lawler, E.E. (1992). The ultimate advantage. San Francisco: Jossey-Bass.
Leka, S., Griffths, A., & Cox, T. (2004). Work organization and stress. Nottingham:
UK. World Health Organization.
Levi, L. (1972). Stress and distress in response to psychosocial stimuli. Oxford:
Pergamon Press.
___________________________________________________________________________
___________________________________________________________________________
Page 120 of 183
Lewis, M.K., & Davis, K.T. (1987). Domestic and international banking. Oxford:
Philip Alan.
Likert, R. (1932). A technique for the measurement of attitudes. Archives of
Psychology, 140, 1-55.
Lind, E.A., & Tyler, T.R. (1988). The social psychology of procedural justice. New
York: Plenum Press.
Locke, E.A. (1969). What is job satisfaction? OB and Human Performance, 4, 309-
336.
Locke, E.A. (1976). Nature and causes of job satisfaction. In: Dunnette, M.D. (Ed.),
Handbook of Industrial and Organizational Psychology (pp. 1297-1349).
Chicago: Rand McNally.
Loi, R., Ngo, H.Y., & Foley, S. (2006). Linking employees’ justice perceptions to
organizational commitment and intention to leave: The mediating role of
perceived organizational support. Journal of Occupational and
Organizational Psychology, 79(1), 101-120.
Mackinnon, D.P., & Dwyer, J.H. (1993). Estimation of mediated effects in prevention
studies. Evaluation Review, 17, 144-158.
Magner, N., Johnson, G.G., & Elfrink, J. (1994). Evidence on the relationship
between procedural and distributive justice in performance appraisal and
account faculty attitudes and performance. Journal of Accounting Education,
12, 325-341.
___________________________________________________________________________
___________________________________________________________________________
Page 121 of 183
Mallinckrodt, B. (1990). Satisfaction with a new job after unemployment:
Consequences of job loss for older professionals. Journal of Counseling
Psychology, 37, 149-152.
March, J., & Simon, H. (1958) Organizations. New York: Wiley.
Martins, N., & Coetzee, M. (2007). Organizational culture, employee satisfaction,
perceived leader emotional competency and personality type: An
exploratory study in a South African engineering company. South African
Journal of Human Resource Management, 5(2), 20-32.
Maslow, A.H. (1943). A theory of human motivation. Psychological Review, 50, 370-
396.
Materson, I. (1980). Stress at work: A managerial perspective. Human Stress Press,
Inc.
McFarlin, D.B., & Sweeney, P.D. (1992). Distributive and procedural justice as
predictors of satisfaction with personal and organizational outcomes. The
Academy of Management Journal, 35 (3), 626-637.
McCall, M.W., Jr., Lombardo, M. M., & Morrison, A. M. (1988). The lessons of
experience: How successful executives develop on the job. Lexington, MA:
Lexington Books.
Menon, S.T. (2001). Employee empowerment: An integrative psychological
approach. Applied Psychology: An International Review, 50, 153-180.
___________________________________________________________________________
___________________________________________________________________________
Page 122 of 183
Meyer, J.P., & Allen, N.J. (1991). A three-component conceptualization of
organizational commitment. Human Resource Management Review, 1(1), 61-
89.
Meyer, J.P., Stanley, D.J., Herscovitch, L., & Topolnytsky, L. (2002). Affective,
continuance, and normative commitment to the organization: A meta-
analysis of antecedents, correlates, and consequences. Journal of Vocational
Behavior, 61, 20-52.
Michaels, C.E., & Spector, P.E. (1982). Causes of employee turnover: A test of the
Mobley, Griffeth, Hand and Meglino Model. Journal of Applied Psychology,
67, 53-39.
Mitchell, O., Mackenzie, D.L., Styve, G.J., & Gover, A. (2000). The impact of
individual, organizational, and environmental attributes on voluntary turnover
among juvenile correctional staff members. Justice Quarterly, 17, 333-357.
Mobley, W.H. (1977). Intermediate linkages in the relationship between job
satisfaction and employee turnover. Journal of Applied Psychology, 62(2),
237-240.
Mobley, W., Griffeth, R., Hand, H., & Meglino, B. (1979). Review and conceptual
analysis of the employee turnover process. Psychological Bulletin, 86, 493-5
22.
Mohd Makhbul, Z., Mohd Radzuan, R., & Mohamad Hasun, F. (2011). What made
they go. Journal of Global Management, 1(1).
___________________________________________________________________________
___________________________________________________________________________
Page 123 of 183
Montgomery, D.C., Blodgett, J.G., & Barnes, J.H. (1996). A model of financial
securities salespersons’ job stress. The Journal of Services Marketing, 10(3),
21-38.
Mowday, R.T., Kobreg, C.S., & McArthur, A.W. (1984). The psychology of the
withdrawal process: A cross-validational test of Mobley’s intermediate
linkages model of turnover in two samples. Academy of Management Journal,
27, 79-94.
Mowday, R.T., Porter, L.W., & Steers, R.M. (1982). Employee-organization
linkages: The psychology of commitment, absenteeism and turnover. New
York: Academic Press.
Mowday, R.T., Steers, R.M., & Porter, L.W. (1979). The measurement of
organizational commitment. Journal of Vocational Behavior, 15, 224-247.
Ng, E.S., Schweitzer, L., & Lyons, S.T. (2010). New generation, great expectations: a
field study of the millennial generation. Journal of Business and
Psychology, 25(2), 281-292.
Ng, T.W.H., & Feldman, D.C. (2007). Organizational embeddedness and
occupational embeddedness across career stages. Journal of Vocational
Behavior, 70, 336-351.
Ng, T.W.H., & Feldman, D. C. (2009). How broadly does education contribute to job
performance. Personnel Psychology, 62(1), 89-134.
___________________________________________________________________________
___________________________________________________________________________
Page 124 of 183
Ng, T.W.H., & Feldman, D.C. (2009). Re-examining the relationship between age
and voluntary turnover. Journal of Vocational Behavior, 74, 283 – 294.
Oberlechner, T., & Nimgade, A. (2005). Work stress and performance among
financial traders. Stress and Health, 21, 285-293.
Oreoluwa, A.R., & Oludele, A. A. (2010). Occupational stress and the Nigerian
Banking Industry. Journal of Economics and Engineering, 1(2), 14-21.
Park, J., & Gursoy, D. (2012). Generation effect on the relationship between work
engagement, satisfaction and turnover intention among US Hotel
Employees. Journal of Hospitality Management, 31(4).
Park, J.S., & Kim, T.H. (2009). Do types of organization culture matter in nurse job
satisfaction and turnover intentions? Leadership in Health Services, 22(2),
20-38.
Pearce, J.L., & Randel, A.E. (2004). Expectations of organizational mobility,
workplace social inclusion, and employee job performance. Journal of
Organizational Behavior, 25, 81-98.
Porter, L.W., Crampon, W.J., & Smith, F.J. (1976). Organizational commitment and
managerial turnover: A longitudinal study, Organizational Behavior and
Human Performance, 15, 87-98.
Porter, L.W., & Lawler, E.E. (1968). Managerial attitudes and performance.
Homewood, IL: Richard D. Irwin, Inc.
___________________________________________________________________________
___________________________________________________________________________
Page 125 of 183
Porter, L.W., Steer, R.M., Mowday, R.T., & Boulian, P.V. (1974). Organizational
commitment, job satisfaction and turnover among psychiatric technicians.
Journal of Applied Psychology, 59, 603-609.
Preacher, K.J., & Leonardelli, G.J. (2010). Calculation for the Sobel test: An
interactive calculation tool for mediation tests. Retrieved July 14, 2011, from
http://people.ku.edu/- preacher/sobel/sobel.htm.
Price, J.L., & Mueller, C.W. (1981). A causal model of turnover for nurses. Academy
of Management Journal, 24, 543-565.
Price, J.L., & Mueller, C.W. (1986). On the causal ordering of job satisfaction and
organization commitment. The Academy of Management Journal, 29(4), 847-
858.
Quinn, R.E., & Spreitzer, G.M. (1997). The road to empowerment: Seven questions
every leader should consider. Organizational Dynamics, 37-49.
Rodahl, K. (1989). The physiology of work: London: Taylor & Francis.
Rodriguez, R. (2008). Learning’s impact on talent flow. Chief Learning Officer, 7(4),
50-64.
Rosin, H.M., & Korabik, K. (1991). “Executive Women: A close-up view of the
corporate experience”, Equal Opportunities International, 10(3), 38-45.
Rothmann, S., & Coetzer, E. (2002). The relationship between personality dimensions
and job satisfaction, Business Dynamics, 11(1), 29-42.
___________________________________________________________________________
___________________________________________________________________________
Page 126 of 183
Rothwell, A., & Arnold, J. (2007). Self-perceived employability: Development and v
alidation of a scale. Personnel Review, 36(1), 23-41.
Rowe, R., & Snizek, W.E. (1995), Gender differences in work values: Perpetuating
the myth. Work and Occupations, 22, 215-229.
Rust, R.T., Steward, G.L., Miller, H., & Pielack. (1996) The satisfaction and retention
of frontline employees-A customer satisfaction measurement approach.
International Journal of Service Industry Management, 7(5), 62-80.
Ryder, N.B. (1965). The cohort as a concept in the study of social change. American
Sociological Review, 30, 843-861.
Sekaran, U., & Bougie, R. (2009). Research methods for business: A skill building
approach. John Wiley & Sons: Boston.
Selye, H. (1984). The stress of life. New York: McGraw-Hill.
Shore, L.M., & Martin, H.J. (1989). Job satisfaction and organizational commitment
in relation to work performance and turnover intentions. Human Relations,
42(7), 625-638.
Shore, L.M., Newton, L.A., & Thornton III, G. C. (1990). Job and organizational
attitudes in relation to employee behavioral intentions. Journal of
Organizational Behavior, 11, 57-67.
___________________________________________________________________________
___________________________________________________________________________
Page 127 of 183
Siu, O.L. (2002). Occupational stressors and well-being among chinese employees:
The role of organizational commitment. Applied Psychology: An International
Review, 51(4), 527-544.
Smith, P.C., Kendall, L.M., & Hulin, C.L. (1969). The measurement of satisfaction
in work and retirement. Chicago: Rand McNally.
Smola, K.W., & Sutton, C.D. (2002). Generational differences: revisiting
generational work values for the new millennium. Journal of Organizational
Behavior, 23(4), 363-382.
Spector, P.E. (1997). Job satisfaction: Application, assessment, causes, and
consequences. Thousand Oaks, CA.: Sage.
Spreitzer, G.M. (1995a). Psychological empowerment in the workplace: Dimensions,
measurement, and Validation. Academy of Management Journal, 38, 1442-
1465.
Spreitzer, G.M. (1996). Social structural characteristics of psychological
empowerment. Academy of Management Journal, 39, 483-504.
Steel, R.P., & Griffeth, R.W. (1989). The elusive relationship between perceived
employment opportunity and turnover behavior: A methodological or
conceptual artifact? Journal of Applied Psychology, 846-854.
Sterns, H.L., & Gray, J.H. (1999). Work, leisure, and retirement. In J. Cavanaugh &
S. Whitbourne (Eds.), Gerontology (pp. 355-390). New York: Oxford
University Press.
___________________________________________________________________________
___________________________________________________________________________
Page 128 of 183
Steverink, N., & Lindenberg, S. (2006). Which social needs are important for
subjective well-being? What happens to them with aging? Psychology and
Aging, 21, 281-290.
Stohr, M.K., Self, R.L., & Lovrich, N.P. (1992). Staff turnover in new generation
jails: An investigation of its causes and prevention. Journal of Criminal
Justice, 20, 455-478.
Sufian, F., & Habibullah, M.S. (2009). Do mergers and acquisitions leads to a higher
technical and scale efficiency? A counter evidence from Malaysia. Africa
Journal of Business Management, 3 (8), 340-349.
Sullivan, S.E. (1999). The changing nature of careers: A review and research agenda.
Journal of Management, 25, 457-484.
Thibaut, J., & Walker, L. (1975). Procedural justice: A psychological analysis.
Hillsdale, NJ: Erlbaum.
Thomas, K.W., & Velthouse, B.A. (1990). Cognitive elements of empowerment: An
“interpretive” model of intrinsic task motivation. Academy of Management
Review, 15, 666-681.
Trevor, C. (2001). Interactions among actual ease-of-movement determinants and job
satisfaction in prediction of voluntary turnover. Journal of Academy
Management, 44(6), 621-638.
___________________________________________________________________________
___________________________________________________________________________
Page 129 of 183
Twenge, J.M., Campbell, S.M., Hoffman, B.J., & Lance, C.E. (2010). Generational
differences in work values: Leisure and extrinsic values increasing, social and
intrinsic values decreasing. Journal of Management, 36(5), 1117.
Twenge, J.M., & Campbell, W.K. (2001). Age and birth cohort differences in self-
esteem: Across temporal meta-analysis. Personality and Social Psychology
Review, 5(4), 321.
Twenge, J.M., Zhang, L., & Im, C. (2004). It’s beyond my control: A cross-temporal
meta-analysis of increasing externality in locus of control, 1960-2002.
Personality and Social Psychology Review, 8(3), 308.
Vroom, V.H. (1964). Work and Motivation. New York: Wiley.
Walker, J.W. (2001). Zero defections? Human Resource Planning, 24(1), 6-8.
Wei (Amy) Tian-Foreman. (2009) Job satisfaction and turnover in the Chinese
retail industry, Chinese Management Studies, 3(4), 356-378.
Weiss, E.N., & Maurer, T.J. (2004). Age discrimination in personnel decisions: A re-
examination. Journal of Applied Social Psychology, 34, 1551-1562.
Wiener, Y., & Vardi, Y. (1980). Relationships between job, organization, and career
commitments and work outcomes – an integrative approach. Organizational
Behavior and Human Performance, 26, 81 -96.
Wilkinson, A. (1998). Empowerment: theory and practice. Personnel Review, 27(1),
40-56.
___________________________________________________________________________
___________________________________________________________________________
Page 130 of 183
Wright L.A., & Smye, M.D. (1996). Corporate abuse: How lean and mean robs
people and profits. New York: Macmillan.
Zikmund, W.G. (2003). Business research method (7th
ed.). South-Western:
Thomson.
___________________________________________________________________________
___________________________________________________________________________
Page 131 of 183
APPENDIX A
APPENDIX A1: RESEARCH QUESTIONAIRE
UNIVERSITI TUNKU ABDUL RAHMAN
FACULTY OF ACCOUNTANCY AND MANAGEMENT
Dear Participants,
I am currently pursuing a Master of Business Administration (MBA) at Universiti
Tunku Abdul Rahman (UTAR). I am soliciting your co-operation to participate in
this research project questionnaire entitled “Factors Influencing Intention to Quit
Among Bank Employees in Malaysia” The purpose of this research is to find out
how each factor affecting bank employees’ intention to leave an organization.
I would be most grateful if you could complete the enclosed questionnaire based on
your genuine feelings. The validity of the study will highly dependent on your
sincere and honest response. The questionnaire may take about 10-15minutes to
complete.
Please rest assured that your responses will be used for our research purposes only.
All personal information shall be treated as strictly private and confidential.
Should you have any queries regarding the questionnaires, please do not hesitate to
contact the undersigned at [email protected].
Thank you for your precious time and participation.
___________________________________________________________________________
___________________________________________________________________________
Page 132 of 183
QUESTIONAIRE
Section I: General Information
Please provide the following information:-
1. Gender: a. Male b. Female
2. Marital status: a. Single c. Divorced
b. Married d. Widowed
3. Age: a. 20- 29 c. 40 – 49
b. 30– 39 d. 50 and above
4. Year of birth: _______________ (for e.g. year 1977)
5. Highest education level: a. Secondary c. Bachelor Degree
b. Diploma d. Postgraduate
6. Job level a. Clerk c. Executive
b. Officer d. Manager
7. Working experience
a. 5 and below c. 11 -15 e. 21 and above
b. 6 -10 d. 16-20
8. How many years attached with current organization
a. Below 3 years c. 6 years and below 9 years e.12 years and above
b. 3 years and below 6 years d. 9 years and below 12 years
9. Annual income:
a. Below RM24,000 c. RM30,001 – RM36,000 e. RM42,001 and above
b. RM24,001 – RM30,000 d. RM36,001 – RM42,000
10. Current salary scheme
a. Fixed salary b. Variable salary (basic and commission)
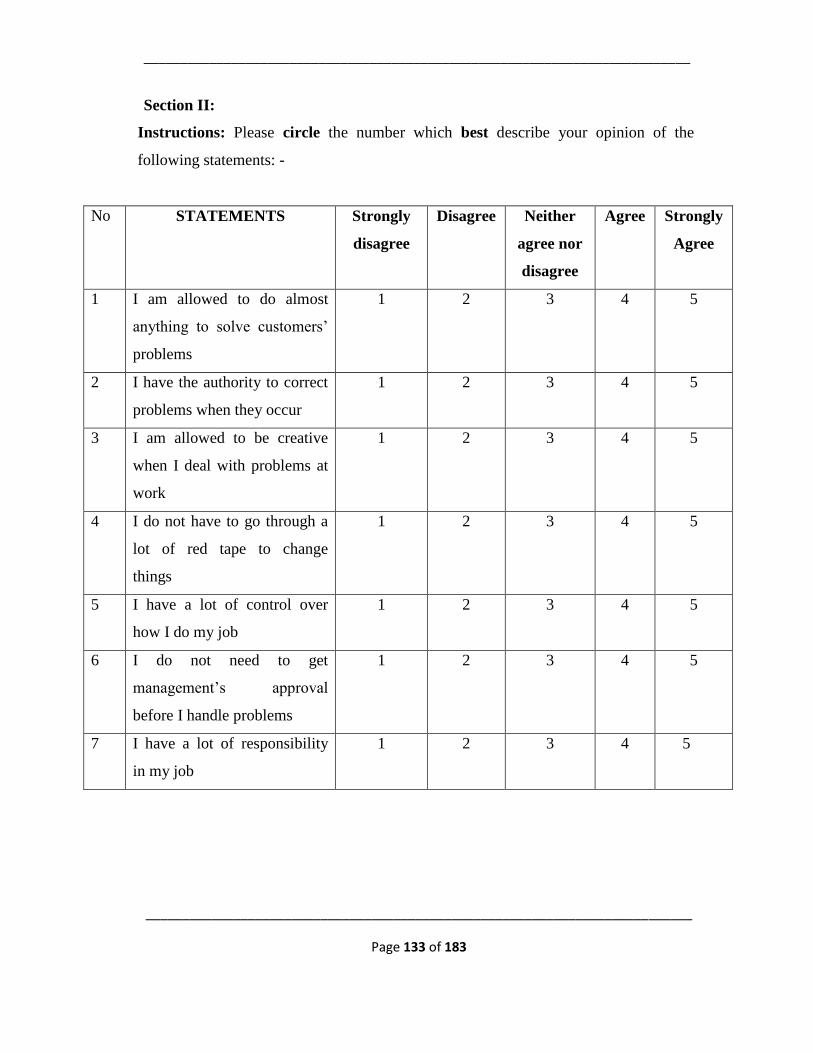
___________________________________________________________________________
___________________________________________________________________________
Page 133 of 183
Section II:
Instructions: Please circle the number which best describe your opinion of the
following statements: -
No STATEMENTS Strongly
disagree
Disagree Neither
agree nor
disagree
Agree Strongly
Agree
1 I am allowed to do almost
anything to solve customers’
problems
1 2 3 4 5
2 I have the authority to correct
problems when they occur
1 2 3 4 5
3 I am allowed to be creative
when I deal with problems at
work
1 2 3 4 5
4 I do not have to go through a
lot of red tape to change
things
1 2 3 4 5
5 I have a lot of control over
how I do my job
1 2 3 4 5
6 I do not need to get
management’s approval
before I handle problems
1 2 3 4 5
7 I have a lot of responsibility
in my job
1 2 3 4 5
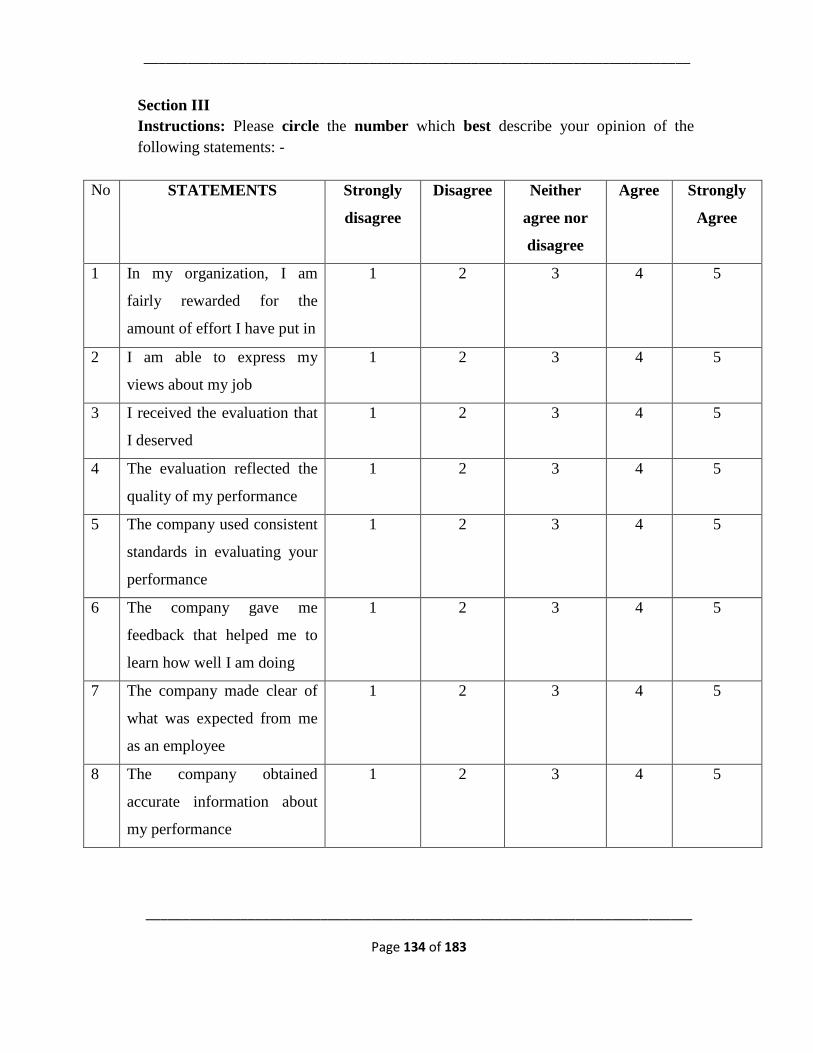
___________________________________________________________________________
___________________________________________________________________________
Page 134 of 183
Section III
Instructions: Please circle the number which best describe your opinion of the
following statements: -
No STATEMENTS Strongly
disagree
Disagree Neither
agree nor
disagree
Agree Strongly
Agree
1 In my organization, I am
fairly rewarded for the
amount of effort I have put in
1 2 3 4 5
2 I am able to express my
views about my job
1 2 3 4 5
3 I received the evaluation that
I deserved
1 2 3 4 5
4 The evaluation reflected the
quality of my performance
1 2 3 4 5
5 The company used consistent
standards in evaluating your
performance
1 2 3 4 5
6 The company gave me
feedback that helped me to
learn how well I am doing
1 2 3 4 5
7 The company made clear of
what was expected from me
as an employee
1 2 3 4 5
8 The company obtained
accurate information about
my performance
1 2 3 4 5
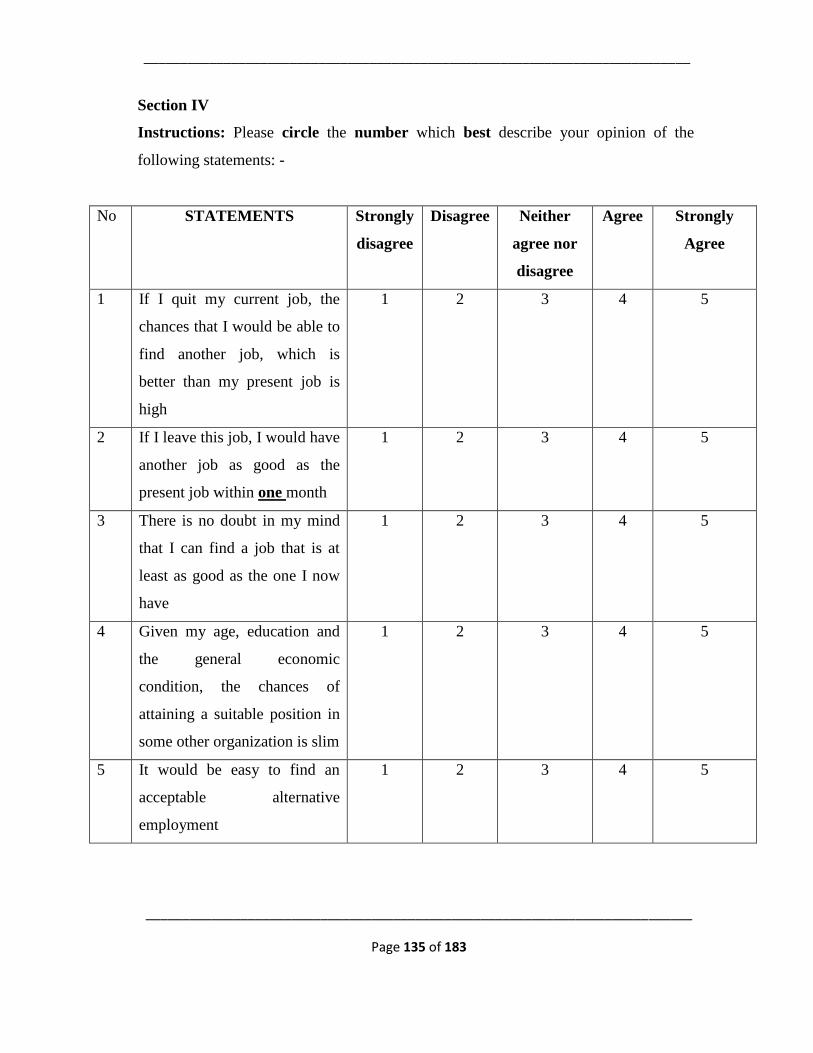
___________________________________________________________________________
___________________________________________________________________________
Page 135 of 183
Section IV
Instructions: Please circle the number which best describe your opinion of the
following statements: -
No STATEMENTS Strongly
disagree
Disagree Neither
agree nor
disagree
Agree Strongly
Agree
1 If I quit my current job, the
chances that I would be able to
find another job, which is
better than my present job is
high
1 2 3 4 5
2 If I leave this job, I would have
another job as good as the
present job within one month
1 2 3 4 5
3 There is no doubt in my mind
that I can find a job that is at
least as good as the one I now
have
1 2 3 4 5
4 Given my age, education and
the general economic
condition, the chances of
attaining a suitable position in
some other organization is slim
1 2 3 4 5
5 It would be easy to find an
acceptable alternative
employment
1 2 3 4 5
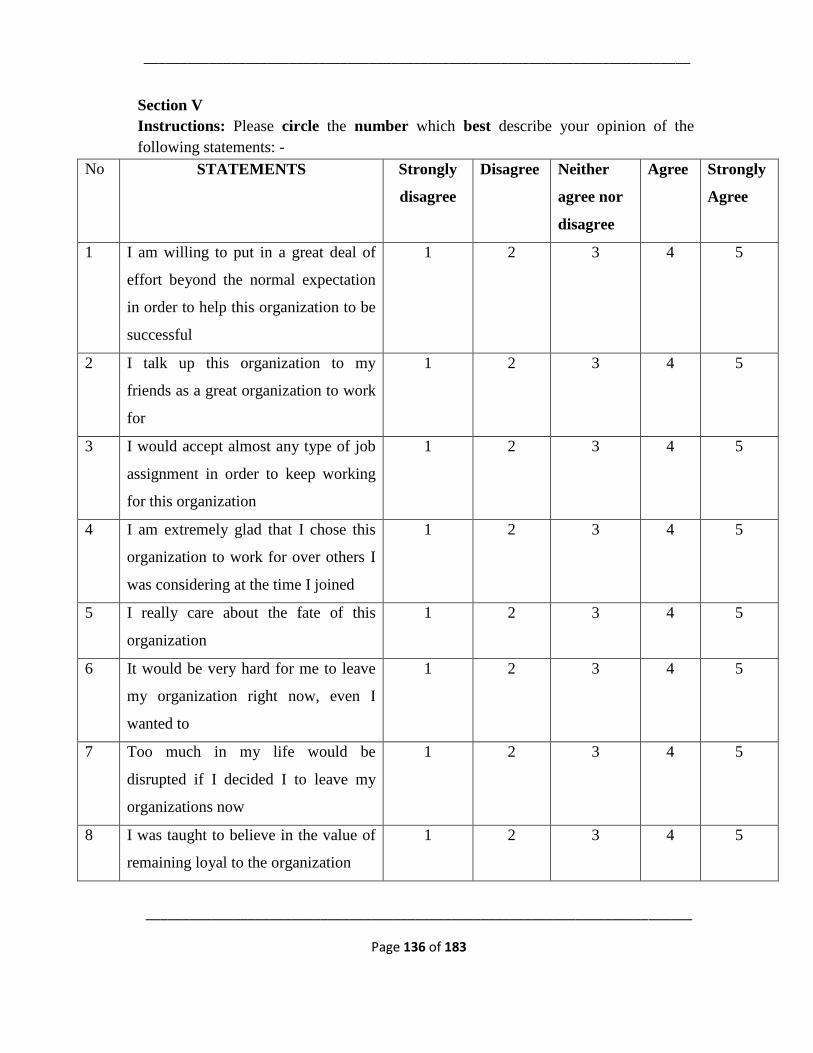
___________________________________________________________________________
___________________________________________________________________________
Page 136 of 183
Section V
Instructions: Please circle the number which best describe your opinion of the
following statements: -
No STATEMENTS Strongly
disagree
Disagree Neither
agree nor
disagree
Agree Strongly
Agree
1 I am willing to put in a great deal of
effort beyond the normal expectation
in order to help this organization to be
successful
1 2 3 4 5
2 I talk up this organization to my
friends as a great organization to work
for
1 2 3 4 5
3 I would accept almost any type of job
assignment in order to keep working
for this organization
1 2 3 4 5
4 I am extremely glad that I chose this
organization to work for over others I
was considering at the time I joined
1 2 3 4 5
5 I really care about the fate of this
organization
1 2 3 4 5
6 It would be very hard for me to leave
my organization right now, even I
wanted to
1 2 3 4 5
7 Too much in my life would be
disrupted if I decided I to leave my
organizations now
1 2 3 4 5
8 I was taught to believe in the value of
remaining loyal to the organization
1 2 3 4 5
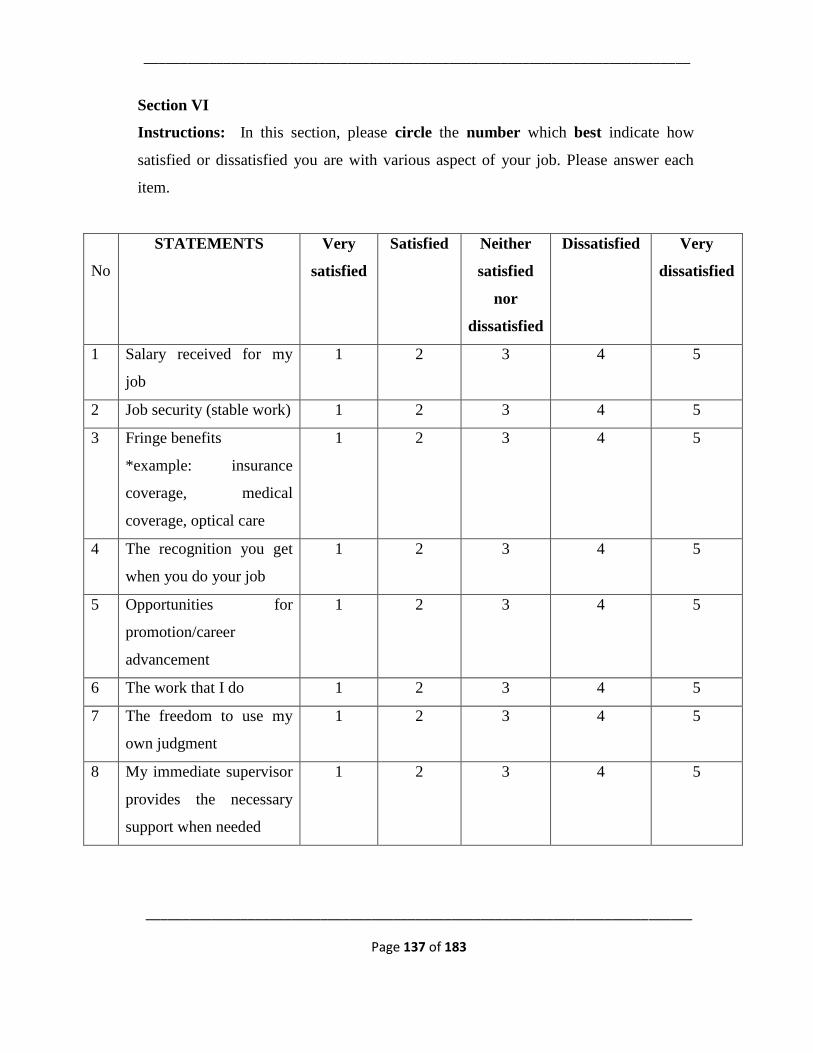
___________________________________________________________________________
___________________________________________________________________________
Page 137 of 183
Section VI
Instructions: In this section, please circle the number which best indicate how
satisfied or dissatisfied you are with various aspect of your job. Please answer each
item.
No
STATEMENTS Very
satisfied
Satisfied Neither
satisfied
nor
dissatisfied
Dissatisfied Very
dissatisfied
1 Salary received for my
job
1 2 3 4 5
2 Job security (stable work) 1 2 3 4 5
3 Fringe benefits
*example: insurance
coverage, medical
coverage, optical care
1 2 3 4 5
4 The recognition you get
when you do your job
1 2 3 4 5
5 Opportunities for
promotion/career
advancement
1 2 3 4 5
6 The work that I do 1 2 3 4 5
7 The freedom to use my
own judgment
1 2 3 4 5
8 My immediate supervisor
provides the necessary
support when needed
1 2 3 4 5
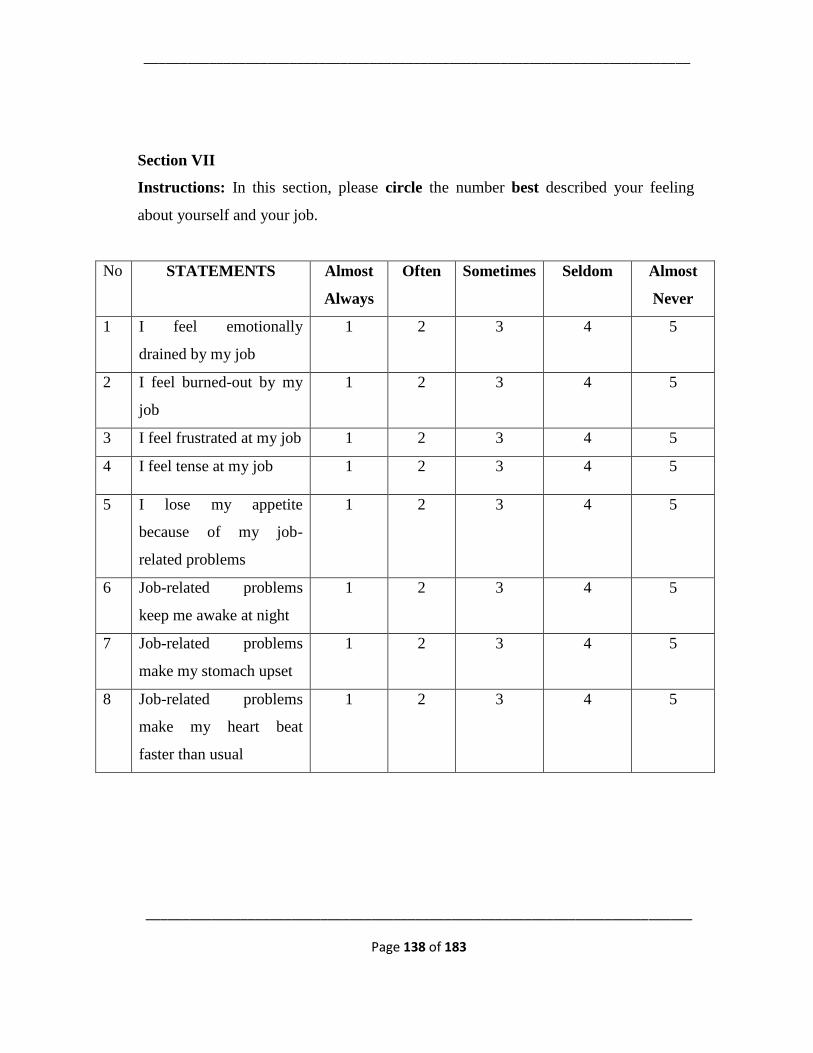
___________________________________________________________________________
___________________________________________________________________________
Page 138 of 183
Section VII
Instructions: In this section, please circle the number best described your feeling
about yourself and your job.
No STATEMENTS Almost
Always
Often Sometimes Seldom Almost
Never
1 I feel emotionally
drained by my job
1 2 3 4 5
2 I feel burned-out by my
job
1 2 3 4 5
3 I feel frustrated at my job 1 2 3 4 5
4 I feel tense at my job 1 2 3 4 5
5 I lose my appetite
because of my job-
related problems
1 2 3 4 5
6 Job-related problems
keep me awake at night
1 2 3 4 5
7 Job-related problems
make my stomach upset
1 2 3 4 5
8 Job-related problems
make my heart beat
faster than usual
1 2 3 4 5
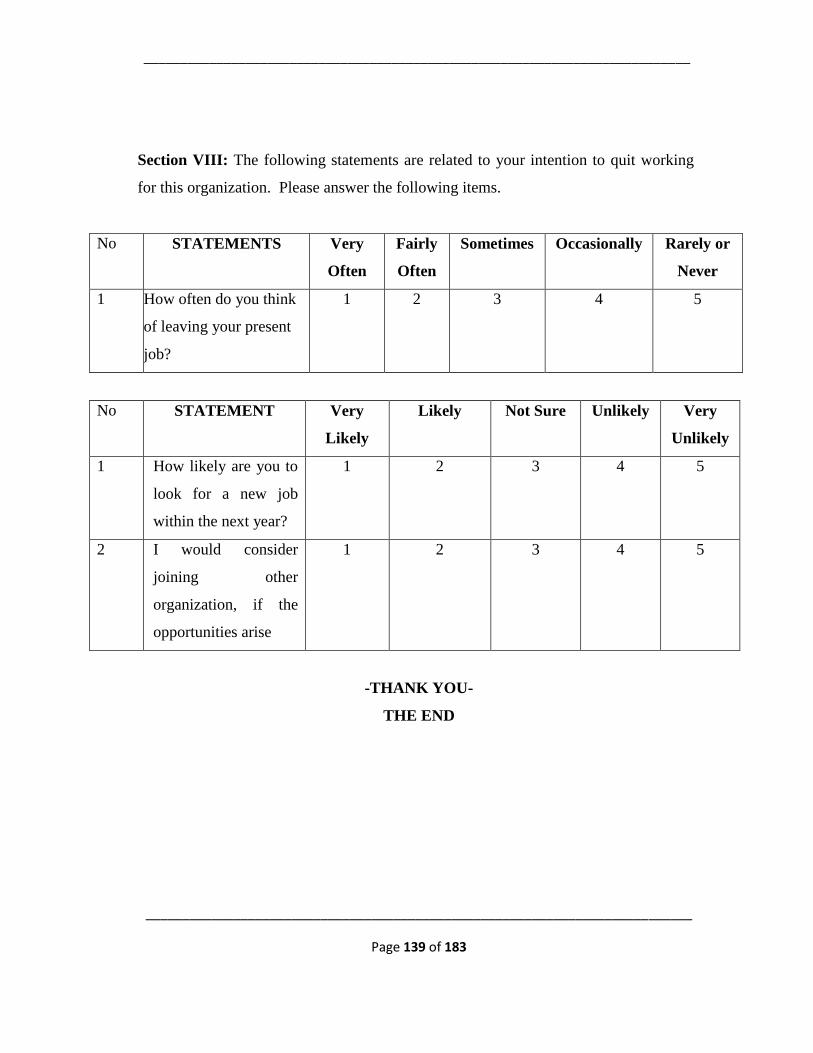
___________________________________________________________________________
___________________________________________________________________________
Page 139 of 183
Section VIII: The following statements are related to your intention to quit working
for this organization. Please answer the following items.
No STATEMENTS Very
Often
Fairly
Often
Sometimes Occasionally Rarely or
Never
1 How often do you think
of leaving your present
job?
1 2 3 4 5
No STATEMENT Very
Likely
Likely Not Sure Unlikely Very
Unlikely
1 How likely are you to
look for a new job
within the next year?
1 2 3 4 5
2 I would consider
joining other
organization, if the
opportunities arise
1 2 3 4 5
-THANK YOU-
THE END
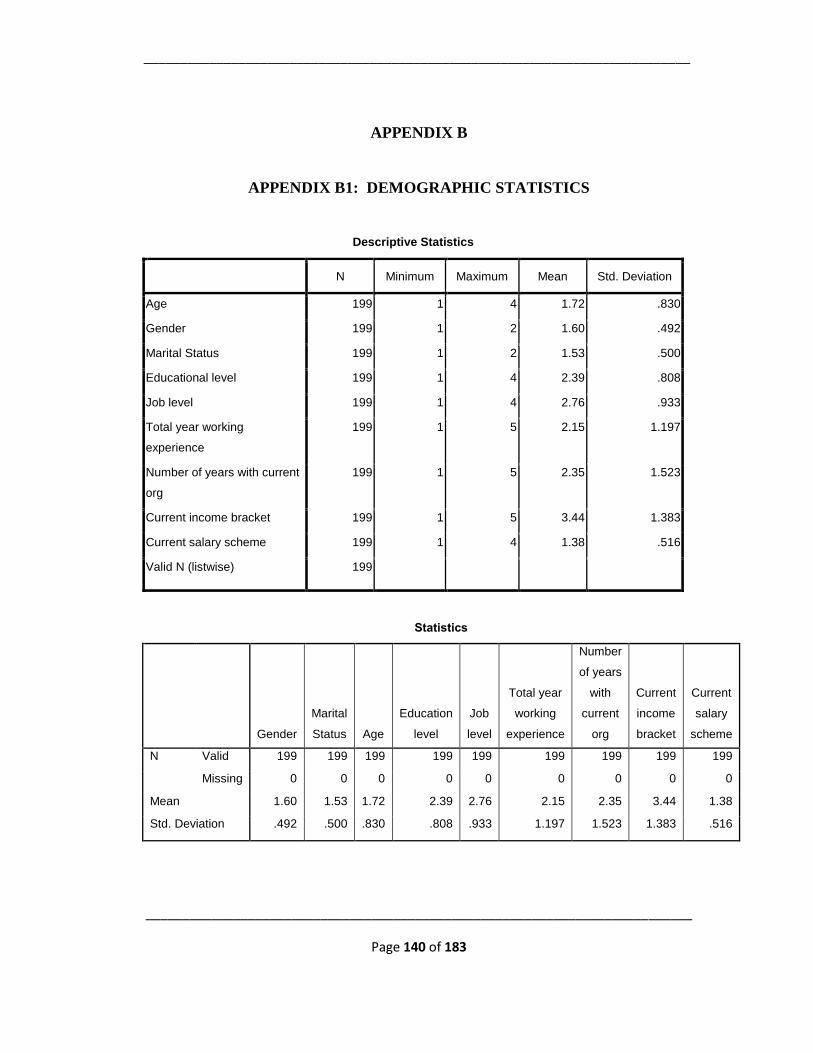
___________________________________________________________________________
___________________________________________________________________________
Page 140 of 183
APPENDIX B
APPENDIX B1: DEMOGRAPHIC STATISTICS
Descriptive Statistics
N Minimum Maximum Mean Std. Deviation
Age 199 1 4 1.72 .830
Gender 199 1 2 1.60 .492
Marital Status 199 1 2 1.53 .500
Educational level 199 1 4 2.39 .808
Job level 199 1 4 2.76 .933
Total year working
experience
199 1 5 2.15 1.197
Number of years with current
org
199 1 5 2.35 1.523
Current income bracket 199 1 5 3.44 1.383
Current salary scheme 199 1 4 1.38 .516
Valid N (listwise) 199
Statistics
Gender
Marital
Status Age
Education
level
Job
level
Total year
working
experience
Number
of years
with
current
org
Current
income
bracket
Current
salary
scheme
N Valid 199 199 199 199 199 199 199 199 199
Missing 0 0 0 0 0 0 0 0 0
Mean 1.60 1.53 1.72 2.39 2.76 2.15 2.35 3.44 1.38
Std. Deviation .492 .500 .830 .808 .933 1.197 1.523 1.383 .516
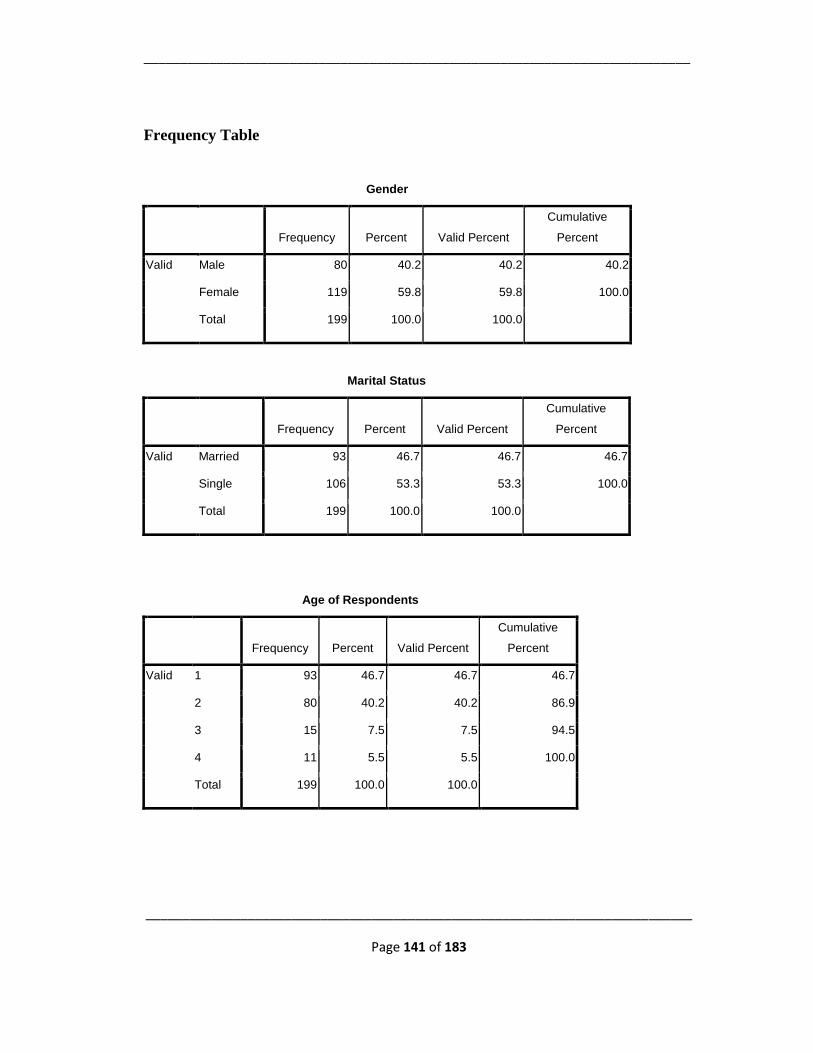
___________________________________________________________________________
___________________________________________________________________________
Page 141 of 183
Frequency Table
Gender
Frequency Percent Valid Percent
Cumulative
Percent
Valid Male 80 40.2 40.2 40.2
Female 119 59.8 59.8 100.0
Total 199 100.0 100.0
Marital Status
Frequency Percent Valid Percent
Cumulative
Percent
Valid Married 93 46.7 46.7 46.7
Single 106 53.3 53.3 100.0
Total 199 100.0 100.0
Age of Respondents
Frequency Percent Valid Percent
Cumulative
Percent
Valid 1 93 46.7 46.7 46.7
2 80 40.2 40.2 86.9
3 15 7.5 7.5 94.5
4 11 5.5 5.5 100.0
Total 199 100.0 100.0
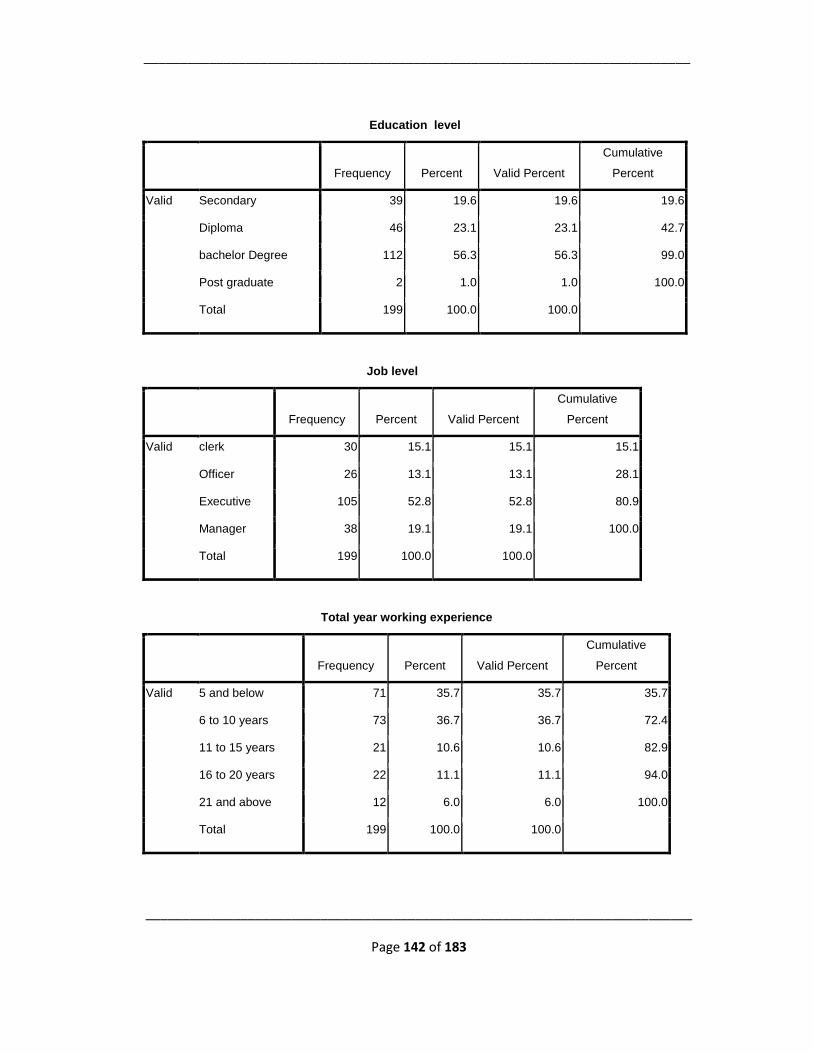
___________________________________________________________________________
___________________________________________________________________________
Page 142 of 183
Education level
Frequency Percent Valid Percent
Cumulative
Percent
Valid Secondary 39 19.6 19.6 19.6
Diploma 46 23.1 23.1 42.7
bachelor Degree 112 56.3 56.3 99.0
Post graduate 2 1.0 1.0 100.0
Total 199 100.0 100.0
Job level
Frequency Percent Valid Percent
Cumulative
Percent
Valid clerk 30 15.1 15.1 15.1
Officer 26 13.1 13.1 28.1
Executive 105 52.8 52.8 80.9
Manager 38 19.1 19.1 100.0
Total 199 100.0 100.0
Total year working experience
Frequency Percent Valid Percent
Cumulative
Percent
Valid 5 and below 71 35.7 35.7 35.7
6 to 10 years 73 36.7 36.7 72.4
11 to 15 years 21 10.6 10.6 82.9
16 to 20 years 22 11.1 11.1 94.0
21 and above 12 6.0 6.0 100.0
Total 199 100.0 100.0
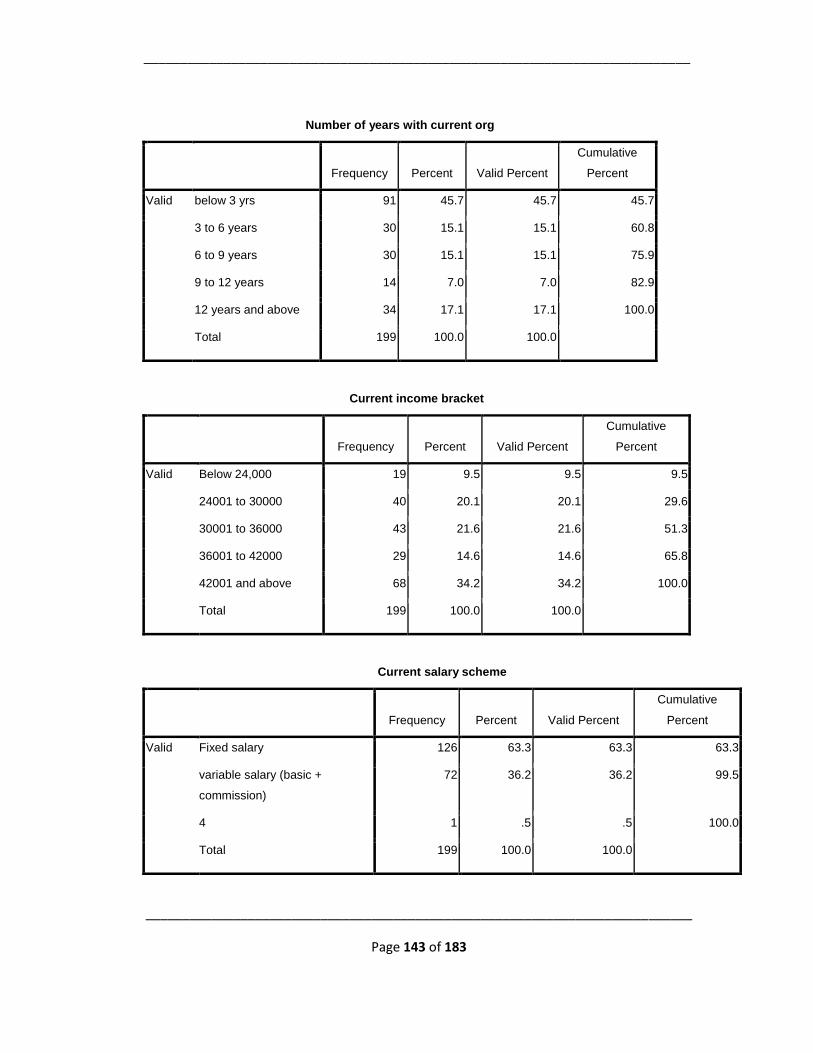
___________________________________________________________________________
___________________________________________________________________________
Page 143 of 183
Number of years with current org
Frequency Percent Valid Percent
Cumulative
Percent
Valid below 3 yrs 91 45.7 45.7 45.7
3 to 6 years 30 15.1 15.1 60.8
6 to 9 years 30 15.1 15.1 75.9
9 to 12 years 14 7.0 7.0 82.9
12 years and above 34 17.1 17.1 100.0
Total 199 100.0 100.0
Current income bracket
Frequency Percent Valid Percent
Cumulative
Percent
Valid Below 24,000 19 9.5 9.5 9.5
24001 to 30000 40 20.1 20.1 29.6
30001 to 36000 43 21.6 21.6 51.3
36001 to 42000 29 14.6 14.6 65.8
42001 and above 68 34.2 34.2 100.0
Total 199 100.0 100.0
Current salary scheme
Frequency Percent Valid Percent
Cumulative
Percent
Valid Fixed salary 126 63.3 63.3 63.3
variable salary (basic +
commission)
72 36.2 36.2 99.5
4 1 .5 .5 100.0
Total 199 100.0 100.0
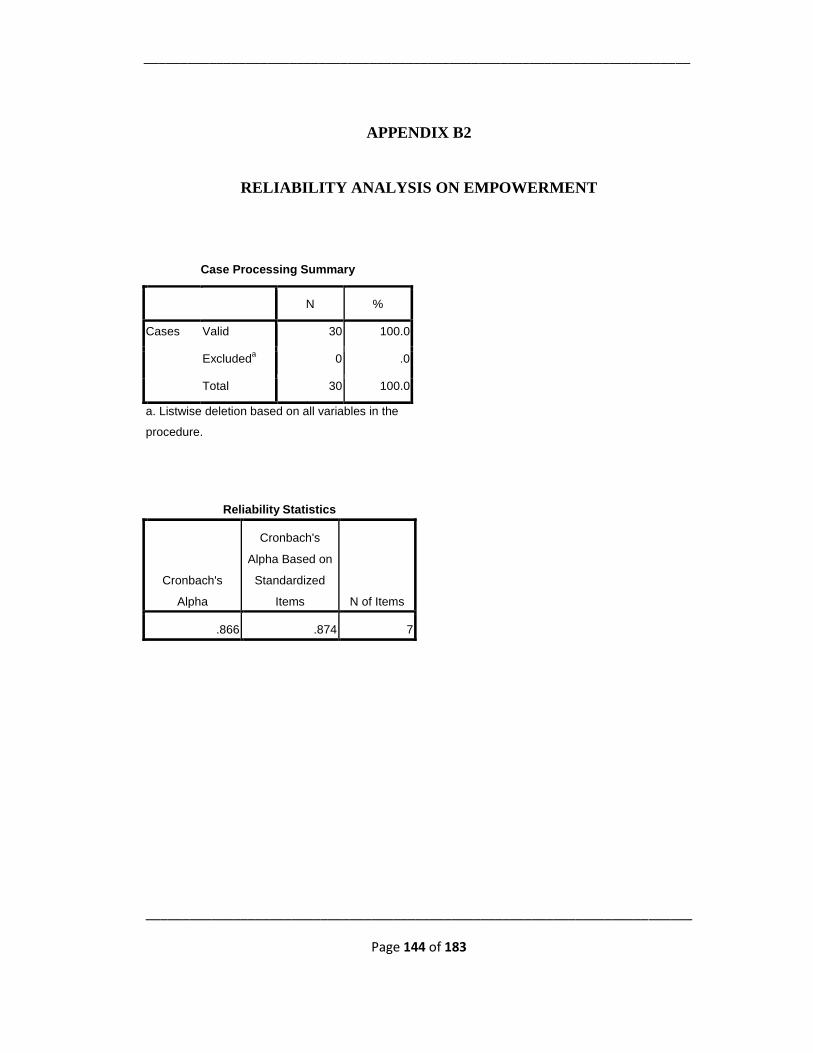
___________________________________________________________________________
___________________________________________________________________________
Page 144 of 183
APPENDIX B2
RELIABILITY ANALYSIS ON EMPOWERMENT
Case Processing Summary
N %
Cases Valid 30 100.0
Excludeda 0 .0
Total 30 100.0
a. Listwise deletion based on all variables in the
procedure.
Reliability Statistics
Cronbach's
Alpha
Cronbach's
Alpha Based on
Standardized
Items N of Items
.866 .874 7
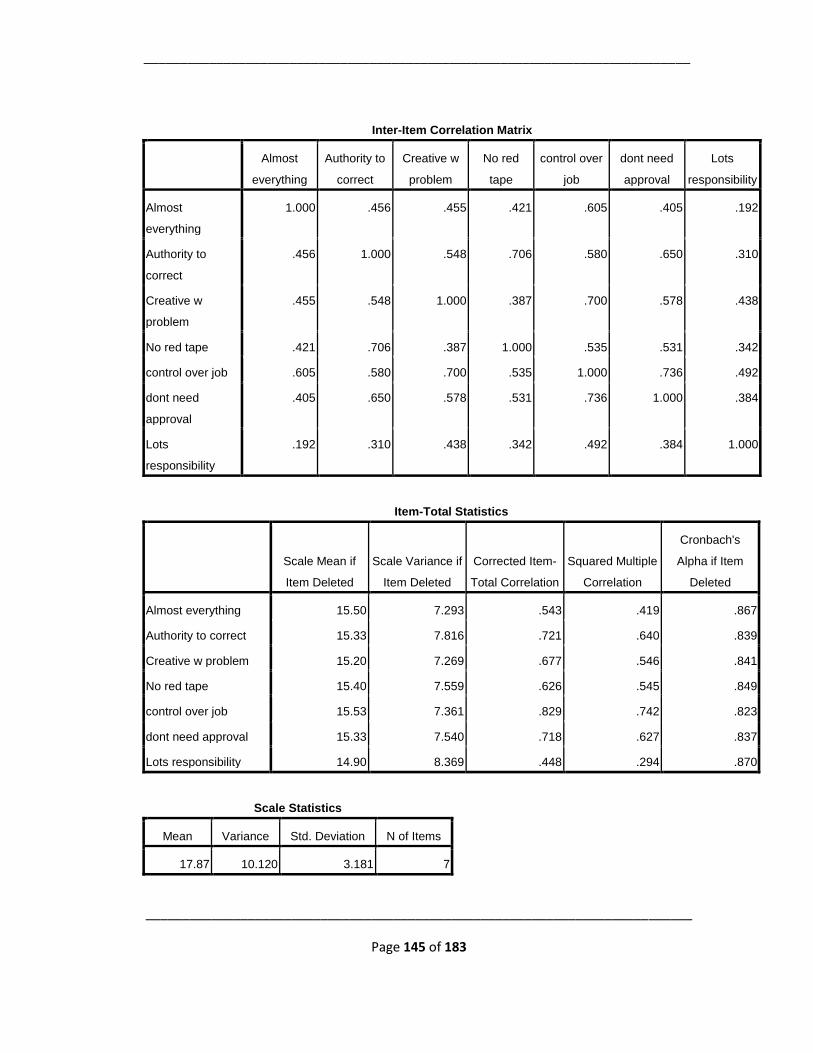
___________________________________________________________________________
___________________________________________________________________________
Page 145 of 183
Inter-Item Correlation Matrix
Almost
everything
Authority to
correct
Creative w
problem
No red
tape
control over
job
dont need
approval
Lots
responsibility
Almost
everything
1.000 .456 .455 .421 .605 .405 .192
Authority to
correct
.456 1.000 .548 .706 .580 .650 .310
Creative w
problem
.455 .548 1.000 .387 .700 .578 .438
No red tape .421 .706 .387 1.000 .535 .531 .342
control over job .605 .580 .700 .535 1.000 .736 .492
dont need
approval
.405 .650 .578 .531 .736 1.000 .384
Lots
responsibility
.192 .310 .438 .342 .492 .384 1.000
Item-Total Statistics
Scale Mean if
Item Deleted
Scale Variance if
Item Deleted
Corrected Item-
Total Correlation
Squared Multiple
Correlation
Cronbach's
Alpha if Item
Deleted
Almost everything 15.50 7.293 .543 .419 .867
Authority to correct 15.33 7.816 .721 .640 .839
Creative w problem 15.20 7.269 .677 .546 .841
No red tape 15.40 7.559 .626 .545 .849
control over job 15.53 7.361 .829 .742 .823
dont need approval 15.33 7.540 .718 .627 .837
Lots responsibility 14.90 8.369 .448 .294 .870
Scale Statistics
Mean Variance Std. Deviation N of Items
17.87 10.120 3.181 7
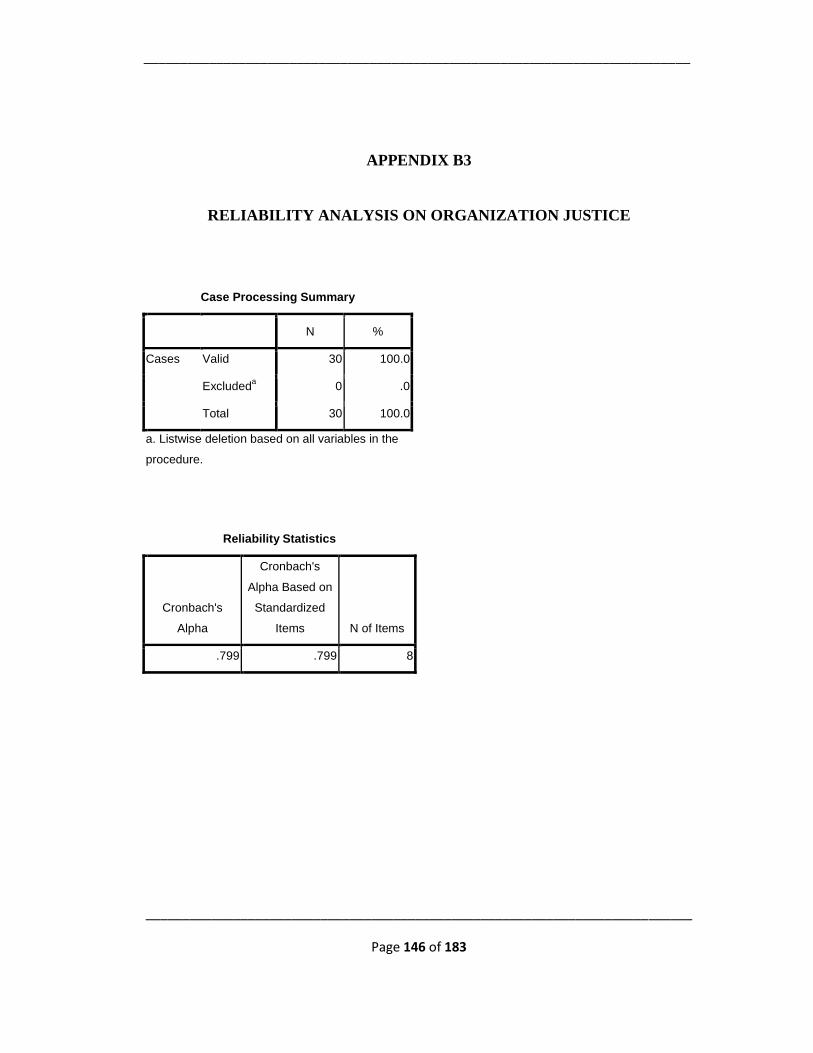
___________________________________________________________________________
___________________________________________________________________________
Page 146 of 183
APPENDIX B3
RELIABILITY ANALYSIS ON ORGANIZATION JUSTICE
Case Processing Summary
N %
Cases Valid 30 100.0
Excludeda 0 .0
Total 30 100.0
a. Listwise deletion based on all variables in the
procedure.
Reliability Statistics
Cronbach's
Alpha
Cronbach's
Alpha Based on
Standardized
Items N of Items
.799 .799 8
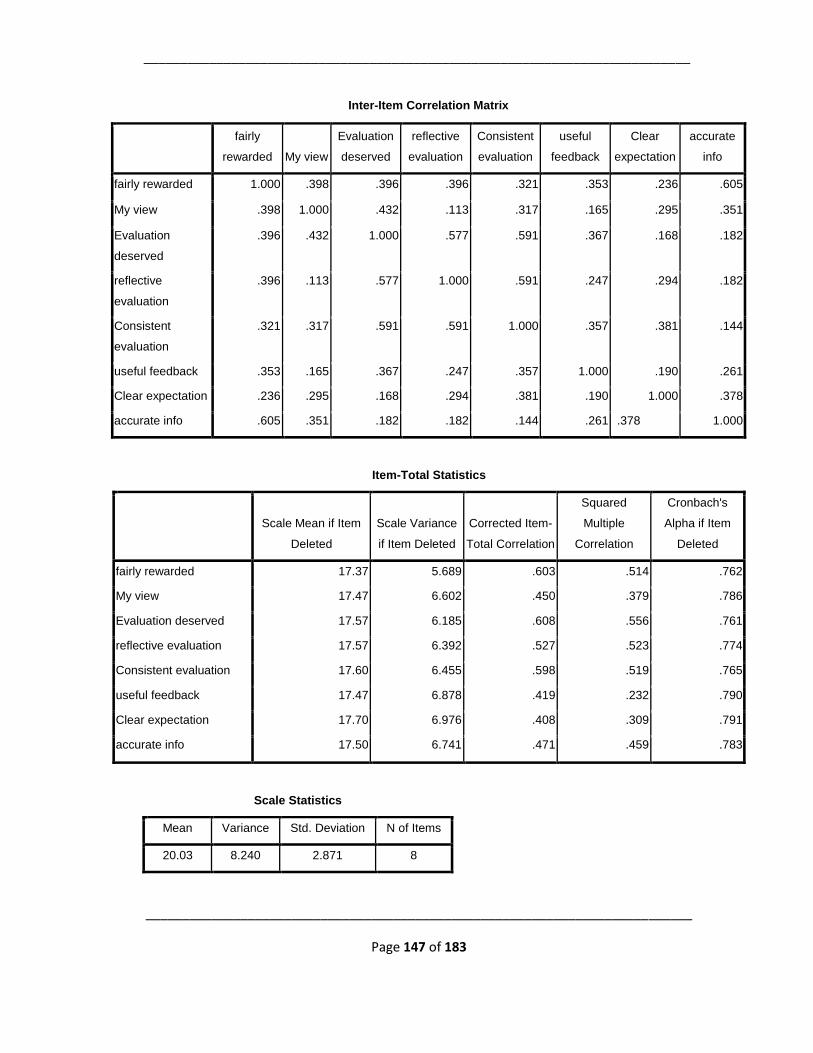
___________________________________________________________________________
___________________________________________________________________________
Page 147 of 183
Inter-Item Correlation Matrix
fairly
rewarded My view
Evaluation
deserved
reflective
evaluation
Consistent
evaluation
useful
feedback
Clear
expectation
accurate
info
fairly rewarded 1.000 .398 .396 .396 .321 .353 .236 .605
My view .398 1.000 .432 .113 .317 .165 .295 .351
Evaluation
deserved
.396 .432 1.000 .577 .591 .367 .168 .182
reflective
evaluation
.396 .113 .577 1.000 .591 .247 .294 .182
Consistent
evaluation
.321 .317 .591 .591 1.000 .357 .381 .144
useful feedback .353 .165 .367 .247 .357 1.000 .190 .261
Clear expectation .236 .295 .168 .294 .381 .190 1.000 .378
accurate info .605 .351 .182 .182 .144 .261 .378 1.000
Item-Total Statistics
Scale Mean if Item
Deleted
Scale Variance
if Item Deleted
Corrected Item-
Total Correlation
Squared
Multiple
Correlation
Cronbach's
Alpha if Item
Deleted
fairly rewarded 17.37 5.689 .603 .514 .762
My view 17.47 6.602 .450 .379 .786
Evaluation deserved 17.57 6.185 .608 .556 .761
reflective evaluation 17.57 6.392 .527 .523 .774
Consistent evaluation 17.60 6.455 .598 .519 .765
useful feedback 17.47 6.878 .419 .232 .790
Clear expectation 17.70 6.976 .408 .309 .791
accurate info 17.50 6.741 .471 .459 .783
Scale Statistics
Mean Variance Std. Deviation N of Items
20.03 8.240 2.871 8
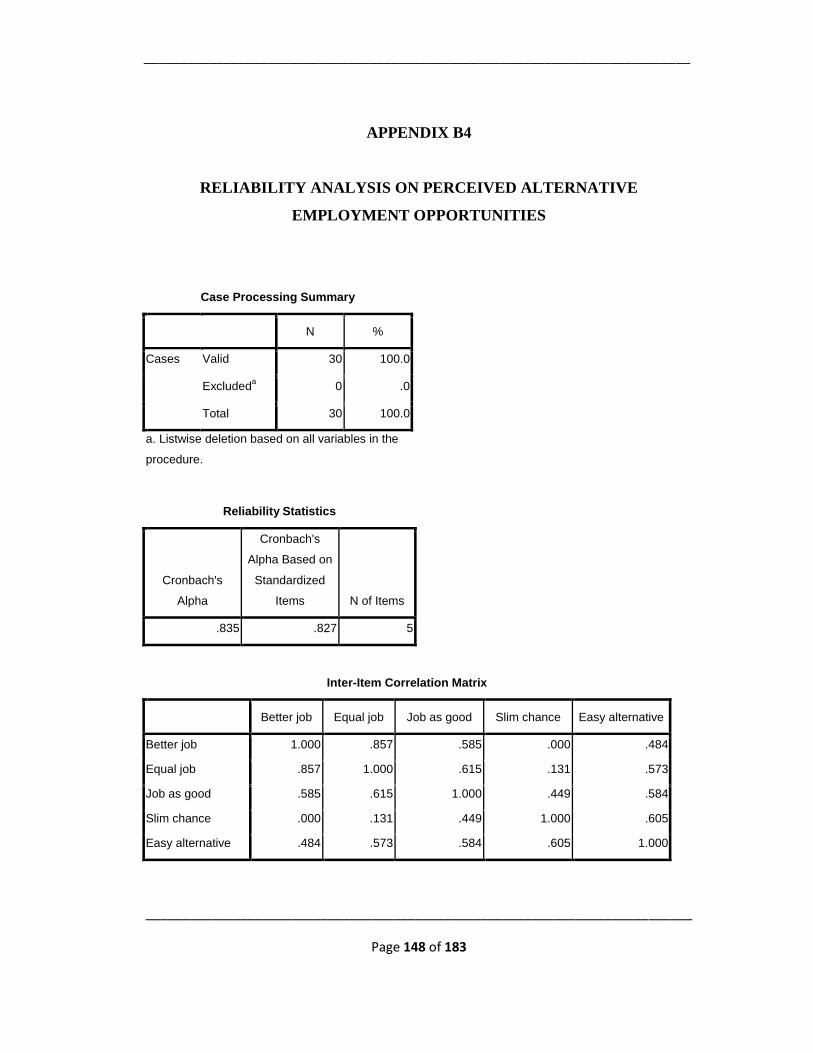
___________________________________________________________________________
___________________________________________________________________________
Page 148 of 183
APPENDIX B4
RELIABILITY ANALYSIS ON PERCEIVED ALTERNATIVE
EMPLOYMENT OPPORTUNITIES
Case Processing Summary
N %
Cases Valid 30 100.0
Excludeda 0 .0
Total 30 100.0
a. Listwise deletion based on all variables in the
procedure.
Reliability Statistics
Cronbach's
Alpha
Cronbach's
Alpha Based on
Standardized
Items N of Items
.835 .827 5
Inter-Item Correlation Matrix
Better job Equal job Job as good Slim chance Easy alternative
Better job 1.000 .857 .585 .000 .484
Equal job .857 1.000 .615 .131 .573
Job as good .585 .615 1.000 .449 .584
Slim chance .000 .131 .449 1.000 .605
Easy alternative .484 .573 .584 .605 1.000
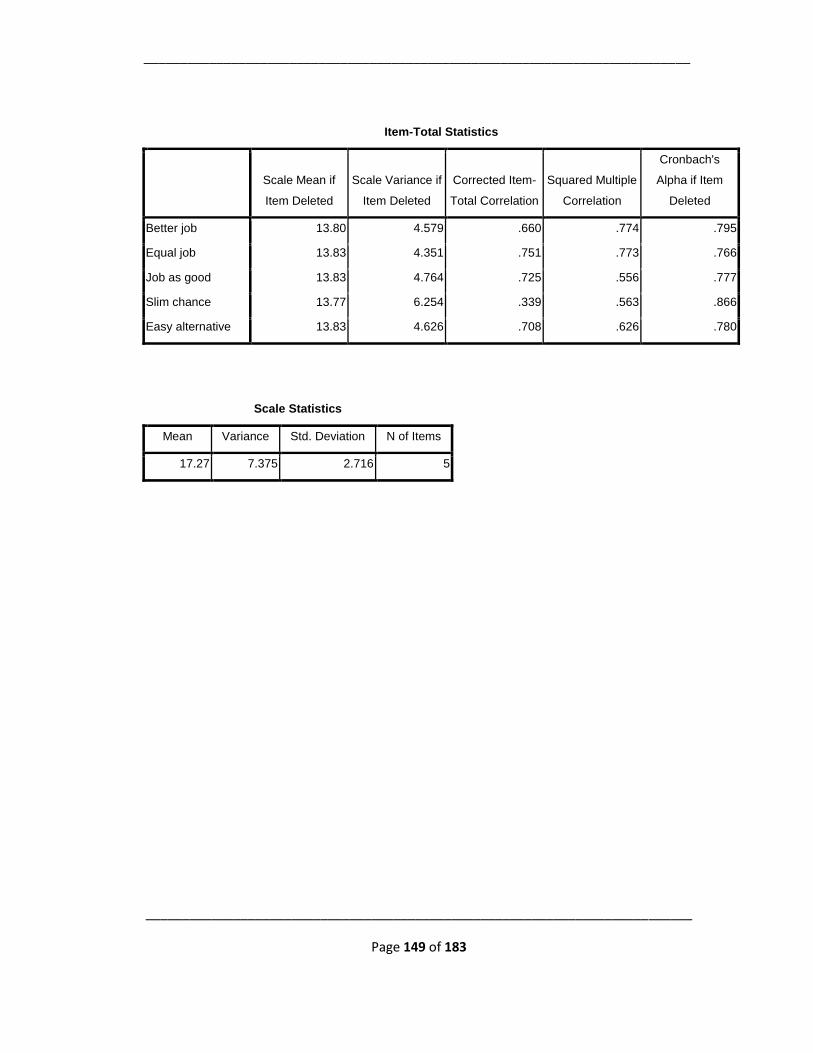
___________________________________________________________________________
___________________________________________________________________________
Page 149 of 183
Item-Total Statistics
Scale Mean if
Item Deleted
Scale Variance if
Item Deleted
Corrected Item-
Total Correlation
Squared Multiple
Correlation
Cronbach's
Alpha if Item
Deleted
Better job 13.80 4.579 .660 .774 .795
Equal job 13.83 4.351 .751 .773 .766
Job as good 13.83 4.764 .725 .556 .777
Slim chance 13.77 6.254 .339 .563 .866
Easy alternative 13.83 4.626 .708 .626 .780
Scale Statistics
Mean Variance Std. Deviation N of Items
17.27 7.375 2.716 5
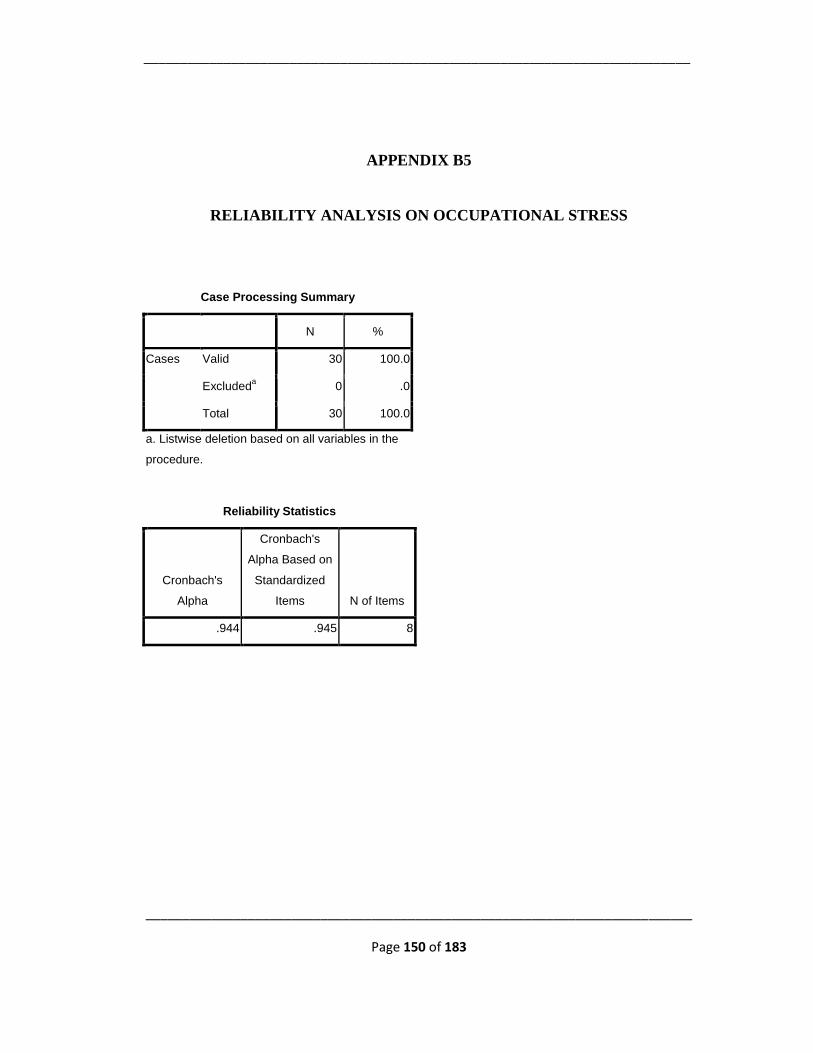
___________________________________________________________________________
___________________________________________________________________________
Page 150 of 183
APPENDIX B5
RELIABILITY ANALYSIS ON OCCUPATIONAL STRESS
Case Processing Summary
N %
Cases Valid 30 100.0
Excludeda 0 .0
Total 30 100.0
a. Listwise deletion based on all variables in the
procedure.
Reliability Statistics
Cronbach's
Alpha
Cronbach's
Alpha Based on
Standardized
Items N of Items
.944 .945 8
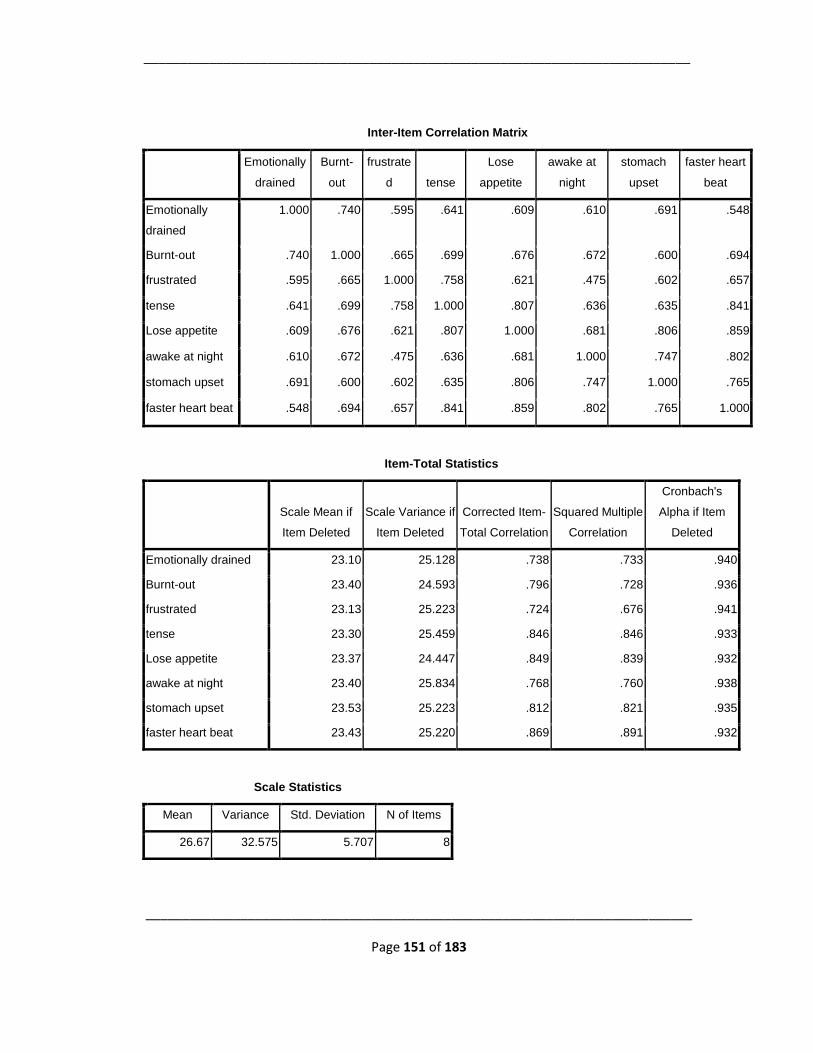
___________________________________________________________________________
___________________________________________________________________________
Page 151 of 183
Inter-Item Correlation Matrix
Emotionally
drained
Burnt-
out
frustrate
d tense
Lose
appetite
awake at
night
stomach
upset
faster heart
beat
Emotionally
drained
1.000 .740 .595 .641 .609 .610 .691 .548
Burnt-out .740 1.000 .665 .699 .676 .672 .600 .694
frustrated .595 .665 1.000 .758 .621 .475 .602 .657
tense .641 .699 .758 1.000 .807 .636 .635 .841
Lose appetite .609 .676 .621 .807 1.000 .681 .806 .859
awake at night .610 .672 .475 .636 .681 1.000 .747 .802
stomach upset .691 .600 .602 .635 .806 .747 1.000 .765
faster heart beat .548 .694 .657 .841 .859 .802 .765 1.000
Item-Total Statistics
Scale Mean if
Item Deleted
Scale Variance if
Item Deleted
Corrected Item-
Total Correlation
Squared Multiple
Correlation
Cronbach's
Alpha if Item
Deleted
Emotionally drained 23.10 25.128 .738 .733 .940
Burnt-out 23.40 24.593 .796 .728 .936
frustrated 23.13 25.223 .724 .676 .941
tense 23.30 25.459 .846 .846 .933
Lose appetite 23.37 24.447 .849 .839 .932
awake at night 23.40 25.834 .768 .760 .938
stomach upset 23.53 25.223 .812 .821 .935
faster heart beat 23.43 25.220 .869 .891 .932
Scale Statistics
Mean Variance Std. Deviation N of Items
26.67 32.575 5.707 8
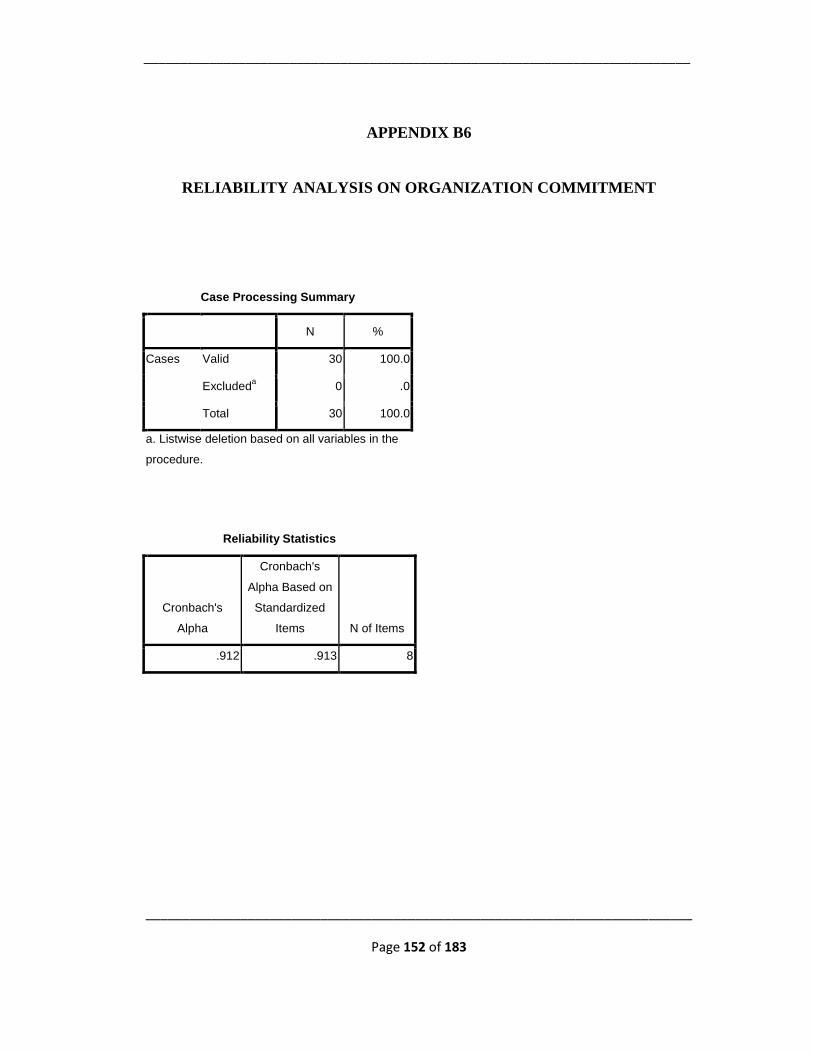
___________________________________________________________________________
___________________________________________________________________________
Page 152 of 183
APPENDIX B6
RELIABILITY ANALYSIS ON ORGANIZATION COMMITMENT
Case Processing Summary
N %
Cases Valid 30 100.0
Excludeda 0 .0
Total 30 100.0
a. Listwise deletion based on all variables in the
procedure.
Reliability Statistics
Cronbach's
Alpha
Cronbach's
Alpha Based on
Standardized
Items N of Items
.912 .913 8
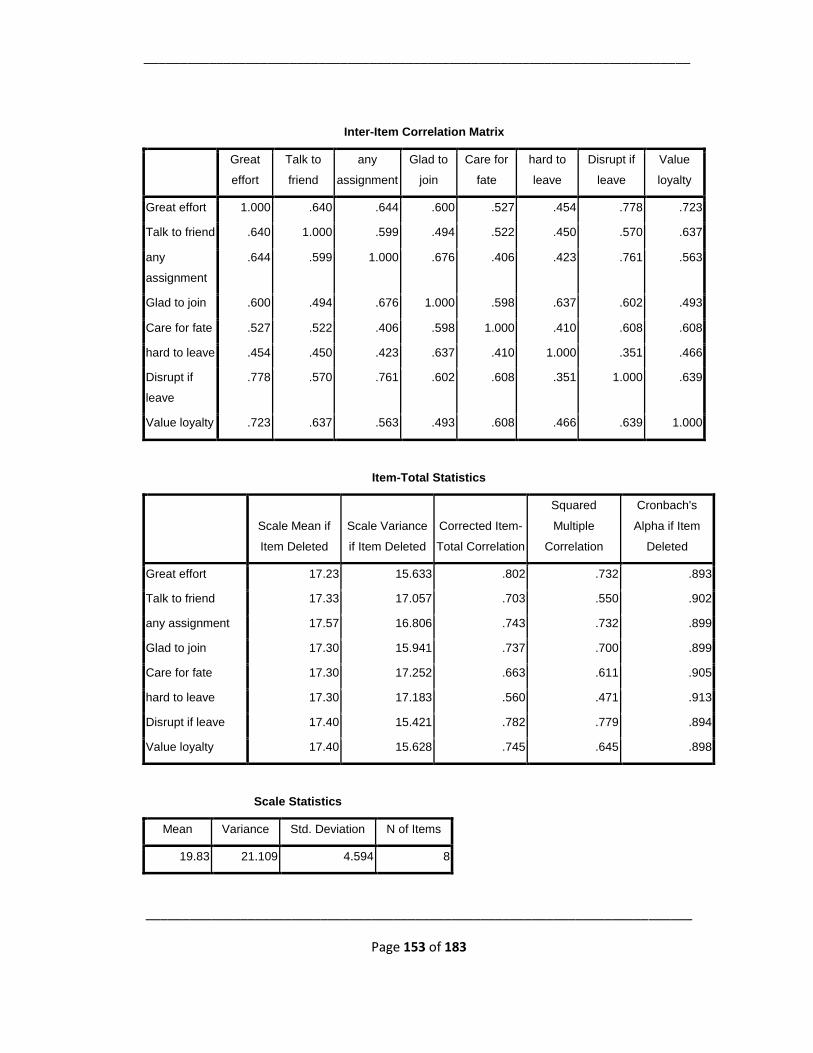
___________________________________________________________________________
___________________________________________________________________________
Page 153 of 183
Inter-Item Correlation Matrix
Great
effort
Talk to
friend
any
assignment
Glad to
join
Care for
fate
hard to
leave
Disrupt if
leave
Value
loyalty
Great effort 1.000 .640 .644 .600 .527 .454 .778 .723
Talk to friend .640 1.000 .599 .494 .522 .450 .570 .637
any
assignment
.644 .599 1.000 .676 .406 .423 .761 .563
Glad to join .600 .494 .676 1.000 .598 .637 .602 .493
Care for fate .527 .522 .406 .598 1.000 .410 .608 .608
hard to leave .454 .450 .423 .637 .410 1.000 .351 .466
Disrupt if
leave
.778 .570 .761 .602 .608 .351 1.000 .639
Value loyalty .723 .637 .563 .493 .608 .466 .639 1.000
Item-Total Statistics
Scale Mean if
Item Deleted
Scale Variance
if Item Deleted
Corrected Item-
Total Correlation
Squared
Multiple
Correlation
Cronbach's
Alpha if Item
Deleted
Great effort 17.23 15.633 .802 .732 .893
Talk to friend 17.33 17.057 .703 .550 .902
any assignment 17.57 16.806 .743 .732 .899
Glad to join 17.30 15.941 .737 .700 .899
Care for fate 17.30 17.252 .663 .611 .905
hard to leave 17.30 17.183 .560 .471 .913
Disrupt if leave 17.40 15.421 .782 .779 .894
Value loyalty 17.40 15.628 .745 .645 .898
Scale Statistics
Mean Variance Std. Deviation N of Items
19.83 21.109 4.594 8
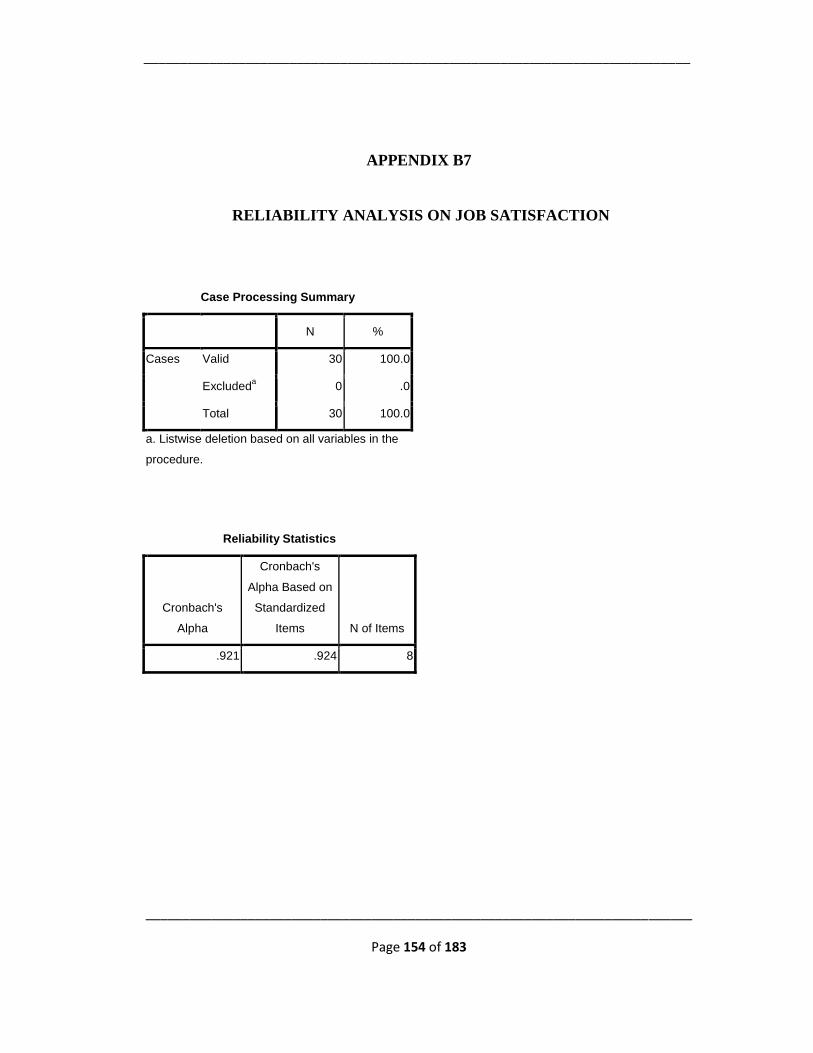
___________________________________________________________________________
___________________________________________________________________________
Page 154 of 183
APPENDIX B7
RELIABILITY ANALYSIS ON JOB SATISFACTION
Case Processing Summary
N %
Cases Valid 30 100.0
Excludeda 0 .0
Total 30 100.0
a. Listwise deletion based on all variables in the
procedure.
Reliability Statistics
Cronbach's
Alpha
Cronbach's
Alpha Based on
Standardized
Items N of Items
.921 .924 8
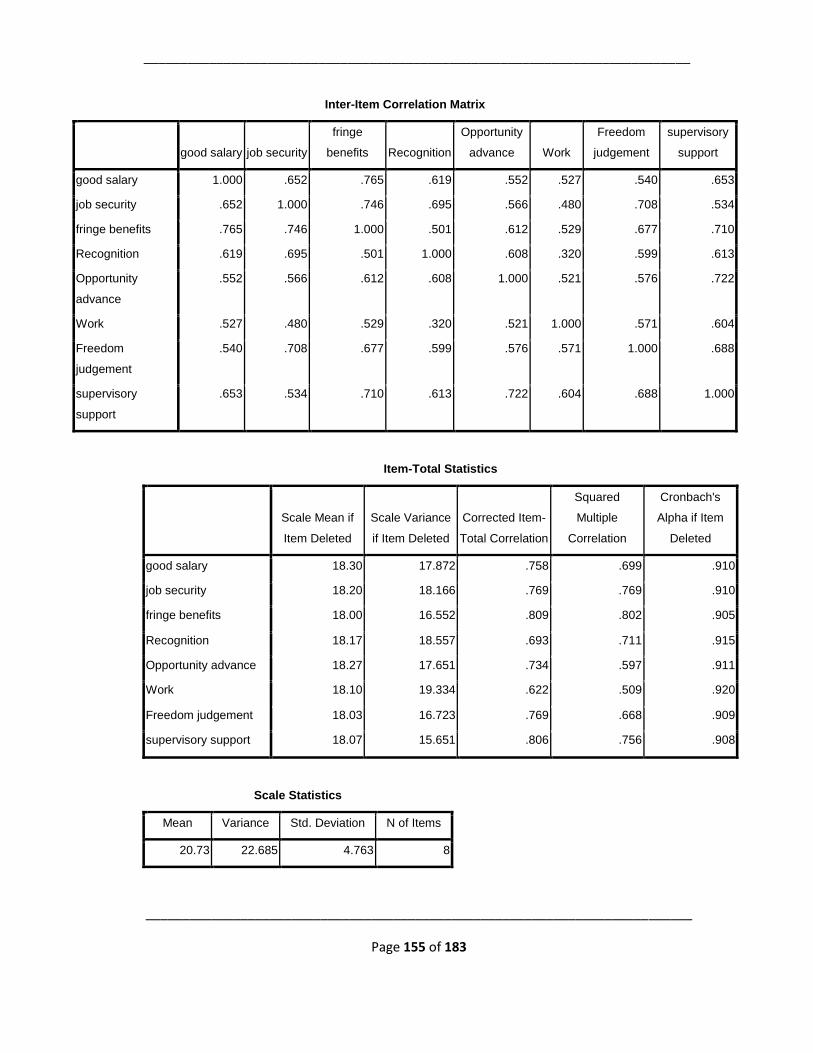
___________________________________________________________________________
___________________________________________________________________________
Page 155 of 183
Inter-Item Correlation Matrix
good salary job security
fringe
benefits Recognition
Opportunity
advance Work
Freedom
judgement
supervisory
support
good salary 1.000 .652 .765 .619 .552 .527 .540 .653
job security .652 1.000 .746 .695 .566 .480 .708 .534
fringe benefits .765 .746 1.000 .501 .612 .529 .677 .710
Recognition .619 .695 .501 1.000 .608 .320 .599 .613
Opportunity
advance
.552 .566 .612 .608 1.000 .521 .576 .722
Work .527 .480 .529 .320 .521 1.000 .571 .604
Freedom
judgement
.540 .708 .677 .599 .576 .571 1.000 .688
supervisory
support
.653 .534 .710 .613 .722 .604 .688 1.000
Item-Total Statistics
Scale Mean if
Item Deleted
Scale Variance
if Item Deleted
Corrected Item-
Total Correlation
Squared
Multiple
Correlation
Cronbach's
Alpha if Item
Deleted
good salary 18.30 17.872 .758 .699 .910
job security 18.20 18.166 .769 .769 .910
fringe benefits 18.00 16.552 .809 .802 .905
Recognition 18.17 18.557 .693 .711 .915
Opportunity advance 18.27 17.651 .734 .597 .911
Work 18.10 19.334 .622 .509 .920
Freedom judgement 18.03 16.723 .769 .668 .909
supervisory support 18.07 15.651 .806 .756 .908
Scale Statistics
Mean Variance Std. Deviation N of Items
20.73 22.685 4.763 8
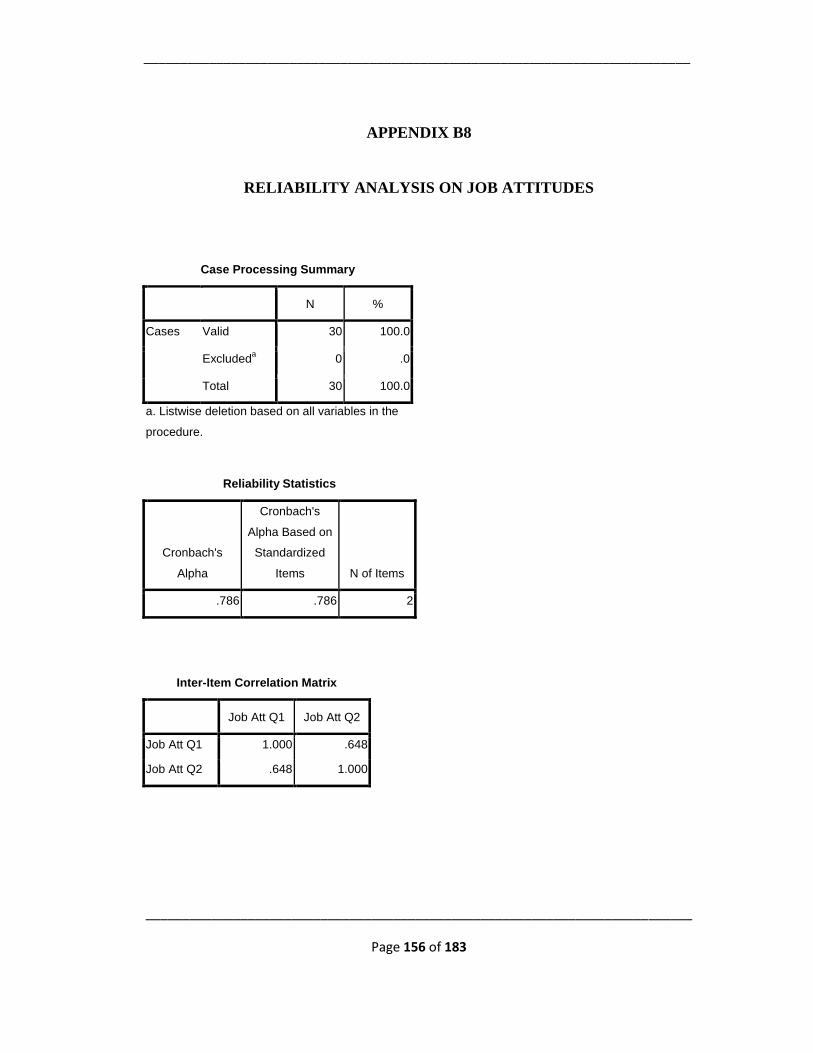
___________________________________________________________________________
___________________________________________________________________________
Page 156 of 183
APPENDIX B8
RELIABILITY ANALYSIS ON JOB ATTITUDES
Case Processing Summary
N %
Cases Valid 30 100.0
Excludeda 0 .0
Total 30 100.0
a. Listwise deletion based on all variables in the
procedure.
Reliability Statistics
Cronbach's
Alpha
Cronbach's
Alpha Based on
Standardized
Items N of Items
.786 .786 2
Inter-Item Correlation Matrix
Job Att Q1 Job Att Q2
Job Att Q1 1.000 .648
Job Att Q2 .648 1.000
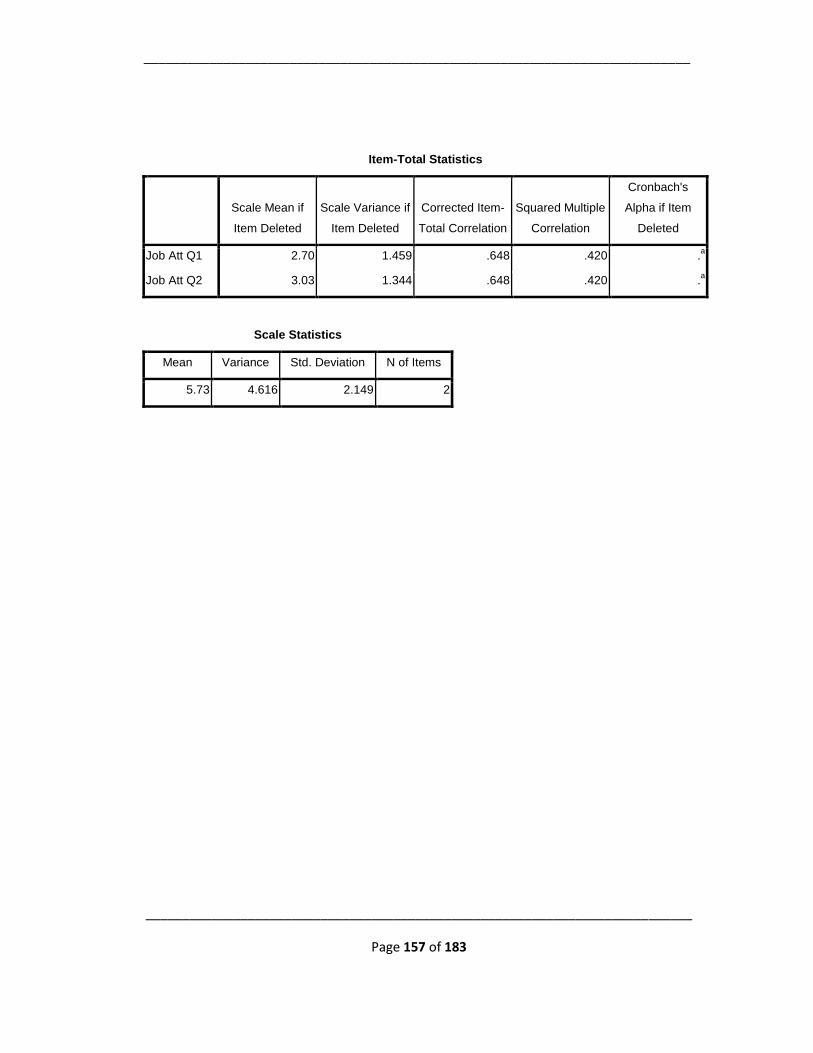
___________________________________________________________________________
___________________________________________________________________________
Page 157 of 183
Item-Total Statistics
Scale Mean if
Item Deleted
Scale Variance if
Item Deleted
Corrected Item-
Total Correlation
Squared Multiple
Correlation
Cronbach's
Alpha if Item
Deleted
Job Att Q1 2.70 1.459 .648 .420 .a
Job Att Q2 3.03 1.344 .648 .420 .a
Scale Statistics
Mean Variance Std. Deviation N of Items
5.73 4.616 2.149 2
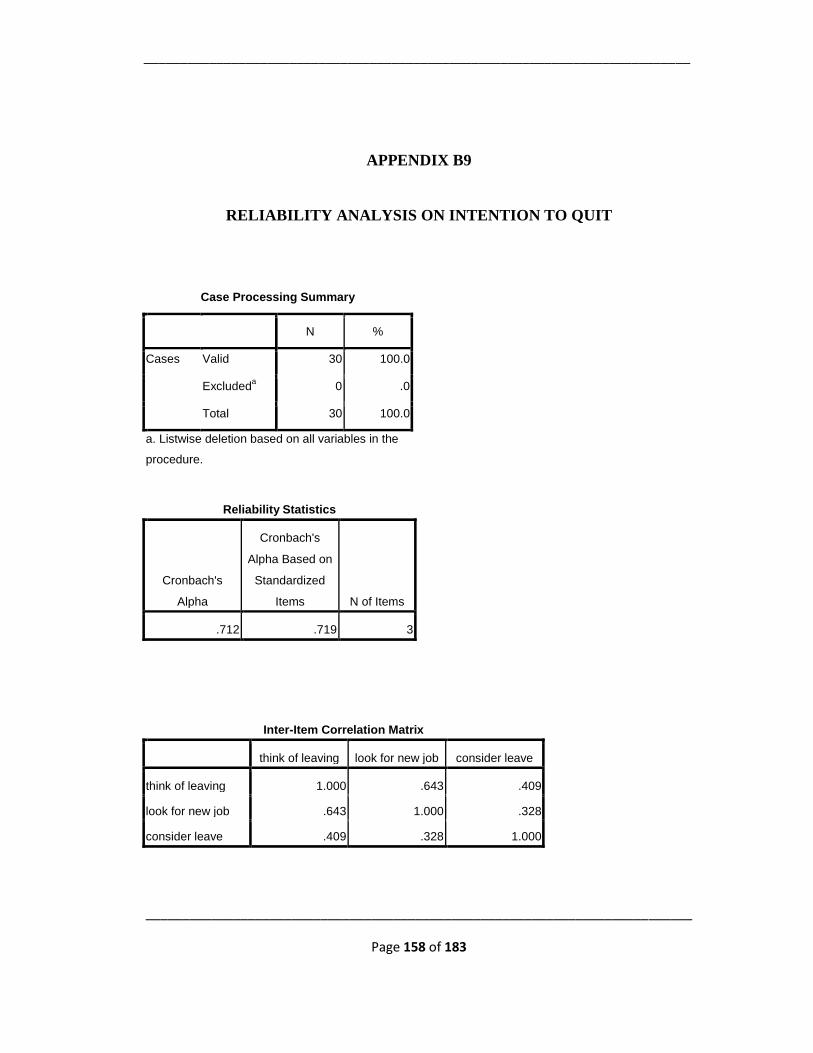
___________________________________________________________________________
___________________________________________________________________________
Page 158 of 183
APPENDIX B9
RELIABILITY ANALYSIS ON INTENTION TO QUIT
Case Processing Summary
N %
Cases Valid 30 100.0
Excludeda 0 .0
Total 30 100.0
a. Listwise deletion based on all variables in the
procedure.
Reliability Statistics
Cronbach's
Alpha
Cronbach's
Alpha Based on
Standardized
Items N of Items
.712 .719 3
Inter-Item Correlation Matrix
think of leaving look for new job consider leave
think of leaving 1.000 .643 .409
look for new job .643 1.000 .328
consider leave .409 .328 1.000
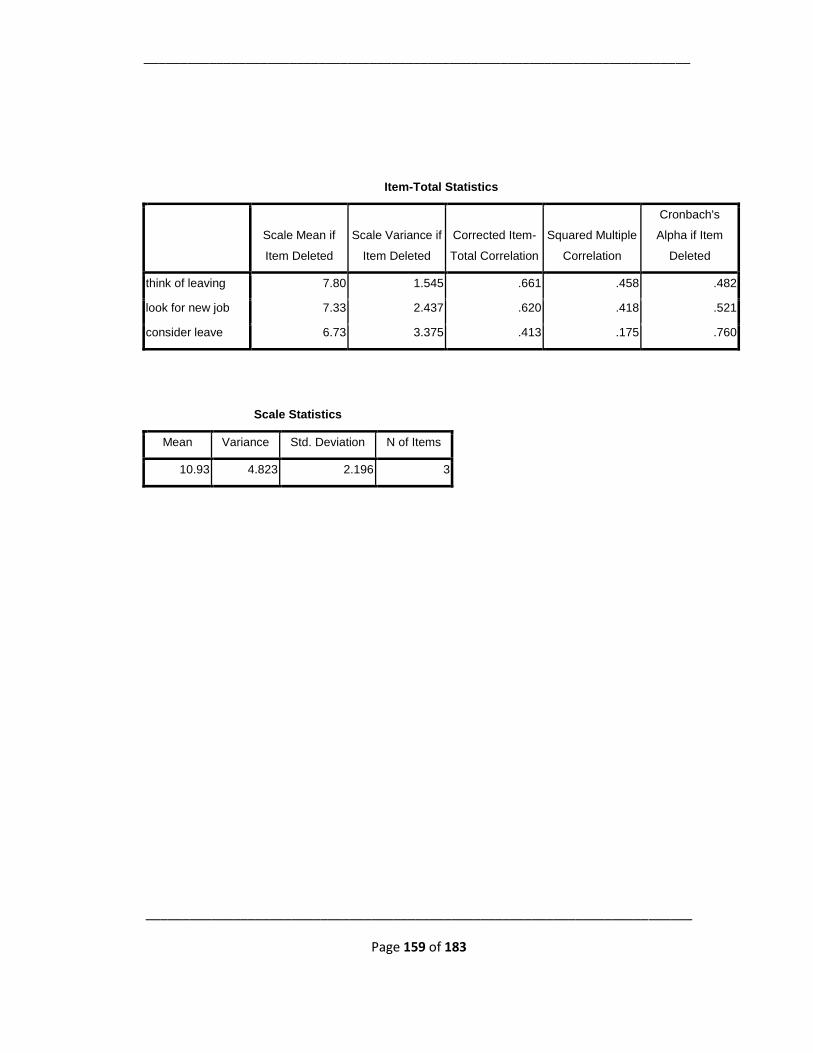
___________________________________________________________________________
___________________________________________________________________________
Page 159 of 183
Item-Total Statistics
Scale Mean if
Item Deleted
Scale Variance if
Item Deleted
Corrected Item-
Total Correlation
Squared Multiple
Correlation
Cronbach's
Alpha if Item
Deleted
think of leaving 7.80 1.545 .661 .458 .482
look for new job 7.33 2.437 .620 .418 .521
consider leave 6.73 3.375 .413 .175 .760
Scale Statistics
Mean Variance Std. Deviation N of Items
10.93 4.823 2.196 3
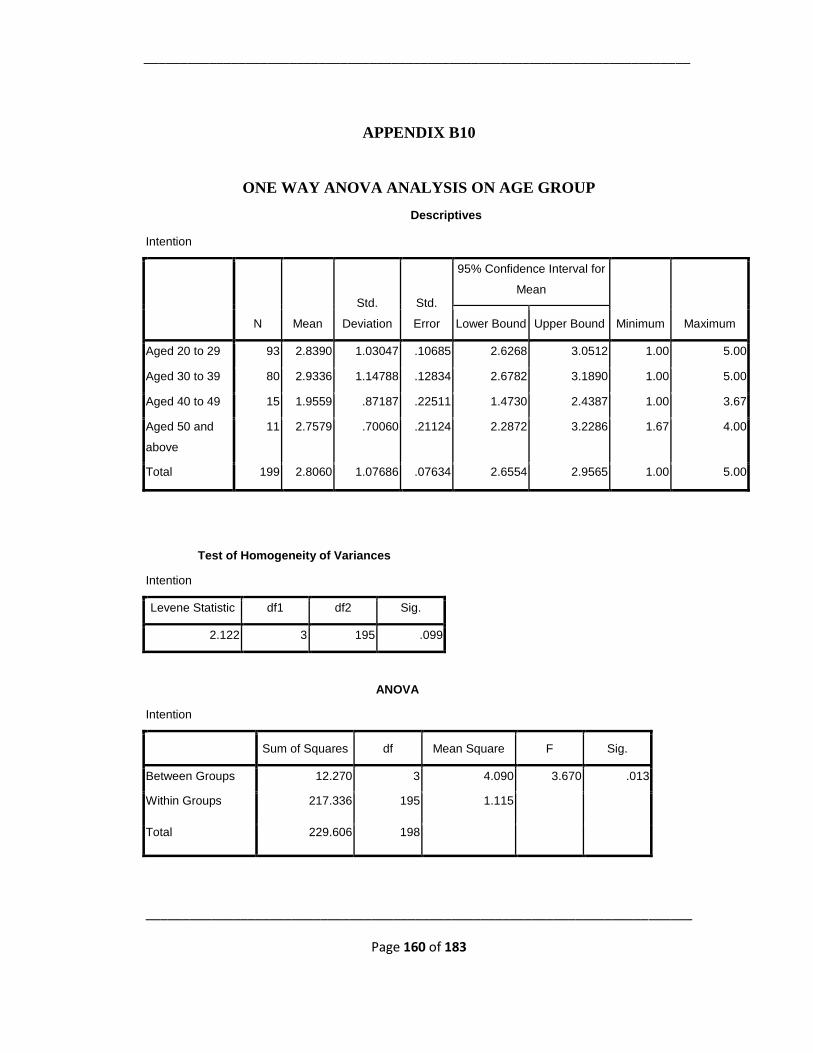
___________________________________________________________________________
___________________________________________________________________________
Page 160 of 183
APPENDIX B10
ONE WAY ANOVA ANALYSIS ON AGE GROUP
Descriptives
Intention
N Mean
Std.
Deviation
Std.
Error
95% Confidence Interval for
Mean
Minimum Maximum Lower Bound Upper Bound
Aged 20 to 29 93 2.8390 1.03047 .10685 2.6268 3.0512 1.00 5.00
Aged 30 to 39 80 2.9336 1.14788 .12834 2.6782 3.1890 1.00 5.00
Aged 40 to 49 15 1.9559 .87187 .22511 1.4730 2.4387 1.00 3.67
Aged 50 and
above
11 2.7579 .70060 .21124 2.2872 3.2286 1.67 4.00
Total 199 2.8060 1.07686 .07634 2.6554 2.9565 1.00 5.00
Test of Homogeneity of Variances
Intention
Levene Statistic df1 df2 Sig.
2.122 3 195 .099
ANOVA
Intention
Sum of Squares df Mean Square F Sig.
Between Groups 12.270 3 4.090 3.670 .013
Within Groups 217.336 195 1.115
Total 229.606 198
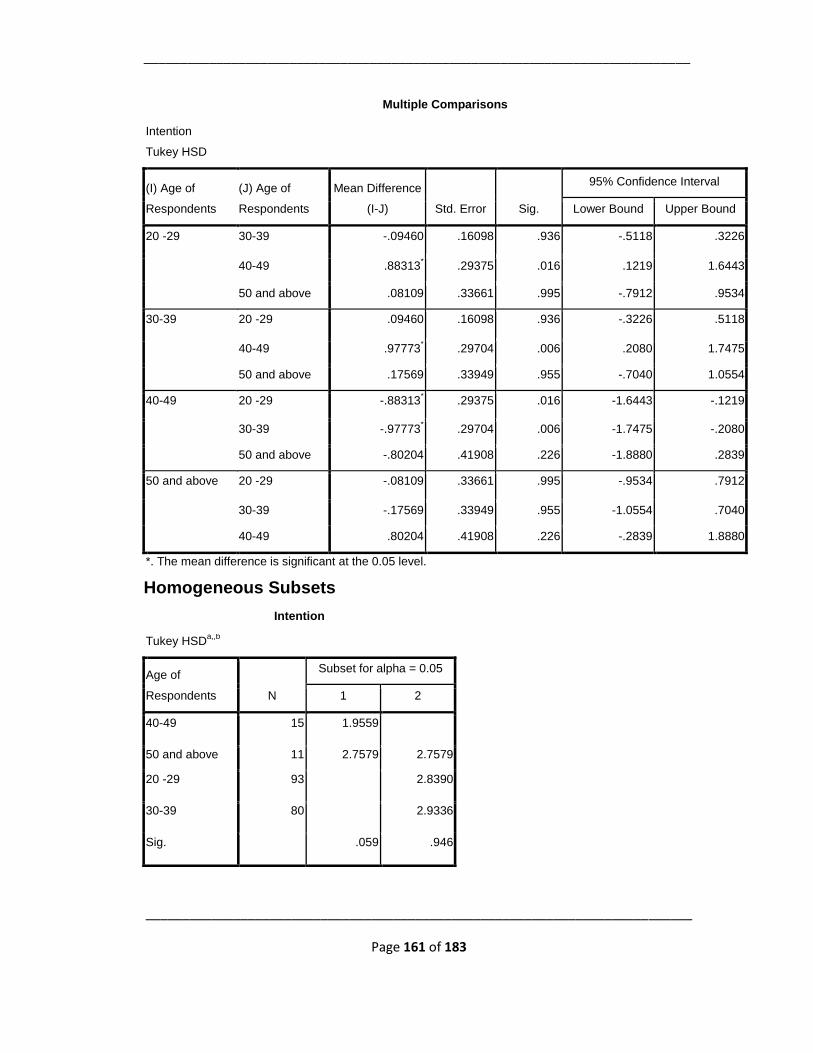
___________________________________________________________________________
___________________________________________________________________________
Page 161 of 183
Multiple Comparisons
Intention
Tukey HSD
(I) Age of
Respondents
(J) Age of
Respondents
Mean Difference
(I-J) Std. Error Sig.
95% Confidence Interval
Lower Bound Upper Bound
20 -29 30-39 -.09460 .16098 .936 -.5118 .3226
40-49 .88313* .29375 .016 .1219 1.6443
50 and above .08109 .33661 .995 -.7912 .9534
30-39 20 -29 .09460 .16098 .936 -.3226 .5118
40-49 .97773* .29704 .006 .2080 1.7475
50 and above .17569 .33949 .955 -.7040 1.0554
40-49 20 -29 -.88313* .29375 .016 -1.6443 -.1219
30-39 -.97773* .29704 .006 -1.7475 -.2080
50 and above -.80204 .41908 .226 -1.8880 .2839
50 and above 20 -29 -.08109 .33661 .995 -.9534 .7912
30-39 -.17569 .33949 .955 -1.0554 .7040
40-49 .80204 .41908 .226 -.2839 1.8880
*. The mean difference is significant at the 0.05 level.
Homogeneous Subsets
Intention
Tukey HSDa,,b
Age of
Respondents N
Subset for alpha = 0.05
1 2
40-49 15 1.9559
50 and above 11 2.7579 2.7579
20 -29 93 2.8390
30-39 80 2.9336
Sig. .059 .946
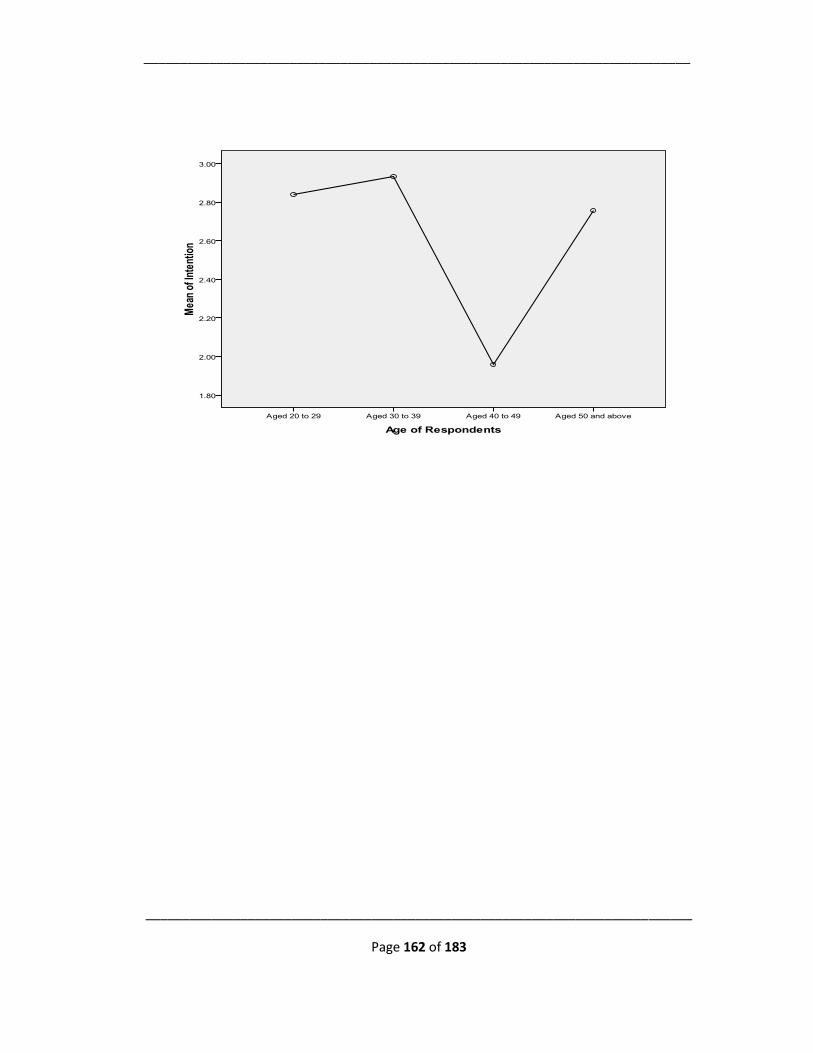
___________________________________________________________________________
___________________________________________________________________________
Page 162 of 183
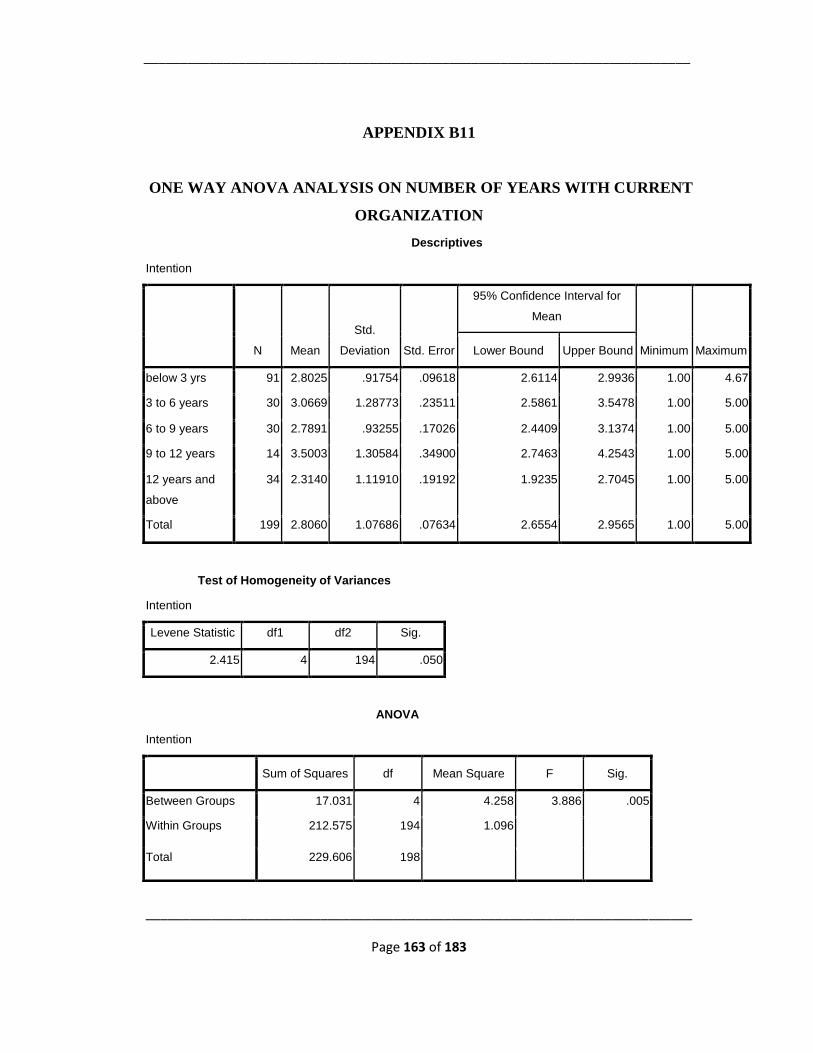
___________________________________________________________________________
___________________________________________________________________________
Page 163 of 183
APPENDIX B11
ONE WAY ANOVA ANALYSIS ON NUMBER OF YEARS WITH CURRENT
ORGANIZATION
Descriptives
Intention
N Mean
Std.
Deviation Std. Error
95% Confidence Interval for
Mean
Minimum Maximum Lower Bound Upper Bound
below 3 yrs 91 2.8025 .91754 .09618 2.6114 2.9936 1.00 4.67
3 to 6 years 30 3.0669 1.28773 .23511 2.5861 3.5478 1.00 5.00
6 to 9 years 30 2.7891 .93255 .17026 2.4409 3.1374 1.00 5.00
9 to 12 years 14 3.5003 1.30584 .34900 2.7463 4.2543 1.00 5.00
12 years and
above
34 2.3140 1.11910 .19192 1.9235 2.7045 1.00 5.00
Total 199 2.8060 1.07686 .07634 2.6554 2.9565 1.00 5.00
Test of Homogeneity of Variances
Intention
Levene Statistic df1 df2 Sig.
2.415 4 194 .050
ANOVA
Intention
Sum of Squares df Mean Square F Sig.
Between Groups 17.031 4 4.258 3.886 .005
Within Groups 212.575 194 1.096
Total 229.606 198
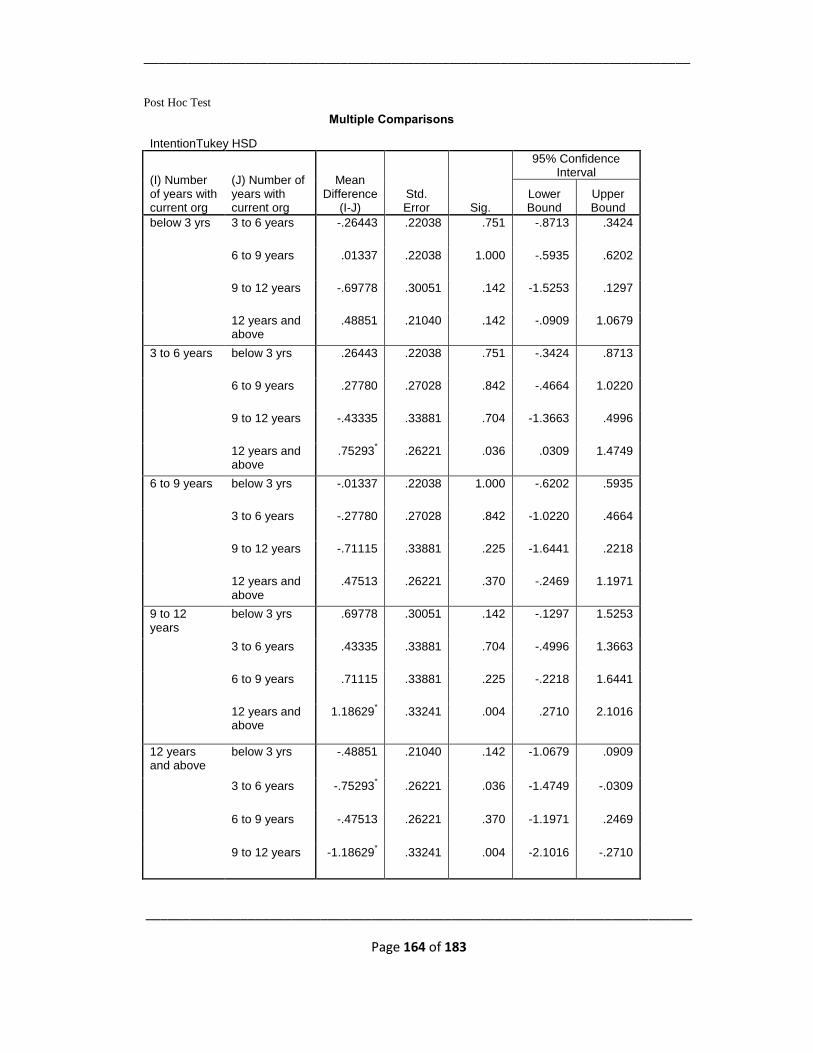
___________________________________________________________________________
___________________________________________________________________________
Page 164 of 183
Post Hoc Test
Multiple Comparisons
IntentionTukey HSD
(I) Number of years with current org
(J) Number of years with current org
Mean Difference
(I-J) Std. Error Sig.
95% Confidence Interval
Lower Bound
Upper Bound
below 3 yrs 3 to 6 years -.26443 .22038 .751 -.8713 .3424
6 to 9 years .01337 .22038 1.000 -.5935 .6202
9 to 12 years -.69778 .30051 .142 -1.5253 .1297
12 years and above
.48851 .21040 .142 -.0909 1.0679
3 to 6 years below 3 yrs .26443 .22038 .751 -.3424 .8713
6 to 9 years .27780 .27028 .842 -.4664 1.0220
9 to 12 years -.43335 .33881 .704 -1.3663 .4996
12 years and above
.75293* .26221 .036 .0309 1.4749
6 to 9 years below 3 yrs -.01337 .22038 1.000 -.6202 .5935
3 to 6 years -.27780 .27028 .842 -1.0220 .4664
9 to 12 years -.71115 .33881 .225 -1.6441 .2218
12 years and above
.47513 .26221 .370 -.2469 1.1971
9 to 12 years
below 3 yrs .69778 .30051 .142 -.1297 1.5253
3 to 6 years .43335 .33881 .704 -.4996 1.3663
6 to 9 years .71115 .33881 .225 -.2218 1.6441
12 years and above
1.18629* .33241 .004 .2710 2.1016
12 years and above
below 3 yrs -.48851 .21040 .142 -1.0679 .0909
3 to 6 years -.75293* .26221 .036 -1.4749 -.0309
6 to 9 years -.47513 .26221 .370 -1.1971 .2469
9 to 12 years -1.18629* .33241 .004 -2.1016 -.2710
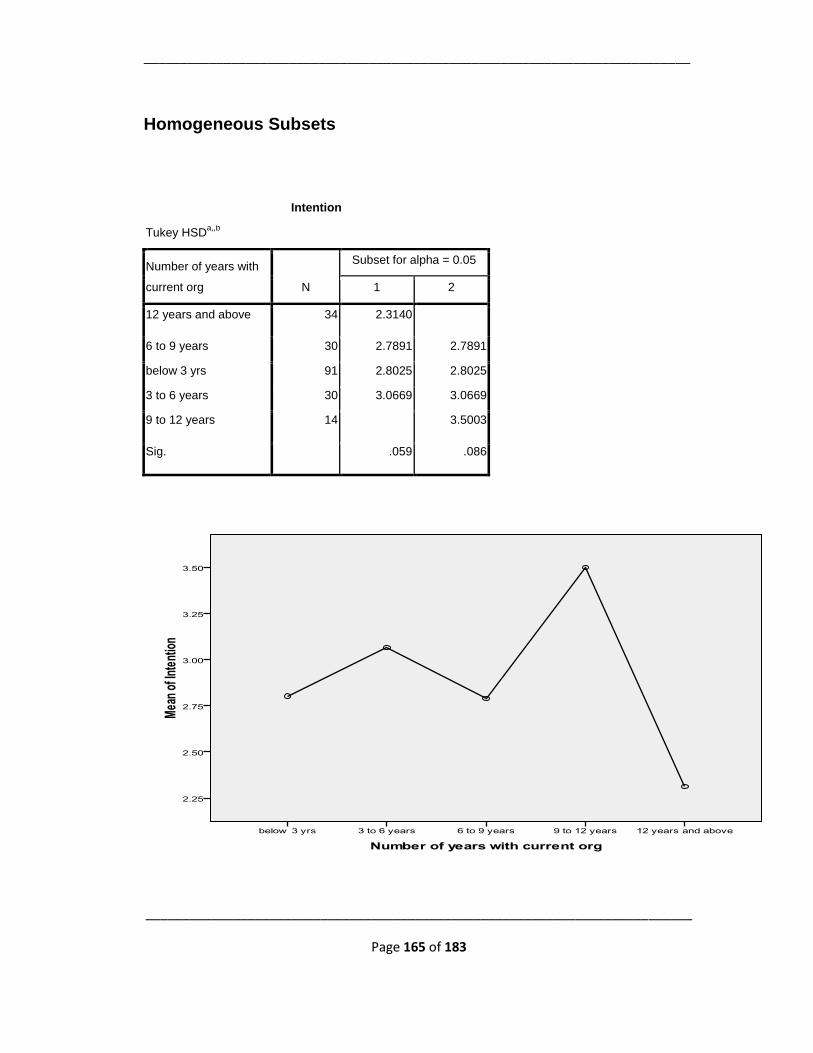
___________________________________________________________________________
___________________________________________________________________________
Page 165 of 183
Homogeneous Subsets
Intention
Tukey HSDa,,b
Number of years with
current org N
Subset for alpha = 0.05
1 2
12 years and above 34 2.3140
6 to 9 years 30 2.7891 2.7891
below 3 yrs 91 2.8025 2.8025
3 to 6 years 30 3.0669 3.0669
9 to 12 years 14 3.5003
Sig. .059 .086
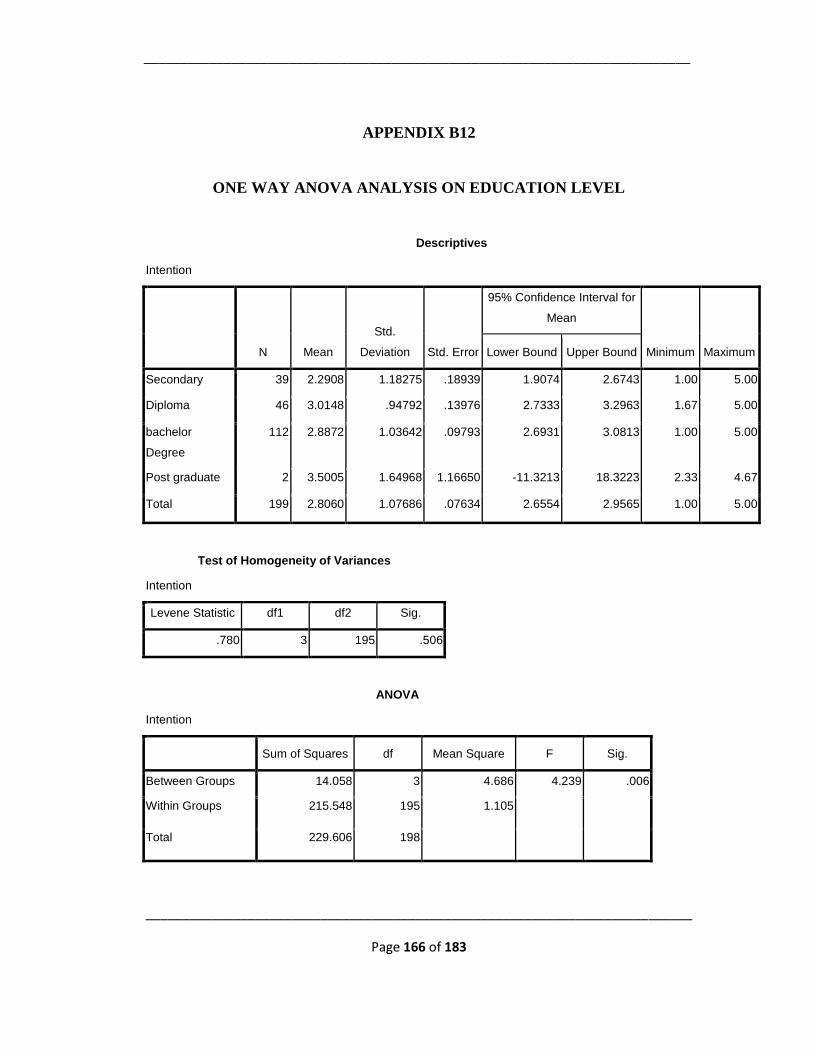
___________________________________________________________________________
___________________________________________________________________________
Page 166 of 183
APPENDIX B12
ONE WAY ANOVA ANALYSIS ON EDUCATION LEVEL
Descriptives
Intention
N Mean
Std.
Deviation Std. Error
95% Confidence Interval for
Mean
Minimum Maximum Lower Bound Upper Bound
Secondary 39 2.2908 1.18275 .18939 1.9074 2.6743 1.00 5.00
Diploma 46 3.0148 .94792 .13976 2.7333 3.2963 1.67 5.00
bachelor
Degree
112 2.8872 1.03642 .09793 2.6931 3.0813 1.00 5.00
Post graduate 2 3.5005 1.64968 1.16650 -11.3213 18.3223 2.33 4.67
Total 199 2.8060 1.07686 .07634 2.6554 2.9565 1.00 5.00
Test of Homogeneity of Variances
Intention
Levene Statistic df1 df2 Sig.
.780 3 195 .506
ANOVA
Intention
Sum of Squares df Mean Square F Sig.
Between Groups 14.058 3 4.686 4.239 .006
Within Groups 215.548 195 1.105
Total 229.606 198
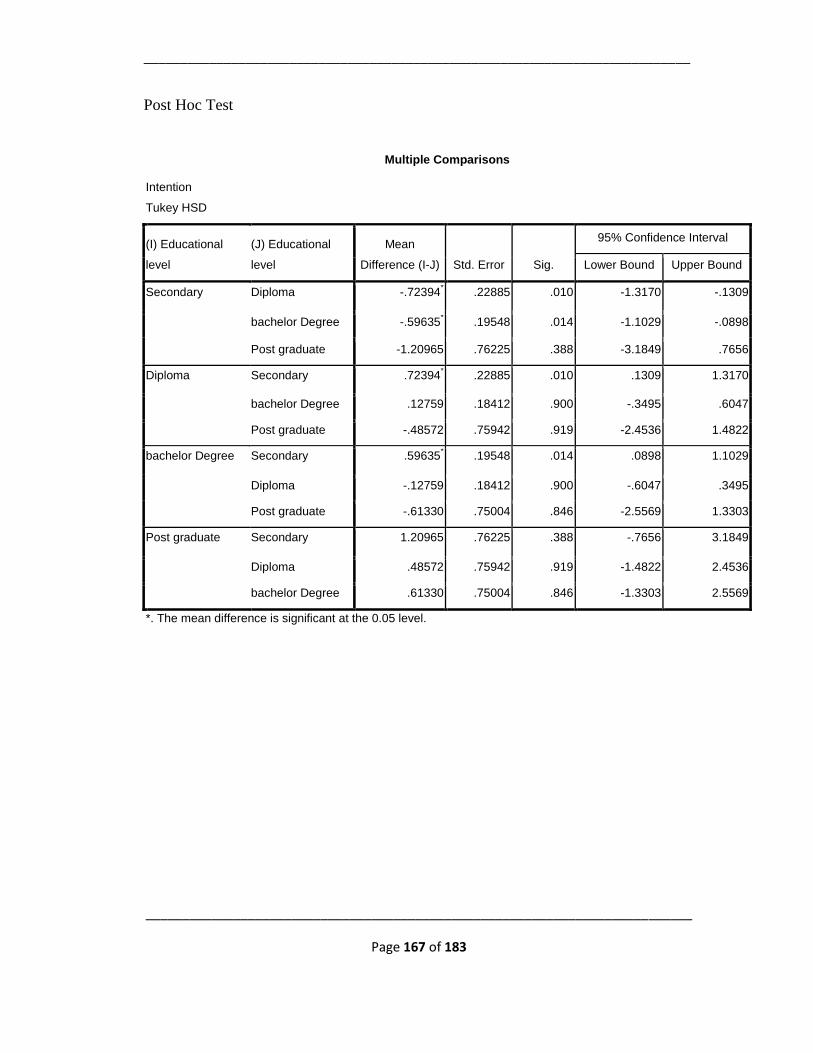
___________________________________________________________________________
___________________________________________________________________________
Page 167 of 183
Post Hoc Test
Multiple Comparisons
Intention
Tukey HSD
(I) Educational
level
(J) Educational
level
Mean
Difference (I-J) Std. Error Sig.
95% Confidence Interval
Lower Bound Upper Bound
Secondary Diploma -.72394* .22885 .010 -1.3170 -.1309
bachelor Degree -.59635* .19548 .014 -1.1029 -.0898
Post graduate -1.20965 .76225 .388 -3.1849 .7656
Diploma Secondary .72394* .22885 .010 .1309 1.3170
bachelor Degree .12759 .18412 .900 -.3495 .6047
Post graduate -.48572 .75942 .919 -2.4536 1.4822
bachelor Degree Secondary .59635* .19548 .014 .0898 1.1029
Diploma -.12759 .18412 .900 -.6047 .3495
Post graduate -.61330 .75004 .846 -2.5569 1.3303
Post graduate Secondary 1.20965 .76225 .388 -.7656 3.1849
Diploma .48572 .75942 .919 -1.4822 2.4536
bachelor Degree .61330 .75004 .846 -1.3303 2.5569
*. The mean difference is significant at the 0.05 level.
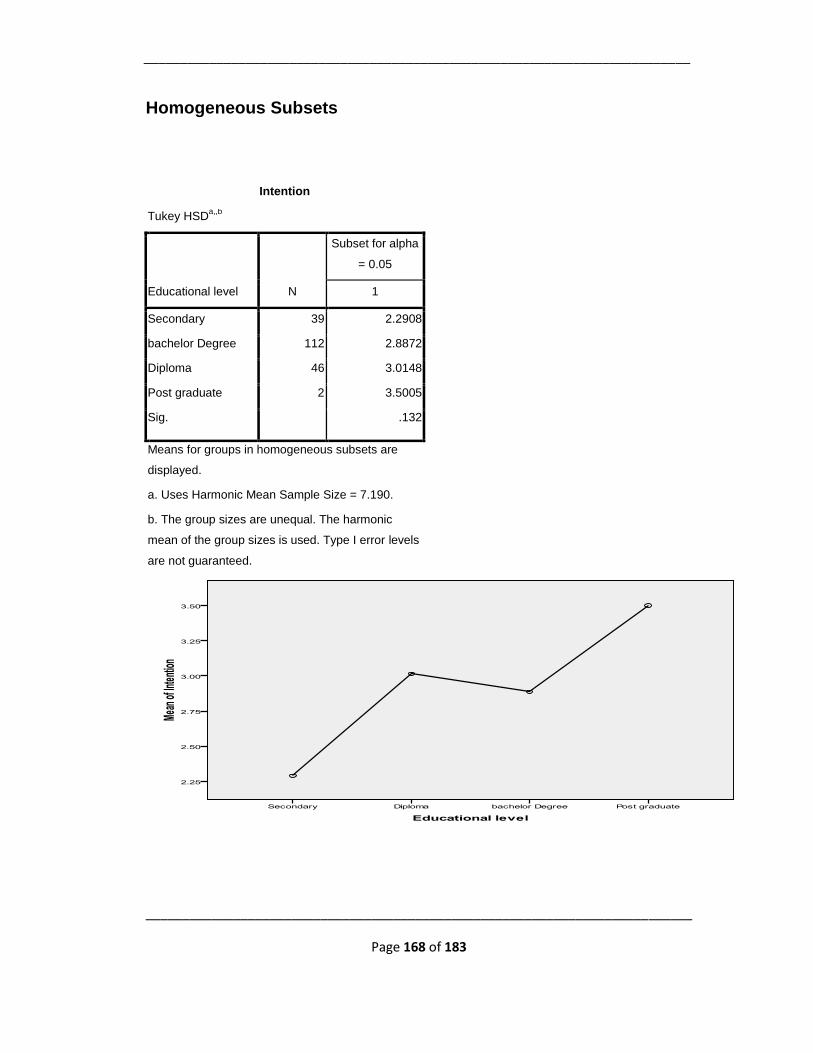
___________________________________________________________________________
___________________________________________________________________________
Page 168 of 183
Homogeneous Subsets
Intention
Tukey HSDa,,b
Educational level N
Subset for alpha
= 0.05
1
Secondary 39 2.2908
bachelor Degree 112 2.8872
Diploma 46 3.0148
Post graduate 2 3.5005
Sig. .132
Means for groups in homogeneous subsets are
displayed.
a. Uses Harmonic Mean Sample Size = 7.190.
b. The group sizes are unequal. The harmonic
mean of the group sizes is used. Type I error levels
are not guaranteed.
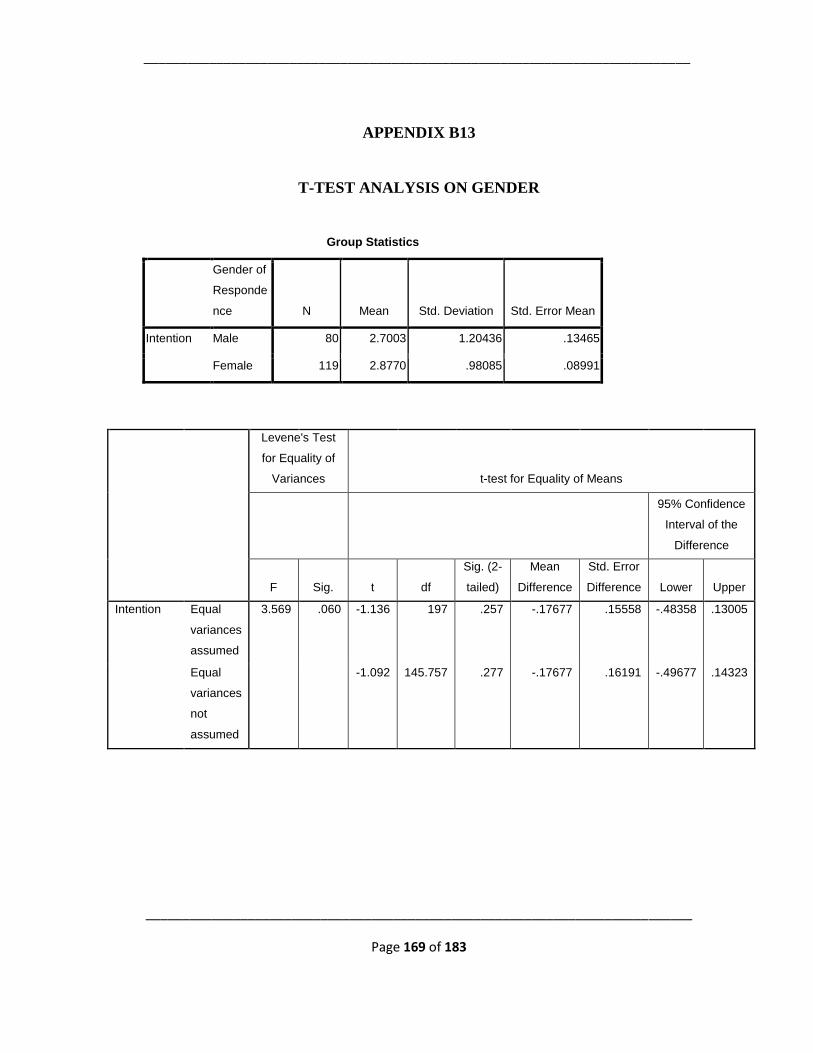
___________________________________________________________________________
___________________________________________________________________________
Page 169 of 183
APPENDIX B13
T-TEST ANALYSIS ON GENDER
Group Statistics
Gender of
Responde
nce N Mean Std. Deviation Std. Error Mean
Intention Male 80 2.7003 1.20436 .13465
Female 119 2.8770 .98085 .08991
Levene's Test
for Equality of
Variances t-test for Equality of Means
95% Confidence
Interval of the
Difference
F Sig. t df
Sig. (2-
tailed)
Mean
Difference
Std. Error
Difference Lower Upper
Intention Equal
variances
assumed
3.569 .060 -1.136 197 .257 -.17677 .15558 -.48358 .13005
Equal
variances
not
assumed
-1.092 145.757 .277 -.17677 .16191 -.49677 .14323
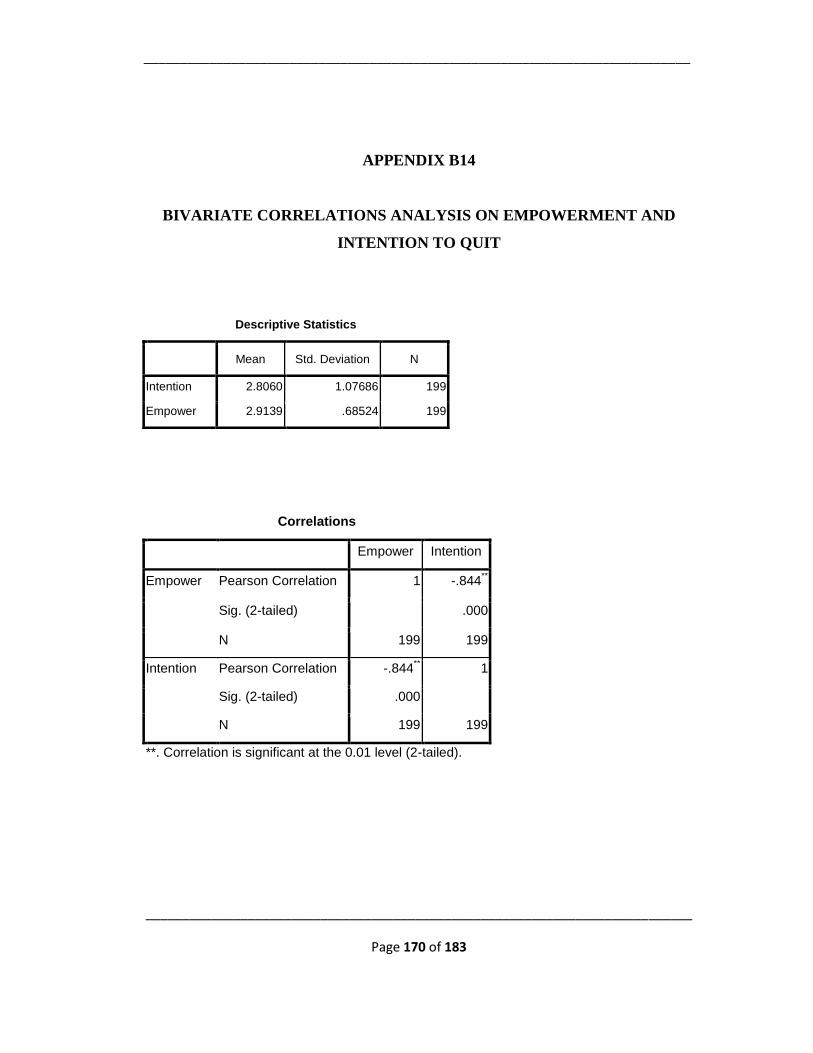
___________________________________________________________________________
___________________________________________________________________________
Page 170 of 183
APPENDIX B14
BIVARIATE CORRELATIONS ANALYSIS ON EMPOWERMENT AND
INTENTION TO QUIT
Descriptive Statistics
Mean Std. Deviation N
Intention 2.8060 1.07686 199
Empower 2.9139 .68524 199
Correlations
Empower Intention
Empower Pearson Correlation 1 -.844**
Sig. (2-tailed) .000
N 199 199
Intention Pearson Correlation -.844** 1
Sig. (2-tailed) .000
N 199 199
**. Correlation is significant at the 0.01 level (2-tailed).
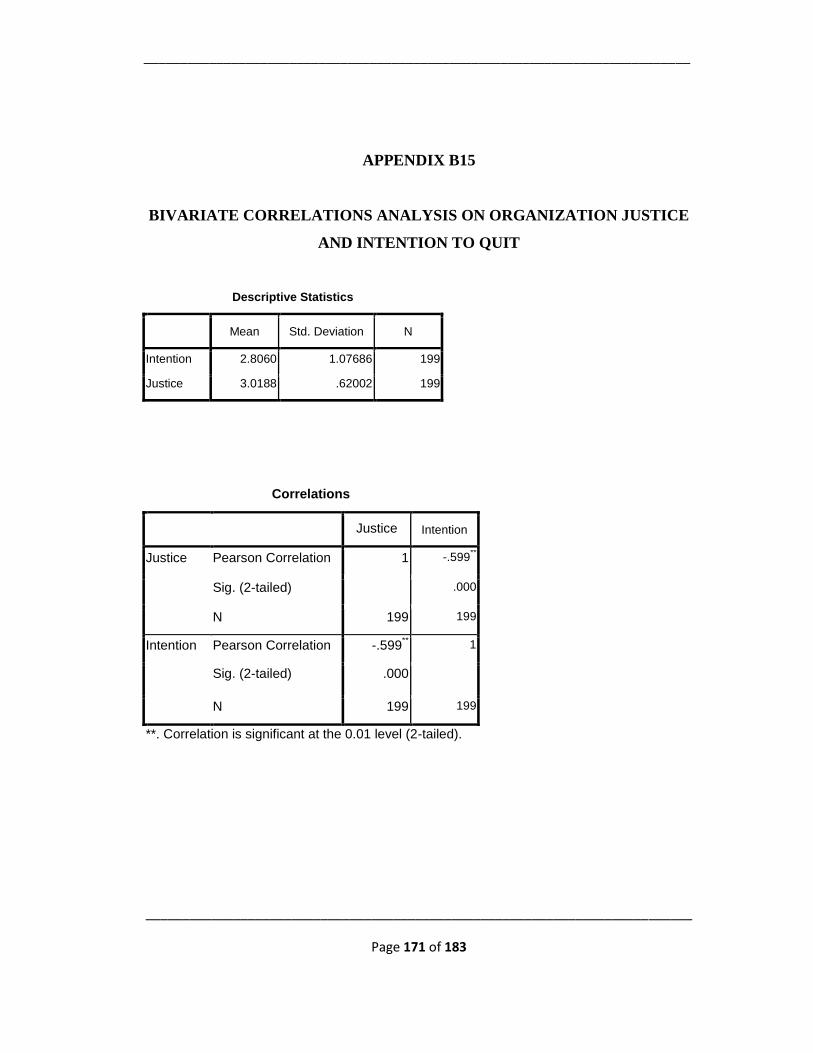
___________________________________________________________________________
___________________________________________________________________________
Page 171 of 183
APPENDIX B15
BIVARIATE CORRELATIONS ANALYSIS ON ORGANIZATION JUSTICE
AND INTENTION TO QUIT
Descriptive Statistics
Mean Std. Deviation N
Intention 2.8060 1.07686 199
Justice 3.0188 .62002 199
Correlations
Justice Intention
Justice Pearson Correlation 1 -.599**
Sig. (2-tailed) .000
N 199 199
Intention Pearson Correlation -.599** 1
Sig. (2-tailed) .000
N 199 199
**. Correlation is significant at the 0.01 level (2-tailed).
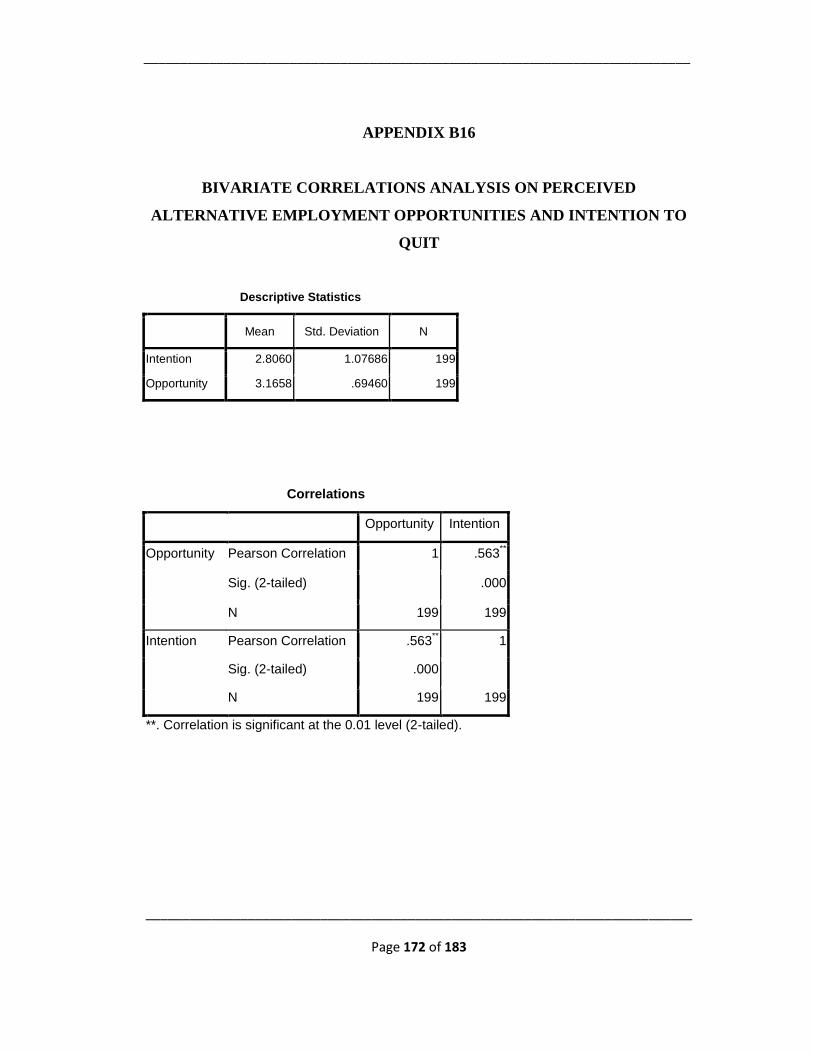
___________________________________________________________________________
___________________________________________________________________________
Page 172 of 183
APPENDIX B16
BIVARIATE CORRELATIONS ANALYSIS ON PERCEIVED
ALTERNATIVE EMPLOYMENT OPPORTUNITIES AND INTENTION TO
QUIT
Descriptive Statistics
Mean Std. Deviation N
Intention 2.8060 1.07686 199
Opportunity 3.1658 .69460 199
Correlations
Opportunity Intention
Opportunity Pearson Correlation 1 .563**
Sig. (2-tailed) .000
N 199 199
Intention Pearson Correlation .563** 1
Sig. (2-tailed) .000
N 199 199
**. Correlation is significant at the 0.01 level (2-tailed).
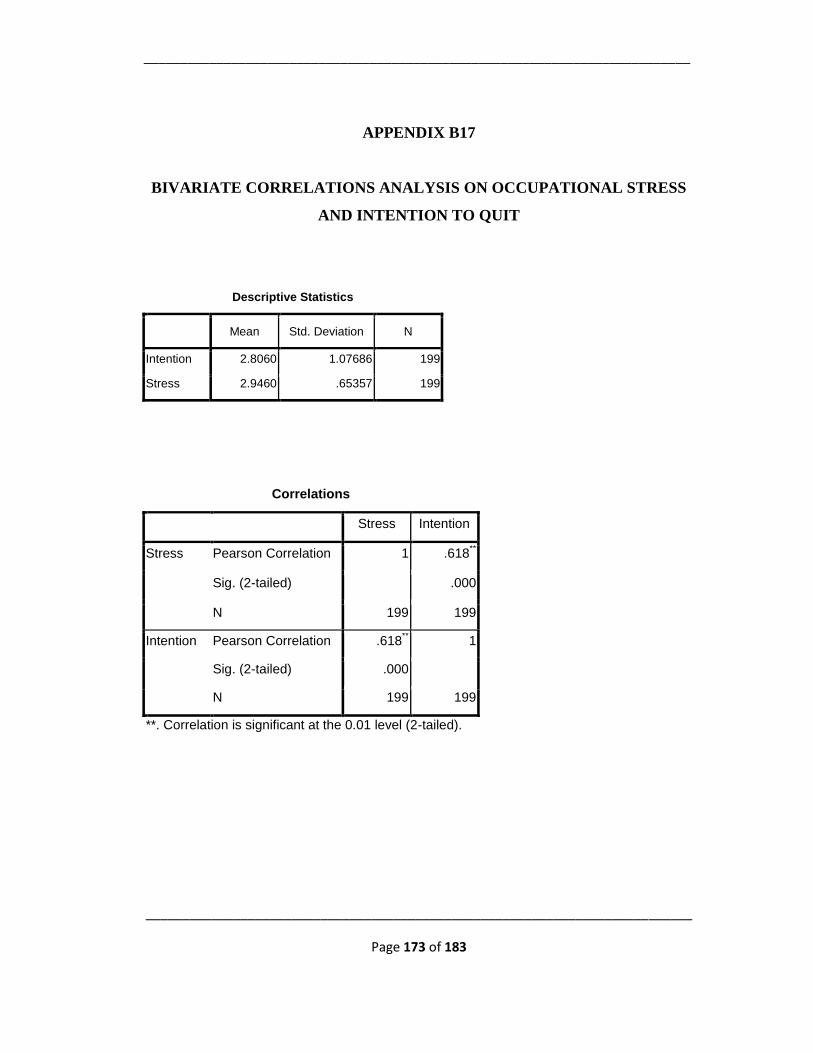
___________________________________________________________________________
___________________________________________________________________________
Page 173 of 183
APPENDIX B17
BIVARIATE CORRELATIONS ANALYSIS ON OCCUPATIONAL STRESS
AND INTENTION TO QUIT
Descriptive Statistics
Mean Std. Deviation N
Intention 2.8060 1.07686 199
Stress 2.9460 .65357 199
Correlations
Stress Intention
Stress Pearson Correlation 1 .618**
Sig. (2-tailed) .000
N 199 199
Intention Pearson Correlation .618** 1
Sig. (2-tailed) .000
N 199 199
**. Correlation is significant at the 0.01 level (2-tailed).
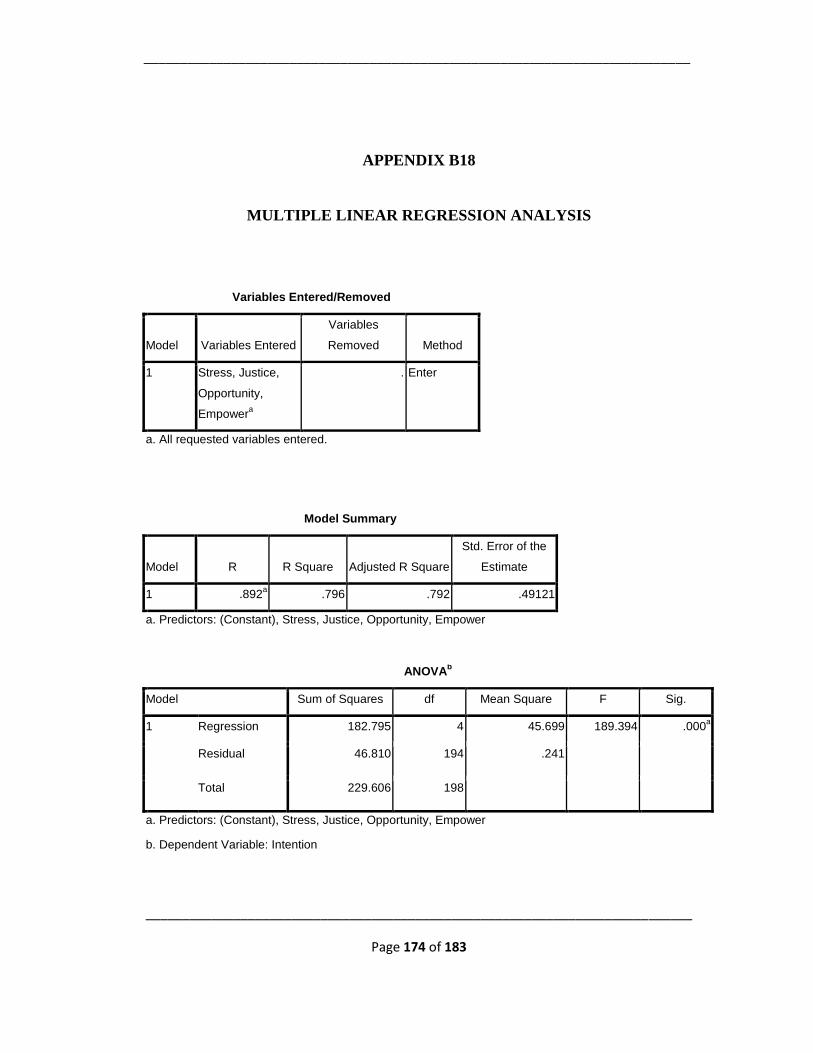
___________________________________________________________________________
___________________________________________________________________________
Page 174 of 183
APPENDIX B18
MULTIPLE LINEAR REGRESSION ANALYSIS
Variables Entered/Removed
Model Variables Entered
Variables
Removed Method
1 Stress, Justice,
Opportunity,
Empowera
. Enter
a. All requested variables entered.
Model Summary
Model R R Square Adjusted R Square
Std. Error of the
Estimate
1 .892a .796 .792 .49121
a. Predictors: (Constant), Stress, Justice, Opportunity, Empower
ANOVAb
Model Sum of Squares df Mean Square F Sig.
1 Regression 182.795 4 45.699 189.394 .000a
Residual 46.810 194 .241
Total 229.606 198
a. Predictors: (Constant), Stress, Justice, Opportunity, Empower
b. Dependent Variable: Intention
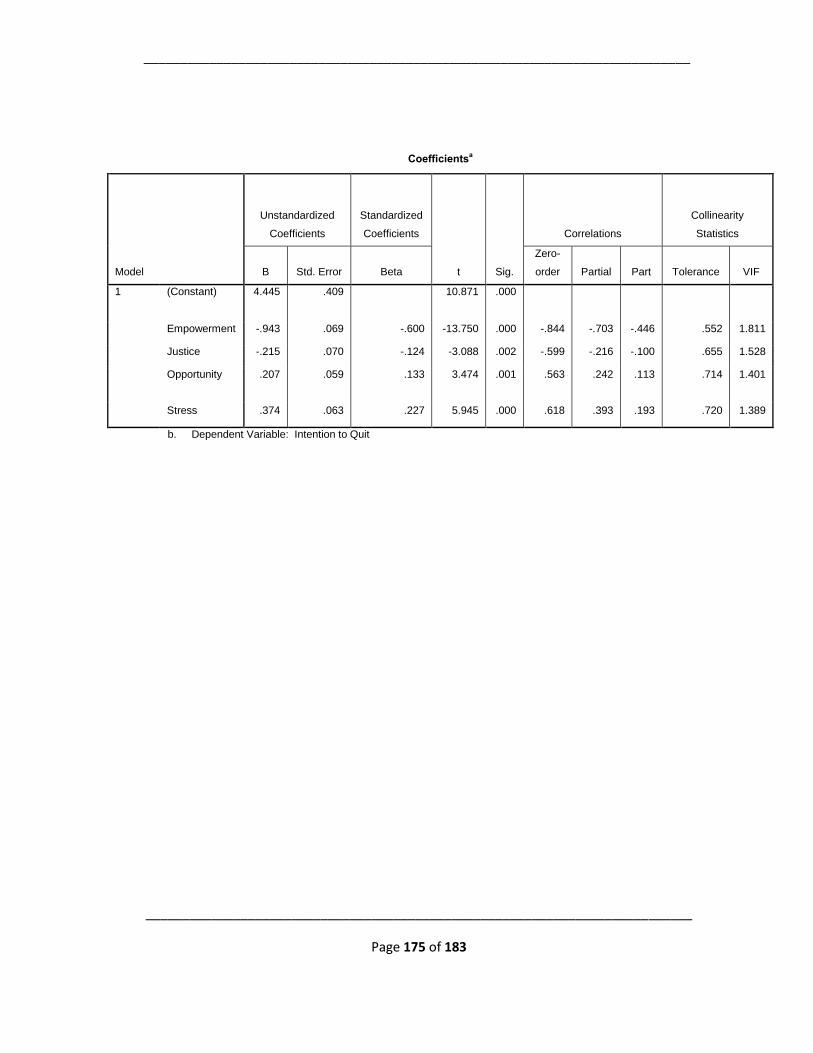
___________________________________________________________________________
___________________________________________________________________________
Page 175 of 183
Coefficientsa
Model
Unstandardized
Coefficients
Standardized
Coefficients
t Sig.
Correlations
Collinearity
Statistics
B Std. Error Beta
Zero-
order Partial Part Tolerance VIF
1 (Constant) 4.445 .409
10.871 .000
Empowerment -.943 .069 -.600 -13.750 .000 -.844 -.703 -.446 .552 1.811
Justice -.215 .070 -.124 -3.088 .002 -.599 -.216 -.100 .655 1.528
Opportunity .207 .059 .133 3.474 .001 .563 .242 .113 .714 1.401
Stress .374 .063 .227 5.945 .000 .618 .393 .193 .720 1.389
b. Dependent Variable: Intention to Quit
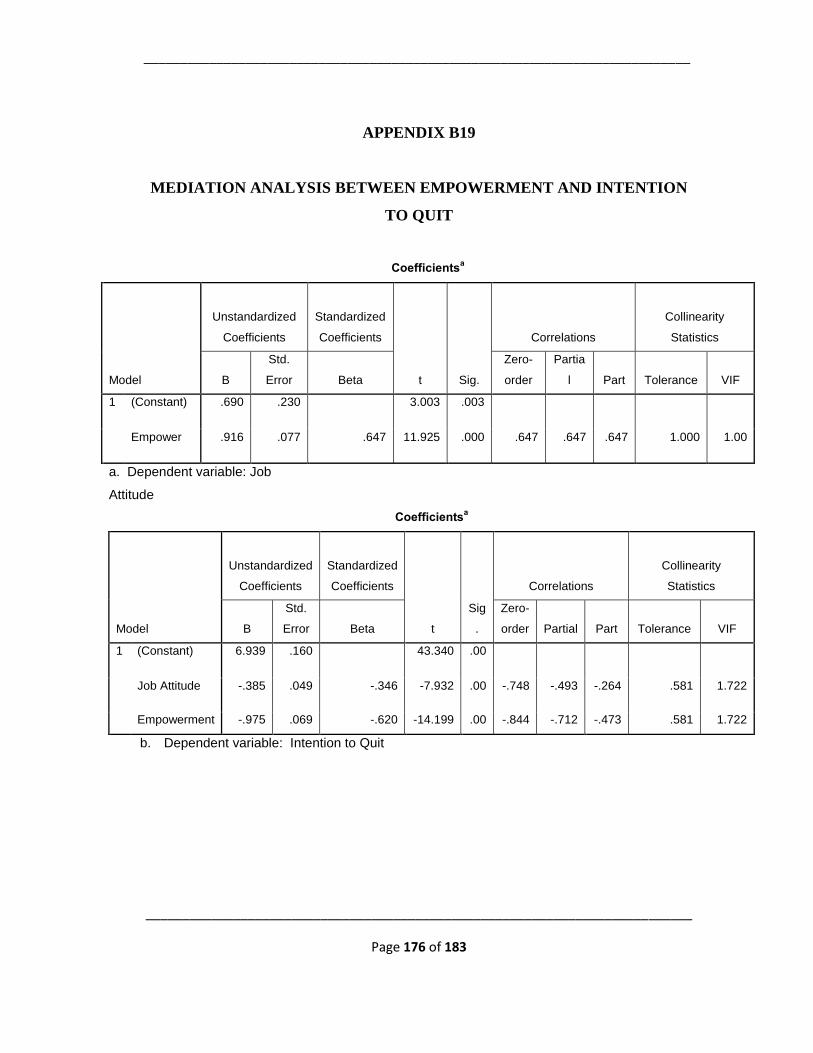
___________________________________________________________________________
___________________________________________________________________________
Page 176 of 183
APPENDIX B19
MEDIATION ANALYSIS BETWEEN EMPOWERMENT AND INTENTION
TO QUIT
Coefficientsa
Model
Unstandardized
Coefficients
Standardized
Coefficients
t Sig.
Correlations
Collinearity
Statistics
B
Std.
Error Beta
Zero-
order
Partia
l Part Tolerance VIF
1 (Constant) .690 .230
3.003 .003
Empower .916 .077 .647 11.925 .000 .647 .647 .647 1.000 1.00
a. Dependent variable: Job
Attitude
Coefficientsa
Model
Unstandardized
Coefficients
Standardized
Coefficients
t
Sig
.
Correlations
Collinearity
Statistics
B
Std.
Error Beta
Zero-
order Partial Part Tolerance VIF
1 (Constant) 6.939 .160
43.340 .00
Job Attitude -.385 .049 -.346 -7.932 .00 -.748 -.493 -.264 .581 1.722
Empowerment -.975 .069 -.620 -14.199 .00 -.844 -.712 -.473 .581 1.722
b. Dependent variable: Intention to Quit
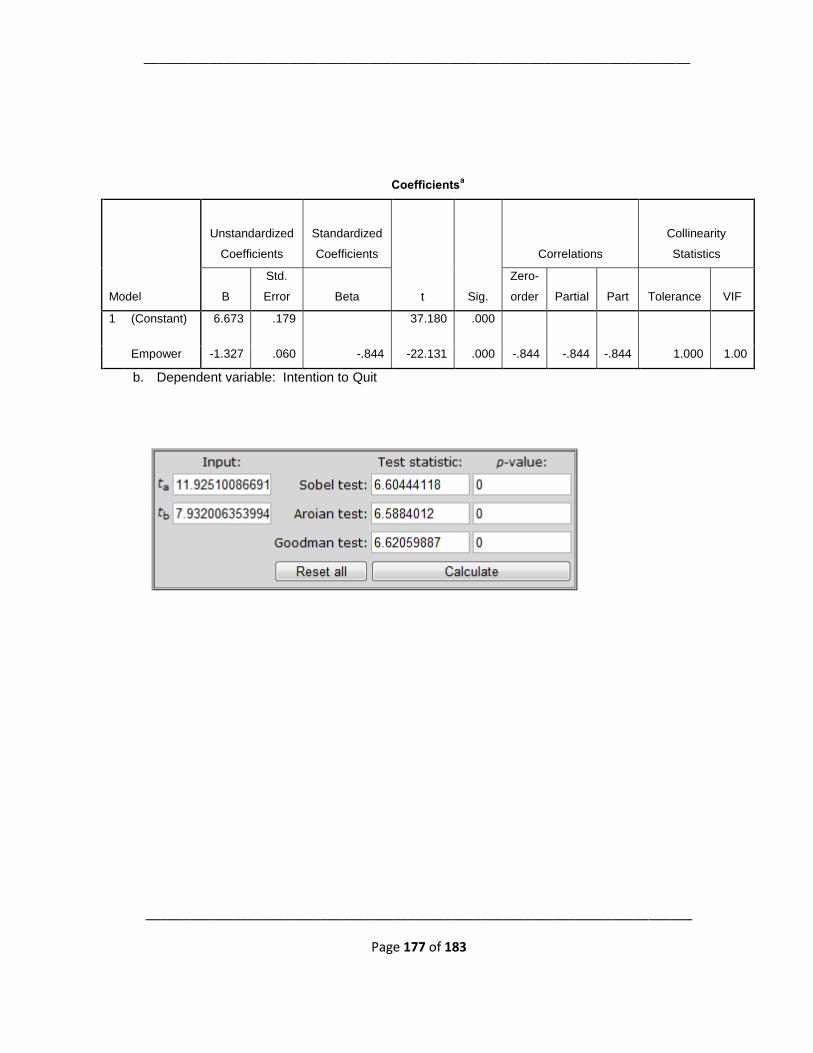
___________________________________________________________________________
___________________________________________________________________________
Page 177 of 183
Coefficientsa
Model
Unstandardized
Coefficients
Standardized
Coefficients
t Sig.
Correlations
Collinearity
Statistics
B
Std.
Error Beta
Zero-
order Partial Part Tolerance VIF
1 (Constant) 6.673 .179
37.180 .000
Empower -1.327 .060 -.844 -22.131 .000 -.844 -.844 -.844 1.000 1.00
b. Dependent variable: Intention to Quit
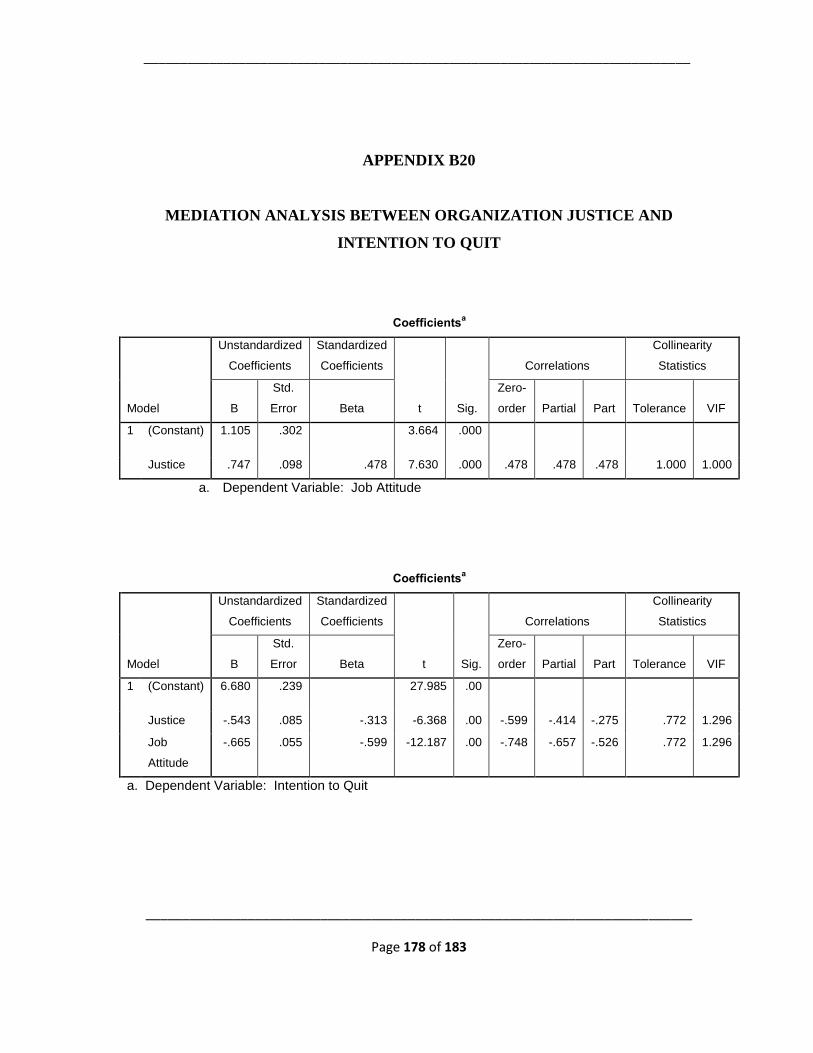
___________________________________________________________________________
___________________________________________________________________________
Page 178 of 183
APPENDIX B20
MEDIATION ANALYSIS BETWEEN ORGANIZATION JUSTICE AND
INTENTION TO QUIT
Coefficientsa
Model
Unstandardized
Coefficients
Standardized
Coefficients
t Sig.
Correlations
Collinearity
Statistics
B
Std.
Error Beta
Zero-
order Partial Part Tolerance VIF
1 (Constant) 1.105 .302 3.664 .000
Justice .747 .098 .478 7.630 .000 .478 .478 .478 1.000 1.000
a. Dependent Variable: Job Attitude
Coefficientsa
Model
Unstandardized
Coefficients
Standardized
Coefficients
t Sig.
Correlations
Collinearity
Statistics
B
Std.
Error Beta
Zero-
order Partial Part Tolerance VIF
1 (Constant) 6.680 .239 27.985 .00
Justice -.543 .085 -.313 -6.368 .00 -.599 -.414 -.275 .772 1.296
Job
Attitude
-.665 .055 -.599 -12.187 .00 -.748 -.657 -.526 .772 1.296
a. Dependent Variable: Intention to Quit
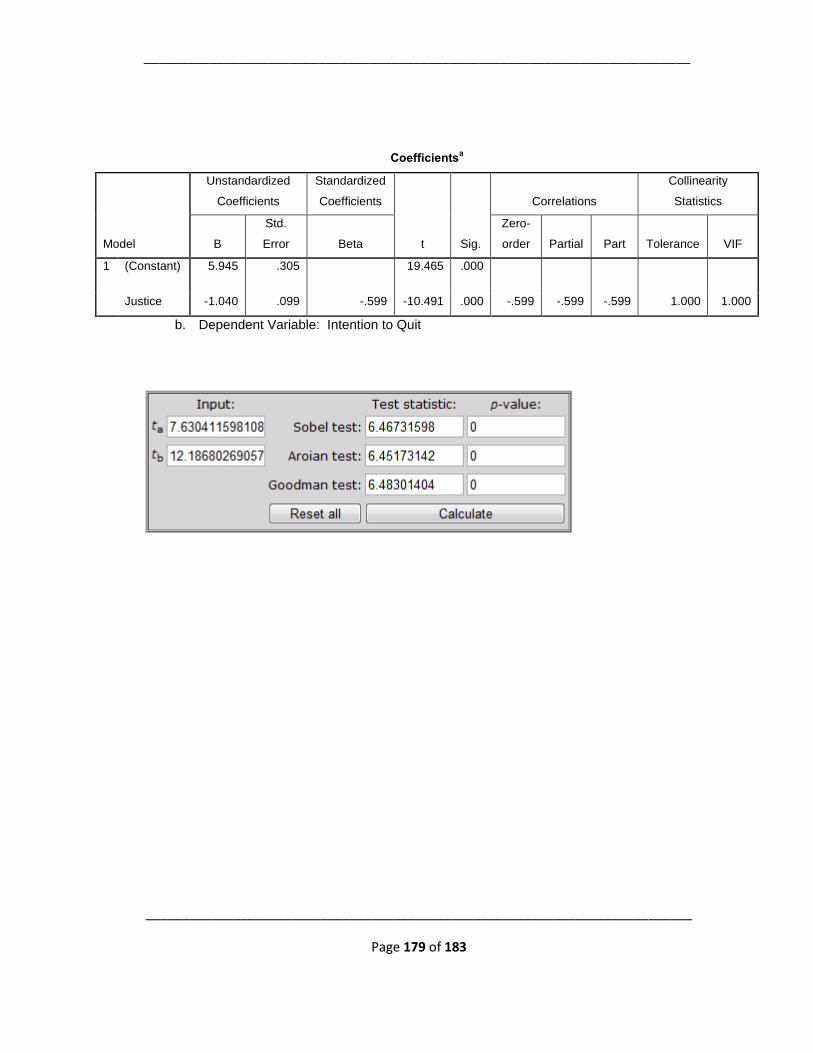
___________________________________________________________________________
___________________________________________________________________________
Page 179 of 183
Coefficientsa
Model
Unstandardized
Coefficients
Standardized
Coefficients
t Sig.
Correlations
Collinearity
Statistics
B
Std.
Error Beta
Zero-
order Partial Part Tolerance VIF
1 (Constant) 5.945 .305
19.465 .000
Justice -1.040 .099 -.599 -10.491 .000 -.599 -.599 -.599 1.000 1.000
b. Dependent Variable: Intention to Quit
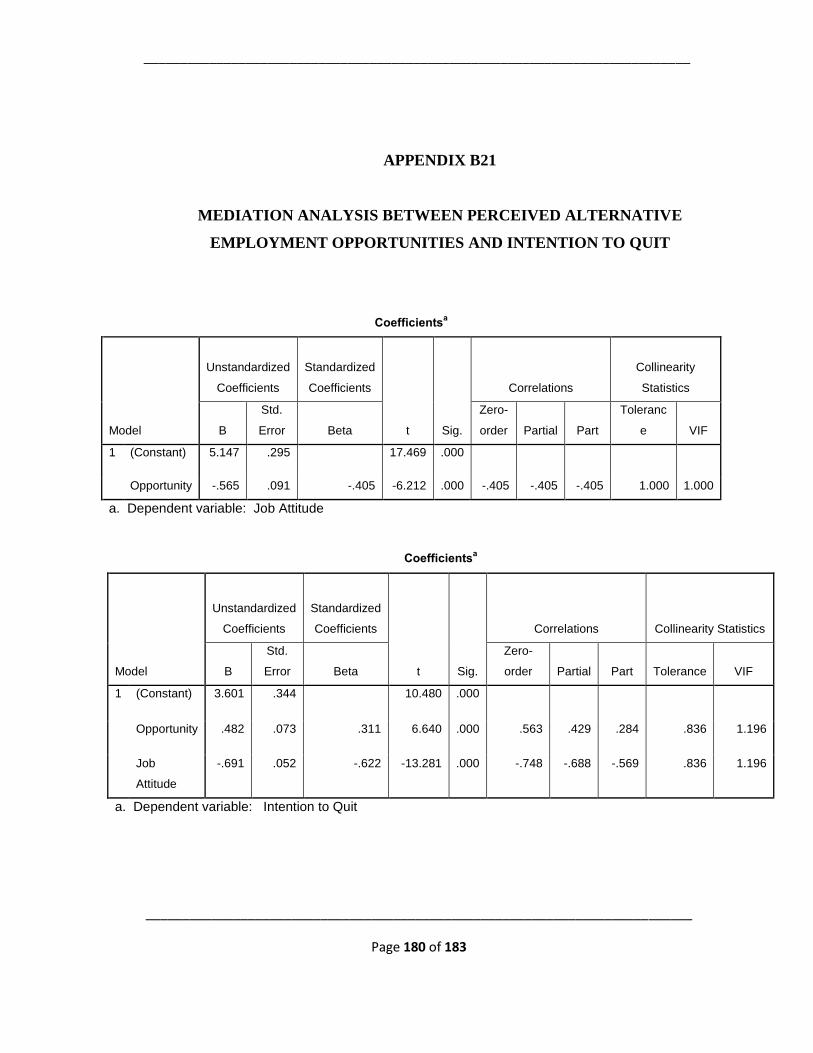
___________________________________________________________________________
___________________________________________________________________________
Page 180 of 183
APPENDIX B21
MEDIATION ANALYSIS BETWEEN PERCEIVED ALTERNATIVE
EMPLOYMENT OPPORTUNITIES AND INTENTION TO QUIT
Coefficientsa
Model
Unstandardized
Coefficients
Standardized
Coefficients
t Sig.
Correlations
Collinearity
Statistics
B
Std.
Error Beta
Zero-
order Partial Part
Toleranc
e VIF
1 (Constant) 5.147 .295 17.469 .000
Opportunity -.565 .091 -.405 -6.212 .000 -.405 -.405 -.405 1.000 1.000
a. Dependent variable: Job Attitude
Coefficientsa
Model
Unstandardized
Coefficients
Standardized
Coefficients
t Sig.
Correlations Collinearity Statistics
B
Std.
Error Beta
Zero-
order Partial Part Tolerance VIF
1 (Constant) 3.601 .344
10.480 .000
Opportunity .482 .073 .311 6.640 .000 .563 .429 .284 .836 1.196
Job
Attitude
-.691 .052 -.622 -13.281 .000 -.748 -.688 -.569 .836 1.196
a. Dependent variable: Intention to Quit
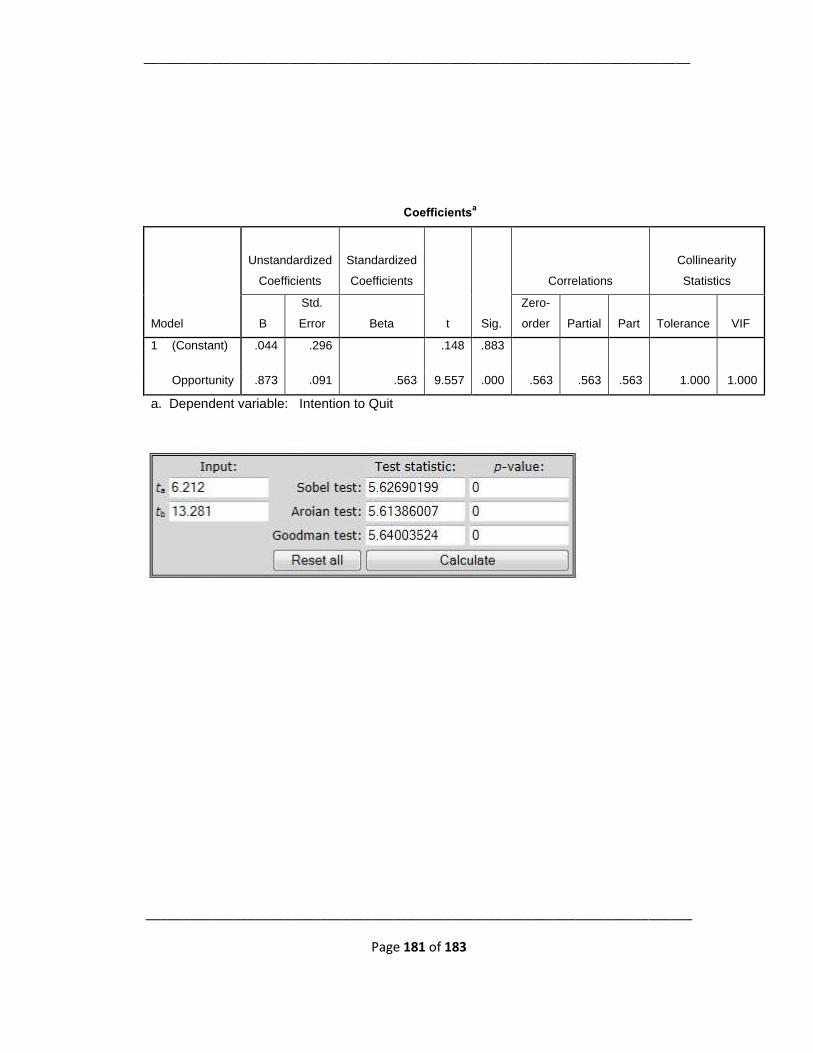
___________________________________________________________________________
___________________________________________________________________________
Page 181 of 183
Coefficientsa
Model
Unstandardized
Coefficients
Standardized
Coefficients
t Sig.
Correlations
Collinearity
Statistics
B
Std.
Error Beta
Zero-
order Partial Part Tolerance VIF
1 (Constant) .044 .296
.148 .883
Opportunity .873 .091 .563 9.557 .000 .563 .563 .563 1.000 1.000
a. Dependent variable: Intention to Quit
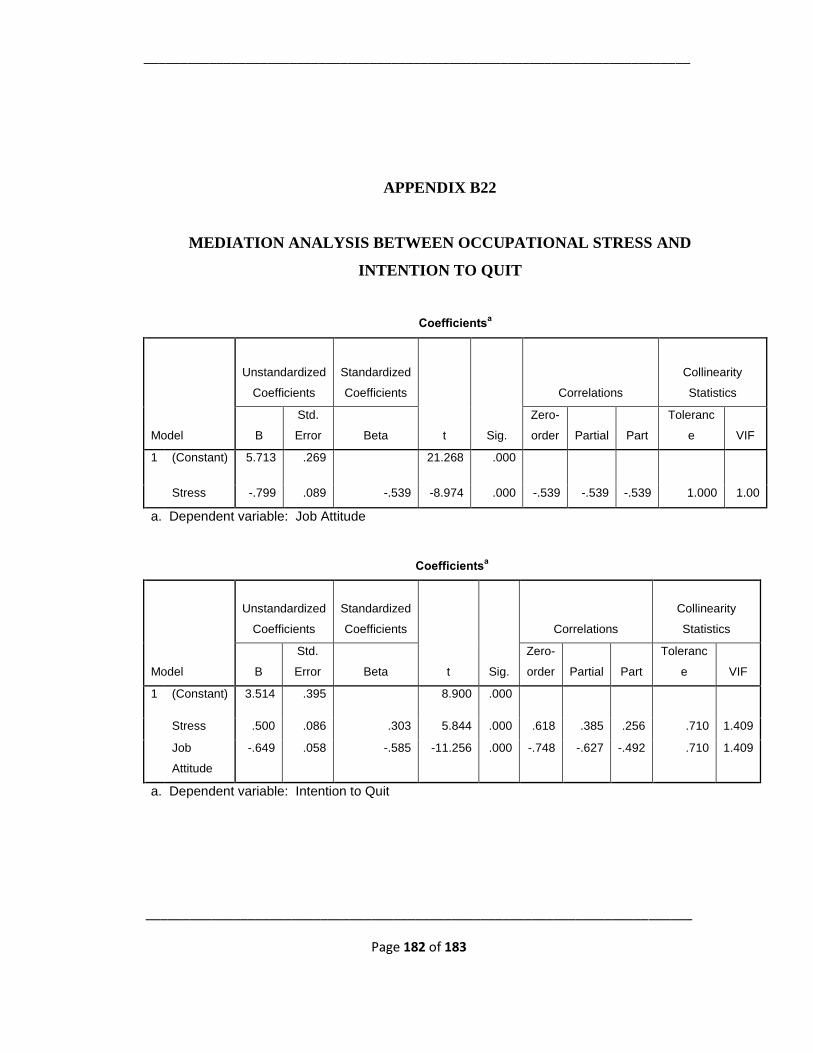
___________________________________________________________________________
___________________________________________________________________________
Page 182 of 183
APPENDIX B22
MEDIATION ANALYSIS BETWEEN OCCUPATIONAL STRESS AND
INTENTION TO QUIT
Coefficientsa
Model
Unstandardized
Coefficients
Standardized
Coefficients
t Sig.
Correlations
Collinearity
Statistics
B
Std.
Error Beta
Zero-
order Partial Part
Toleranc
e VIF
1 (Constant) 5.713 .269
21.268 .000
Stress -.799 .089 -.539 -8.974 .000 -.539 -.539 -.539 1.000 1.00
a. Dependent variable: Job Attitude
Coefficientsa
Model
Unstandardized
Coefficients
Standardized
Coefficients
t Sig.
Correlations
Collinearity
Statistics
B
Std.
Error Beta
Zero-
order Partial Part
Toleranc
e VIF
1 (Constant) 3.514 .395 8.900 .000
Stress .500 .086 .303 5.844 .000 .618 .385 .256 .710 1.409
Job
Attitude
-.649 .058 -.585 -11.256 .000 -.748 -.627 -.492 .710 1.409
a. Dependent variable: Intention to Quit
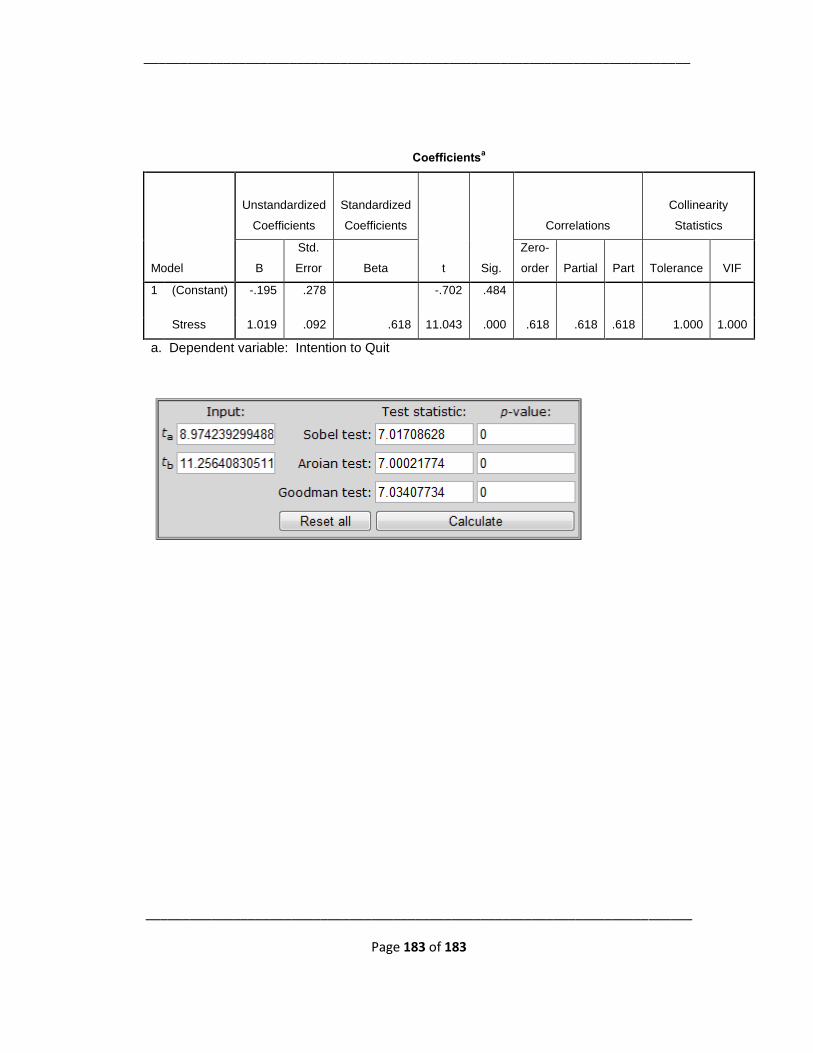
___________________________________________________________________________
___________________________________________________________________________
Page 183 of 183
Coefficientsa
Model
Unstandardized
Coefficients
Standardized
Coefficients
t Sig.
Correlations
Collinearity
Statistics
B
Std.
Error Beta
Zero-
order Partial Part Tolerance VIF
1 (Constant) -.195 .278
-.702 .484
Stress 1.019 .092 .618 11.043 .000 .618 .618 .618 1.000 1.000
a. Dependent variable: Intention to Quit