factors affecting selection of promotional …apjor.com/files/1379953900.pdf · factors affecting...
TRANSCRIPT

September 2013, Volume: II, Issue: IX
169
FACTORS AFFECTING SELECTION OF PROMOTIONAL MIX BY SMALL AND
MEDIUM SCALE INDUSTRIES IN COIMBATORE & PALAKKAD
1Dr.S.Franklin John, Professor& Principal, Nehru College of Management, Coimbatore
2Ms. R.Sheeja, Assistant Professor, Nehru College of Management, Coimbatore
ABSTRACT
The small and medium sector in Coimbatore and Palakkad has assumed greater importance as
the main employer of the displaced workforce, as well as being the main contributing sector to
the economy of our country. However many players in this sector do not seem to appreciate
critical role played by integrated marketing communication in getting their products to the
market .Due to the wrong selection of the promotional mix most of the quality products and
services are not fetching demand. Due to less demand the manufacturers are forced to sell the
products for a lesser cost. This leads to losses and shutdowns of the small medium enterprises.
By this study we are trying to find out the factors which influence the selection of the
promotional mix for these industries. End of the research we are planning to propose a
promotion mix modal which will be helpful for the small medium enterprises to promote their
product in the right and efficient manner.
Key words:- Small and medium enterprises, Promotional mix, advertisement Personal
selling.
Introduction
Rapid industrialization is considered as an engine of economic growth. Industrialization helps in
solving the large number of problems encountered by developing economies. But these
economies can not rely entirely on large scale industries for the industrial development due to
paucity of financial, technological and manpower resources. These economies have to depend on
small scale sector for speedy development of their economies. The problem of poverty,
inequality and unbalanced regional development can be abridged by expansion of small scale
units. This sector also contributes towards the growth of export in the country. It helps in solving
the problem of balance of payment in the economy. Small scale sector maintains better rapport
between employer and employees thereby maintaining better industrial relations in the economy.
Small scale sector requires less capital as compared to large scale units, can be started by new
generation of entrepreneurs. This sector can act as a nursery of entrepreneurship in the
developing economies.
Small business plays a central role in everyone's life because much of our day today economic
activities based on small business. It provides various service, professional practices and
merchandisers filling immediate needs of their customers and clients, so small business
contribute to the high quality of life that we enjoy. Small business enterprises have been

September 2013, Volume: II, Issue: IX
170
identified as an important strategic sector for promoting growth & social development of any
country. Over the years, small businesses have gained wide recognition as a major source of
employment, income generation, poverty alleviation & regional development. The small
business enterprises cover broad areas of economic activities such as manufacturing, service,
trading, professional services & others.
Small and Medium Scale Industries in India
Small and Medium Enterprises (MSME) sector has emerged as a highly vibrant and dynamic
sector of the Indian economy over the last five decades. Small-scale industries have been playing
a momentous role in overall economic development of a country like India where millions of
people are unemployed or underemployed. Poverty and unemployment are two of the burning
problems of the country today. This sector solves these two problems through providing
immediate large-scale employment, with lower investments.
According to Dr. Manmohan Singh, “the key to our success in employment lies in the success of
manufacturing in the small scale sector1”. The economic development of any country primarily
depends upon the establishment of industries, which require sufficient amount of capital. In a
country like India, where capital is scarce and unemployment is wide spread, growth of small-
scale industries is vital in order to achieve balanced economic growth. The strength of small-
scale enterprises lies in their wide spread dispersal in rural, semi-urban and urban areas, fostering
entrepreneurial base, shorter gestation period, and equitable distribution of income and wealth.
Having recognized the significance of SSI sector, the Govt. of India has set up various
agencies and institutions at different levels-central, state and local, have been pursuing the policy
of protection and promotion of this sector since independence and also offered several incentives
and concessions for their promotion and development.
There are over 6000 products ranging from traditional to high-tech items, which are being
manufactured by the MSME sector in addition to provide wide range of services. The leading
industries with their respective shares are as depicted below:

September 2013, Volume: II, Issue: IX
171
Source: Ministry of MSMEs annual Report 2012-13
It is well known that the MSME provide the maximum opportunities for both self-employment
and jobs after agriculture sector. And MSMEs contributes a major percentage to the gross output.
Source: Ministry of MSMEs annual Report 2012-13
Growth of Small and Medium Enterprises in Tamil Nadu Especially in Coimbatore
Coimbatore is one among the industrially developed and commercially vibrant districts of Tamil
nadu. It has got high concentration of small scale industries and medium and large scale
industries. It is known as the Manchester of South India because of its well developed textile
industry and other industrial base. The third largest city of the state, Coimbatore, is one of the
most industrialized cities in Tamil Nadu, known as the textile capital of South India or the
Manchester of the South. The successful growth of cotton which served as a foundation for the
establishment of its famous textile industry. The first textile mills came as far back as 1888 but
there are now over a hundred mills. The result has been a strong economy and a reputation as
one of the greatest industrial cities in South India. There are more than 25,000 small, medium,
large sale industries and textile mill. Coimbatore is also famous for the manufacture of motor
pump sets and varied engineering goods. The development of Hydro electricity from the Pykara
Falls in the 1930 led to a cotton boom in Coimbatore.
Growth of Small and Medium Enterprises in Palakkad
Palakkad district the chief granary is often called the Gate way of Kerala lying at the foot of
Western Ghats, bordering the neighboring state of Tamil Nadu. Agriculture is the main
occupation of the people of the district. The Directorate of Industries and commerce (DIC) has
provided infrastructure facilities for small scale sector by acquiring land and developing it into
industrial area with all the facility. The Small Industries Corporation (SIDCO) is also providing
infrastructure facility for the small sector through 2 industrial estates and 3 mini industrial
estates. The units in these estates produce agricultural implements, ferrous castings, rubber
products, and cutleries, electronic and electrical products.
Promotion Mix

September 2013, Volume: II, Issue: IX
172
Most integrated marketing is deployed along the following functions of marketing used within
the organization: Advertising Tools - advertising management, advertising design: theoretical
frameworks and types of appeals; advertising design: message strategies and execution
frameworks; advertising media selection. Advertising also reinforces brand and firm image.
Promotional Tools - trade promotions; consumer promotions; personal selling, database
marketing, and customer relations management; public relations and sponsorship programs.
Integration Tools - Internet Marketing; Promotion mix for small business and entrepreneurial
ventures; evaluating and integrated marketing program. Reid, (2005).
Promotion is a process for managing customer relationships that drive brand value primarily
through communication efforts. Such efforts often include cross functional processes that create
and nourish profitable relationships with customers and other stakeholders by strategically
controlling or influencing all messages sent to these groups and encouraging data-driven,
purposeful dialog with them. Promotion includes the coordination and integration of all
marketing communication tools, avenues, and sources within a company into a seamless program
in order to maximize the impact on end users at a minimal cost. This integration affects all firms’
business-to-business, marketing channel, customer-focused, and internally directed
communications. Integrated Marketing Communications is a simple concept. It ensures that all
forms of communications and messages are carefully linked together.
Need for the Study
The small and medium sector in Coimbatore and Palakkad has assumed greater importance as
the main employer of the displaced workforce, as well as being the main contributing sector to
the economy of our country. However many players in this sector do not seem to appreciate
critical role played by integrated marketing communication in getting their products to the
market .Due to the wrong selection of the promotional mix most of the quality products and
services are not fetching demand. Due to less demand the manufacturers are forced to sell the
products for a lesser cost. This leads to losses and shutdowns of the small medium enterprises.
By this study we are trying to find out the factors which influence the selection of the
promotional mix for these industries. End of the research we are planning to propose a promotion
mix modal which will be helpful for the small medium enterprises to promote their product in the
right and efficient manner.
Limitations of the Study
The study covered only two percentage of the Small and Medium Enterprises situated across
Coimbatore and Palakkad. So the results cannot be generalized for the other Small and Medium
Enterprises of India. Due to lack of time we were unable to cover a larger sample.
Objectives
The objectives of the study are
1. To identify the factors influence the selection of promotional mix.

September 2013, Volume: II, Issue: IX
173
2. To study the most preferred promotional tools by.
Methodology
The structured questionnaire was developed after a detailed discussion with both academia and
industries from Coimbatore and Palakkad. From Coimbatore we have selected 70 industries after
careful investigation of their performance in the past 5 yrs. The companies which have turnover
below one crore are selected as samples. The same criteria have applied for the companies in
Palakkad and we have identified 30 companies which fall under. In Coimbatore we have selected
200 companies and in Palakkad we identified 50 companies where 70 companies in Coimbatore
and 30 companies in Palakkad were responded. The collected data was analyzed using
percentage analysis and one way ANOVA.
Analysis & Interpretation
Promotion Tools No: of respondents %
Advertising
Personal Selling
Sales Promotion
Direct Marketing
Public Relations
9
41
4
32
14
9%
41%
4%
32%
14%
Table 1. Frequency Table for the promotion tools based on its performance. Source: Primary data
Chart 1. Promotion tools based on its performance
From the table 1 and chart, it is inferred that 41% of the respondents prefer Personal selling, 32%
prefer Direct Marketing, 14% prefer Public Relations, 9% prefer Advertising and 4% prefer
Sales promotion as a tool for promotion.
9
414
32
14
promotion tools based on its performance
Advertising
Personal Selling
Sales Promotion
Direct Marketing
Public Relations

September 2013, Volume: II, Issue: IX
174
Analysis between State and Budget spend for promotion
Crosstab
Budget for Promotion from Sales
Total <5% 5-10% 10-15%
State Where the Sample is taken from
Kerala 18 9 3 30
Tamilnadu 34 26 10 70 Total 52 35 13 100
Table 2. Analysis between State and Budget spend for promotion Source: Primary data
Chart 2. Analysis between State and Budget spend for promotion. Source: Primary data
From the table 2 and chart 2, it is inferred that 53% the companies spend below 5% of the annual
sales towards promotion out which 18 belongs to Kerala and 34 belongs to Tamil Nadu. 35% of
the companies spend 5-10% out of which 9 belong to Kerala and 24 belong to Tamil Nadu. 13%
of the companies spend 10-15 % towards promotion out of which 3 belong to Kerala and 10
belong to Tamil Nadu.
Analysis between Qualification of the respondent and Budget for Promotion from Sales
Crosstab
Count
Budget for Promotion from Sales
Total <5% 5-10% 10-15%
Qualification of the respondent
<SSLC 5 0 0 5
SSLC 0 9 4 13
Plus Two 10 0 4 14
Diploma 15 8 5 28
Graduation 22 14 0 36

September 2013, Volume: II, Issue: IX
175
Post Graduation 0 4 0 4 Total 52 35 13 100
Table 3. Analysis between Qualification of the respondent and Budget for Promotion from Sales Source: Primary data
Chart 3. Analysis between Qualification of the respondent and Budget for Promotion from Sales
From the table 3 and chart 3 it is inferred that, out of 36 graduates 22 spends below 5% and 14
spends 5-10% of the sales towards promotion. Out of 28 diploma holders 15 spend below 5%, 8
spend 5-10% and 5 spend 10-15% of the sales towards promotion. Out of 14 respondents with
plus two 10 spend below 5%, 4 spend 10-15% of the sales towards promotion. Out of 13
respondents with SSLC 9 spend below 5-10% and 4 spend 10-15% of the sales towards
promotion. All the 5 respondents with below SSLC spend only below 5% of the sales towards
promotion and all the 4 post graduates spend 10-15% of the sales towards promotion.
Analysis between Type of Ownership and Budget for Promotion from Sales
Crosstab
Count
Budget for Promotion from Sales
Total <5% 5-10% 10-15%
Type of Ownership Sole Propreitor 20 22 13 55
Partnership 17 13 0 30
Company 15 0 0 15 Total 52 35 13 100
Table 4. Analysis between Type of Ownership and Budget for Promotion from Sales Source: Primary data

September 2013, Volume: II, Issue: IX
176
Chart 4. Analysis between Type of Ownership and Budget for Promotion from Sales Source: Primary data
From the table 4 and chart 4, it is inferred that out of 55 sole proprietorship firms, 20 spend
below 5%, 22 spend 5-10% and 13 spend 10-15% of the sales towards promotion. Out of 30
partnership firms, 17 spend below 5% and 13 spend 10-15% of the sales towards promotion. All
the 15 companies spend below 5% of the sales towards promotion.
One way ANOVA between Advertising and budget allocation for the promotion
H0 : Budget allocation will not influence selection of advertising as a promotional tool
Advertising N Mean SD F Sig
<5%
5-10%
10-15%
52
35
13
3.04
4.03
2.54
1.120
0.707
1.761
12.167 0.000
Table 5. One way ANOVA between Advertising and budget allocation for the promotion
There is a mean difference among spending level and advertisement. And small positive
variations in the standard deviation still we wants to confirm the significant variation in the
means. Hence one way analysis of variance test was performed. We got an F score of 12.167 and
significant value of 0.00. Since the calculated value is less than 0.05, we reject the null
hypothesis.
September 2013, Volume: II, Issue: IX
177
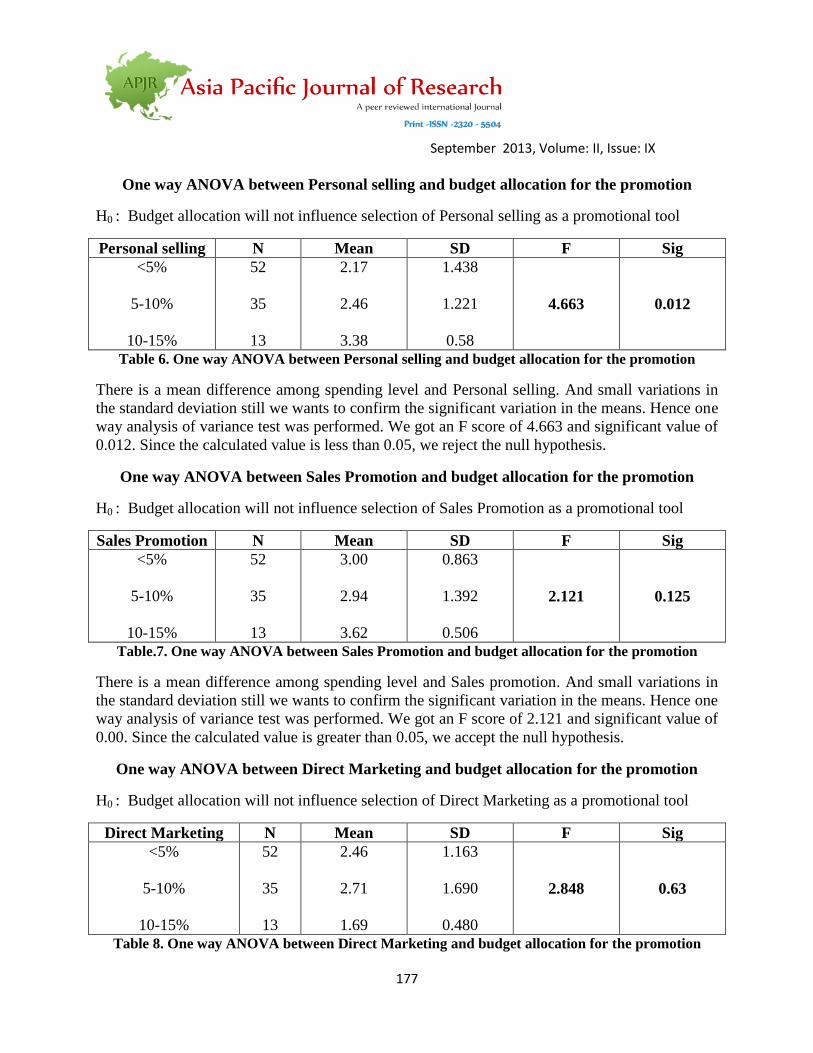
One way ANOVA between Personal selling and budget allocation for the promotion
H0 : Budget allocation will not influence selection of Personal selling as a promotional tool
Personal selling N Mean SD F Sig
<5%
5-10%
10-15%
52
35
13
2.17
2.46
3.38
1.438
1.221
0.58
4.663 0.012
Table 6. One way ANOVA between Personal selling and budget allocation for the promotion
There is a mean difference among spending level and Personal selling. And small variations in
the standard deviation still we wants to confirm the significant variation in the means. Hence one
way analysis of variance test was performed. We got an F score of 4.663 and significant value of
0.012. Since the calculated value is less than 0.05, we reject the null hypothesis.
One way ANOVA between Sales Promotion and budget allocation for the promotion
H0 : Budget allocation will not influence selection of Sales Promotion as a promotional tool
Sales Promotion N Mean SD F Sig
<5%
5-10%
10-15%
52
35
13
3.00
2.94
3.62
0.863
1.392
0.506
2.121 0.125
Table.7. One way ANOVA between Sales Promotion and budget allocation for the promotion
There is a mean difference among spending level and Sales promotion. And small variations in
the standard deviation still we wants to confirm the significant variation in the means. Hence one
way analysis of variance test was performed. We got an F score of 2.121 and significant value of
0.00. Since the calculated value is greater than 0.05, we accept the null hypothesis.
One way ANOVA between Direct Marketing and budget allocation for the promotion
H0 : Budget allocation will not influence selection of Direct Marketing as a promotional tool
Direct Marketing N Mean SD F Sig
<5%
5-10%
10-15%
52
35
13
2.46
2.71
1.69
1.163
1.690
0.480
2.848 0.63
Table 8. One way ANOVA between Direct Marketing and budget allocation for the promotion

September 2013, Volume: II, Issue: IX
178
There is a mean difference among spending level and direct marketing. And small variations in
the standard deviation still we wants to confirm the significant variation in the means. Hence one
way analysis of variance test was performed. We got an F score of 2.848 and significant value of
0.63. Since the calculated value is greater than 0.05, we accept the null hypothesis.
One way ANOVA between Public Relations and budget allocation for the promotion
H0 : Budget allocation will not influence selection of Public Relations as a promotional tool
Public Relations N Mean SD F Sig
<5%
5-10%
10-15%
52
35
13
4.42
2.86
3.77
1.273
1.417
1.922
12.742 0.000
Table. 9. One way ANOVA between Public Relations and budget allocation for the promotion
There is a mean difference among spending level and public relations. And small positive
variations in the standard deviation still we wants to confirm the significant variation in the
means. Hence one way analysis of variance test was performed. We got an F score of 12.742 and
significant value of 0.00. Since the calculated value is less than 0.05, we reject the null
hypothesis.
INTERPRETATION AND DISCUSSION
From the above analysis and interpretations and the help of the literature review, we form the
following discussions to understand why this results has occurred.
Most of the SMEs prefer personal selling as their promotional tool. It is followed by
direct marketing, public relations, advertisement and sales promotions. We can
understand from the literatures sales promotion and advertisement may not be convenient
and suitable promotional tool because of their huge cost involvement. They prefer
personal selling their customers are limited and the manufacture the products to the
requirement of the customer. Direct marketing helps SMEs to create a one to one
relationship to promote their products.
Most of the SMEs spend very little amount towards the promotion of their products. In
that when we compare state of Tamil Nadu and Kerala, the SMEs in Kerala spends
proportionately small amount towards promotions. In the state of Tamil Nadu the median
range SMEs allocate considerably spend significant amount towards promotional mix.
The budget allocation towards promotion and proprietor’s educational qualification has
no significant relationship. From the analysis the proprietors of SMEs allocate the same
amount of money towards promotional budget invariably of their educational
qualification. We can infer as educational qualification increases there is a negative trend
creates towards budget allocation for promotion.

September 2013, Volume: II, Issue: IX
179
The SMEs owned by sole proprietors spend more money towards promotional budget
followed by SMEs of partnership tie and SMES of LTD. We can understand that SMEs
owned by sole proprietor has a freedom to take decision on their own.
From the analysis and interpretation, we can understand that there is a strong influence on
selection of promotional tools and budget allocation in SMEs. Selection of advertising,
personal selling and Public Relations highly influenced by the budget constraints.
CONCLUSION
From above discussion and literature review we can understand the pattern of selection of
promotion mix among SMEs in Coimbatore and Palakkad. Due to stiff competition, SMEs make
marginal profit other than specialized products. From the discussion with the proprietors of
SMEs and from the data analysis we understand that they prefer personal selling as their
desirable promotional tool. Out of research experience we suggest SMEs to hold press meet
about their products followed by a sales promotion. This will create awareness among their
targeted customers then they have a well trained sales force to end the sale. This promotional
mix is the most cost effective and suitable for SME sector in India.
REFERENCE
1. Annual Report (2000 – 01) Ministry of small scale Industries and Agro & Rural
Industries, Government of India, New Delhi.
2. Annual Report (2011 – 12) Ministry of small scale Industries and Agro & Rural
Industries, Government of India, New Delhi.
3. Annual Report (2012 – 13) Ministry of small scale Industries and Agro & Rural
Industries, Government of India, New Delhi.
4. Ashokkumar singh. 1970, “Problems and prospects of small scale industries in Bibar: A
critical study" PhD, Theis, Bibar University.
5. B. Narayanas 2008. „Financing of industries in Bihar - An Industrial Development Bank
for Bihar. Unpublished Ph.D Bihar University.
6. Bepin Behari. 1997, Rural Industrialisation in India, Vikas publishing House, New Delhi.
7. C.S. Mohan Kumar. 2006, “Role of commercial Banks in Financing Small Scale
Industries in Trivandrum District.” Unpublished M.Phil. dessertation, Calicut University.
8. G. Balakrishna. 2007, Financing of Small Scale Industries in India 1950-5. Bomaby: Asia
publishing House.
9. Ganstyam Pandov 2008. Management of working capital in small scale industries. New
Delhi: Deep and Deep publications.
10. Government of India, Report of the committee on unemployment, Bhagavathi
Committee, New Delhi (1997).
11. Grabam Bannock. 1969, The Economics of small firms: Return form the wilderness.
Oxford: Basil Blackwell.
12. Industrial Profile of Coimbatore district 2012-13

September 2013, Volume: II, Issue: IX
180
13. Interim report of the study group on Development of small Enterprises small industries
Development organization, New Delhi.
14. Kalchetty Eresi 2008. Management of Finance in Small Scale Industry. Allahabad: Vohra
publishes and Distributions.
15. M.C. Shetty. 2008, Cottage and Household Industries in Developing Economy. Bomaby:
Asian publication.
16. Malagawakar .P.D. 1997, 'Problems of small Industry - A study in Andhra Pradesh,
Hydrabad, SIET.
17. Mathew. P.M. 1970, Small Enterprises and Regional Development, Challenges and
Choices, Kanishka Publishers – Distributors, New Delhi, P. 32.
18. Mohammed Sayeed. 2007, “Financing of Small Scale and Cottage Industries in Uttar
Pradesh”. Ph.D thesis, Allahabad University.
19. Nisae Ahmad. 1970, "Problems and management of small scale and cottage Industries"
New Delhi. Deep and Deep publication.
20. People .T.S. 1997, spatial, "Diversification of Manufacturing Industries in Uttarpradesh,
Lucknow," Giri Institute of Development studies.
21. Ramakrishna .K.T. 2001, Finance for small scale industry in India, Yojana, May 15, Vol.
35, No. 8, pp. 24-25.
22. Retnakr Gedam, 2001, Economic reforms and Industrial production, Yojana, April 15,
Vol. 35 No. 19, pp. 24-27.
23. Rostagi .K.M. 1997, Employment generation through S.S. Village and cottage Industries
– A case study of M.P. in D.L. Narfayana et. Al (Eds).
24. S.K. Basu. 2007, Place and problems of small scale industries. Calcutta: Mukerjee and
Co. Pvt. Ltd.
25. Sarma .R.K. 1998, Industrial development of Andhra Pradesh – A Regional analysis,
Bombay, Himalaya Publishing House.
26. Sidharthan.G. 1997, Entrepreneurship of small scale Industries –A study in Kanyakumari
District, unpublished thesis, University of Madras.
27. Small Industries Extension training (SIET). 1972, A study of National small Industries
Corporation in Hire – purchase scheme, Hydrabad, SIET Institute.
28. Srinivasan. R. 1997, "A study of marketing orientation to the success of small scale
industries, conducted by Administrative Staff College of India, sponsored by Indian
Council of Social Science Research, New Delhi.