factor pineapple production the case study of ngoma
TRANSCRIPT

Factors Affecting Small Scale Farmers’ Pineapple Production
The case study of Ngoma District, Rwanda
A Research Project submitted to Van Hall Larenstein University of Applied Sciences in partial fulfillment of the requirements for the award of Professional Master Degree
in Management of Development
Specialization: Rural Development and Food Security
By
Regina KAYITESI September 2011 Wageningen Netherlands © Copyright Regina Kayitesi 2011. All rights reserved.

ii
PERMISSION TO USE
This research project is submitted in partial fulfillment of the requirements for a Postgraduate Degree. I agree that the library of this University may make freely available for inspection. I further agree that permission for copying this research project in any manner, in whole or in part, for scholarly purposes may be granted by Larenstein Director of Research. It is understood that any copying or publication or use of this research project or parts thereof for financial gain shall not be allowed without my written permission. Recognition shall be given to me and to the University in any scholarly use which may be made of any material in my research project.
Request for permission to copy or to make other use of material in this research project in whole or part should be addressed to;
Director of Research Larenstein University of Applied Sciences Part of Wageningen UR P.O. Box 411 6708 PG, Wageningen The Netherlands

iii
ACKNOWLEDGEMENT
First of all, I would like to thank God for everything he has done for me. He has always been with me, led my path and helped me. I am grateful to the Netherlands Fellowship Programme for awarding me a fellowship to study in the Netherlands for this master course. I would like to express my heartfelt gratitude to my supervisor Dr. Bernard Gildemacher for his advice, comments, suggestions, and encouragements during my thesis. Furthermore, I would like equally to thank the coordinator of Rural Development and Food Security, Mr. Eddy Hesselink, for his guidance and kindly consideration for the whole academic year. My gratitude also extends to the staff of Van Hall Larenstein University of Applied Sciences, for their contribution towards the completion of my study. I am greatly indebted to Pastor.Farai Maphosa and his wife for their prayers and encouragements during my course. My gratitude also extends to the personnel of National Agriculture Export Development Board (NAEB) for their assistance during my data collection in Rwanda. I want to thank all my classmates who have always given me assistance during my study. Finally, I want to thank my lovely family for their continuous support of my every effort. God bless you all!!

iv
DEDICATION I dedicate this work to my beloved family, may the Almighty God Bless you.

v
TABLE OF CONTENTS PERMISSION TO USE ..........................................................................................................ii
ACKNOWLEDGEMENT ........................................................................................................ iii
DEDICATION ........................................................................................................................ iv
LIST OF TABLES ................................................................................................................ viii
LIST OF ABBREVIATIONS ................................................................................................... ix
ABSTRACT ........................................................................................................................... x
CHAPTER ONE: GENERAL INTRODUCTION ..................................................................... 1
1.0 Introduction and Background ................................................................................................... 1
1.1 Problem statement .................................................................................................................... 2
1.2 Research objective .................................................................................................................... 3
1.3 Main Research question ........................................................................................................... 3
1.3.1 Sub research questions ......................................................................................................... 3
1.4 Definition of Concepts ............................................................................................................... 3
1.5 Conceptual research frame work ............................................................................................ 3
CHAPTER TWO: LITERATURE REVIEW ............................................................................. 6
2.1. Agriculture in the Economy of Rwanda ................................................................................. 6
2.1.1. Poverty and poverty distribution ...................................................................................... 6
2.1.2. Rwanda‟s development strategy ..................................................................................... 6
2.1.3. Role of agriculture in the economy ................................................................................. 7
2.1.4 Cash and food crop production in Africa ........................................................................ 7
2.1.5 Profile of horticultural sector in Rwanda ......................................................................... 8
2.1.6 Policies on Horticultural Development ............................................................................ 8
2.1.7 Pineapple industry in Rwanda .......................................................................................... 9
2.1.8 Actors and their roles in the pineapple chain .............................................................. 10
Input suppliers................................................................................................................................. 10

vi
2.1.9 Climate in Rwanda ........................................................................................................... 11
2.1.10 Soil fertility ....................................................................................................................... 11
2.1.11 Pest and disease ............................................................................................................ 12
2.2. Farming systems and cropping patterns ............................................................................. 12
2.2.1 Decision making units ...................................................................................................... 13
2.2.2 Availability of land ............................................................................................................. 13
2.3 Pineapple production practices ............................................................................................. 14
2.3.1 Land preparation and planting; ...................................................................................... 14
2.3.2 Fertilizer application ......................................................................................................... 14
2.3.3 Mulching ............................................................................................................................. 15
2.3.4 Harvesting and marketing ............................................................................................... 15
CHAPTER 3: METHODS OF DATA COLLECTION ............................................................ 16
3.1 Research design and strategy ............................................................................................... 16
3.2 Selection of the study area ..................................................................................................... 16
3.3 Site selection ............................................................................................................................ 16
3.4 Farmer respondents and interviews ..................................................................................... 16
3.5 Focus group discussion .......................................................................................................... 17
3.6 Key Informants ......................................................................................................................... 17
3.7 Data collection .......................................................................................................................... 17
3.8 Data analysis ............................................................................................................................ 17
3.6 Limitations of the study ........................................................................................................... 20
CHAPTER FOUR: PRESENTATION AND DISCUSSION OF RESULTS ............................ 21
4.0 Introduction ............................................................................................................................... 21
4.1. Characteristics of respondents ............................................................................................. 21
4.1.2 Allocation of land by crops .............................................................................................. 21
4.1.3 Yield of pineapples per area under cultivation ............................................................. 22
4.2 Agronomical practices in pineapple production .................................................................. 22

vii
4.2.1 Land preparation and planting........................................................................................ 22
4.2.2 Mulching ............................................................................................................................. 22
4.2.3 Disease management ...................................................................................................... 23
4.2.2 Fertilizer application ......................................................................................................... 24
4.3 Constraints in pineapple production ..................................................................................... 24
4.4 Possible solution proposed by respondents ........................................................................ 26
4.5 Other livelihood activities ........................................................................................................ 27
4.6 Facilities and services to farmers .......................................................................................... 27
4.6.1 Access market .................................................................................................................. 27
4.6.2 Access to market information ......................................................................................... 30
4.6.3 Extension/Training services ............................................................................................ 31
4.6.4 Access of planting materials ........................................................................................... 32
4.7 Livelihoods outcomes (Benefits from pineapple Production) ............................................ 33
CHAPTER FIVE: CONCLUSION AND RECOMMENDATION ............................................. 34
5.1 Conclusion ................................................................................................................................ 34
5.2 Recommendations ................................................................................................................... 35
Reference ........................................................................................................................... 37

viii
LIST OF TABLES Table 1 : Constraints in pineapple production .................................. Error! Bookmark not defined.
Table 2: source of planting materials .............................................................................................. 32
LIST OF FIGURES
Figure 1: Operationalization of the concepts ................................................................................... 4
Figure 2: Pineapple production distribution in Rwanda ................................................................ 10
Figure 3: Area shares of principle crops, Rwanda, 2006 ............................................................. 13
Figure 4: Pineapple farming system in Ngoma District ................................................................ 19
Figure 5: Household‟s land repartition ............................................................................................ 21
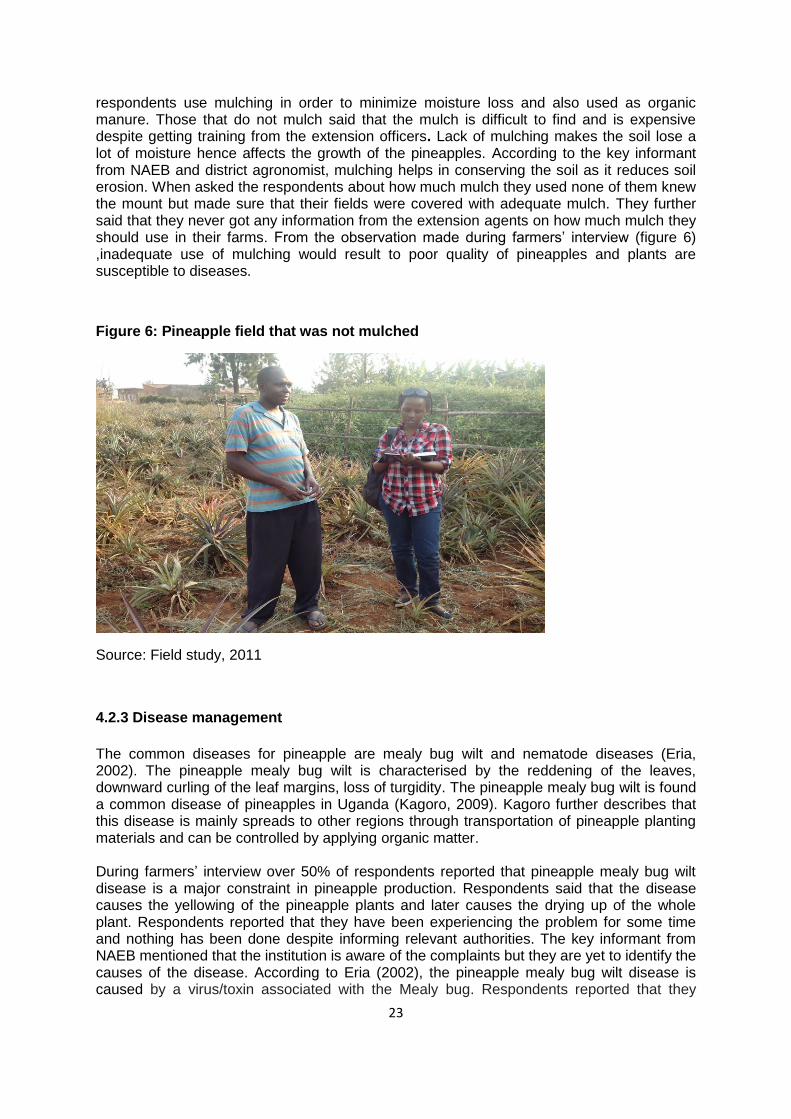
Figure 6: Pineapple field that was not mulched ............................................................................. 23
Figure 7: Constraints of the small scale farmers ........................................................................... 25
Figure 8: Possible solutions for the emerging constraints ........................................................... 26
Figure 9: Pineapple Market outlets .................................................................................................. 28
Figure 10: Sources of market information ...................................................................................... 30

ix
LIST OF ABBREVIATIONS
CPI Crop Intensification Program
DDP District Development Plan
EICV Integrated Household Living Conditions Survey
GDP Gross Domestic Product
ISAR Rwanda Agricultural Research Institute
MINAGRI Ministry of Agriculture and Animal Resources
MINECOFIN Ministry of Finance and Economic Planning
NAEB Rwanda Agriculture Export Development Board
PRSP Poverty Reduction Strategy Program
RBS Rwanda Bureau of Standards
RDB Rwanda Development Board

x
ABSTRACT Pineapple is the main crop grown by small scale farmers in Ngoma District with an average yield of 16 tons per household per year which is currently inadequate to meet the demand in the country. In addition to pineapple production farmers also grow maize, beans and keep livestock which provides them with milk and manure they use as fertilizer. This current study set out to investigate factors affecting small scale farmers in pineapple production and how can the emerging constraints be addressed in Ngoma District Eastern Province of Rwanda. To address this objective, six research questions guided the study. These questions focused on the agronomical practices used by small scale farmers in pineapple production, constraints faced by the small scale farmers and possible solutions, other livelihood activities of small scale farmers and how they influence pineapple production, facilities and services offered to small scale pineapple farmers and benefits of pineapple production to the small scale farmers. The respondents were small scale farmers who cultivated less than 2 hectares of land, an official from the INYANGE industry (Pineapple juice processing industry), Ngoma district agricultural official and a staff from NAEB. Data was collected using checklist (annex 1), questionnaires (annex 2), and observation. Secondary data was got through review of documents from the ministry of Agriculture, district development plan and pineapple production in Africa. The research found out that access to agricultural inputs was a major constraint. Farmers depend on planting materials supplied by NAEB and amount supplied to them found not enough to cover the prepared land for pineapple cultivation this result to buy other planting materials from other pineapple farmers or use the land to cultivate other crops like maize and beans which they can easily get the seeds. Lack of access to market information was found constraints to small scale farmers and these results to selling at cheap price or spoilage of pineapples. Majority of the farmers get information related to market from their neighbors of which that information is not reliable. Other means of information are radios, internet and television but these found to be expensive for farmers to use. Pineapple mealy bug disease was reported to be a constraint in pineapple production. The results of the research revealed that farmers control this disease by uprooting the infected plants but this affects the pineapple yield since they cannot replace other plants due to avoid the infection of new plants. Pineapple production still remains viable enterprise for small scale farmers in Ngoma District. The research revealed that the small scale farmers have relatively benefited compared to other crops as it constitutes 45% of land utilization of the households. However, there is need to address the constraints particularly in pineapple planting materials and disease management for better yield.

1
CHAPTER ONE: GENERAL INTRODUCTION
1.0 Introduction and Background
With reference to Millennium objectives, Rwanda has set ambitious goals for development embodied in its vision 2020. Rwanda has therefore defined its Economic Development and Poverty Reduction Strategy (EDPRS). By setting up objectives, priorities and major policies for the horizon 2008-2012, EDPRS provides a medium-term framework for achieving the country‟s long-term development aspirations as embodied in Rwanda Vision 2020, the seven year Government of Rwanda and the Millennium Development Goals (MINECOFIN, 2000).
The performance of the Rwandan economy depends mainly on the production of the primary sector, where agricultural production plays a vital role. The Rwandan economy is based predominantly on agriculture, as the sector contributes 47 % to GDP and accounts for 71 % of the country‟s export revenues. Poor performance observed in this essential sector of the economy aggravates poverty in rural areas, as agriculture is the most important source of income (MINAGRI, 2006). Hence agriculture sector was identified among the pillars of Rwanda Vision 2020 and EDPRS‟s sector of priority. The National Agricultural Policy as defined targets the transformation of subsistence agriculture as practiced in Rwanda into a market oriented and driven sector. The overall objective of the agricultural sector was to contribute, in a sustainable way, to poverty reduction and to support Rwanda economic growth through increase of productivities of production factors, maximum production development, and revenues opportunities diversification. According to EDPRS, the growth rate assigned to this sector is of 5 to 8% so as to reach its expected objectives.
In this macroeconomic but participative planning process, a Strategic Plan for Agricultural Transformation (SPAT) was defined. Its mission consisting in to ensure to Rwandan population a prosperous life and improved living conditions in a modernized and organized agriculture (MINAGRI, 2006). SPAT comprises four interrelated principal programs (and 17 sub programs), including among others the Development of Agribusiness and promotion of commodity chains. Different chains were defined and include among others horticultural chains that need intensification and development of sustainable production systems.
Blessed with high potential necessary to develop a vibrant horticulture sector and win in horticulture: climatic conditions (temperatures, rainfall, and sunshine), right soils, as well as an abundant and hardworking labour force, Rwanda has identified horticulture as priority development subsector as it is job intensive and investment attracting industry.
Currently, there has been tremendous interest and increase in horticultural crop production in Rwanda. This is as a result of high export potential for many horticultural products and awareness of Government of Rwanda and private sector, that horticulture is being considered as a key opportunity sector for supporting rural development, poverty reduction and increasing the nation‟s foreign exchange earnings. The sector is rapidly growing and possesses great potential that needs to be fully exploited for increased output and quality of horticultural produce. Indeed, Rwanda is blessed with high potential necessary to develop a vibrant horticulture sector: climatic conditions (temperature, rainfall and sunshine); fertile soils as well as abundant and hardworking labour (Oxfam, 2006).
Rwanda‟s fertile and diverse terrain offers ideal conditions for a wide range of tropical and temperate high-value fruits and vegetables; with ideal elevation, soil and climate conditions, Rwanda is able to achieve naturally high yields and quality and support year-round horticulture production. The varied climate is suited for a wide range of vegetables and temperate and tropical fruits. Indeed, Rwanda experiences cold and humid climate Ideal for European-style fruits and vegetables: beans, peas, cauliflower, mushrooms, citrus, and strawberry; warm and dry climate perfect for groundnut, sunflower and pulses. Also Rwanda

2
enjoys warm and humid climate Ideal for tropical fruits such as banana, passion fruit, and pineapple (NAEB, 2006). Pineapple ranks among the three to fruits in Rwanda after avocado and fruits banana. National annual production for the top 3 fruits is 81697t, 69226t and 31329t respectively and covering respective areas of 15620ha, 15904ha and 1961ha (Masimbe et al., 2008). Of these, pineapples generate more revenue as they yield more per unit area cultivated and earn higher prices per unit weight compared to other crops. They can provide income throughout the year even during the periods when no other crops are available for sale. In this regard, pineapple sub-sector was identified to have the potential of improving the livelihood of small scale farmers in Rwanda, as such, this sub-sector benefits support from National Agricultural Export Development Board (NAEB) and other private projects.
1.1 Problem statement
Pineapple (Ananas comosus) counts among important horticultural crop in Rwanda grown in central, east and western parts of the country. Under government initiative of “economic revolution, Pineapple has been chosen as one of the horticultural crops that are promoted in Eastern Province of Rwanda on which the living conditions of farmers of the eastern province can be improved due its good soil profile and weather requirement that favours pineapple production(Oxfam, 2006).Pineapple is one of the crops with potential to improve people‟s livelihoods owing to many advantages such as; growing on a wide range of soils, resistant to drought, less vulnerable to the infestations and is labour intensive in comparison with other crops. It was identified by the Rwanda government as the basis for the implementation of market-driven agro-business oriented rural development activities.
In spite of the fact that the pineapple sector is advanced and promoted by NAEB and other
government institutions, production remains low as there is always demand gap for
pineapples especially from the factories and urban market segments (NISR, 2009). NISR
reveals that the total pineapple production in Rwanda is 73,400 metric tons per year and this
always leaves a demand gap of about 43,000 metric tons that is always filled with imports
mainly from Uganda, Democratic Republic of Congo and Burundi. Accordingly, this implies
that despite the market prevalence and the need to increase production, pineapple
production remains low. With a focus on Ngoma District which is among the early adaptors
of the governments‟ intervention, the current study aims at investigating the factors affecting
pineapple production by small scale farmers in Ngoma District east of Rwanda.

3
1.2 Research objective
The objective of this study is to contribute to the improvement of pineapple production by
investigating the factors affecting pineapple production by small scale farmers in Ngoma
District.
1.3 Main Research question
What are the factors affecting small scale farmers in pineapple production and how can the emerging constraints be addressed?
1.3.1 Sub research questions
1. What agronomical practices are being carried out by small scale farmers in pineapple production?
2. What are the constraints faced by the small scale farmers in pineapple production? 3. What are the possible solutions for the constraints in pineapple production? 4. What other livelihood activities do small scale farmers engaged in and how do they
affect pineapple production? 5. What are the facilities/services offered to the small scale farmers in pineapple
production? 6. What are the benefits of pineapple production to the small scale farmers?
1.4 Definition of Concepts
Horticulture: For the purpose of this research, horticulture is defined to include Fruits, vegetables, flowers and ornamental plants. This study will focus on the fruits sector specifically on Pineapple production.
Small scale farmers: According Abdul (2005), small scale farmers are farmers who cultivate
using mainly family labour and for whom the farm provides the principal source of income.
These farmers are normally characterised by subsistence farming. Normally majority of
these farmers practice mixed farming where they keep livestock and poultry beside
crops and can either rely on rain-fed or irrigation. Small scale farmers normally have small
portions of land averaging 1-10hectares. For the purpose of this study, small scale farmers
will refer to those farmers in Ngoma district who cultivate pineapple on less than 5 hectares
of land.
Pineapple Production: For the purpose of this research, pineapple production would mean all the processes and methods used from planting of pineapple up to selling by farmers.
Marketing: Marketing in this context refers to how the farmers market the pineapples (including in what form, how and where to market).
1.5 Conceptual research frame work
In order to establish the sub research questions that would provide question to answer the main research question, a conceptual framework was developed.

4
Figure 1: Operationalization of the concepts
Political policies and strategies
Environment - Diseases and pests - Climate (drought, Temperature, Rainfall) - Soil and soil related constraints - Land scarcity
Socio-economic - Land availability - Access to market - Infrastructure - Access to inputs & trainings Factors - Knowledge and skills of farmers - Access to credits - Other livelihood activities - Farmers‟ organisations and networks
Technical Cultural practices - Planting
- - Fertilizer application - - Weeding - - Mulching
Agricultural research and Extension
Cultivation process (Land preparation, Planting, mulching,
Pineapple Production
Marketing - Market information
- Market outlets

5
1.6 Report structure
In total, this report is organised in five chapters. Chapter one presents the background to the study and describes the problem statement while stating the research questions that guided the study. Chapter two elaborates literature while chapter three highlights the research methodology - area, research strategy, and tools used. Chapter four presents and discusses empirical findings in line to the stated research questions. Finally, the report ends with chapter five that presents the conclusion and recommendation on way forward.

6
CHAPTER TWO: LITERATURE REVIEW
2.1. Agriculture in the Economy of Rwanda Nationally, agriculture is the most important sector in terms of contribution to GDP, employment and foreign exchange earnings. Agriculture contribution to growth is ever larger when strong multiplier effects are taken into consideration. As stated by the World bank, agriculture contributes significantly to national food self-sufficiency, as over 90% of all food consumed in the country is domestically produced (MINAGRI).
Rwanda has made a remarkable transition from genocide to peace and development. Since 1994, the government has been able to maintain overall macro stability and implement extensive reforms that have contributed to the strong growth performance observed over the past decade. Throughout most of this period, economic growth has been driven by a recovery in the agricultural sector, complemented by a construction boom during the post-conflict reconstruction phase. This growth has continued up to the present.
During the period 2002-2005, overall GDP growth averaged close to 5 % year, with low and stable inflation with average CPI ranging from 10% in 1996-98 and projected to be of 5.0 in 2008. Meanwhile, non-income indicators of well-being also have improved significantly. Primary school net enrollment now stands at 93 percent and the vaccine coverage rate for all antigens ranges from 80 to 95 percent in most provinces. On the social and political front, while the country is at now at peace and secure, Rwandans continue to deal with the legacy of genocide. Progress in regenerating the torn social, fabric and rebuilding a national sense of unity is being made through the national unity and reconciliation progress, led by the government.
2.1.1. Poverty and poverty distribution
Rwanda is one of the poorest countries in the world, with an annual income of only US$245 per capita. More than one-half of all Rwandans (52 percent) live in extreme poverty as measured by the international standard of US$1 per day in income, and more than 3 out of 4 (84 percent) live in moderate poverty of less than US$2 per day in income (World Bank, 2005). At least 60 per cent of the population lives below the national poverty line.
Poverty in Rwanda is concentrated in rural areas. Results from the most recent Rwanda Integrated household living conditions survey conducted in 1999 has shown the poverty is strongly associated with living in rural areas and with working in agriculture, whether on one‟s own farm or as a hired laborer working on a farm owned by another person. The incidence of poverty is higher in particular provinces with higher population densities.
Disaggregating the national EICV data, 14.3 percent of urban residents are classified as poor. This figure increases to 65.7 percent of rural residents, with 97.5 percent of the population lives in urban areas, 2.5 percent of these are considered as poor. The depth of poverty (the average proportion by which the poor fall below the poverty line) is also greater in rural areas (42.4 percent) than in urban areas (28.0 percent).
2.1.2. Rwanda’s development strategy
The Government‟s strategy for reducing poverty and stimulating rapid and sustainable economic growth is laid out in the PRSP and further articulated in its vision 2020 document. In these two documents, the government proposes an ambitious development program to transform Rwanda into a middle-income country by 2020. The bold targets of vision 2020

7
Include increasing per capita of the population to 25 percent, increasing life expectancy from 49 to 65 years, and increasing the literacy rate from 48 to 90 percent (MINECOFIN, 2000).
The agriculture sector is identified in the PRSP and vision 2020 as a leading engine of future economic growth. This is consistent with a wealth of global evidence showing that agriculture can play a key role during the early stages of economic development. According to vision 2020, agricultural transformation is expected to boost growth in both the formal and informal sectors, with the effect of reducing the proportion of the population dependent on agriculture from the present 87 percent to about 50 percent in 2020. In addition, because agricultural productivity is currently very low, there is considerable potential to achieve rapid income gains by increasing productivity in the short run. The government planned to increase public investment in agriculture during the primary growth phase from 2002 to 2006 and subsequently to have the private sector play a greater role in investment during the “consolidation phase” from 2006 to 2010 (Austin, J. E.,2009).
A key pillar of the agricultural development strategy is the PASTA, which was finalized in 2004 and launched in June 2006. The strategy aims to increase the incomes of the rural population by improving agricultural productivity and facilitating transformation from a subsistence economy to one that is geared to production for both domestic and export markets.
2.1.3. Role of agriculture in the economy
Agriculture features prominently in the economy of Rwanda. The agricultural sector is the most important sector in terms of contribution to GDP, employment, and foreign exchange earnings. Agriculture also contributes significantly to national food self-sufficiency, accounting for well over 90 percent of all food consumed in the country.
According to official statistics, the agricultural sector currently accounts for about 42 percent of GDP (MINECOFIN, 2002). This figure is likely an underestimate, due to the difficulty of accurately measuring the large amount of food that is produced by subsistence farmers and consumed at home. The sectorial share of agriculture in the national economy has fluctuated in recent years around a modest upward trend. Between 2001 and 2005, agricultural growth is estimated to have averaged 4.2 percent per year. While not insignificant, this rate was below the target range of 5 to 8 percent set out in the PRSP and Vision 2020 (World Bank 2006). Considerably year-to-year variability around this trend was caused mainly by climatic shocks.
In 2005, approximately 90 percent of the economically active population was employed in agriculture. Despite government efforts to encourage migration of labor out of agriculture to relieve pressure on the country‟s severely constrained land resources, agriculture remains by far the main source of employment.
2.1.4 Cash and food crop production in Africa
The advocate of an export-oriented agricultural strategy in Africa is the relationship between export crop production and food consumption. The opponents of export(cash) crop promotion anticipate such effects to be negative owing to the alleged negative impact on food production levels(Storey, 1986). The supposedly limited and uncertain foreign exchange earning capacity of Least developing countries (LDC) export crops, the claim that those who receive most of the foreign exchange benefits use them for purposes other than food imports. The advocates of export crop production claim that such production undertaken on the basis of comparative advantage to generate sufficient foreign exchange to pay for food imports.
In Rwanda majority of the rural people are all very poor people who live below the poverty line and work on small plots or produce cash crops to supplement staple production and thus

8
achieve basic food security. Cash crops make a significant contribution to smallholder households in Rwanda in as much as they are often their major source of cash income. The introduction of cash crops like Fruits, Coffee and Tea has improved the living conditions of rural farmers. However, the smallholder like coffee growers receive extremely poor returns on their production owing to inadequate processing facilities, which makes it difficult to control the quality of their output, and very low prices on the international coffee market (IFAD,2005).
2.1.5 Profile of horticultural sector in Rwanda
In 2007, Rwandan GDP was estimated at about USD 2.8 billion where the contribution of agricultural sector was 36.2%. National Agriculture Export Development Board (NAEB) estimated that horticulture contributed USD 0.15 billion to total Rwandan GDP, which represents about 5.2% (Jean, F., et al, 2008). Rwanda is blessed with a high potential necessary to develop a vibrant horticulture sector and win in Horticulture: climatic conditions (temperature, rainfall and sunshine); right soils as well as and abundant and hardworking labour. Rwanda has targeted horticulture among the priority commodity chain identified by SPAT for promotion and development, as it is a job intensive and investment attracting industry. In 2008, a study commissioned by NAEB to assess the profile of Horticultural sector gave a very clear and detailed picture of horticulture in Rwanda. Some of the findings include (Masimbe et al, 2008):
The major fruit crops in Rwanda are avocado, fruit banana, mango, Lemon, Japanese plum, pineapple, sweet orange, passion fruit and papaya. National annual production for the top 3 fruits, namely avocado, fruit banana and pineapple is 81697t, 69226t and 31329t respectively and covering areas of 15620ha, 15904ha and 1961ha respectively. About 75% of the avocados in Rwanda are produced in the Southern and Western Provinces. The Eastern, Southern and Western Provinces all together account for about 70% of the country‟s sweet banana production. The Northern and Southern provinces account for 86% of the country‟s pineapple production.
The top 3 vegetables produced in Rwanda are cabbages, tomatoes and local eggplant with national annual tonnages of 72019t, 69743t, 38068t produced from acreages of 8152ha, 5586ha and 4184ha respectively. The Northern, Western and Western provinces are the major producers in the country, together accounting for 96% of national annual production.
2.1.6 Policies on Horticultural Development
Horticultural industry in Rwanda is in its infancy. As the industry provided significant advantages to many developing countries around the world they are also many benefits to gain for Rwanda, by focusing on horticulture. Those include the poverty alleviation; export diversification and export receipts including possible foreign direct investments (MINAGRI, 2006). On the poverty alleviation front, Horticulture is one of the most job intensive industries for fruits and vegetables. In 2006, it is estimated that, the growth of employment in horticulture sees almost 6000 people involved in export oriented industry. There is a scope for horticulture to alleviate poverty in rural areas both via producer participation production activities as well as via on farm employment and value added activities. According to FAO (2001), the export line in Rwanda consists of tea and coffee as traditional export crops. The current dynamic trend within international market, justify the need for Rwanda to break away from the traditional export crops and find a more diversified palate of

9
export product, by developing a more professional, high value and export oriented horticulture industry. There is scope and room for future diversification within horticulture sector, the industry being vast with possibility to develop high value commodity chains within flowers, fruits and vegetables targets crop groups. On the export receipts side, the evidence comes out that by developing existing potential its greater diversity of products, horticulture industry is set to become a sizeable export contributor for the country; the target for high value added export horticulture products being 21 million by 2010. Horticulture is the single largest trade industry in the world, with the annual trade generating around $ 51 billion. This has been achieved by developing high value horticultural commodity chains. The contribution of horticulture to the world development by supporting the millennium goals became hence of strong evidence. The value chain approach supports several of the Millennium Development Goals (FAO, 2001). With regards to the Rwanda Horticulture action plan initiatives, Government emphasizes on the necessity of a joint public-private partnership in supporting farmers in product development (production, protection, post-harvest handling), including extension services, training technicians, skills in transformation, support in marketing; creating investments incentives and infrastructure development. The performance of the Rwandan economy depends mainly on the production of the primary sector, where agricultural production plays a vital role. Poor performance observed in this essential sector of the economy aggravates poverty in rural areas, as agriculture is the most important source of income (MINAGRI, 2004). This explains why agricultural sector was identified among the Vision 2020 pillars and EDPRS‟s sector of priority. By taking into consideration diverse challenge to the sector, a National Agricultural Policy was defined and targets the transformation of subsistence agriculture as practiced in Rwanda into a market oriented and driven sector. The implementation of that agricultural policy is performed towards the Strategic Plan for Agricultural Transformation (SPAT) as validated in 2005. Defined in accordance with the guiding principles and expressed big development orientation in Vision 2020 (specifically as regards contribution of the agricultural sector to expectations of the global objectives), EDPRS and National Agricultural Policy, that plan encompasses four programs of priority (MINAGRI, 2004):
- Intensification and development of sustainable production systems - Support to the professionalization of producers - Institutional development
In 2007, Rwanda has adopted its second Economic development and Reduction Strategy framework aimed at economic growth, Poverty reduction and Human development for 2008-2012. (EDPRS) provides a medium-term framework for achieving the country‟s long term development aspirations as embodied in Rwanda Vision 2020.
2.1.7 Pineapple industry in Rwanda
Pineapple counts amongst the three top fruits produced in Rwanda. Pineapple grows better under warm conditions with sufficient and regular rainfall. Rwanda fulfills better climate and soil conditions for pineapple optimum production (IZAMUHAYE, 2010). In Rwanda, pineapple is produced all over the country and counts amongst the three major fruits including respectively avocado and baby banana.

10
Figure 2: Pineapple production distribution in Rwanda
Source: Masimbe et al., 2008
The Northern Province is the largest pineapple producer followed with the southern province, with an annual production tonnage of MT 14823 and MT12299 (Masimbe et al., 2008) Smooth Cayenne is the most widely grown pineapple variety in Rwanda. It is the most widely available and advised by extension authorities in Rwanda. Smooth Cayenne is appreciated for its taste characterized by its excellent flavor and its high sugar and acid content. Other varieties include Queen, Red Spanish and the recently introduced MD2 which is revealed to be the most appreciated on the international market.
The pineapple farming systems are dominated by a farming structure characterized as following (Austin, 2009):
- The majority of big size pineapple (average weight: 3.5kg) better suitable for processing and represents 70% of the production
- Small quantity of small size pineapple (0.7-1.5 kg weight) rather suitable and appreciated fresh for export market. They represent approximately 20% of the total production.
- The auto consumed pineapple harvest which represent about 5% of the total production
2.1.8 Actors and their roles in the pineapple chain
The main actors in the pineapple chain are the input suppliers, producers, rural vendors,
processors, traders, retailers and consumers.
Input suppliers
Pineapple planting materials (suckers) are mainly supplied as suckers by NAEB. The
farmers who receive the planting materials have to pay back 1,5 to 2 times the amount
received. Farmers who have paid back their suckers can sell suckers on the free market.
The suckers originated from ISAR seeds‟ multiplication unit are of guaranteed quality. Others
originated from farmers‟ plantations can sometimes be infested by fungus or virus (NAEB,
2006).
Study area

11
The pineapple plantations, neither as a practice, nor as a request from the extension or
advisory agencies. Indeed, some main processors and exporters target the organic market
so it makes sense that the supporting actors consider their needs. At the present stage, the
only variety broadly spread is Cayenne smooth. Planting material for MD2 is also being
prepared and several other varieties exist in the country but they are not used in large scale.
RHODA is working with ISAR for the production of seedlings coming from tissue cultures.
Consuming
Retailing
Processing
Retailing
Production
Supplying input
Source: Author, 2011
2.1.9 Climate in Rwanda
As indicated by Rwanda Environment Authority (REMA), climate is the average prevailing weather conditions for a specific geographical region. Due to its high altitude, Rwanda enjoys a tropical temperate climate that is favourable for fruits production. The average annual temperature ranges between 16 and 20°C, without significant variations. Rainfall is abundant although it has some irregularities. With an economy heavily dependent on rain fed agriculture, climate is of particular importance (www.rema.go.rw).
2.1.10 Soil fertility
Retailers
Processors
Farmers
City markets
NAEB, Farmer’s
farms
Supermarkets Kiosks and
shops
Local Consumers
Farm gate, village
markets

12
The best soil for pineapple is a well drained and friable sandy loam soil with a pH range of 4.5-6.5. Slight acidic soil (and moderately fertile) with a pH range of 5 to 6 is considered optimum for pineapple cultivation (IZAMUHAYE, 2010). Soil fertility in Africa is under pressure as an increasing number of farmers attempt to make a living based on what the land can offer to grow plants (Eric, et al., 2007). Mentioned by Francois (2005), the density of population in mountains of Rwanda has led to delicate problems of soil protection against runoff and various types of erosion steep cultivated hill slopes.
2.1.11 Pest and disease
Pests and diseases are among the major problems that affect the production yield.
According to Eria (2009), the common disease in pineapples is “Pineapple mealy bug wilt
and nematode wilt”. Eria said that, the pineapple mealy bug wilt is characterised by the
reddening of the leaves, downward curling of the leaf margins, loss of turgidity, leaves reflex
downwards, leaf tip dieback, and the plants either recover or endure further leaf tip dieback
resulting in their death. In Uganda, the pineapple mealy bug wilt and nematode wilt have
been reported in many districts of Uganda among them is a district in east of Rwanda where
this disease (Pineapple mealy bug wilt) has found to be the most problem facing pineapple
farmers. Pineapple mealy bug wilt and nematode wilt are quickly spreading to other regions
through transportation of the pineapple planting materials (www.uce.co.ug).
Controlling of pineapple mealy bug is by applying organic matter. Soil whose nutrients are
low will always be a breeding ground for wilt which is why use of manure and artificial
fertilizers are important. Alternatively, affected plants should be uprooted to avoid the
disease spreading to neighbouring plants, to make ridges to aid in water drainage and
runoff. Good soil drainage and the use of healthy planting materials help in minimising the
spread of the diseases (FAO, 2001).
2.2. Farming systems and cropping patterns
According to FAO (2007), Agriculture in Rwanda is dominated by small-scale, subsistence-oriented family farming units. Approximately 1.4 million rural households depend on agriculture as their main livelihood source. These households produce a range of food crops (cereals, roots and tubers, bananas, Fruits and vegetables), with approximately 66 percent of production destined for home consumption. The remaining 34 percent of production finds its way to local markets. Crops are produced mainly under rainfed conditions using mostly family labor and few or no purchased inputs (improved seed, fertilizer, and crop protection chemicals). Approximately 60 percent of households also keep animals for milk, eggs, and meat. These animals, are mainly local breeds, are raised using traditional low-input extensive grazing methods, although in the case of cattle the declining availability of pasture land is causing a shift to confined feeding with cut fodder supplemented by grain and/or roots and tubers. A minority of rural households also produces export crops, the most important of which are coffee (cultivated by approximately a one third percent of all rural households) and tea (cultivated by less than 1 percent of all rural households) (FAO,2007).
Report from World Bank (2006) shows the data on area, yield, and production of major food and cash crops on the Figure 2 below. Food crops dominate the area planted, reflecting the
subsistence orientation Rwandan agriculture. In 2005, roots and tubers accounted for the largest share of total cropped area (25 percent), followed by bananas (22 percent), cereals

13
(21 percent), pulses including beans and peas (21 percent), fruits and vegetables (5 percent), and oilseeds (3 percent). Traditional export crops accounted for only 3 percent of total cropped area, including coffee (2 percent), tea (1 percent), and pyrethrum(less than 1 percent).
Figure 3: Area shares of principle crops, Rwanda, 2006
Source: World Bank, 2006.
Food crop yields in Rwanda are low by global standards. When yields in Rwanda are compared to yields in other countries, it is clear that Rwandan agriculture is facing a productivity crisis. Using FAOSTAT data to make comparisons more consistent, average yields achieved in Rwanda for most major food crops lag behind the sub-Saharan Africa averages (World Bank, 2006). The picture becomes even depressing when yields achieved in Rwanda are compared to the averages in neighboring countries such as Burundi and Uganda, which arguably provide better standards for comparison because they feature more similar production environments.
2.2.1 Decision making units
The decision making unit of the farmers is made by the farmers themselves in the household. Man and woman in the household decide what to grow in which season and the various factors have to be considered such as land size, inputs, labor and social status of the household (Masimbe, 2008).The head of the household controls (man) the resources and is the one decides what to do with the money. Women and children have access to resources but have no control over them.
2.2.2 Availability of land
Land is a major resource in agricultural production. As cited by MINAGRI (2010), high population growth density in Rwanda has caused the shortage of arable land and led to the decreasing of farm size and this resulted to the adoption of intensive agricultural practices hence declining of soil fertility. More so, land shortage has increased pressure on the ecosystems and this affected the declining of pineapple productivity. The land is important in agricultural production and the potentials for expanding the land area are typically very small.

14
2.2.3 Extension services in Rwanda
Education is a key factor in development. The major constraint in Rwanda is the ineffectiveness of the extension system. The extension agents have weak links to the research service; often do not have sufficient means of moving about the countryside, and generally lack knowledge on more specialised topics. They also have a message‐oriented, top‐down framework for working and have not developed strong skills as facilitators of the farmers‟ own processes of knowledge acquisition. Also, there are too few women extension agents. The process of linking District extension agents with specialised sources of knowledge is not well developed.
2.3 Pineapple production practices
This section describes the practices used in pineapple production and their effects to the
pineapple yield.
2.3.1 Land preparation and planting;
It is recommended that, where cultivation is to be done for the first time, on forested new
lands, the slash and burn method of land clearing could be used. This method has the
advantage of releasing nutrients to the soil, and destroys or reduces weeds and ants nests
in the fields. Following this clearing, certain options are on newly acquired area, land
preparation would involve clearing, uprooting of stumps and preparation of ground for
planting. The large mass of plant residues that is produced as a result of the land
preparation could serve as a good mulching material and organic fertilizer for the soil (NARI,
1999).
The best time of planting pineapple in Rwanda is early short rain season (September, October) to allow the pineapple plants to get sufficient water (Twarster. R., 2008). It is also possible to plant pineapple plants in the heavy rain season (March, April), but they will soon face the drought period and water scarcity that will affect the growth of pineapples. Suckers are planted in hole of 8-10 cm deep. After planting, it is recommended to add fertilizers (for example Farmyard manure) and mulching before the flowering of the plant. Irrigation of pineapple could be done immediately after planting, but in Rwanda pineapple is mainly grown under rained conditions. In planting, pineapple suckers and tops are the two main kinds of planting materials. For the situation of Rwanda, farmers normally use suckers are for planting (ISAR, 2001). Plantation is done on ridges or on flat land. During planting, spacing is done to improve productivity and maximize the yield. ISAR further recommends the density for planting should be: 60cm, 45cm, 40, 30cm (between rows) x 30 cm (between plants) x 90 cm (between adjacent beds) for respectively 44000, 49000, 51300, 55500 plants for local market and processing purposes. Produced for export purposes, the pineapple planting density will be high since the number of row increases to 3 or 4.In this case, most of the time the distance between two row ranges from 40cm to 30 cm, while the distance between to pineapple plant on the row varies from 30 to 25 cm ranges from 40cm to 30 cm, while the distance between to pineapple plant on the row varies from 30 to 25 cm.
2.3.2 Fertilizer application
Nitrogen and potassium are the most important fertilizing substances in the cultivation of
pineapple (Yeboah, G., 2005).The fertilizer application is done at planting time and later on,
using either organic manure or chemical fertilizer. In Rwanda, organic manure is mainly used
in fruits production. Farmers are recommended to use well decomposed farmyard manure

15
and apply at planting time pineapples at a rate of 16tons per hectare or approximately 350-
400 grams per pineapple plant and even more depending to the soil status. The farmyard
manure should be applied twice a year (ISAR, 2001). A report form ISAR indicates that very
few farmers in Rwanda who are able to apply the right quantity of fertilizers and this is
because the manure from their livestock is not enough to cover the farm.
2.3.3 Mulching Mulching of pineapples is mainly done after planting. Pineapple plants share mulched with
slow decomposition and clean glasses or other material (wood chips, bark, grasses, etc.).
Mulching pineapple helps to retain moisture, reduce weeds problem next to the plant and
improves the soil near the surface. Ideally a 5 to 15 cm layer of mulch is kept 20 to 30 cm
from the base of the plant. In most highly specialized commercial pineapple plantations,
black polyethylene plastic sheets are used as mulch. They serve to suppress weed growth
among closely spaced plants (NARI, 1999).
According to Diao (2006), pineapple weeding is done manually weeding. Weeding of
pineapple fields is difficult and expensive because pineapples are thorny in nature therefore
it requires protective clothing. The use of paper or plastic mulch and timely application of
approved herbicides are the best means of preventing weed competition with the pineapple
crop. As for Rwanda, pineapple production is done by small scale farmers where using the
protective clothes and plastic mulch is a constraint. More to this, because most of the
pineapple growing areas are hilly, the use of paper or plastic mulch would not be applicable.
2.3.4 Harvesting and marketing
Harvesting of pineapples is done by hand. The first harvest takes place after 18 months,
then a second after another 15 to 18 months (NARI, 1999). After harvesting, pineapples are
immediately taken to the markets. The major market outlets of pineapples in Rwanda are
processing industries, farm gates, restaurants, hotels, urban and village markets. The
estimated price at farm gate is 50-70Rwf per kilogram. While the price at urban markets and
processing industries is 100-120Rwf per kilogram (Masimbe, 2008).

16
CHAPTER 3: METHODS OF DATA COLLECTION This chapter highlights the overall methodology that this research adopted. In particular it highlights the following; the research strategy, study area, site selection, sampling procedure used, methods of primary and secondary data collection and how the collected data was analysed. 3.1 Research design and strategy The research involved a qualitative approach using a case study strategy on twenty (20) respondents. A case study is the collection and presentation of detailed information about a particular participant or small group, frequently including the accounts of subjects themselves. It is the method used to look intensely at an individual or small participant pool, drawing conclusions only about that participant or group and only in that specific context (Yin, 1994). This method was adopted in order to have in-depth information on the factors affecting pineapple production by small scale farmers. 3.2 Selection of the study area The study was carried out in Ngoma district in eastern Rwanda. Its geographical location is about 150km away from Kigali city. The district is divided into fourteen sectors and has approximately population of 68,000 people. More than 90% of its population depends on subsistence agriculture and livestock keeping for their living with the majority of the population live in villages. It covers an estimated of 738 Km2. The district is composed of hills and slopes whose altitude varies between 1400 and 1700 m. The annual distribution of rainfall throughout the district is between 800 and 1000 mm of rain and the average annual temperature is between 21 and 22 ° C. The months of March and April being the wettest months (DDP, 2006). Under the initiative of economic revolution, the government of Rwanda selected pineapple as one of the horticultural crops to be promoted in Ngoma district eastern province due its soil profile and weather requirement, on which the living conditions of farmers can be improved. It is due this background that, Ngoma district was selected as a research study area. 3.3 Site selection Pineapple is grown in fourteen (14) sectors of Ngoma district. Out of 14 sectors that grow pineapples in Ngoma district, the 2 sectors were selected based on their locations; Sake (near the main road) and Murama (far away from the main road).
3.4 Farmer respondents and interviews
Random sampling was used to select 20 respondents who grow pineapples from 2 sectors. In each sector, 2 neighbouring villages were randomly sampled. In each village 5 respondents were randomly sampled from the list of pineapple growers in Ngoma District for interviews. The interview was conducted using self-administered questionnaires as a tool annex 1). Field visits were also made in which the farmers were visited and interviewed from their respective homes for the maximum time of 1 hour per respondent. A researcher was able to observe on-farm activities that the small scale farmers engaged in as well as the farm practices used in pineapple production.

17
3.5 Focus group discussion
Two focus group discussions consisting of 5 individual respondents per group from the 20 individual farmers were carried out using a checklist (annex 2). This was to get more
Information that would have not been given out through individual farmers‟ interviews. The focus group involved both women and men and took the maximum time of 2 hours.
3.6 Key Informants
A total of three (3) Key informants who are stakeholders of pineapple production were purposely selected for self-administered interviews using a checklist (see annex 2). The respondents were categorized as follows; One staff from NAEB in charge of fruits production was interviewed in order to have information on the facilities and services given to small scale farmers in Pineapple production. One (1) official, in charge of supply chain and farmers‟ mobilisation in INYANGE industry. The industry was selected because it was the main buyer of pineapples from the farmers of Ngoma district for Juice processing, this aimed at getting information on the price, quality of pineapples supplied to the industry as well as the problems facing in the supply chain. Another key informant was an agronomist from Ngoma district. The aim of selecting him was to have information on the extension services and other services given to the pineapple small scale farmers. The interview with the key informants took two days.
3.7 Data collection
Data was obtained through primary and secondary study. Primary data was collected from respondents in the study area and the key informants using self-administered semi structured questionnaire and a checklist. Secondary information was obtained through desk research and internet search in order to develop the conceptual framework as well as be able to compare the information obtained from the primary data sources. Study materials included reading books, reports, journals, articles and unpublished documents from working place. The reference books were obtained from the Wageningen University and Research (WUR) Library either digitally or by visiting the library Journals and articles were accessed from the WUR digital library where Google scholar were used to search for the relevant articles that could provide information on the factors affecting pineapple production by small scale
3.8 Data analysis
The data collected from the respondents were analysed qualitatively with a descriptive summary based on the results obtained by the research. Other data on household size, land size, educational level of the household and land size under pineapple production were calculated using excel.

18
In order to understand the factors affecting pineapple production by small scale farmers in Ngoma district, the farming system model was used. The tool has been chosen because it helps bring out the various factors that are considered by the farmer in pineapple production. Using the farming system model; inputs, outputs, process and decision making which are internal factors to the farmer were analysed then physical and institutional environment which are external factors to the farmer were also analysed in relation to the pineapple production as shown in figure 4 below.

19
Figure 4: Pineapple farming system in Ngoma District
DECISION MAKING UNIT
Objective: Production of Pineapples or other crops; cash or food crops
Decisions are made by head of household (man or woman ),age, available
land
INPUTS
Labor from members of
household
Land (size; average 0.5-
4.0 ha), water from rain,
wells and taps, planting
materials
Capital- start -up capital
from pineapple sales
PROCESS
Main activities
Pineapple Production Farm Practices: land preparation, planting, Mulching, marketing, disease and soil management Other on-farm activities: Maize, beans, cattle and goats rearing Off-farm activities: running shops
OUTPUT
Money from
pineapple
sales and
shop
Maize
Beans
Milk
Manure from
cows and
goats
INSTITUTIONAL
ENVIRONMENT
Ministry of
agriculture
NAEB
Research
institution
(ISAR)
Inyange
Industry
RDB
RBS
Local
authorities
PHYSICAL
ENVIRONMENT
Roads
Climate
Farms
Topography

20
3.6 Limitations of the study
The study was limited by less availability of the key informants who were occupied by the office work hence made the interview to take more time than had planned by the researcher. The study found it difficult to get reliable figures related to pineapple yield, quantity of the fertilizer and mulches used by the farmers. This calls further research to support the findings and recommendations of this study.

21
CHAPTER FOUR: PRESENTATION AND DISCUSSION OF RESULTS
4.0 Introduction
This chapter presents and discusses results of the current study. The discussion aimed at investigating the factors affecting pineapple production by small scale farmers in Ngoma District east of Rwanda and how the emerging constraints can be addressed. The sections of this chapter are organised based on the five research questions described in chapter one. Section 4.1 explains the characteristics of the households, Section 4.2 describes the agronomical practices used by the farmers in pineapple production and how these influence the pineapple production. Section 4.3 explains the constraints faced by the small scale farmers. Section 4.4 describes the possible solutions for the constraints. Section 4.5 discusses other livelihood activities of small scale farmers and how they affect pineapple production. Section 4.6 describes facilities and services offered to the small scale farmers in pineapple production and lastly section 4.7 discusses the benefits of pineapple production to the small scale farmers.
4.1. Characteristics of respondents
In this research, Majority of the respondents (13) were male while the rest (7) were women. Out of 20 respondents, more than half (65%) have attained only primary level and the rest (35%) did not attain any formal education. Of the total number of respondents, 85% were aged between 30-45 years while the rest 15% were aged above 45 years.
On the household size, over 80% respondents had over 5 members in each household and rest had four members in household.
4.1.2 Allocation of land by crops
Figure 5: Household‟s land repartition
Source: Field study, 2011
The figure above shows the repartition of land according to crops grown by interviewed farmers. Indeed, more than half (55%) of land owned by the totality of farmers interviewed is allocated to food crops (beans and maize) while the remaining part of land (45%) is allocated to pineapple cultivation.

22
4.1.3 Yield of pineapples per area under cultivation
The total estimated land (20.25 hectares) under pineapple production which is equivalent to
45% of the total land of the interviewed farmers provides 324 tons per year (16ton/ha). The
fact given that the information given by respondents was not reliable to calculate the yield
per hectare, the above mentioned figure on yield was calculated based on existing
information on annual pineapple yield in Rwanda (section 2.1.4 of this document).
4.2 Agronomical practices in pineapple production
Agronomical practices in pineapple production by small scale farmers have big influence in pineapple yield. The following practices were highlighted during focus group discussion and in farmers‟ interview; land preparation, planting, mulching, pests and disease management and soil erosion control. Majority of the farmers mentioned that these practices are mostly done by human labour from the household and this was supported by the observation carried out during research. 4.2.1 Land preparation and planting Where cultivation is to be done for the first time, on forested new lands, the slash and burn method of land clearing could be used. This method has the advantage of releasing nutrients to the soil, and destroys or reduces weeds and ants nests in the fields (NARI, 1999). Majority of the respondents said that they prepared land by using hoes and slashes. During the time of planting, about three quarters of the respondents make ridges (anti erosion ditches). These are usually made horizontally to the flow of running water. The purpose is to minimize soil erosion. This practice is good because it reduces the washing away of the soil particles thus reducing land degradation. According to Rukundo (2010), making ridges is one way of crop management by controlling soil erosion on hilly areas. The rest of the respondents do not make ridges but they just plant on flat area (scattered soils). This is because they want to have enough space so that more pineapples are planted. This practice of planting on flat space can be said to be not good because it increases soil erosion knowing that the area under study area is hilly. Again this practice does not leave enough space to maneuver between the plants to carry out farm activities like weeding and harvesting which can lead to damages of the plants.
After land preparation farmers plant the suckers by using spacing of 30cm between pineapple plants and 50cm between the rows. The respondents use this spacing because it was recommended by extension officers from the ministry of agriculture. This spacing was also verified from key informant whom mentioned that it allows the farmers to have better production. However, 30% of the respondents do not use the recommended spacing as they use spacing much smaller in order to have a high plant population. This kind of practice does not help achieve good production because plants are closely spaced hence this increases competition in terms of nutrients.
4.2.2 Mulching
Kleeman 2003, defines mulching as the practice of covering the soil to retain moisture, reduce erosion provide nutrients and suppress weeds. The research has revealed that 65% of the respondents mulched their pineapple farms with grasses and banana leaves. The
23
respondents use mulching in order to minimize moisture loss and also used as organic manure. Those that do not mulch said that the mulch is difficult to find and is expensive despite getting training from the extension officers. Lack of mulching makes the soil lose a lot of moisture hence affects the growth of the pineapples. According to the key informant from NAEB and district agronomist, mulching helps in conserving the soil as it reduces soil erosion. When asked the respondents about how much mulch they used none of them knew the mount but made sure that their fields were covered with adequate mulch. They further said that they never got any information from the extension agents on how much mulch they should use in their farms. From the observation made during farmers‟ interview (figure 6) ,inadequate use of mulching would result to poor quality of pineapples and plants are susceptible to diseases.
Figure 6: Pineapple field that was not mulched
Source: Field study, 2011
4.2.3 Disease management
The common diseases for pineapple are mealy bug wilt and nematode diseases (Eria, 2002). The pineapple mealy bug wilt is characterised by the reddening of the leaves, downward curling of the leaf margins, loss of turgidity. The pineapple mealy bug wilt is found a common disease of pineapples in Uganda (Kagoro, 2009). Kagoro further describes that this disease is mainly spreads to other regions through transportation of pineapple planting materials and can be controlled by applying organic matter. During farmers‟ interview over 50% of respondents reported that pineapple mealy bug wilt disease is a major constraint in pineapple production. Respondents said that the disease causes the yellowing of the pineapple plants and later causes the drying up of the whole plant. Respondents reported that they have been experiencing the problem for some time and nothing has been done despite informing relevant authorities. The key informant from NAEB mentioned that the institution is aware of the complaints but they are yet to identify the causes of the disease. According to Eria (2002), the pineapple mealy bug wilt disease is caused by a virus/toxin associated with the Mealy bug. Respondents reported that they
24
control this disease by uprooting the infected plants and put them in the pits, but this leaves some gaps in the field since there no other plants that can be planted there in to avoid the infection of new plants hence affects the pineapple yields. This approach to control the disease has also been observed by NARI (1999) and in addition suggested that this disease can also be further controlled by early treatment of healthy suckers before planting and eradication of ants associated with the mealy bug. Since this is found to be a problem to most of the farmers, there is an urgent intervention of the government to solve this problem because it affects pineapple production as it was mentioned by the majority of the respondents.
4.2.2 Fertilizer application
For the plants to grow and have high yield, they require fertilizers. There are two kinds of fertilizers; Inorganic and organic fertilizer. As cited by Suah (2005), aapplication of fertilizers is an important component of agricultural system. A nitrogenous fertilizer is essential for the increase of fruit size; this had been proved by fertilizer trials in Kenya. Application of nitrogen helps plant foliage to grow strong.
Williams (1998) describes Inorganic fertilizer as synthetic or artificial fertilizers that are manufactured from non-living materials while organic fertilizers are made from materials derived from living things like animals. In this study none of the respondents found using inorganic fertilizer. One of the reasons to why the farmers did not use inorganic fertilizer was that the fertilizer was expensive and farmers could not afford to buy. As it was highlighted above by Merrill that inorganic fertilizer increases the yield, however, AgroECO bring out the disadvantage of inorganic fertilizer being costly and when there is heavy application of inorganic fertilizers can burn seedlings and young plants hence reduce production. Fourteen respondents said that they only use manure fertilizer (organic fertilizer) because it is easily available on or near their farms at very little or no cost other than labor costs of handling and transportation. Of all the respondents that used animal manure, each one of them applied less than 5tons per hectare. However, key informant from district recommended 15tons per hectare of pineapple cultivation. This means that farmers were not applying the right quantity of manure which would not help in improving their production.
The use of animal manure (organic fertilizer) is good for soil fertility and pineapple production. This is also recommended by Shield, 2007 who says animal manure is sustainable renewable energy resources. He also emphasized on the need for farmers to use organic fertilizer since it increases the production. Thirty percent of the respondents did not use any fertilizer claiming that soil is already fertile hence there is no need to apply any fertilizer others said that they could not afford to buy both inorganic and organic fertilizers. Although these farmers said the soil was fertile, the continuous cultivation of the land without using enough fertilizers leads to the loss of soil fertility hence decrease in yield and also poor application of fertilizers like not applying fertilizers at a right time also contributes to the decrease of pineapple yield.
4.3 Constraints in pineapple production
The following constraints in pineapple production were identified by farmers during interview.

25
Figure 7: Constraints of the small scale farmers
Source: Field Study, 2011
The above figure shows the constraints facing pineapple production by small scale farmers in the study area. Discussions with the focus group members and individual respondents revealed the most problem that they had was inadequate planting materials. Farmers said that they cannot get enough planting material that would plant their whole prepared land for pineapple production hence they have to buy other planting materials from other farmers which are mostly infected by diseases. This was reported by 100% respondents during individual interview with the farmers. Definitely if the pineapple sector was to perform to every ones expectation the availability of enough and good planting materials would be considered as a starting point as this ultimately has an impact on the quality and yield of pineapple. Coupled with the above constraint is the pineapple disease which was found to be caused by unhealthy (diseased) planting materials and poor farming practices. This was mentioned by 80% respondents as the second constraint of small scale farmers which has resulted in decrease of pineapple yield. This was followed by insufficient land for pineapple production. This constraint was mentioned by 65% respondents. This was emphasised during the focussed group discussions where farmers explained that adequate land is needed if they are to realise enough yield as growing smaller land provides inadequate yield for the market. However, this does not always mean that growing on big plot of land gives high yield. There are other several factors that contribute to the high production like efficient use of inputs and proper crop management.
The study also showed that little access of credit facilities is a constraint to small scale famers of pineapple. Ten per cent of respondents reported that Loans provided require big securities and high interest that small scale farmers cannot afford. It is easy for large scale farmers who have bigger pieces of land and other securities to get these loans. This has resulted in the farmers‟ failure to increase their production due to lack of better farming implements for the pineapples. Farmers would need small credits that require small loan

26
securities as this was found to be the constraint that limit farmers to put more investment in pineapple production.
High transport costs and poor roads (feeder roads) from the farms to the main roads made it difficult for the farmers to sell their pineapples and resorted to selling at farm gates cheaply. This was mostly revealed by the respondents whose farms are in hilly areas and in villages far from the main roads and market places. Transportation of pineapples by these farmers to the market is extremely difficult as most of these farmers use heads and bicycles as their main transport means. Also retailers with the vehicles prefer to buy pineapples from the farms that are near the roads avoiding going in villages far from main roads fearing the risks incurring high transport costs and fear of their vehicles to get stuck in the hills. Lastly is the lack of adequate market information (described in 4.6.2 of this document).
4.4 Possible solution proposed by respondents
The respondents proposed the following solutions to address the emerging constraints in pineapple production. Figure 8: Possible solutions for the emerging constraints
Source: Field study 2011
The figure above presents the possible solutions identified by the respondents for the emerging constraints in pineapple production. Increasing quantity and quality of planting materials was reported by 100% of the respondents as the possible solution to inadequate quantity and quality of planting materials. The quantity of planting materials (suckers) was found as a major constraint to farmers as described in section 4.3 of this document. Regarding the quality of planting materials, majority of the suckers sourced from other farmers‟ fields are of poor quality (diseased plants). Indeed good quality and quantity of planting material contributes to the yield of pineapple.
Availability of low interest credits was proposed by 85 % of respondents as a solution to limited access of credits. Limited access to credits prevents farmers from buying inputs for pineapple production, hence the yield is reduced.
The study has found out that repairing of feeder roads would be a solution to a poor transport of pineapples to the market by small scale farmers living in remote areas; this was reported by 65% respondents. This statement was supported by different views of farmers
A. Increasing quantity
and quality of planting materials
B. Availability of low
interest credits C. Maintaining feeder roads D. Reinforcing Land use consolidation E. Radio programs

27
during focus group discussion as well as opinion from a key informant (NAEB). Actually good roads play a key role in marketing therefore repairing and maintaining of roads is necessary to facilitate easy transport of pineapples to the market.
It was found out that land use consolidation would contribute in addressing the constraint of limited land as mentioned by 55% respondents. This information compares well with the views from key informant from Ngoma district. The land use consolidation is defined as merging of small plots of land in order to promote efficient and sustainable use of land resources (MINAGRI, 2010). Despite the fact that majority of small scale farmers grow pineapples on small plots of land, land use consolidation would facilitate them to collect their produce together in order to negotiate for the market.
The study showed that radio programs which mentioned by 55% respondents as cheap means of accessing market information. However this way of accessing information do not provide details needed by the farmers (section 4.3)
4.5 Other livelihood activities
The findings of the research show that majority of respondents did pineapple farming as the main source of income. However farmers did not grow pineapples only but had other livelihood activities like rearing of cattle and goats and growing of beans and maize which take small part of the total land of the household .In addition to the farming few farmers were found owning small grocery shops. Alternative livelihood sources helped the farmers not to be over dependent on pineapple farming as this dependence can be considered risky due to lack of a guaranteed market for them. Although having other sources of livelihood would mean that farmers have little time to attend to pineapple production, but the positive side of this was that farmers would use these resources like animal manure fertilization and residues from maize and beans for mulching of pineapple farms. This was confirmed by most of the respondents who said that they spend much of their time in pineapple production since they have to sell and get school fees for their children.
4.6 Facilities and services to farmers
Facilities and services in this research referred to the support rendered to small-scale farmers in order to facilitate pineapple production. Among those facilities and services mentioned in this study are; market and market information access, extension/training services and supply of planting materials.
4.6.1 Access market
Access to market is important for the farmers to sell their produce within the short period of time to minimise the losses arising from the perishability of the pineapples. According to Der Meer (2004), Pineapples must be marketed within the shortest period of 2 days after harvest after which they would get spoiled. During individual farmers‟ interview and focus group discussion farmers mentioned the following market outlets where they sell their pineapples; village markets, INYANGE Industry, farm gate and retail market (as in figure 9 below).

28
Figure 9: Pineapple Market outlets
Source: Field study 2011
4.6.1.1 Village market
The study found out that the village market is the major market outlet of pineapples for small scale farmers in Ngoma district; this was reported by 85% of the respondents during farmers‟ interview. The village market was understood by the researcher as the open market in rural areas where farmers sell their produce which takes place twice a week. Although village market is the major market outlet for most of the farmers, it was found out that the quantity of pineapples sold at this market is low because of limited buyers of pineapples in the village. Due to the fact that rural people have little resources, they use the little money they have to buy food for home consumption and this result to the spoilage of pineapples by farmers. However respondents reported that this market outlet helps farmers to sell some pineapples and get some money since the market takes place twice a week and farmers have guarantee for the market.
The respondents argued NAEB and Ministry of agriculture to provide the means of processing and preserving (cooling facilities) of unsold pineapples for future market. This is however not possible in the short term as there are a lot of farmers who would need these facilities hence difficult for the Ministry to provide. However the key informant from NAEB explained that in partnership with local governments they are in the process of establishing collection centres in every sector of Ngoma district where farmers can collect and keep their Pineapples as they wait for the buyers. These collection centres will be having cooling facilities and this will be intended to minimise losses and safe storage. Despite this being a good initiative, it will be costly to some farmers who are far from such a facility as transport cost will be high thus they will be reluctant to take their produce there. Therefore they should be facilitation in transport of pineapples by repairing feeder roads that hinder farmers from transporting pineapples.

29
4.6.1.2 INYANGE – Farmers Pineapple Chain Management
Over the half of the respondents (65%) reported that they sell their pineapples to INYANGE Industry. This was reported by respondents who are in farmers‟ association who sell their pineapples to INYANGE industry under contract arrangement. The respondents reported that pineapples are collected and transported to the industry in hired vehicles. Respondents said that they sell their pineapples to Industry at the price of 120Rfw/Kg; this includes the transport cost incurred by the farmers.
A key informant from INYANGE Industry reported that they source pineapples from different farmers in Ngoma District because the pineapples supplied by interviewed farmers are not enough for juice processing (48tons/week are required), He further mentioned that when the pineapples supplied are not enough, the industry buys more from Uganda in order for the industry to continue processing. Once the pineapples are delivered by small scale farmers, the staffs from INYANGE industry check the quality of the pineapple before the payment is be made and when they find the quality is not good, the pineapples are rejected and farmers take them back. Majority of the respondents complained that the industry does not follow the contract made between farmers and industry.
The main complaint was that the industry does not buy the pineapples regularly (weekly) as stated in the contract. The key informant from INYANGE Industry confirmed that they had temporary reduced the purchases due to the poor quality of the pineapples which led to the rejection of the pineapples. The source of concern for the industry is that farmers supply pineapples that are either damaged, not well ripened as industry recommends well ripe pineapples (3/4) for processing or they are too ripened to be used for processing. Another constraint reported by the key informant from INYANGE industry was that farmers do not deliver the right quantity of pineapples as agreed in the contract and this is due to the farmers who sell at farm gate when there is immediate need of money and this reduced the quantity to be supplied to the industry. The rejection of pineapples by industry led a loss to farmers since they did not have immediate alternative markets and end up selling them cheaply (50Rfw/kg) compared to what INYANGE offers (120Rfw/kg).
From the observation made, it was found out that farmers were affecting their pineapples quality through poor loading of the fruits on the trucks as they were just thrown on the trucks and were overloaded. On the ripening of the pineapples, it was observed that the farmers mixed the pineapples that were not ripened; the medium ripened and too ripened although the medium ripened were the majority. In the same thought on quality, the key informant from NAEB added on the quality attributes of the pineapple is the size, taste, color, freshness and amount of juice produced and all these were trained to farmers in order to comply the market requirements.
4.6.1.3 Farm gate market
The farm gate market was defined as the selling of pineapples from the fields. 55% of the respondents said that they sell pineapples at the farm gate. The problem observed with selling at farm gate was that the pineapples are sold at cheap price (50Rfrw/kg) compared to other market outlets where pineapples are sold at 100Rfrw/kg and in addition, very few buyers were able to buy from the farm gate due to poor feeder roads going to the farms unlike the farmers who are near the roads, the travellers especially people from urban who pass by their farms and buy their pineapples. However these buyers are not reliable as they are not always passing there. However, respondents reported that selling at the farm gate does not incur transport cost where farmers have to transport their pineapples to the markets which is more expensive to most of the farmers. Another advantage was that farmers are able to get money for the immediate needs of the household.

30
4.6.1.4 Retail market
The last market outlet for pineapples mentioned was retail market this includes supermarkets, restraunts, schools and in small shops (kiosks). The research revealed that 40% respondents sell their pineapples to farm gate and retail market. Respondents mentioned that the transport of pineapples is arranged by farmers to the market outlets mentioned above. This was found more costly for small scale farmers however retailers sometimes collect pineapples from the points where farmers have gathered pineapples and this facilitates farmers in transport. This market outlet farmer found it better than the one of village and farm gate because farmers are able to sell their pineapples anytime they have pineapples to sell.
4.6.2 Access to market information
Regarding market information, research showed Information on the markets and the price of pineapples is accessed through; neighbours, radios, televisions, internets and ministry of agriculture agency stations. The respondents ranked the sources of market information as shown in the table below. Figure 10: Sources of market information
Source: Field study, 2011 The major source of market information is through neighbours and friends. Farmers use this kind of source because is cheap and fast to access. This can be considered to be good owing to it being cheap and easy to access however farmers cannot rely on this information source because it is not always reliable as some are deceived or given wrong information. Most of the respondents explained that information gotten from the neighbours and friends only get to them after they have already sold their (neighbours and friends) produce. This makes farmers unable to sell their produce or sell them to others cheaply. The other market information source which the respondents ranked second is Radio. These are easily accessed. The respondents found this information source reliable as they are able to get the actual prices and the markets. However, the frequency of this information is low as
31
the most of these farmers miss this information and they are not frequently repeated and information sometimes is not detailed. Another drawback of this source of information is that some farmers have no radios (Eugene, 2011). Trainings and workshops were ranked third by the respondents. The farmers are normally given the information about the markets during trainings and workshop conducted by NAEB. This form of disseminating market information is not good for some farmers as these trainings and workshops are not held regularly. As one respondent mentioned that these trainings and workshops are held on average once in two months. These trainings are not the best source of information because prices changes on daily basis and not all farmers attend these trainings and workshops in order to get this information The fourth source of market information according to the ranking of respondents as figure 10 above shows was television. Although this source is used for disseminating market information very few respondents said they were not using this source because it is expensive to access. This was also brought up in focus group discussion. Using this method to disseminate market information would be said to be ineffective to rural farmers as the majority of them miss out the information. It would only be effective for people leaving in urban areas. The least ranked market information source was the internet. The ministry of agriculture has set up a market Information system (MIS) where farmers can access the information using the internet. This was established to facilitate rural farmers to access information related to market and price. An MIS is one way of providing market information and according to wikianswers (n.d) this provides quick supply information and if properly designed MIS supplies reliable and relevant information. The fact that the internet centres (internet cafe) are located in the centre of the district, farmers have to travel for a long distance to access market information through internet. This mostly mentioned by most of the respondents who stay in the village, far from the centres. Other respondents who are near the centres gave the reason of not using this system that it is difficult for them to use computers since most of them are computer illiterates. From the focus group discussions farmers confessed that they have never used these internet centres because of the high cost of accessing internet services. As observed from the discussions with the individual respondents and focus group members, high cost of internet services and location of these centres render the MIS set up by the ministry of agriculture not effective for pineapple farmers in accessing market information.
4.6.3 Extension/Training services
Ban and Hawkins, 1996, describes extension as an educational activity with the goal of ensuring increased agricultural production that is achieved through the process of helping the people make informed decisions and choosing from the alternative solutions to their problems. The research has reviewed that the majority of the members in the focus group and 85% of the individual respondents received extension services. These services are provided by NAEB and ISAR under the ministry of agriculture and RDB. Farmers said that the services received from NAEB were on production technics and quality compliance. Also ISAR provides training on pineapple cultivar propagation and multiplication by selecting few farmers to train who will in turn train others. However the majority of the respondents do not get trainings from the trained farmers because ISAR only trains small number. The respondents also mentioned that they get trainings on small business enterprises from Rwanda Development Board (RDB) that include pineapple processing but the farmers do not implement what they are taught. The possible explanations why farmers do not implement what they are taught is that they lack resources like finance and equipment that can be used
32
to process their produce. The problem with this is that the farmers will still possess the learned skills but will not help them improve their production.
With regard to training, the general observation from individual interviews was that most women do not attend the trainings. When there is selection for training, only men are selected from the household for training, because they are heads of the households and they own the farms (farms registered under men‟s name in the household). This would be described to be unfair as it would affect the production since when it comes to pineapple cultivation men and women all participate.
4.6.4 Access of planting materials
This section describes where small scale farmers source the pineapple planting materials
Table 1: source of planting materials
Source Number of respondents(N=20)
Percentage (%)
NAEB 11 55
Other farmers‟ field
4 20
Own fields 5 25
Source: Field study 2011
The planting materials that are used are suckers and all the respondents used this for planting. The source were NAEB, other pineapple farmers and from farmers‟ own field as indicated in the table below. Over half of the respondents collected the suckers from NAEB. Farmers have to first apply through NAEB. It was indicated that, NAEB contracts with certified seed production companies for better quality seeds. Thereafter, applicants are visited by officers from NAEB to check if they have prepared the land according to the standards of pineapple production provided by the same institution. The farmers supplied with the suckers have to pay back twice of the seedlings they have got. And these suckers are supplied to other farmers. However farmers are not satisfied with the quantity of the suckers supplied as they considered them to be little. Respondents were also not happy with the variety (MD2) meant for export market which they said was not good for local market instead they preferred Smooth cayenne which is big variety and produces more juice. This was also confirmed by key informant from processing industry (INYANGE Industry) who said they like Smooth cayenne for processing juice. The promotion of export oriented varieties by NAEB tends to discourage small scale farmers from increasing their production as they are reluctant to cultivate the mentioned variety (MD2). This is also supported by Oxfarm,2009 which states that farmers should plant a variety that they know, that are well adapted to local conditions, easy to process and popular for local market. The other source of the planting material was from other farmers‟ fields which represents 20% of the total respondents. Sourcing the suckers from other farmers‟ fields poses some risks in terms of diseases because small scale farmers do not consider whether the suckers are disease free since they have no other alternative sources. The farmers risks getting suckers that have been recycled so many times and would lower the production. This is supported by Garcia, 2005 who says the risks/dangers of recycling pineapple suckers of being susceptible to diseases. The other constraints of sourcing suckers from other farmers

33
other than NAEB or own field is transport cost as they are required to meet transport costs compared to NAEB that provides free transport for the suckers to the farmers‟ fields The remaining one quarter of the respondents used suckers from their own fields. After harvesting they keep suckers for replanting. The advantage of this is that they are cheap (free) to acquire as farmers do not pay for them and transporting them is very easy. Assuming the quality of the parent plant is good, and then the farmer would likely to get good suckers. However the disadvantage of getting suckers from own field would be the same as sourcing from other farmers‟ field in terms of diseases in that they will pass on the diseases to the next cycle (Garcia, 2005).
4.7 Livelihoods outcomes (Benefits from pineapple Production)
Livelihoods outcomes are better changes in livelihoods of people, that result from livelihoods strategies, these are specific to people but might include more income, increased well-being, reduced vulnerability, improved food security, and more sustainable use of the natural resources base (IFAD, 2011). Concerning strategies adopted by pineapple farmers, use of organic manure could lead to sustainable use of the natural resources could contribute to food security by increasing pineapple yield (MINAGRI, 2006).
However, strategies adopted by pineapple small scale farmers in general are not adequate to increase their income, to reduce vulnerability, to improve their livelihood and to sustain natural resources. Hence, by combining the assets farmers could access, taking into account of vulnerability context, inadequate support (inadequate supply of planting materials) by institutions, this situation leads to low outcome (low production).
However, during the interview with farmers, they mentioned that pineapple production helped small scale farmers to access the basic needs like school fees for the children, money for the health care and food for the household consumption. It was mentioned that pineapples were initially grown with bananas but later found out pineapples are profitable than bananas. With this, farmers decided to produce pineapples as cash crop together with the maize and beans for food crops. They further said that; land in Ngoma district is steep and unproductive for many food crops but pineapple production has been successful and therefore advantage to the people living in this area;
“Before, acquiring land in this place was very cheap (50,000frw/ha) because land was unproductive and many people did not like to get a land here, however, due to suitability of land here for pineapple growing and awareness of the government on pineapple production, land cost has increased and this has affected the availability of land because farmers cannot afford to buy a piece of land to extend area of pineapple production”. (Reported one farmer, Research Interviews, 2011).
The quotation above provides evidence of how pineapple production has attached value to land that was formally seen „unproductive‟. However, while this can be seen as positive, it also has a negative side as inflation of land costs has come with a challenge that increases costs of production. Acquiring land for expansion in Ngoma has proved a nightmare to most of the people as was revealed by the majority in focus group discussions.
Mentioned by majority of the respondents that pineapple production also created network that helped farmers to get ideas such as on how to save money to the banks, not depend only on pineapple production but also to diversify the activities like keeping cows and goats and also awareness on paying for medical insurance for the household members.

34
CHAPTER FIVE: CONCLUSION AND RECOMMENDATION
This section presents the conclusion of the findings on the factors affecting small scale farmers in pineapple production and recommendations on how to improve pineapple production.
5.1 Conclusion
This study was conducted to assess the factors affecting pineapple production by small scale farmers in Ngoma District. The research revealed that the small scale farmers have relatively benefited from pineapple production compared to other crops as it constitutes the big part of land utilization of the households. However, there is need to address the constraints particularly in pineapple planting materials and disease management for better yield.
In addition to pineapples farmers also grow maize and beans for home consumption and keep livestock that provide them milk and manure. It was observed that majority of the small scale farmers cultivate on less than 2 hectares with small part of their land allocated for pineapple production and the rest part of the land is used for maize and beans production.
Low pineapple production has been attributed to reduced soil fertility coupled with inadequate use of fertilizers and poor application of agronomical practices. Inadequate (or lack) use of fertilizers was found to be a constraint in pineapple production and this was due to lack of resources and awareness of the farmers in the importance of using fertilizer.
The study examined that small scale farmers are facing various constraints like; inadequate planting materials, diseases, little land, insufficient land, little access to credits, poor means of transport and little access to market information. Concerning planting materials, different sources of planting materials were identified during this study like; NAEB, own farmers‟ farms and other farmers‟ fields. The majority of the farmers depend on the planting materials supplied by NAEB hence amount supplied are not enough to cover their whole land for pineapple production, sometimes not supplied in time hence delays the time of planting. However, in other hand, some farmers counted this as an advantage because it contributes to their production since they are farmers who cannot afford.
Pineapple mealy bug disease was reported to be a constraint in pineapple production. The results of the research revealed that farmers control this disease by uprooting the infected plants but this affects the pineapple yield since they cannot put other plants there in to avoid the infection of new plants. The other way of controlling this disease that was found in this study is the early treatment of healthy suckers before planting and eradication of ants associated with the mealy bug.
Lack of financial services for farmers to support in their development initiatives, like funds for acquiring agricultural equipment, planting materials, fertilizers, and vehicles to transport pineapples is a big challenge for the small scale farmers. It is difficult for small scale farmers to access these services due to high loan security requested by the banks. Farmers therefore recommended in establishing small micro credit institutions in rural areas to provide small loans that are affordable by small scale farmers.
The study revealed various possible solutions to the emerging constraints in pineapple production. Among them is the increase of the quantity of planting materials, availability of

35
low interest credits and improve transport by repairing the feeder roads, Reinforcing Land use consolidation and promotion of radio programs. The results show that increase the quantity of planting materials was reported by majority of the respondents as the solution to inadequate planting materials that is most affecting the pineapple production by small scale farmers. This was followed by availability of low interest credits to facilitate farmers in accessing the loan to invest in pineapple production.
Although pineapple production was found to be the main crop grown by small scale farmers in Ngoma district but the study found other activities that farmers are engaged in like; growing of beans, maize, keeping of livestock and running small grocery shops . These activities contribute to the livelihood of farmers by providing food for home consumption and resources like milk and fertilizers (animal manure) that is used in pineapple fields.
Regarding the market and information access, small scale farmers have little access on the pineapple price and availability of market for pineapples. For the access to information, the study showed that most farmers access information from neighbours and radios. This would affect the pineapple production if the farmers do not get the right information from the neighbours and for the information accessed from the radios is always brief and for the farmers have no radios can miss out the information. In addition to the above, majority of the farmers were found not able to access information through internet. The reason being that the internet centres are located in the city centre of the district where it is difficult and expensive for the farmers who live in villages could not access. More to this, most of the farmers are computer illiterate hence makes it difficult for them to access the internet. It can also be concluded that in as much as the government is improving technology in agriculture, there is still less adoptive by the small scale farmers to these technologies. Regarding the extension and training services, small scale farmers are mainly trained by NAEB and ISAR especially on production practices and quality compliance but farmers seem to be reluctant in implementation of these practices. Basing on the findings, there is also still a challenge in women‟s participation in trainings.
Despite the constraints that small scale farmers facing in pineapple production, farmers have benefited from pineapple production in terms of accessing the household needs (food, school fees for the children, health insurance fees) and network among the pineapple farmers.
5.2 Recommendations
In reference to the conclusions made above, the following recommendations are made for
the improvement of pineapple production to farmers, NAEB, local government and
INYANGE Industry.
General recommendation (Main research question)
Pineapple production remains viable enterprise for small scale farmers in Ngoma District that should be further promoted. In order to address the main factors affecting the pineapple production (inadequate planting materials and diseases), the research recommends that NAEB should increase the quantity of planting materials supplied to farmers and train farmers on disease management practices.

36
Specific recommendations Farmers: farmers should form farmers‟ groups or cooperatives in order to pool their produce and have organised marketing system that enables them negotiating sales contracts and also seeking market opportunities that offer higher level of income. Also to have plan of production mainly based on the market requirements and grow the variety of pineapple that has high market demand. INYANGE Industry: In order to ensure the supply of good quality of pineapples, the industry in collaboration with NAEB should provide trainings to the farmers on the standards of pineapples to be processed. This will minimise the loss of pineapples caused by the rejection of pineapples due to poor quality. There should be availability of information on the production plan of the Inyange industry to the farmers in order for the farmers to plan the production. Local government: due to poor roads in the remote areas, there is a need for the local government to repair roads so that to facilitate easy transportation of pineapples Promotion of rural micro credit banks to facilitate farmers in accessing small loans for pineapple production Rwanda Agriculture Export Development Board (NAEB); to increase the pineapple production the following points should be emphasized by NAEB;
Providing hands on training to the pineapple farmers on the quality and pineapple propagation so that the farmers can be able to produce their own planting materials
Involving farmers in the selection of pineapple variety to be cultivated before any new variety would be supplied to farmers since it was indicated the farmers are imposed on growing varieties that they cannot manage to maintain.
Awareness should be created on disease management and the proper use of inputs
(fertilizers, planting materials and mulches) and keeping records of the inputs used in their farms as well as the yield from pineapple production.
Investment promotion in pineapple production especially in the production of organic
fertilizers since small scale farmers cannot produce enough for the production.

37
Reference Abdul R, et al., 2005. Factors Affecting the Performance of Pineapple Smallholders Aggrey, S, et al., 1999. Fruit crop production: Improvement and Expansion of Horticulture in Communal Areas of Zimbabwe. Austin Associates, J. E.,(2009). Study on marketing, Post-Harvest, and trade Opportunities for Fruits and Vegetables, Rwanda Danielou, M., and Ravry, C., 2005. The Rise of Ghana‟s Pineapple Industry ‐ From Successful Take off to Sustainable Expansion. Africa Region Working Paper Series 93. Diao,X,et al.,2006.Rwanda Agricultural Policy Note, Agricultural Growth and Poverty Reduction Options in Rwanda District Development Plan, 2006. Monographie du District de Ngoma, Eastern Province Eria,2009.Protection and health of crops in Uganda. Available at: http://www.rutnetwork.de/index.htm [accessed on 10th September 20011] Eric M.A., et al, 2007.Soil fertility in Africa is a stake, Uganda FAO (Food and Agriculture Organisation of the United Nations), 2001.Pineapple fresh production. Yearbook” Available: http://apps1.fao.org Fonga S.W., Sunny Riceb, and Brian., 2007. Marketing of perishable products: logistics, distribution, and cold storage. Garcia.H.S., et al,2005. Pineapple Post-Harvest operations
Izamuhaye, J.c., 2010. Inventory of existing planting material for target priory horticultural crops. Musanze: ISAE.
Jean, F., et al, 2008. Etude pour le development de la Filiere Ananas au Rwanda Kleeman, L., 2011. Organic Pineapple farming in Ghana. A good choice for smallholders Masimbe, S.et al., 2008. The status of Horticulture in Rwanda. NAEB, Kigali. MINAGRI, 2006a. Horticulture Strategy for Rwanda: Preparing for Growth. MINAGRI., 2004. Plan Strategique pour la Transformation Agricole. MINECOFIN, 2000. Vision 2020. Final Report MINECOFIN, 2002. Integrated Household Living Conditions Survey EICV (2000-2001). Final report, Kigali NAEB (National Agriculture Export and Development Board), 2006. Horticulture Business plan. Kigali: Crop Assessment Reports – 2005/6/7/8 NARI(National Agriculture Institute),1999. Pineapple Production Practices, Communications

38
Ndayizigiye, E., 2001. Agroforestry, water and soil fertility management fight erosion in tropical mountains of Rwanda. NISRa (National Statistics of Rwanda), 2006. Rwanda Agricultural Survey Report, Kigali NISRb(Rwanda Institute of Statistics), 2009. Assessment of crops in Rwanda, Kigali Oxfam, 2006. Fresh and processed pineapples for local and export market: Sub Sector and value chain analysis. RDB(Rwanda Development Board), 2008.Rwanda Export Catalogue: Rwanda Horticulture Sector; Pineapple development, Kigali
Sheffield.J., 2007. Farm Animal Manure is an importanta sustainable renewable energy resources [online] available at <http://www.www.ornl.gov/inex.htm> [accessed on 10th August 2011].
Ssemwanga Consulting, 2007.Study for Fruits Sub-Sector (Pineapple, Passion Fruits, Mangoes) Ssonko,R., et al., 2005 Pro-Poor Horticulture in East Africa and South East Asia: The horticultural sector in Uganda, Wageningen University, collaboration between Wageningen University Research, Suah,J.,et al, 2005. Improved Production of Pineapple for Sustainable Livelihoods, Jamaica. Temu, A.et al., 2007.Changes in the governance of global value chains of fresh fruits and vegetables, opportunities and challenges for producers in sub-Saharan Africa, South centre
tropical Africa. World Development 37(6): 1094‐1104. Tsutomu,T., 2004. Smallholders and non-traditional exports under economic liberalization: the case of pineapples in Ghana. Twarster. R and P.G.Moe, 2008. Study of cultural practices for improved pineapple production in Uganda Unit, World Bank, 2007. Rwanda promoting pro-poor Agricultural growth in Rwanda: Challenges and opportunities. www.trocaire.org/sites/trocaire/files/pdfs/tdr/DR1986_FoodVscashcropsinAfrica.pdf. Accessed on 23th September 2001. www.ifad.org/english/operations/pf/rwa/i596rw/web/index.htm. Accessed on: 23th September 2001. Yeboah, G., 2005. The Farmapine Model: A cooperative Marketing Strategy and a Market-Based Development Approach in Sub-Saharan Africa. Zhang J. and Bartholomew DP., 2003. Simulation of Pineapple Growth, Development and Yield, Dept. Agronomy and Soil Science, University Hawaii.

39
ANNEXES Annex 1: Checklist
A. Group discussion of Pineapple small scale farmers
1. Agronomical practices used by farmers in pineapple production
2. Constraints facing small scale farmers and their influence to the pineapple production
3. Possible solution to address the emerging constraints
4. Effectiveness of the facilitations/services offered to the pineapple small scale Farmers
a. Which institutions provide support in pineapple production
b. Whether farmers are getting enough trainings in pineapple production
c. Whether trainings are well understood and sufficient
d. Whether the inputs (planting materials, tools) suit their interest (quality, quantity and timely)
e. Accessibility of the information (markets, prices and diseases)
5. Selling of pineapples by small scale farmers/ prices and market outlets for pineapple
a. What are market outlets for pineapples
b. How pineapples transported to the market
c. Whether the farmers are satisfied with the price of pineapples
7. The benefits of pineapple production to the small scale farmers
B. KEY INFORMANTS 1. INYANGE processing Industry
a. Who are the suppliers of pineapples to the industry (sources of pineapples)
b. Quantity and quality of pineapples supplied to the industry
c. How is the quality of pineapples supplied to the industry
d. What facilities/services provided to small scale farmers in Pineapple production
e. What is the price of pineapples do the industry buy from the farmers
f. What are constraints facing the industry in regard to the pineapple supply chain
g. What possible solutions to the constraints
2. National Agriculture Export Development Board (NAEB) and Ngoma district
a. What facilities/services provided to small scale farmers in Pineapple production

40
b. What kind of trainings given to the small scale farmers
c. What are the constraints in pineapple production chain
d. What are the possible solutions to the constraints to improve pineapple production
e. Where is the source of planting materials supplied to pineapple farmers
Annex 2: QUESTIONNAIRE An interview guide for the farmer
General information
Name of respondent:....................................................................................................
Sex of respondent: M F
Name of the Village ......................................................................................................
Date:..............................................................................................................................
1. HOUSEHOLD INFORMATION
a) What is your level of education?
Answers (indicate in the box) b) How many household members do you have?
c) What is your total farm size (in hectares?)
Primary
level
Secondary
level
University
level
1-4
members
5-8
members
8 members
and above
2 hectare
and below
2.0-4.0
hectares
4 hectares
and above

41
a) How much farm size under the pineapple production?
2. Pineapple production
a) How do you cultivate the pineapple? select the practices used in pineapple production
and explain how they are done;
- Land preparation
- Planting
- Mulching
- Fertilizer application
- Disease management
b) How much yield of pineapple do you get from your farm per circle?
…………………………………………………………………………………………………........
…………………………………………………………………………………………………........
c) Where do you sell your Pineapples?
…………………………………………………………………………………………………........
………………………………………………………………………………………….......
d) Are you satisfied with the price of pineapples
e) How are pineapples transported to the market?
.............................................................................................................................
..............................................................................................................................
f) From the list, name the main constraints you are facing in pineapple production and they
are affecting pineapple production
1. Inadequate inputs(fertilizers, planting materials)...........................................................
2. Pests and diseases
3. Insufficient land……………………………………………………......................................
4. Little access to credits.....................................................................................................
5. Poor transport facilities....................................................................................................
6. Inadequate market information........................................................................................
g) What are other activities is your household engaged in apart from pineapple production?
.............................................................................................................................................
.............................................................................................................................................
............................................................................................................................................
.............................................................................................................................................
h) What are the benefits do you get from pineapple production?
1 hectare
and below
1.0-2.0
hectares
2.0 to 4.0
hectares
Not
satisfied
at all
Averagely
satisfied
satisfied