fact sheet ultramid-cap profund
TRANSCRIPT

FACT SHEET As of 3/31/21
ULTRAMID-CAP PROFUND
Fund objective
UltraMid-Cap ProFund seeks daily investmentresults, before fees and expenses, thatcorrespond to two times (2x) the dailyperformance of the S&P MidCap 400® Index.The Fund does not seek to achieve its statedinvestment objective over a period of timegreater than a single day.
Fund details
Inception Date 02/07/2000
Investor Class Symbol UMPIX
Service Class Symbol UMPSX
Investor Class Cusip 743185720
Service Class Cusip 743185654
Investor Class Gross Expense Ratio 1.66%
Service Class Gross Expense Ratio 2.66%
Investor Class Net Expense Ratio 1 1.66%
Service Class Net Expense Ratio 1 2.66%
Limit on Exchange None
Uses for magnified exposure
Common uses for magnified exposure include:
Seeking magnified gains(will also magnify losses)Getting a target level of exposure for less cashOverweighting a market segment without additional cash
Fund performance and index history2
The UltraMid-Cap ProFund seeks daily investment results, before fees andexpenses, that are 2x the return of the S&P MidCap 400® (the "Index") for asingle day, not for any other period.
Year to Fund1Q 2021 Date 1-Year 5-Year 10-Year Inception
26.47% 26.47% 203.33% 19.83% 16.49% 9.99%
26.22% 26.22% 200.53% 18.65% 15.33% 8.92%
13.47% 13.47% 83.46% 14.36% 11.91% 10.24%
Investor Class NAV Total Return
Service Class NAV Total Return
S&P MidCap 400
Periods greater than one year are annualized.
Daily return during 1Q 2021UltraMid-Cap (UMPIX) S&P MidCap 400 Index
-8%
-4%
0%
4%
8%
January 21 February 21 March 21
Past performance does not guarantee future results. The performance data quoted represents past performance and current returns may be lower orhigher. The investment return and principal value of an investment will fluctuate so that an investor's shares, when redeemed, may be worth more or lessthan the original cost. Performance data current to the most recent month-end is available at Profunds.com or by calling 1-888-776-3637.For standardized returns year-to-date, and as of the most recent calendar quarter-end, and annualized month-end, see performance. Returns include the reinvestmentof dividends and capital gains.1Contractual waiver effective until November 30, 2021. Without such a waiver of fees, the total returns would have been lower.2All data, unless otherwise noted, is as of 03/31/21, and for Investor Class Shares only. Holdings and other data are subject to change.
Index description 2
The S&P MidCap 400® Index(Bloomberg Symbol: MID) is a measureof mid-size company U.S. stock marketperformance. It is a float-adjusted,market capitalization-weighted index of400 U.S. operating companies and realestate investment trusts selected througha process that factors in criteria such asliquidity, price, market capitalization andfinancial viability. It is not possible toinvest directly in an index.
Index Characteristics 2
Number of Companies 400
Price/Earnings Ratio 24.64
Price/Book Ratio 2.70
Dividend Yield 1.23%
Average Market Cap $5.96 billion
For more information, visit
ProFunds.com or ask your
financial advisor or broker.
Top index companies 2 Weights
Bio-Techne Corp. 0.66%
SolarEdge Technologies Inc. 0.66%
Cognex Corp. 0.65%
Charles River Laboratories 0.64%
PTC Inc. 0.64%
Fair Isaac Corp. 0.63%
Williams-Sonoma Inc. 0.61%
Molina Healthcare 0.60%
Signature Bank 0.57%
XPO Logistics Inc. 0.56%
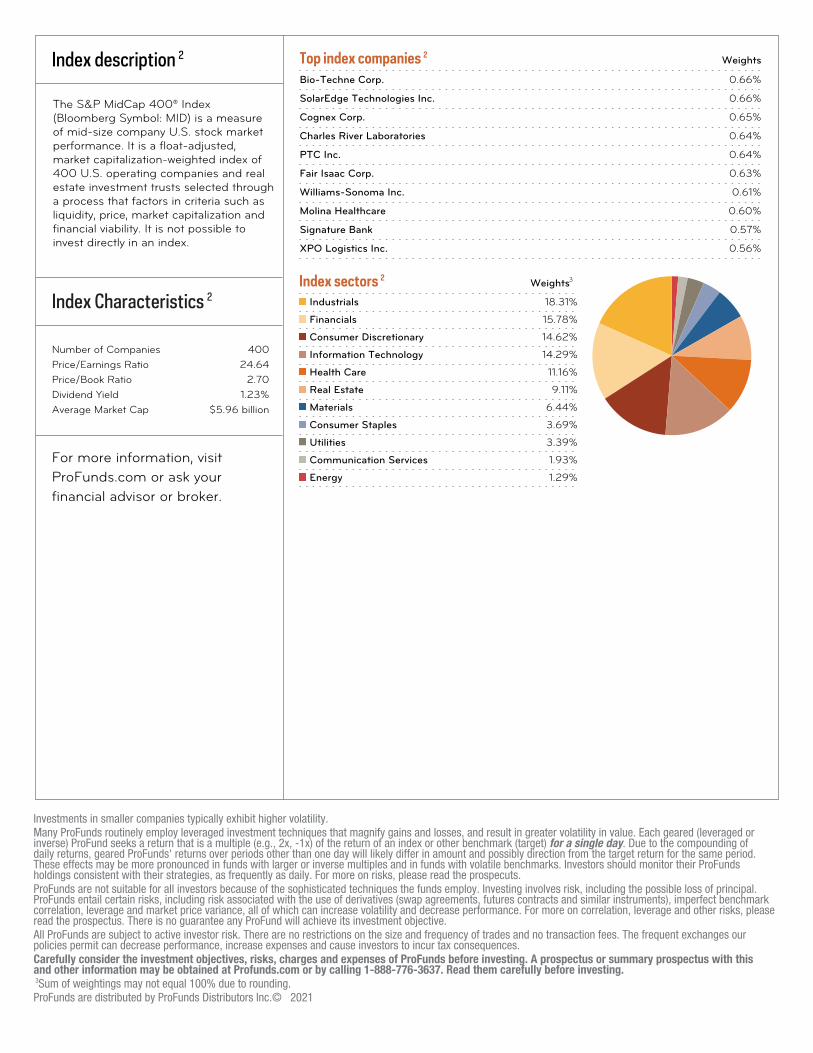
Index sectors 2 Weights3
Industrials 18.31%
Financials 15.78%
Consumer Discretionary 14.62%
Information Technology 14.29%
Health Care 11.16%
Real Estate 9.11%
Materials 6.44%
Consumer Staples 3.69%
Utilities 3.39%
Communication Services 1.93%
Energy 1.29%
Investments in smaller companies typically exhibit higher volatility.Many ProFunds routinely employ leveraged investment techniques that magnify gains and losses, and result in greater volatility in value. Each geared (leveraged orinverse) ProFund seeks a return that is a multiple (e.g., 2x, -1x) of the return of an index or other benchmark (target) for a single day. Due to the compounding ofdaily returns, geared ProFunds' returns over periods other than one day will likely differ in amount and possibly direction from the target return for the same period.These effects may be more pronounced in funds with larger or inverse multiples and in funds with volatile benchmarks. Investors should monitor their ProFundsholdings consistent with their strategies, as frequently as daily. For more on risks, please read the prospecuts.ProFunds are not suitable for all investors because of the sophisticated techniques the funds employ. Investing involves risk, including the possible loss of principal.ProFunds entail certain risks, including risk associated with the use of derivatives (swap agreements, futures contracts and similar instruments), imperfect benchmarkcorrelation, leverage and market price variance, all of which can increase volatility and decrease performance. For more on correlation, leverage and other risks, pleaseread the prospectus. There is no guarantee any ProFund will achieve its investment objective.All ProFunds are subject to active investor risk. There are no restrictions on the size and frequency of trades and no transaction fees. The frequent exchanges ourpolicies permit can decrease performance, increase expenses and cause investors to incur tax consequences.Carefully consider the investment objectives, risks, charges and expenses of ProFunds before investing. A prospectus or summary prospectus with thisand other information may be obtained at Profunds.com or by calling 1-888-776-3637. Read them carefully before investing.3Sum of weightings may not equal 100% due to rounding.ProFunds are distributed by ProFunds Distributors Inc.© 2021