facing displacements in geosynthetic reinforced … et al. er2010.pdffacing displacements in...
TRANSCRIPT

Facing Displacements in Geosynthetic Reinforced Soil Walls
R.J. Bathurst1, Y. Miyata2 and T.M. Allen3 1GeoEngineering Centre at Queen’s-RMC, Department of Civil Engineering, Royal Military College of Canada, Kingston, Ontario, K7K 7B4 Canada; PH (613) 541-6000 (ext. 6479/6347/6391); FAX (613) 541-6218; email: [email protected] 2Department of Civil and Environmental Engineering, National Defense Academy, 1-10-20 Hashirimizu, Yokosuka 239-8686 Japan; PH +81 (468) 41-3810; FAX: +81 (468) 44-5913; email: [email protected] 3State Geotechnical Engineer, Washington State Department of Transportation, State Materials Laboratory, Olympia, Washington, 98504-7365 USA; PH (360) 709-5450; FAX (360) 357-3814; email: [email protected] ABSTRACT The paper summarizes current recommendations for anticipated and specified maximum horizontal deformation of geosynthetic reinforced soil wall facings found in a number of codes of practice. Recommended limits on verticality are compared to a database of wall performance data collected by the writers. In most cases, end of construction (EOC) measured facing deformations for walls on firm foundations are within recommended limits. Anticipated deformations for walls extrapolated out to a design life of 75 years are also reported. The results of a careful set of full-scale wall tests show that EOC deformations are influenced by both compaction effort and global reinforcement stiffness when other factors remain unchanged. The paper is of value to design engineers by providing example deformation data to estimate the additional facing batter required to satisfy intended design alignment and to provide adequate clearance for adjacent structures. INTRODUCTION Geosynthetic reinforced soil walls are now an established technology for earth retaining walls in civil engineering works. Their use in North America can be traced back to the early 1970s when the first wrapped-face walls were constructed in northwestern USA by the US Forest Service (Allen et al. 2002). Today there are guidance documents available to design these soil retaining wall systems that are classified as mechanically stabilized earth (MSE) walls in USA terminology. Most design methods are limit equilibrium-based and adopt variants of classical notions of active earth theory (e.g. AASHTO 2009; FHWA 2008; NCMA 2009). These design methods have proven to be conservative (i.e. safe) when predicted reinforcement loads are compared to measured loads at end of construction (e.g. Allen et al. 2002). This has led to an empirical-based working stress design method (K-stiffness Method) that has been shown to give more accurate estimates of reinforcement loads
442

and their distribution under operational conditions compared to current methods (e.g. Allen et al. 2006; Bathurst et al. 2008; WSDOT 2006).
Nevertheless, as interest towards performance-based design increases and limit states design codes are developed which include serviceability limit states, there is a need to estimate what facing deformations can be anticipated or tolerated for geosynthetic reinforced soil walls during and after construction. Furthermore, designers may be interested in the magnitude of outward deformations that may be anticipated for different types of wall structures so that a pre-batter may be designed into the facing to achieve a target batter at the end of wall construction or to provide minimum clearances with adjacent structures. At present there are no analytical methods available and estimates of facing deformations have been restricted to a design chart first proposed by Christopher et al. (FHWA 1989) and reproduced in subsequent FHWA and AASHTO design guidelines. Numerical modeling has also been used but credible predictions have been restricted to Class C predictions of a small number of instrumented structures.
Over the last decade the writers have collected case study records of the quantitative performance of full-scale walls constructed in North America, Europe, Japan and elsewhere. The core data are taken from case studies with sufficient quantitative information on the properties of the component materials (e.g. reinforcement and soils) and construction records to allow the writers to compare measured reinforcement loads at end of construction to predicted values using the current limit-equilibrium method in North America (called the “tie-back wedge” or Simplified Method) and the K-stiffness Method. A collateral benefit of this collection is that it can be used to summarize observations on the magnitude of lateral facing deformations for different types of walls that are judged to have performed well and a few that have not. A number of other field walls with less comprehensive monitoring data but with good quality horizontal deformation data from survey or inclinometers have been added to the database for this study.
The objectives of this paper are to summarize current recommendations for anticipated horizontal facing displacements and specified tolerances from current codes of practice in the USA and other countries/regions, and from other sources. Reported deformations from high quality instrumented and monitored full-scale walls are reviewed and compared to recommended values. The paper is restricted to horizontal deformations since the walls in the core database were either built on rigid foundations in the laboratory or on firm competent foundations in the field. Furthermore, vertical settlements have been recorded infrequently in the literature with the exception of a few instrumented walls built specifically on soft foundations. Finally, the results of a series of carefully constructed full-scale geosynthetic reinforced soil walls are used to examine the influence of compaction, reinforcement stiffness and spacing on facing deformations. CURRENT GUIDELINES AND SPECIFICATIONS FOR FACING HORIZONTAL DISPLACEMENTS AND TOLERANCES Table 1 summarizes anticipated horizontal out-of-alignment and specified tolerances for different geosynthetic reinforced soil wall types. Guidelines typically report
443EARTH RETENTION CONFERENCE
443

facing deformations as maximum horizontal value (Δx measured perpendicular to the running length of the wall) over the entire face of a wall or as an equivalent rotation over the height of the wall (Δx/H) from design batter (verticality). For example, a value of 1% verticality in the table corresponds to an equivalent rotation of 10 mm/m of wall height. Most guidelines have recommendations or specifications for horizontal alignment tolerances at the base or along elevation lines above the base. Deviations from these values were not investigated in this study since these are almost exclusively controlled by construction quality control. The table shows that limits for facing deformations and verticality vary widely between sources and
Table 1. Guidelines for anticipated and specified horizontal facing deformations.
Source
Crit
erio
n N
o.
Wall type
Maximum displacement from target
batter over wall height, H
Verticality (Δx/H)
Ant
icip
ated
Sp
ecifi
ed
FHWA (2008), AASHTO (2009)
1 All walls - Variable (4% to 0.9% without surcharge) (f)
√
Bathurst et al. (1995) 2 Segmental -
1% for H ≤ 8 m 1.5% for H > 8
m √
NGG (2005) 3 All walls - 0.1% to 0.3% √
EN 14475 (2006)
4 Vertical and sloped concrete panel, king post system, incremental concrete panel
± 25 mm
- √5 Segmental ± 50 mm
6 Welded wire and gabion face ± 100 mm
BS8006 (1995), Geoguide 6 (2002)
7 All walls - 0.5% √
NCMA (2009) 8 Segmental - 3.5% R
PWRC (2000) 9 All walls ± 300 mm 3% √
WSDOT (2005)
10 Welded wire (a) - 1.3% in 3 m
√11 Concrete panel(b),, Segmental (c) - 0.4% in 3 m 12 Wrapped
face Permanent (d) - 1.7% in 3 m
13 Temporary (e) - 2.5% in 3 m
(a) The maximum outward bulge of the face between welded wire faced structural earth wall reinforcement layers shall not exceed 50 mm. (b) The maximum allowable offset in any precast concrete facing panel joint shall be 20 mm. (c) The maximum allowable offset in any concrete block joint shall be 9 mm. (d) Maximum outward bulge of the face between backfill reinforcement layers shall not exceed 100 mm. (e) Maximum outward bulge of the face between backfill reinforcement layers shall not exceed 150 mm. (f) Increase displacements by 25% for every additional 25 kPa of surcharge. R = recommended
444 EARTH RETENTION CONFERENCE
444

between wall types. For example the WSDOT (2005) specifications for facing tolerances are very detailed and specific with respect to wall type. In contrast, current Japanese specified tolerances (PWRC 2000) are very general and least restrictive. An explanation for the 300 mm limit on outward deformations is that cohesive-frictional fills are used routinely in Japan while they are avoided in North America (at least by government DoTs). The Japanese approach for geosynthetic reinforced soil walls for railway embankments is to build a wrapped-face wall and once deformations have ceased, cast a reinforced concrete face against the wrapped face (Tatsuoka 1993; Kojima et al. 1996). There are no horizontal deformation criteria for these walls. However there is a limit of 100 mm post-construction settlement for these structures (Miyata et al. 2003).
The anticipated deviations from verticality reported by Bathurst et al. (1995) were based on analysis of deformations of two field segmental walls that were monitored during construction. The remaining sources are design guidance documents from the USA (FHWA 2008; AASHTO 2009; NCMA 2009; WSDOT 2005), Scandinavia (NGG 2005), Europe (EN 14475 2006), United Kingdom (BS8006 1995), Hong Kong (Geoguide 6 2002) and Japan (PWRC 2000).
In the USA, the design chart for anticipated deviations from verticality originally reported by Christopher et al. (1989) is likely most familiar to designers and appears in current FHWA (Holtz et al. 2008) and AASHTO (2009) guidelines. This is an empirically-based chart developed from finite element analyses, small-scale tests and limited measurements from 6-m high test walls available at that time. However, as carefully pointed out by the original authors in the original and subsequent republications, this chart should be used with caution. The footnotes to this chart point out that soil type, compaction quality, initial slack in the reinforcement and overall quality of construction can all influence facing deformations. The chart is recommended for use as a first order estimate of lateral displacements during construction of simple MSE structures built on firm foundations. WALL DATABASE The majority of case studies in the current investigation were taken from studies described in detail in earlier papers by the writers (Allen et al. 2002, 2006; Miyata and Bathurst 2007a,b; Bathurst et al. 2002, 2008). Additional performance data focused largely on reinforcement loads and strains can be found in the papers by Allen and Bathurst (2002a,b). In the current study, designations for walls such as GW9 and GW17 that appear later are taken from this original database. Some additional case studies with high quality wall deformation data and supporting information have been found in the literature and these case studies have been added to the original database and used in this paper (e.g. GW43 and GW44). A total of 42 wall sections were used to generate the data in this paper (not including the recent RMC test walls described at the end of the paper). Of the 42 wall sections, 11 were segmental (modular) block type, seven were full height concrete panel, four were incremental concrete panel, six were wrapped face, four were gabion basket face and three were constructed using sandbags for the facing. Seven of the walls are identified
445EARTH RETENTION CONFERENCE
445
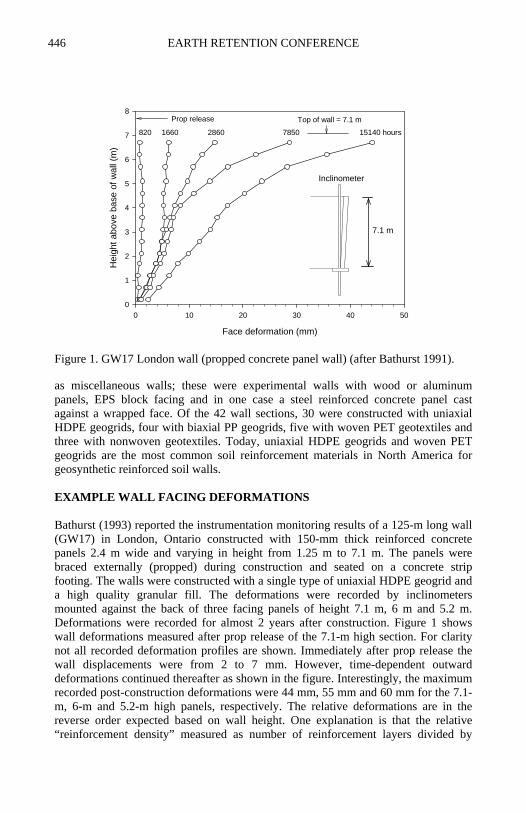
as miscellaneous walls; these were experimental walls with wood or aluminum panels, EPS block facing and in one case a steel reinforced concrete panel cast against a wrapped face. Of the 42 wall sections, 30 were constructed with uniaxial HDPE geogrids, four with biaxial PP geogrids, five with woven PET geotextiles and three with nonwoven geotextiles. Today, uniaxial HDPE geogrids and woven PET geogrids are the most common soil reinforcement materials in North America for geosynthetic reinforced soil walls. EXAMPLE WALL FACING DEFORMATIONS Bathurst (1993) reported the instrumentation monitoring results of a 125-m long wall (GW17) in London, Ontario constructed with 150-mm thick reinforced concrete panels 2.4 m wide and varying in height from 1.25 m to 7.1 m. The panels were braced externally (propped) during construction and seated on a concrete strip footing. The walls were constructed with a single type of uniaxial HDPE geogrid and a high quality granular fill. The deformations were recorded by inclinometers mounted against the back of three facing panels of height 7.1 m, 6 m and 5.2 m. Deformations were recorded for almost 2 years after construction. Figure 1 shows wall deformations measured after prop release of the 7.1-m high section. For clarity not all recorded deformation profiles are shown. Immediately after prop release the wall displacements were from 2 to 7 mm. However, time-dependent outward deformations continued thereafter as shown in the figure. Interestingly, the maximum recorded post-construction deformations were 44 mm, 55 mm and 60 mm for the 7.1-m, 6-m and 5.2-m high panels, respectively. The relative deformations are in the reverse order expected based on wall height. One explanation is that the relative “reinforcement density” measured as number of reinforcement layers divided by
Face deformation (mm)
0 10 20 30 40 50
Hei
ght a
bove
bas
e of
wal
l (m
)
0
1
2
3
4
5
6
7
8Top of wall = 7.1 mProp release
15140 hours785028601660820
Inclinometer
7.1 m
Figure 1. GW17 London wall (propped concrete panel wall) (after Bathurst 1991).
446 EARTH RETENTION CONFERENCE
446

Face deformation (mm)
0 10 20 30 40 50 60 70 80 90 100
Hei
ght a
bove
bas
e of
wal
l (m
)
0
1
2
3
4
5
6
7
5286528 11280 hours
Top of wall = 6.1 m2616 hours
Surcharging
192 24002352 2808
a) cross-section b) wall deformations with respect to end of construction
Figure 2. GW9 Algonquin wall (segmental wall) (after Bathurst et al. 1993).
height of wall was 0.96, 1.17 and 1.27 for the 5.2 m, 6 m and 7.1 m panels, respectively. Hence, assuming that all panels sections were constructed to the same level of care, the relative deformations suggest that reinforcement density (or global reinforcement stiffness introduced later) may influence wall deformations when all other factors remain the same. The maximum strains in the reinforcement were about 3.5% which puts this wall at the limit of walls estimated to have good performance based on a set of criterion proposed by Allen and Bathurst (2002a). High connection strains were also detected due to the downward movement of the soil behind the vertically rigid panel sections. Nevertheless, the wall remains in service today after 20 years with no evidence of poor performance.
A reinforced segmental retaining wall (GW9) was constructed at a site in Algonquin Illinois as part of a research program by the FHWA (Figure 2a) (Bathurst et al. 1993). The facing units were dry-stacked hollow masonry units with toe-to-heel dimension of 600 mm. The reinforcement was a woven PET geogrid. The wall was purposely under-designed to encourage detectable wall deformations and reinforcement strains. End of construction movements were estimated to be about 60 mm but time-dependent outward movements of about 30 mm continued while the wall remained at the 6.1 m height for about 100 days. Thereafter the wall was surcharged. Wall deformations with respect to end of construction are shown in Figure 2b and were taken from an inclinometer located behind the modular block facing. Total outward movements with respect to beginning of construction were 150 mm at the end of the surcharging. The wall deformation profiles during surcharging
447EARTH RETENTION CONFERENCE
447

show that most of the movement occurred over the bottom half of the wall. Despite being under-designed the maximum reinforcement strains were about 1.2% which is well below limits that would be expected to lead to long-term rupture of the geogrid reinforcement.
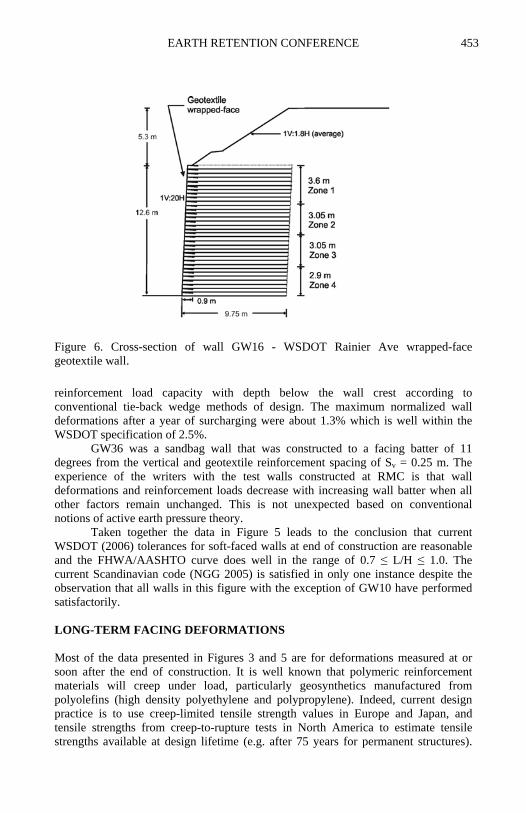
SUMMARY OF NORMALIZED FACING DISPLACEMENTS Deformation data for hard-faced walls are summarized in Figure 3. Normalized displacements Δx/H were computed for end of construction (EOC) or during construction and are plotted against L/H and H, where L is the base reinforcement length. Also included in these figures are post-EOC data for the Berkeley (segmental) wall (GW44) and GW9 discussed earlier. The Berkeley wall data includes wall creep data taken while the wall was kept at a constant height of 10.4 m for about 16 days (final height was 14.4 m) (Bathurst et al. 1995). Projected time-dependent wall deformations for this structure are discussed later in the paper. The minimum reinforcement ratio specified in design guidance documents is L/H = 0.6 or 0.7. It can be noted that there are many data points with L/H greater than minimum specified values. Most of these data correspond to wall deformations recorded as the wall was constructed. Hence at low wall height, L/H will be greater than the final design L/H value corresponding to end of construction.
With the exception of GW21 and GW23, all walls deformed less than 1.5% of the wall height at the end of construction (EOC). GW21 was an experimental wall constructed at the PWRI in-door laboratory in Japan. The 4-m high wall was purpose-constructed using 1-m high plywood panels with a single reinforcement layer attached at mid-height of each panel and a relatively large vertical reinforcement spacing Sv = 1 m (Miyata and Bathurst 2007). A biaxial geogrid was selected with low stiffness and strength and was oriented in the weak direction. This combination of materials and geometry makes the wall facing relatively unstable and susceptible to local deviations from vertical alignment. Nevertheless, the data is useful since it demonstrates the conditions necessary to generate large facing deformations (e.g. poor panel-reinforcement geometry, large vertical reinforcement spacing and low stiffness reinforcement). GW23 was another experimental PWRI incremental panel wall (H = 6 m). This wall was constructed with concrete panels and stiffer reinforcement, large reinforcement spacing (Sv = 1 m) and relatively short reinforcement lengths (L/H = 0.58). This wall generated out-of-vertical deformations that were only just in excess of 1.5%. Compared to the shorter GW21 wall, the greater stability of the concrete panels plus stiffer reinforcement is likely the reason that this wall deformed less based on deformations relative to wall height.
Wall GW5 was one of the first production (field) propped concrete panel walls constructed in North America (1984) (Berg et al. 1986). The concrete panels were cast with short loops of uniaxial HDPE geogrid that were then connected to the primary reinforcement layers (same geogrid) using a PVC pipe bodkin. Wall GW6 was another propped concrete panel wall constructed about the same time (1985) (Berg et al. 1986). The reinforcement layers were not attached directly to the facing panels. Geogrid tabs 1.3 m long were cast into the concrete panels and these tabs overlapped with the primary reinforcement layers with a 75-mm thick layer of soil
448 EARTH RETENTION CONFERENCE
448

.
1
2
3
0.30.1
7
8
9
110.4
L/H
0.0 0.1 0.2 0.3 0.4 0.5 0.6 0.7 0.8 0.9 1.0 1.1 1.2 1.3 1.4 1.5
Δx/H
(%)
0.0
0.5
1.0
1.5
2.0
2.5
3.0
3.5
4.0
Design guideline
1. FHWA (2008), AASHTO (2009)2. Bathurst et al. (1995) - Segmental3. NGG (2005)4. EN 14475 (2006) - Concrete panel/king post5. EN 14475 (2006) - Segmental7. BS8006 (1995), Geoguide 6 (2002)8. NCMA (2009) - Segmental9. PWRC (2000)11. WSDOT (2005)
Wall type
MiscellaneousFull height concrete panel
RMC segmental wallsGW44 Berkeley wall (segmental)SegmentalIncremental concrete panel
1
GW9 (EOC)
GW17 (EOC)
GW21
GW5GW23
GW6
GW17 (~2 years)
GW17 Full height concrete panel
GW9 (surcharge for 370 days)
a)
H (m)
0 2 4 6 8 10 12 14 16
Δx/H
(%)
0.0
0.5
1.0
1.5
2.0
2.5
3.0
3.5
4.0
2
3
0.30.1
0.4
9
2 4
5
7
8
11GW9
GW17
GW21
GW23
GW17 (~2 years)
GW5GW6
GW9 (surcharge for 370 days)
b) Figure 3. Normalized horizontal deformation for hard-faced walls Δx/H versus: a)reinforcement length ratio (L/H); b) wall height (H).
449EARTH RETENTION CONFERENCE
449
between the two layers. To the best of the writers’ knowledge this technique is no longer used in North America. The lack of a direct connection may explain the relatively large deformations. The normalized wall deformations for GW17 with less deformable connections were smaller than GW6 and GW5 even after almost two years of in-service creep measurements. These observations give support to the hypothesis that increasing slack or play in the connections for reinforced soil walls may create greater wall deformations. However, the vertical compliance of deformable connections can have the advantage of reducing connection strains. The connection strains in GW17 with more rigid connections were in excess of 3% which is considered large compared to strains recorded in the database of monitored walls collected by the writers.
Wall GW9 (segmental) discussed in the previous section, exhibited large relative deformations compared to all other walls but only after a large surcharge was applied for more than a year. Recall that this wall was purposely under-designed.
In general, curve 1 in Figure 3a is judged to serve well as an upper limit on anticipated deformations for hard-faced walls at the end of construction despite its empirical basis. For non-surcharged segmental retaining walls, a value of Δx/H = 1% at end of construction is considered a reasonable upper limit for anticipated deviations from verticality for walls of 8-m height or less. Current recommendations by the NCMA (2009) and PWRC (2002) easily captured measured wall deformations for this wall category.
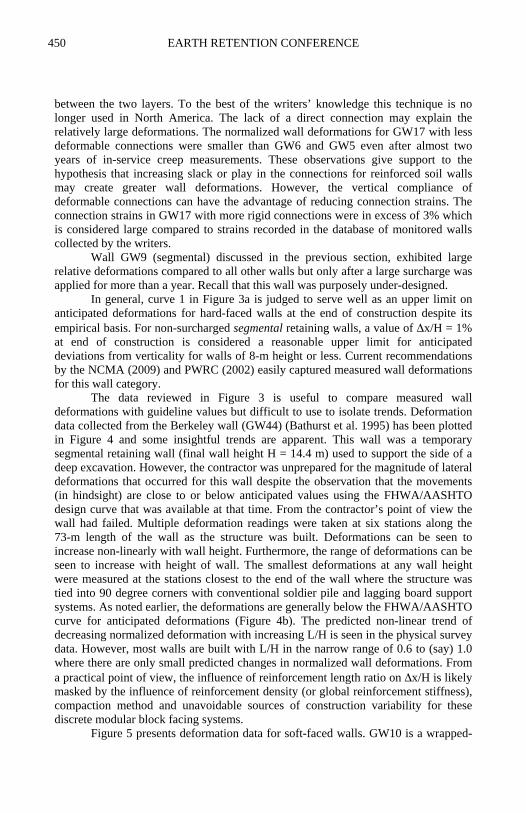
The data reviewed in Figure 3 is useful to compare measured wall deformations with guideline values but difficult to use to isolate trends. Deformation data collected from the Berkeley wall (GW44) (Bathurst et al. 1995) has been plotted in Figure 4 and some insightful trends are apparent. This wall was a temporary segmental retaining wall (final wall height H = 14.4 m) used to support the side of a deep excavation. However, the contractor was unprepared for the magnitude of lateral deformations that occurred for this wall despite the observation that the movements (in hindsight) are close to or below anticipated values using the FHWA/AASHTO design curve that was available at that time. From the contractor’s point of view the wall had failed. Multiple deformation readings were taken at six stations along the 73-m length of the wall as the structure was built. Deformations can be seen to increase non-linearly with wall height. Furthermore, the range of deformations can be seen to increase with height of wall. The smallest deformations at any wall height were measured at the stations closest to the end of the wall where the structure was tied into 90 degree corners with conventional soldier pile and lagging board support systems. As noted earlier, the deformations are generally below the FHWA/AASHTO curve for anticipated deformations (Figure 4b). The predicted non-linear trend of decreasing normalized deformation with increasing L/H is seen in the physical survey data. However, most walls are built with L/H in the narrow range of 0.6 to (say) 1.0 where there are only small predicted changes in normalized wall deformations. From a practical point of view, the influence of reinforcement length ratio on Δx/H is likely masked by the influence of reinforcement density (or global reinforcement stiffness), compaction method and unavoidable sources of construction variability for these discrete modular block facing systems.
Figure 5 presents deformation data for soft-faced walls. GW10 is a wrapped-
450 EARTH RETENTION CONFERENCE
450
face wall that was constructed as part of the FHWA study at Algonquin Illinois mentioned earlier. The 5.9-m high wall was purposely designed and constructed to produce internal stability failure. The wall was supported externally over the bottom half during construction. The support was released leading to large deformations (150 mm) and reinforcement strains up to 3%. Nevertheless, these deformations were at or within recommendations for temporary walls according to WSDOT (2005) and PWRC (2000), respectively.
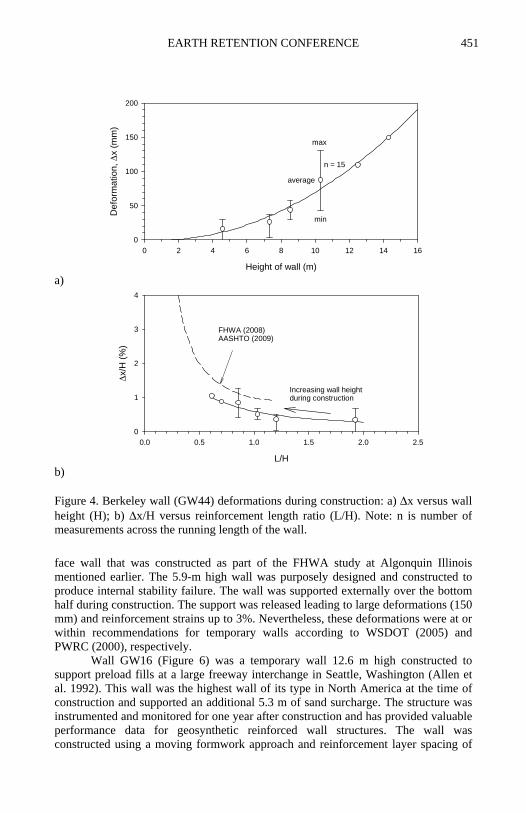
Wall GW16 (Figure 6) was a temporary wall 12.6 m high constructed to support preload fills at a large freeway interchange in Seattle, Washington (Allen et al. 1992). This wall was the highest wall of its type in North America at the time of construction and supported an additional 5.3 m of sand surcharge. The structure was instrumented and monitored for one year after construction and has provided valuable performance data for geosynthetic reinforced wall structures. The wall was constructed using a moving formwork approach and reinforcement layer spacing of
Height of wall (m)
0 2 4 6 8 10 12 14 16
Def
orm
atio
n, Δ
x (m
m)
0
50
100
150
200
average
max
min
n = 15
a)
Col 23 vs Col 24 Col 9 vs Col 11
L/H
0.0 0.5 1.0 1.5 2.0 2.5
Δx/H
(%)
0
1
2
3
4
FHWA (2008)AASHTO (2009)
Increasing wall heightduring construction
b) Figure 4. Berkeley wall (GW44) deformations during construction: a) Δx versus wallheight (H); b) Δx/H versus reinforcement length ratio (L/H). Note: n is number ofmeasurements across the running length of the wall.
451EARTH RETENTION CONFERENCE
451

Sv = 0.4 m. Four different geotextile products were used. The geotextiles were arranged in four different zones roughly matching the demand for increasing
. L/H
0.0 0.1 0.2 0.3 0.4 0.5 0.6 0.7 0.8 0.9 1.0 1.1 1.2 1.3 1.4 1.5
Δx/H
(%)
0.0
0.5
1.0
1.5
2.0
2.5
3.0
3.5
4.0
Design guideline
1. FHWA (2008), AASHTO (2009)3. NGG (2005)6. EN 14475 (2006)7. BS8006 (1995), Geoguide 6 (2002)9. PWRC (2000)
13
0.30.1
7
10
1.3
9
12
13
1.7
2.5
Wall typeGabionSand bagsWrapped face
WSDOT (2005) 10. Welded wire12. Wrapped face - permanent13. Wrapped face - temporary
1
GW16 (EOC)
GW16 (end of surcharging)
GW10
GW3
GW36 (ω = 11o)
a)
H (m)
0 2 4 6 8 10 12 14 16
Δx/H
(%)
0.0
0.5
1.0
1.5
2.0
2.5
3.0
3.5
4.06
9
3
0.30.1
7
10
12
13
1.3
1.7
2.5
GW16 (EOC)
GW16 (end of surcharging)
GW10
GW36 (ω = 11o)
b) Figure 5. Normalized horizontal deformation for soft-faced walls Δx/H versus: a)reinforcement length ratio (L/H); b) wall height (H).
452 EARTH RETENTION CONFERENCE
452
reinforcement load capacity with depth below the wall crest according to conventional tie-back wedge methods of design. The maximum normalized wall deformations after a year of surcharging were about 1.3% which is well within the WSDOT specification of 2.5%.
GW36 was a sandbag wall that was constructed to a facing batter of 11 degrees from the vertical and geotextile reinforcement spacing of Sv = 0.25 m. The experience of the writers with the test walls constructed at RMC is that wall deformations and reinforcement loads decrease with increasing wall batter when all other factors remain unchanged. This is not unexpected based on conventional notions of active earth pressure theory.
Taken together the data in Figure 5 leads to the conclusion that current WSDOT (2006) tolerances for soft-faced walls at end of construction are reasonable and the FHWA/AASHTO curve does well in the range of 0.7 ≤ L/H ≤ 1.0. The current Scandinavian code (NGG 2005) is satisfied in only one instance despite the observation that all walls in this figure with the exception of GW10 have performed satisfactorily. LONG-TERM FACING DEFORMATIONS Most of the data presented in Figures 3 and 5 are for deformations measured at or soon after the end of construction. It is well known that polymeric reinforcement materials will creep under load, particularly geosynthetics manufactured from polyolefins (high density polyethylene and polypropylene). Indeed, current design practice is to use creep-limited tensile strength values in Europe and Japan, and tensile strengths from creep-to-rupture tests in North America to estimate tensile strengths available at design lifetime (e.g. after 75 years for permanent structures).
Figure 6. Cross-section of wall GW16 - WSDOT Rainier Ave wrapped-facegeotextile wall.
453EARTH RETENTION CONFERENCE
453

Since geosynthetic reinforcement materials will creep under load (as will granular soils but less so) if loads are high enough, it may be expected that the wall facing will continue to deform over time as well; if so will these deformations exceed limits discussed in the previous section? A number of case studies collected by the writers have data that can attempt to answer this question.
Figure 7a shows maximum facing deformations recorded against log-time for walls with post-construction wall deformation measurements. The data have been
Time since end of construction (EOC) (hours)
1 10 100 1000 10000 100000 1000000
Def
orm
atio
n, Δ
x (m
m)
0102030405060708090
100Design life = 75 years
(657,000 hours)
50 GW9
88 GW17
52 GW30
68 GW4363 GW44
13 GW35R20 GW32L
GW30 SegmentalGW9 Segmental
GW32L Incremental concrete panelGW32R Incremental concrete panel
GW43 SegmentalGW44 Berkeley wall (segmental) GW17 Full height concrete panel
Projected deformation (mm)
a)
Number of log cycles (hours)
Nom
aliz
ed d
efor
mat
ion,
Δx
/ (H
+S) (
%)
0.0
0.2
0.4
0.6
0.8
1.0
1.2
1.4
GW9(0.60%)
GW17 (1.24%)
GW30(0.63%)
GW43(0.80%)
GW44(0.44%)
GW32R(0.21%)
GW32L(0.31%)
# log cycle (hours)Δ (Δx/(H+S)) %
0.06
= 0.18
0.120.07
0.04
0.03
0.02
1 2 3 4 5 60
b) Figure 7. Projected post-EOC deformations at 75-year design life: a) Δx versus timesince EOC; b) Δx/(H+S) versus number of log time cycles since start of creepdeformation readings.
454 EARTH RETENTION CONFERENCE
454

extrapolated out to 75 years using the regressed log-linear line fitted to each data set. At low geosynthetic strains typical of the walls in the available database, creep of the reinforcement layers is considered to be very low and may have for practical purposes stopped soon after the wall was completed. Hence, the projections shown are considered to be upper-bound values. The largest projected deformations of 88 mm in the figure correspond to the 7.1-m high (GW17) concrete panel wall discussed earlier. Many of the walls are segmental type and the additional projected deformations for these walls vary widely from 13 mm to 68 mm. In order to isolate wall creep rates, the data in Figure 7a have been re-plotted using the intersection of the regressed line with horizontal axis as datum. The rates of change of normalized deformation (slopes of the lines) are shown in Figure 7b. The wall height is expressed as (H+S) in this plot since in some cases there was a small uniform surcharge (q) applied to the wall backfill surface and it is expressed as an equivalent height S = q/γ where γ is soil unit weight. The maximum post-EOC normalized creep rate for GW17 is computed as 0.18% of the wall height per log cycle time in hours. The projected additional deformation as a percent of wall height is 1.24% which is effectively the total 75-year deformation since there were only a few millimeters of initial movement at prop release. The 1.24% value is still below the FHWA/AASHTO curve shown in Figure 3a for this particular panel. INFLUENCE OF REINFORCEMENT STIFFNESS AND COMPACTION An experimental program of instrumented full-scale reinforced soil walls has been recently completed at the Royal Military College of Canada (e.g. Bathurst et al. 2000, 2009). A total of 11 walls, 3.6 m in height were constructed in-doors. The control wall in the test series was a segmental retaining wall constructed to a target batter of 8 degrees from vertical. Each subsequent wall was constructed with one change from the control structure (Figure 8). For example, Walls 3 and 7 were nominally the same as Wall 1 but with four and 11 layers of reinforcement, respectively. The other
Figure 8. Cross-section of RMC wall with segmental (modular block facing).
455EARTH RETENTION CONFERENCE
455

parameters that were changed between walls were: 1) strength and stiffness of the reinforcement layers; 2) facing type (segmental, wrapped face, incremental concrete panel; 3) facing batter (8, 13 and 25 degrees). The strategy was to isolate the contribution of each of these parameters on wall performance.
Following construction, the walls were uniform surcharged in stages to levels well in excess of working stresses in order to encourage large deformations and reinforcement strains. An advantage of this experimental program was that performance trends that are masked between field walls due to a large number of unquantifiable factors were largely avoided by using the same backfill material (high quality medium sand) and construction technique/quality. As noted earlier, the reinforcement density (e.g. number of reinforcement layers per wall) can be expected to influence wall deformations when all other factors remain the same. A similar quantity that better captures the influence of both number of reinforcement layers and reinforcement stiffness is the global reinforcement stiffness value Sglobal computed as (Allen et al. 2003):
n
global ii 1
1S JH =
= ∑
Here: Ji = T/ε = the secant tensile stiffness of an individual reinforcement layer, where T = tensile load in units of force per running length of wall and ε = strain; n = number of reinforcement layers, and; H = wall height. Examination of this equation shows that global stiffness increases with stiffness of the reinforcement. The stiffness of the reinforcement can be computed in many ways. However, the writers have demonstrated that the operative stiffness of the reinforcement is best computed using laboratory constant load tests (or temperature-accelerated creep testing) or constant rate-of-creep tests taken out to 1000 hours or more and corresponding to the strain level in the reinforcement layer (Walters et al. 2002).
Figure 9a shows maximum out-of-vertical deformations at end of construction for six of the RMC walls. Segmental retaining walls are constructed in layers. Hence each row of blocks has a different (moving) datum. The deformations shown in this plot are maximum relative deformations as opposed to deviations from the target wall batter commencing at the wall toe (which was essentially fixed). During the experimental program the compaction equipment was changed from a gasoline driven plate tamper to a heavier electrical jumping jack compactor in order to avoid gasoline fumes in the enclosed laboratory space. Both devices were shown to give the same final density but the heavier device generated more lateral force against the wall facing (ratio of dynamic contact pressure estimated to be a factor of 2.6). Hence, the relative deformations of the walls were seen to decrease with increasing reinforcement global stiffness but the heavier compacted walls experienced about 60 to 80% greater deformation at end of construction (Bathurst et al. 2009).
Figure 9b shows maximum recorded post-construction deformations for the same set of walls after uniform surcharging had reached 30 kPa. The same trend of decreasing displacement with increasing global reinforcement stiffness is apparent. However, the influence of compaction intensity is judged to have disappeared. In this experimental program the initial effects of compaction were considered to have been
456 EARTH RETENTION CONFERENCE
456

erased after the addition of 30 kPa surcharge pressure or higher. This threshold surcharge level corresponds to about 1.5 m of equivalent fill height. CONCLUSIONS Reinforced soil walls are complex structures and there are at present no reliable analytical models to assist design engineers to predict facing deformations. The paper has focused largely on comparison of measured facing deformations and recommendations for anticipated movements or specified tolerances found in design guidelines. Deformation limits in codes of practice vary widely. However, current FHWA and AASHTO recommendations are found to provide reasonable upper limits in most cases for end-of-construction movements for walls constructed on firm
Global reinforcement stiffness, Sglobal (kN/m2)
10 100 1000 10000
Max
imum
rela
tive
disp
lace
men
t (m
m)
0
2
4
6
8
10
12
14
Light compactionHeavy compaction
Wall 6
Wall 1
Wall 5
Wall 3Wall 7
Wall 2
a)
Global reinforcement stiffness, Sglobal (kN/m2)
10 100 1000 10000
Pos
t-con
stru
ctio
n di
spla
cem
ent (
mm
)
0
2
4
6
8
10
12
14
Light compactionHeavy compactionWall 2
Wall 6
Wall 5
Wall 1
Wall 7Wall 3
b) Figure 9. Influence of compaction and reinforcement global stiffness on facingdisplacements: a) EOC relative displacements versus Sglobal; b) Post-constructionmaximum facing displacements at 30 kPa surcharge versus Sglobal (after Bathurst et al.2009).
457EARTH RETENTION CONFERENCE
457
foundations. The database of observed full-scale wall deformations summarized in this paper is of value to engineers as examples to select wall facing pre-batter angles and to provide post-construction clearances for adjacent structures. REFERENCES Allen, T.M. and Bathurst, R.J. (2002a). Soil reinforcement loads in geosynthetic
walls at working stress conditions. Geosynthetics International, 9(5-6): 525-566.
Allen, T.M. and Bathurst, R.J. (2002b). Observed long-term performance of geosynthetic walls, and implications for design. Geosynthetics International, 9(5-6): 567-606.
Allen, T.M. and Bathurst, R.J. (2006). Design and performance of an 11-m high block-faced geogrid wall. Proc. 8th International Conference on Geosynthetics, Yokohama, Japan, September 2006, pp. 953-956.
Allen, T.M., Bathurst, R.J. and Berg, R.R. (2002). Global level of safety and performance of geosynthetic walls: An historical perspective. Geosynthetics International, 9(5-6): 395-450.
Allen, T.M., Bathurst, R.J., Holtz, R.D., Walters, D.L. and Lee, W.F. (2003). A new working stress method for prediction of reinforcement loads in geosynthetic walls. Canadian Geotechnical Journal, 40(5): 976-994.
American Association of State Highway and Transportation Officials (AASHTO). (2009). Interim LRFD Bridge Design Specifications. 4th ed., Washington, D.C., USA.
Bathurst, R.J. (1991). Case study of a monitored propped panel wall. Proc. International Symposium on Geosynthetic-Reinforced Soil Retaining Walls, Denver Colorado, August 1991, pp. 159-166.
Bathurst, R.J., Allen, T.M. and Walters, D.L. (2002). Short-term strain and deformation behavior of geosynthetic walls at working stress conditions. Geosynthetics International, 9(5-6): 451-482.
Bathurst, R.J., Miyata, Y., Nernheim, A. and Allen, T.M. (2008). Refinement of K-stiffness method for geosynthetic reinforced soil walls. Geosynthetics International, 15(4): 269-295.
Bathurst, R.J., Nernheim, A., Walters, D.L., Allen, T.M., Burgess, P. and Saunders, D. (2009). Influence of reinforcement stiffness and compaction on the performance of four geosynthetic reinforced soil walls. Geosynthetics International, 16(1): 43-59.
Bathurst, R.J., Simac, M.R., Christopher, B.R. and Bonczkiewicz, C. (1993). A database of results from a geosynthetic reinforced modular block soil retaining wall. Proc. Soil Reinforcement: Full Scale Experiments of the 80's, ISSMFE/ENPC, Paris, France, November 1993, pp. 341-365.
Bathurst, R.J., Simac, M.R. and Sandri, D. (1995). Lessons learned from the construction performance of a 14 m high segmental retaining wall. Proc. Geosynthetics: Lessons Learned from Failures. Nashville, Tennessee, February 1995, 15 p.
Berg, R.R., Bonaparte, R., Anderson, R.P. and Chouery, V.E. (1986). Design,
458 EARTH RETENTION CONFERENCE
458
construction, and performance of two geogrid reinforced soil retaining walls. Proc. Third International Conference on Geotextiles, Vol. 2, Vienna, Austria, April 1986, pp. 401-406.
BS8006 (1995). Code of Practice for Strengthened/Reinforced Soil and Other Fills. British Standards Institution, Milton Keynes, U.K.
Christopher, B.R., Gill, S.A., Giroud, J.P., Mitchell, J.K., Schlosser, F. and Dunnicliff, J. (1989). Reinforced Soil Structures: Vol I, Design and Construction Guidelines; Vol II, Summary of Research and Systems Information. FHWA RD 89-043, Federal Highway Administration, Washington, D.C.
EN 14475 (2006). Execution of special geotechnical works – Reinforced fill. European Standard.
Geoguide 6 (2002). Guide to Reinforced Fill Structure and Slope Design. Geotechnical Engineering Office, Hong Kong, China.
Holtz, R.D., Christopher, B.R. and Berg, R.R. (FHWA) (2008). Geosynthetic Design and Construction Guidelines. FHWA NHI-07-092, Federal Highway Administration, Washington, D.C.
Kojima, K., Sakamoto, N., Tateyama, M. and Maruyama, 0. (1996). Geosynthetic-reinforced soil retaining wall using clay on a very soft ground for Hokuriku bullet train yard in Nagano. Proc. International Symposium on Earth Reinforcement, Fukuoka, Japan, Vol. 1, pp. 227-232.
Miyata, Y. and Bathurst, R.J. (2007a). Development of K-stiffness Method for geosynthetic reinforced soil walls constructed with c-φ soils. Canadian Geotechnical Journal, 44(12): 1391-1416.
Miyata, Y. and Bathurst, R.J. (2007b). Evaluation of K-stiffness Method for vertical geosynthetic reinforced granular soil walls in Japan. Soils and Foundations, 47(2): 319-335.
Miyata, Y., Fukuda, N., Kojima, K., Konami, T. and Otani, Y. (2003). Design of reinforced soil wall - Overview of design manuals in Japan. Proc. International Symposium on Earth Reinforcement, Fukuoka, Japan, Vol. 2, pp. 1107-1114.
NCMA (2009). Design Manual for Segmental Retaining Walls, (3rd ed.). National Concrete Masonry Association, (ed. M. Bernardi), Herndon, VA, USA.
Nordic Geosynthetic Group (NGG) (2005). Nordic Guidelines for Reinforced Soils and Fills. Nordic Geosynthetic Group, www.sgf.net
PWRC (2000). Design and Construction Manual of Geosynthetics Reinforced Soil, (revised version). Public Works Research Center, Tsukuba, Japan, 305 p.
Tatsuoka, F. (1993). Roles of facing rigidity in soil reinforcing, Keynote Lecture. Proc. Earth Reinforcement Practice, Fukuoka, Japan, Vol. 2, pp. 831-870.
WSDOT (2006). Geotechnical Design Manual, M 46-03, Chapter 15 Abutments, retaining walls, and reinforced slopes. Washington State Department of Transportation, Olympia, Washington, USA.
Walters, D.L., Allen, T.M. and Bathurst, R.J. (2002). Conversion of geosynthetic strain to load using reinforcement stiffness. Geosynthetics International, 9(5-6): 483-523.
459EARTH RETENTION CONFERENCE
459