facilitating data-driven decision making under non ......facilitating data-driven decision making...
TRANSCRIPT
Facilitating Data-Driven Decision Making Under
Non-Standard Conditions: The Curtailment Operations Planner
Lib Reid McGowan, MS, CEM, CDSM, CEA
Energy Data Analyst
North Carolina State University
2017 NCAPPA Conference
North Carolina Central University
May 18, 2017


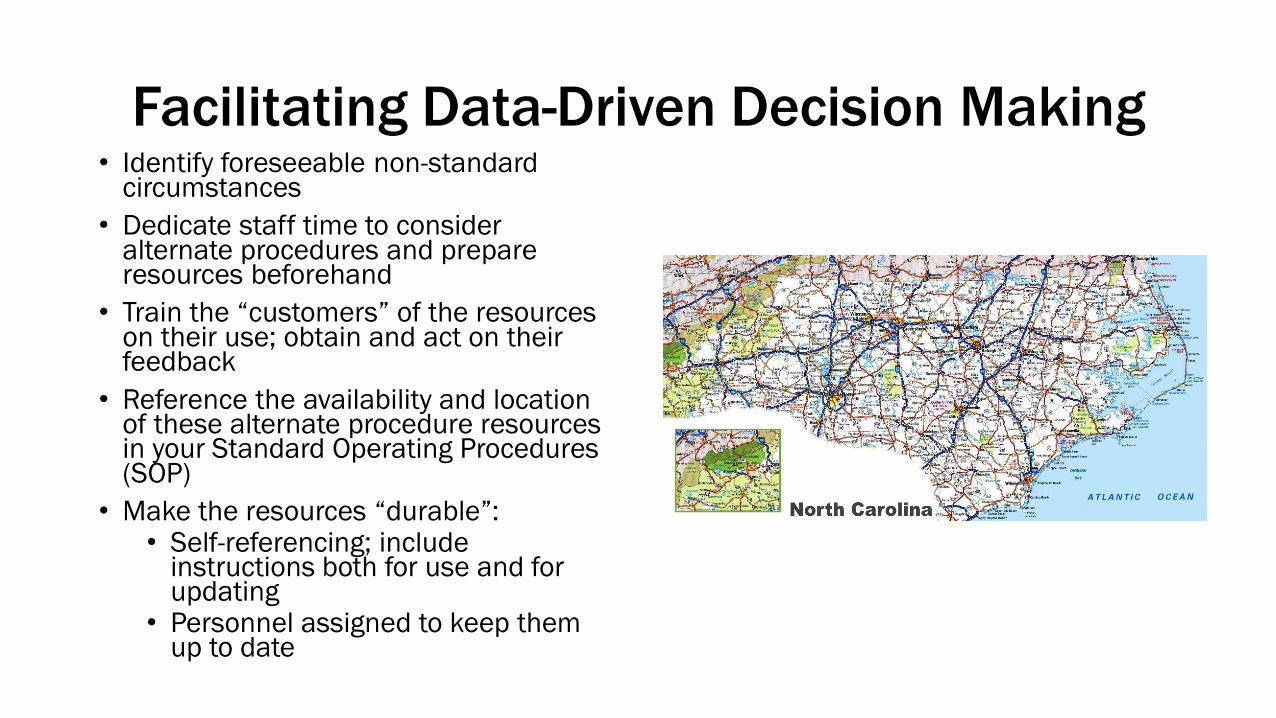
Facilitating Data-Driven Decision Making• Identify foreseeable non-standard
circumstances
• Dedicate staff time to consider alternate procedures and prepare resources beforehand
• Train the “customers” of the resources on their use; obtain and act on their feedback
• Reference the availability and location of these alternate procedure resources in your Standard Operating Procedures (SOP)
• Make the resources “durable”: • Self-referencing; include
instructions both for use and for updating
• Personnel assigned to keep them up to date

Natural
Gas Curtailment

Interruptible Gas Rates
• An option for large natural gas customers who have the ability to temporarily suspend gas-using operations or operate on an alternative fuel source
• Lower prices in return for the ability to temporarily cut off the gas supply
• In some cases, firm delivery may not be an available option
$0
$20,000
$40,000
$60,000
$80,000
$100,000
$120,000
$140,000
Jan
2016
Feb
2016
Mar
2016
Apr
2016
May
2016
Jun
2016
Jul
2016
Aug
2016
Sep
2016
Oct
2016
Nov
2016
Dec
2016
Natural Gas Transportation Costs for Plant
Firm vs Interruptible Rate
Firm Interruptible

Options for Plants when Gas is Curtailed

Cates and Yarbrough Utility Plants
• Yarbrough Plant• Boiler 3 (100 kpph)
• Boiler 4 (100 kpph)
• Boiler 2 (100 kpph)
• Steam Chiller (2000 tons)
• 4 Electric Chillers (2000 tons each)
• Cates Cogeneration Plant• (2) 5.5 MW Combustion
Turbine Generators (CTGs)
• (2) 50 kpph Heat Recovery Steam Generators (HRSGs)
• 2 Electric Chillers (2000 tons each)
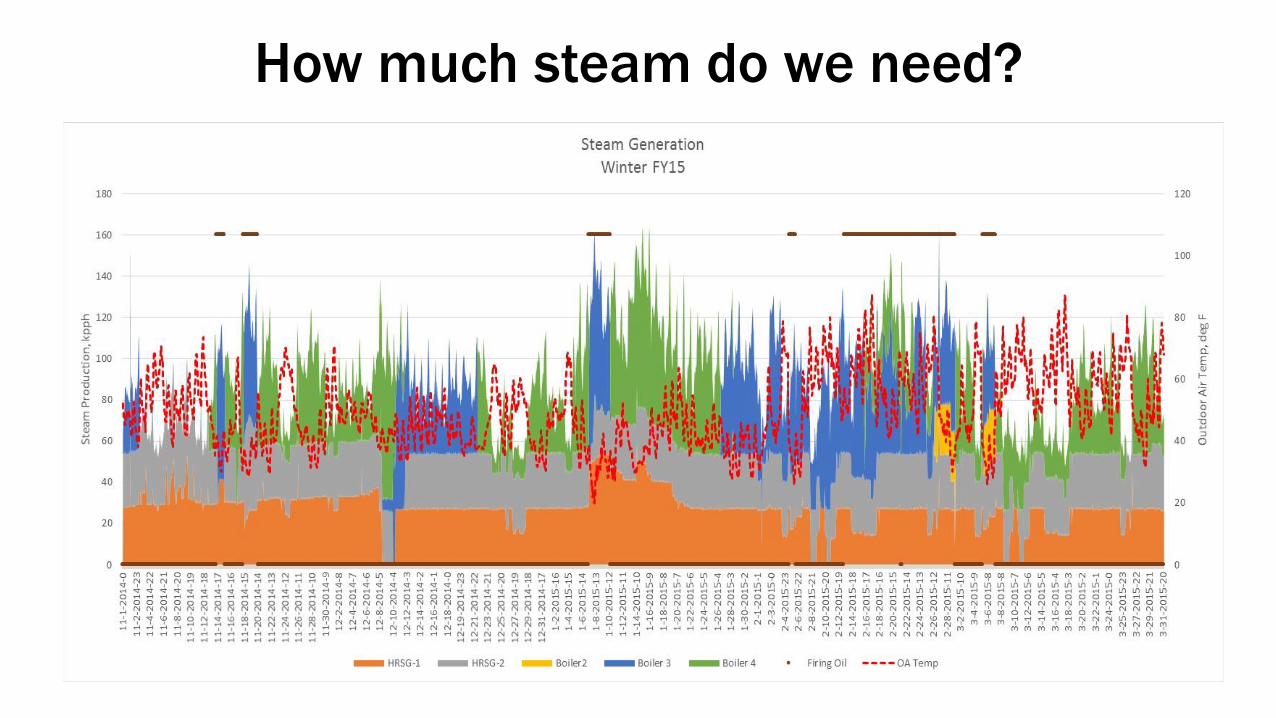
How much steam do we need?
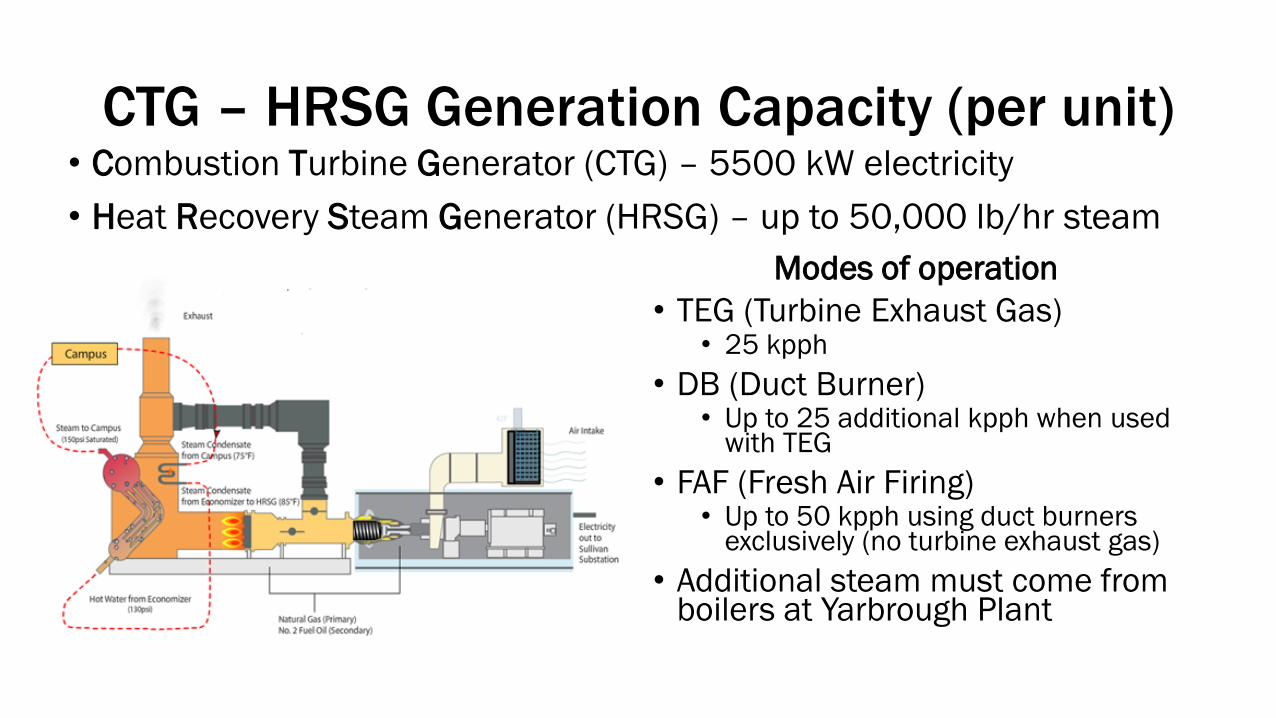
CTG – HRSG Generation Capacity (per unit)• Combustion Turbine Generator (CTG) – 5500 kW electricity
• Heat Recovery Steam Generator (HRSG) – up to 50,000 lb/hr steam
Modes of operation
• TEG (Turbine Exhaust Gas)• 25 kpph
• DB (Duct Burner)• Up to 25 additional kpph when used
with TEG
• FAF (Fresh Air Firing)• Up to 50 kpph using duct burners
exclusively (no turbine exhaust gas)
• Additional steam must come from boilers at Yarbrough Plant

Fuel Rates for Steam Production Options
Mode of Operation Gal oil per klb steam production
CTG, TEG mode (25 kpph total per CTG) 18.0
Incremental Duct Burner (when CTG is operated) 7.1
HRSG – Fresh Air Firing (duct burner with no CTG) 9.5
Boiler 3 8.2
Boiler 4 8.7
Boiler 2 10.2

How Curtailment Affects Cogeneration
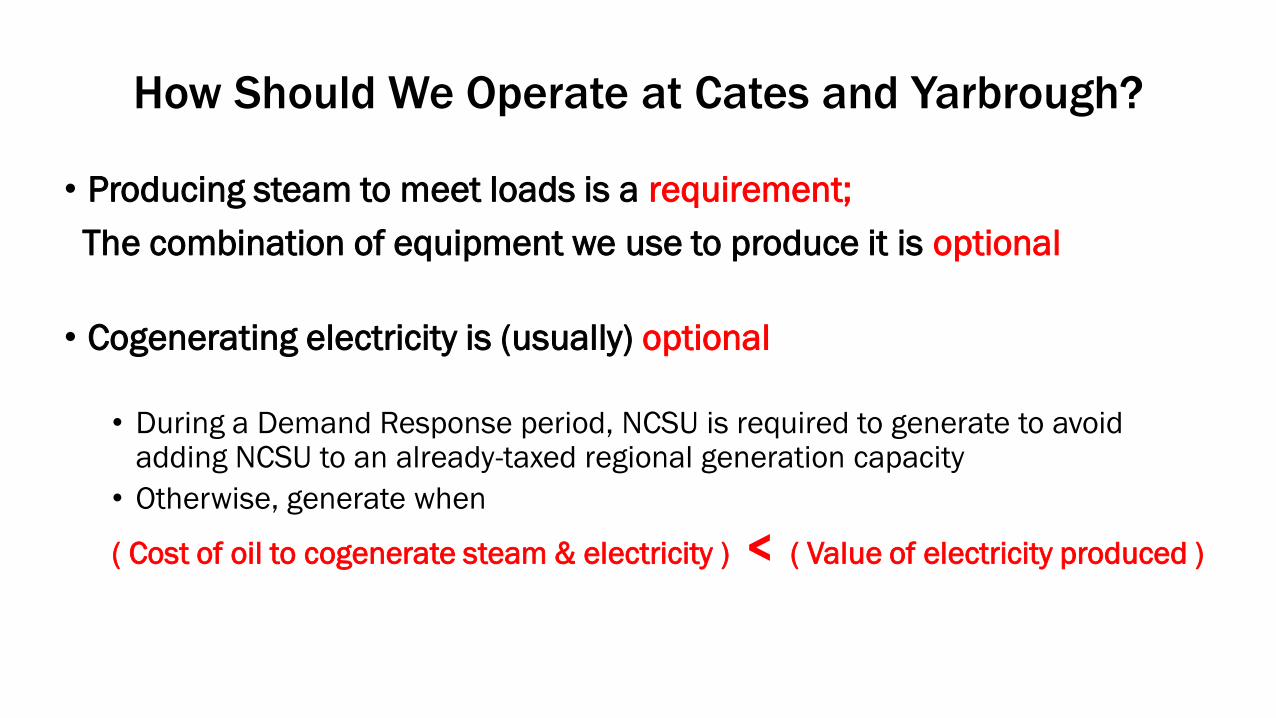
How Should We Operate at Cates and Yarbrough?
• Producing steam to meet loads is a requirement;
The combination of equipment we use to produce it is optional
• Cogenerating electricity is (usually) optional
• During a Demand Response period, NCSU is required to generate to avoid adding NCSU to an already-taxed regional generation capacity
• Otherwise, generate when
( Cost of oil to cogenerate steam & electricity ) < ( Value of electricity produced )
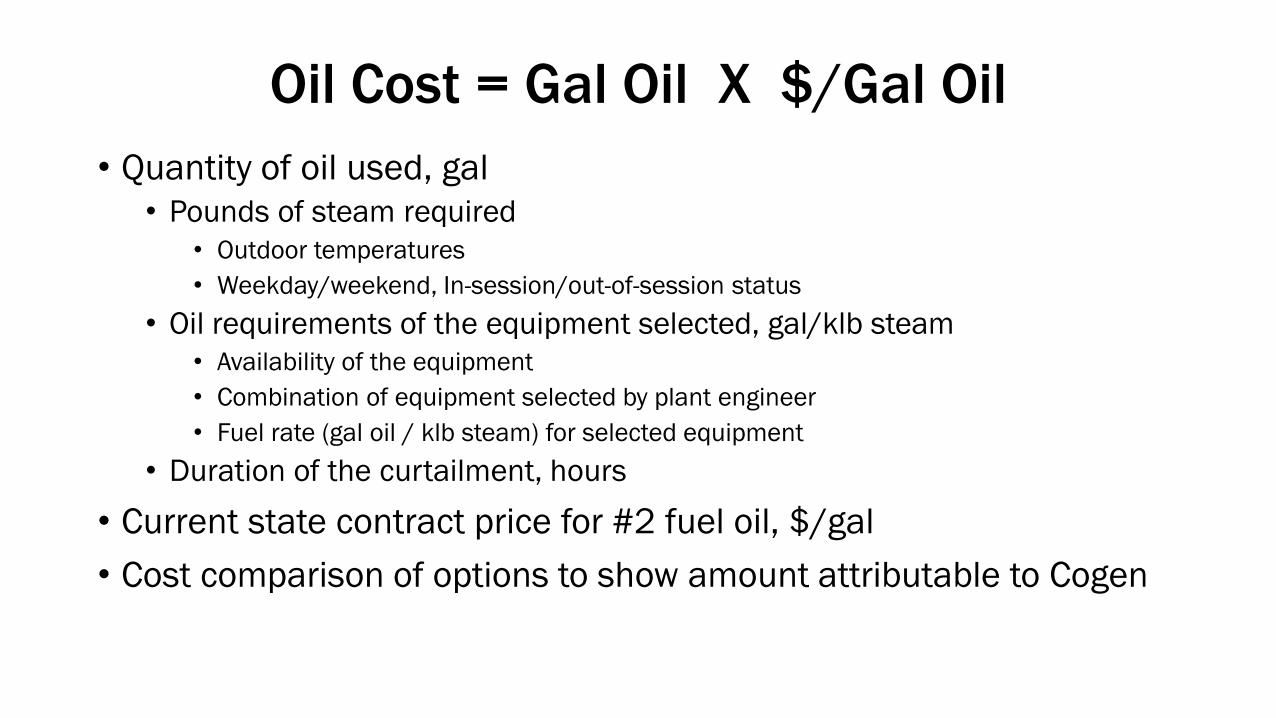
Oil Cost = Gal Oil X $/Gal Oil
• Quantity of oil used, gal
• Pounds of steam required
• Outdoor temperatures
• Weekday/weekend, In-session/out-of-session status
• Oil requirements of the equipment selected, gal/klb steam
• Availability of the equipment
• Combination of equipment selected by plant engineer
• Fuel rate (gal oil / klb steam) for selected equipment
• Duration of the curtailment, hours
• Current state contract price for #2 fuel oil, $/gal
• Cost comparison of options to show amount attributable to Cogen
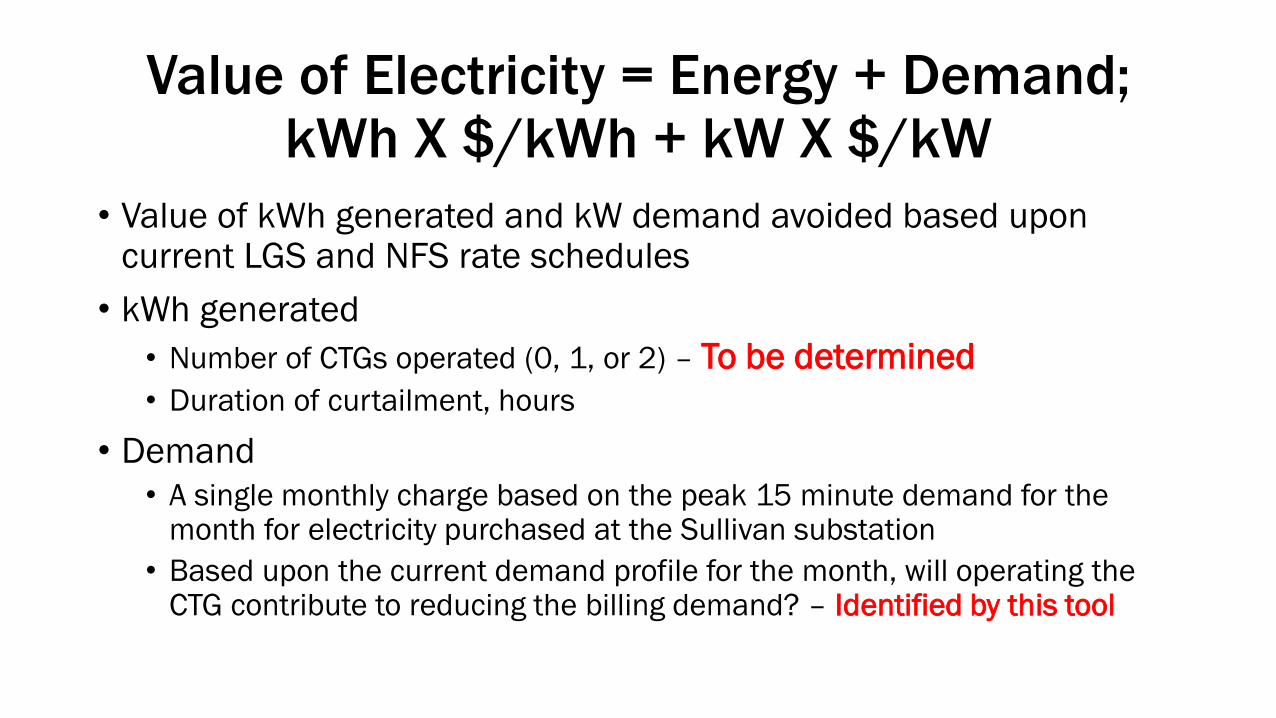
Value of Electricity = Energy + Demand; kWh X $/kWh + kW X $/kW
• Value of kWh generated and kW demand avoided based upon current LGS and NFS rate schedules
• kWh generated
• Number of CTGs operated (0, 1, or 2) – To be determined
• Duration of curtailment, hours
• Demand
• A single monthly charge based on the peak 15 minute demand for the month for electricity purchased at the Sullivan substation
• Based upon the current demand profile for the month, will operating the CTG contribute to reducing the billing demand? – Identified by this tool
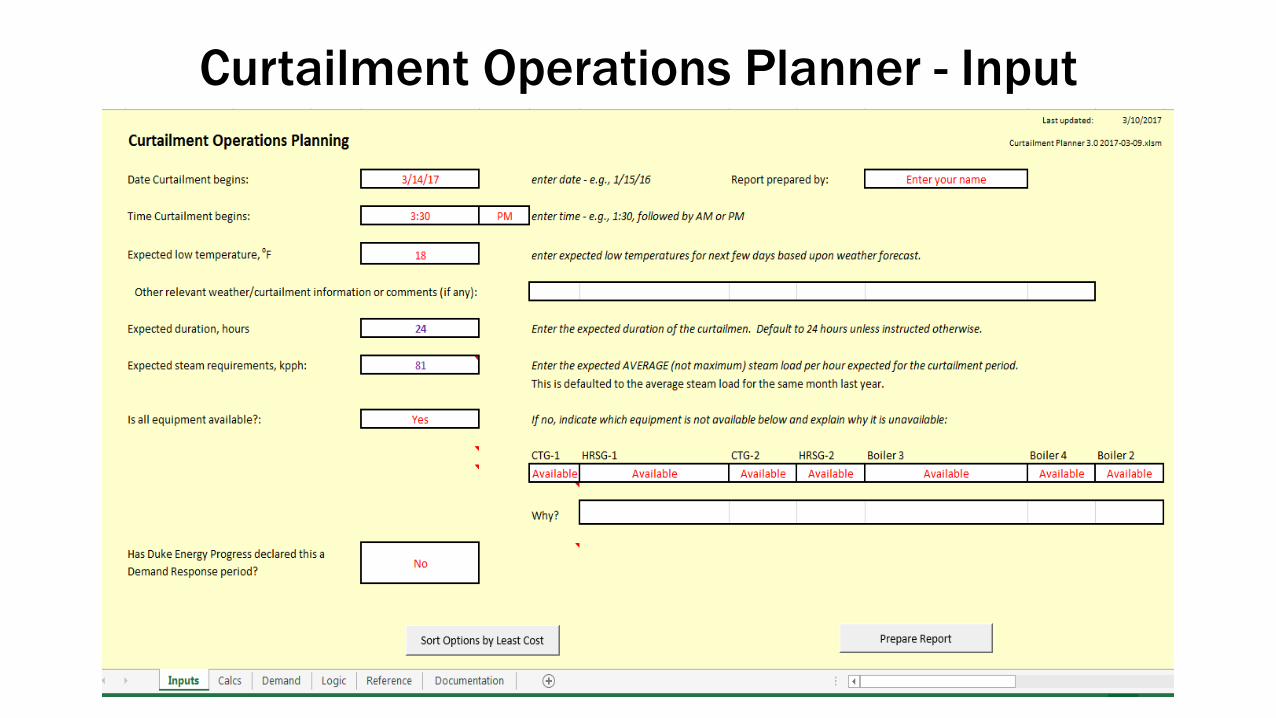
Curtailment Operations Planner - Input
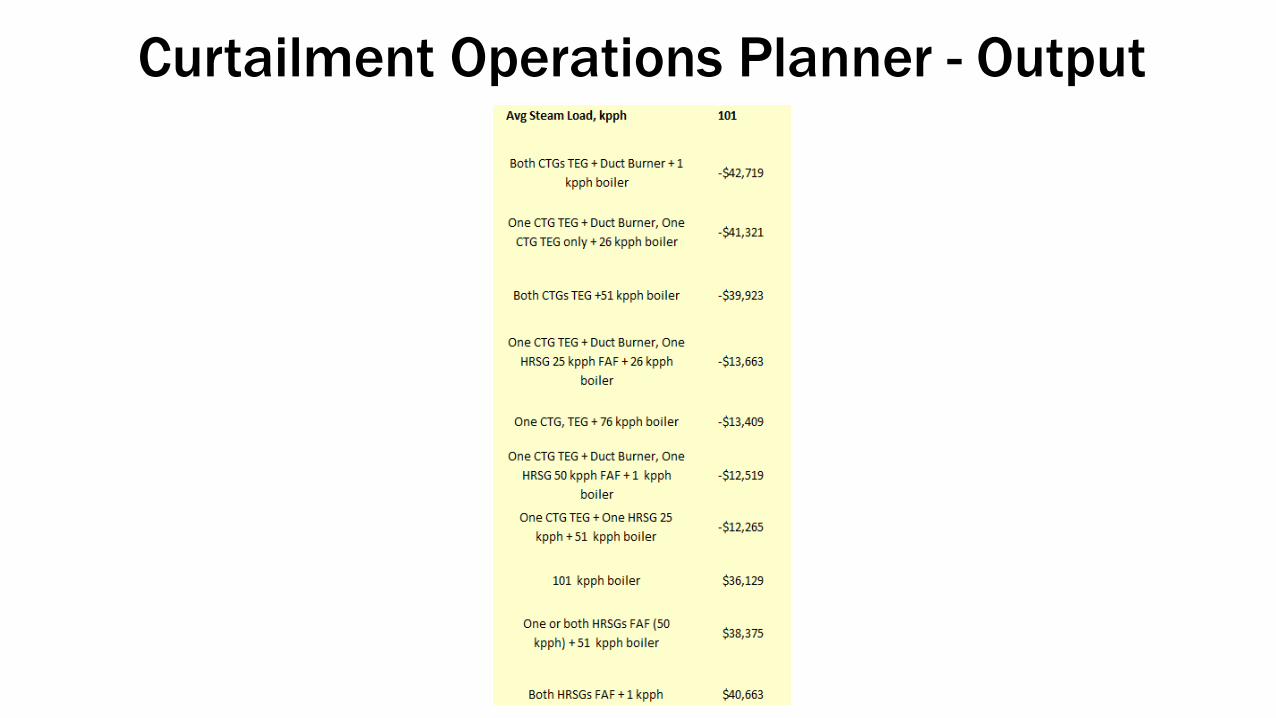
Curtailment Operations Planner - Output
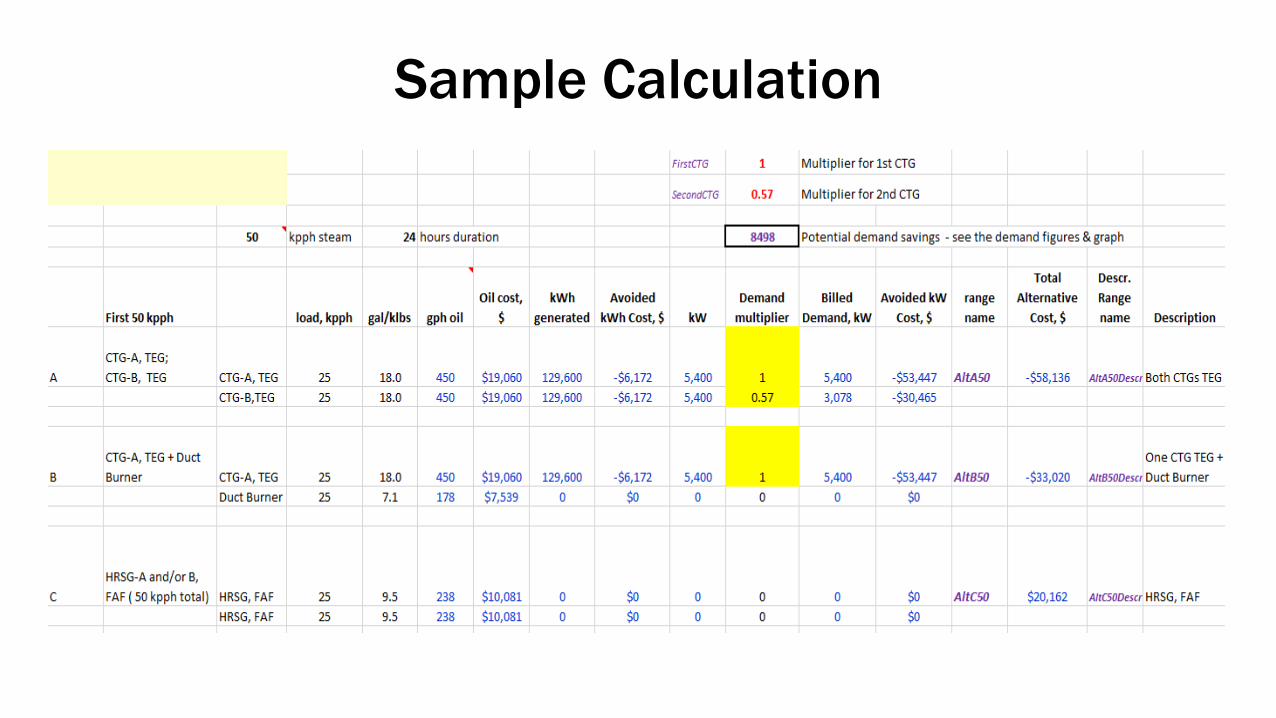
Sample Calculation
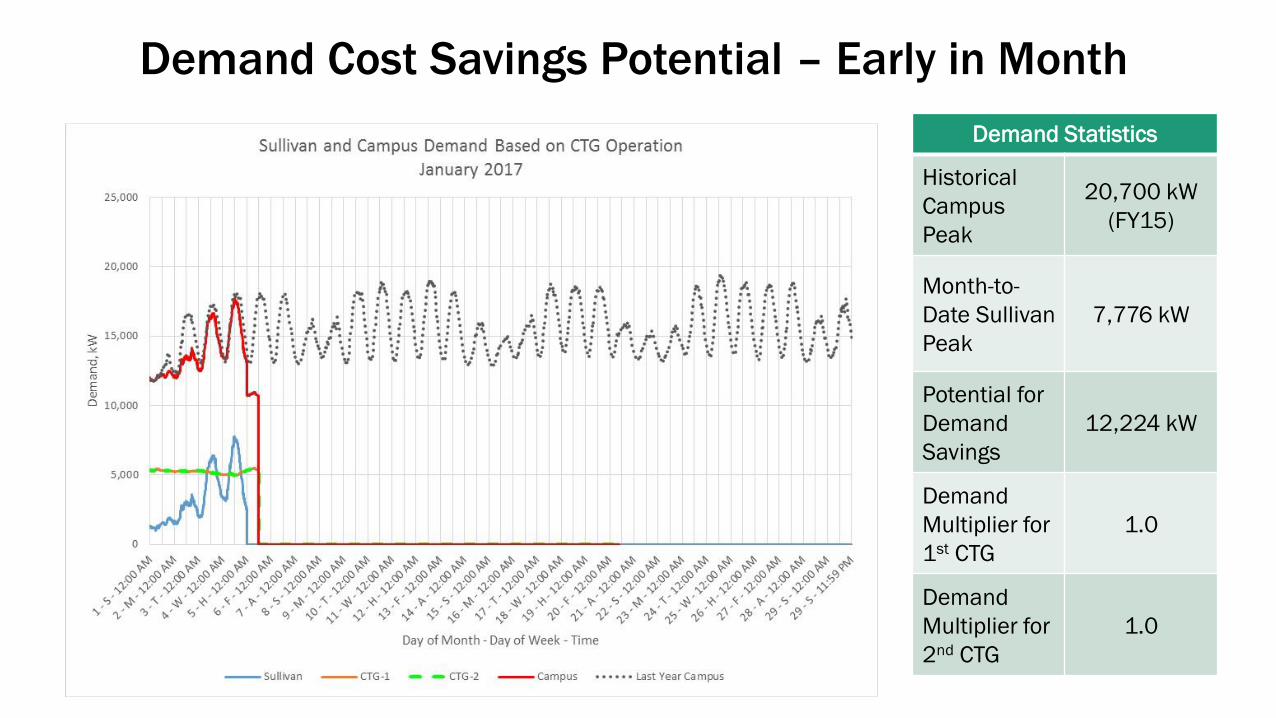
Demand Cost Savings Potential – Early in Month
Demand Statistics
Historical
Campus
Peak
20,700 kW
(FY15)
Month-to-
Date Sullivan
Peak
7,776 kW
Potential for
Demand
Savings
12,224 kW
Demand
Multiplier for
1st CTG
1.0
Demand
Multiplier for
2nd CTG
1.0
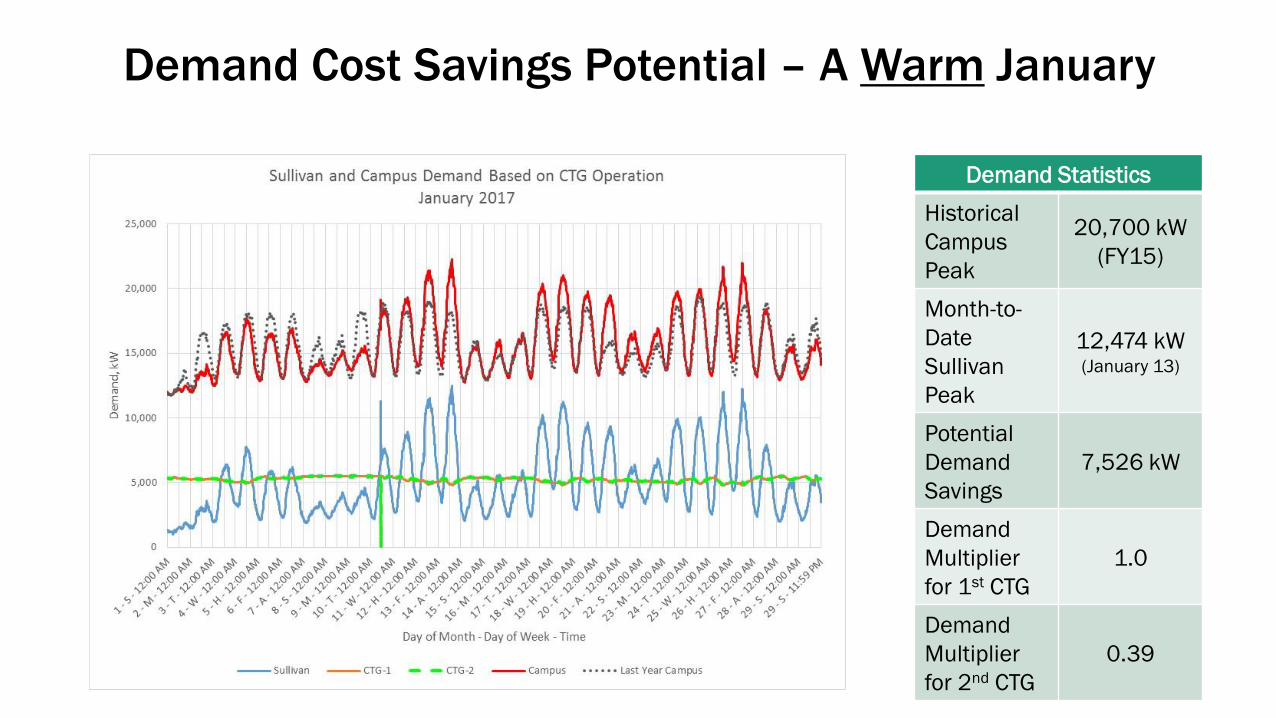
Demand Cost Savings Potential – A Warm January
Demand Statistics
Historical
Campus
Peak
20,700 kW
(FY15)
Month-to-
Date
Sullivan
Peak
12,474 kW (January 13)
Potential
Demand
Savings
7,526 kW
Demand
Multiplier
for 1st CTG
1.0
Demand
Multiplier
for 2nd CTG
0.39
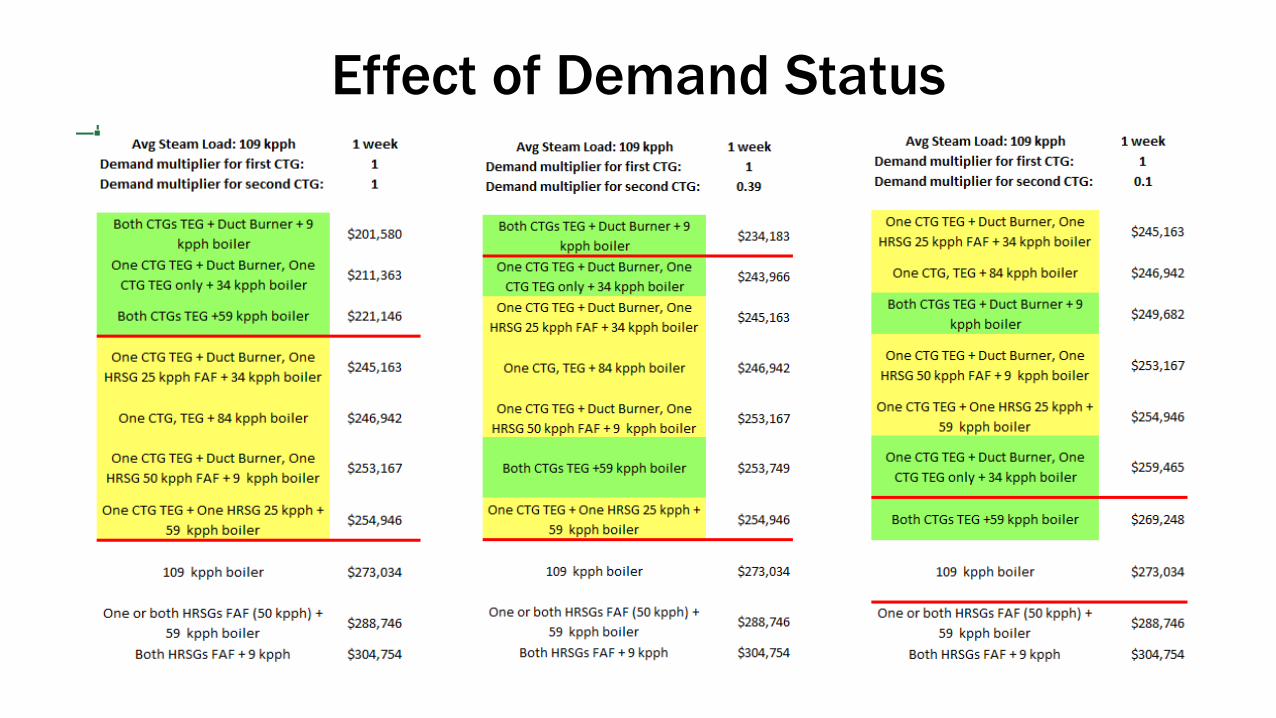
Effect of Demand Status
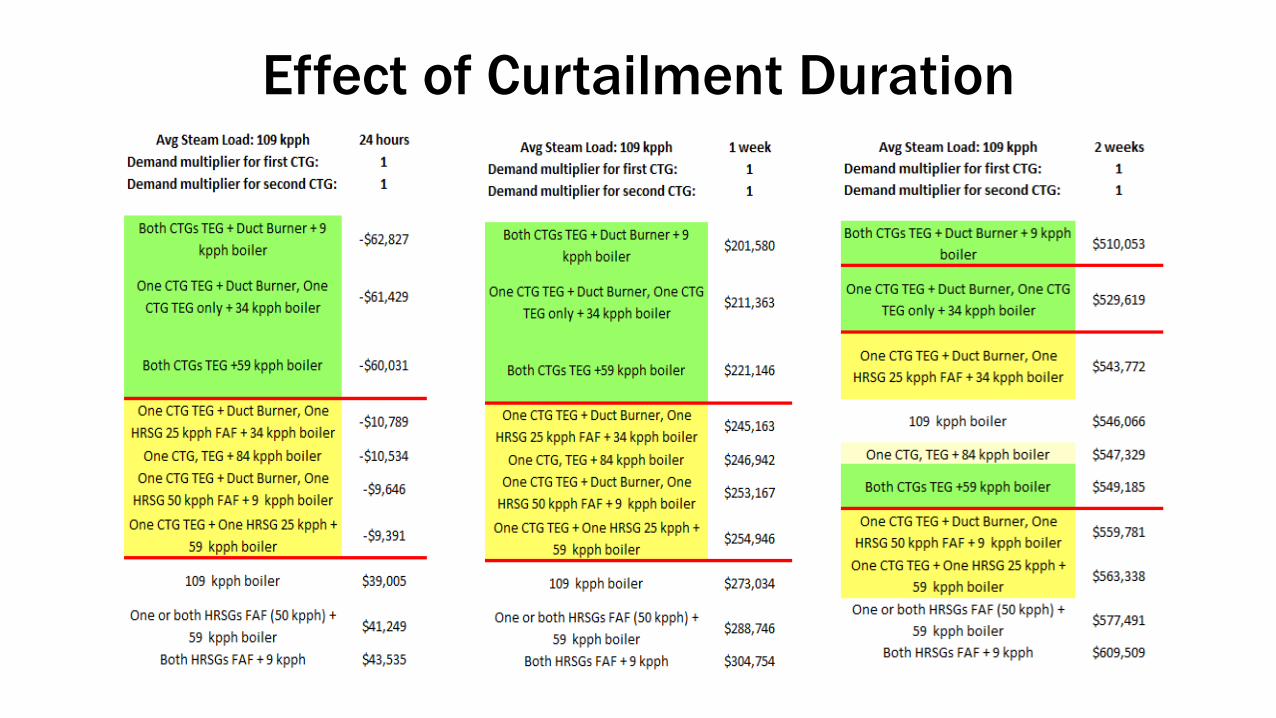
Effect of Curtailment Duration
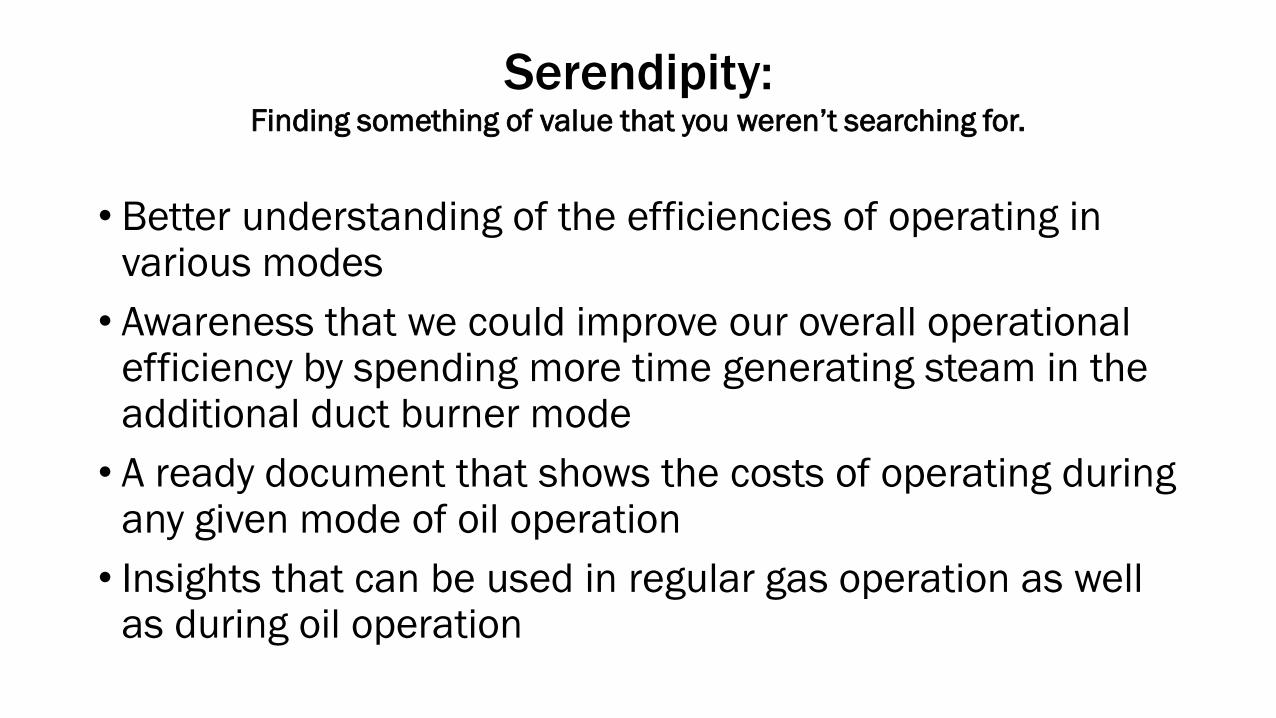
Serendipity:Finding something of value that you weren’t searching for.
• Better understanding of the efficiencies of operating in various modes
• Awareness that we could improve our overall operational efficiency by spending more time generating steam in the additional duct burner mode
• A ready document that shows the costs of operating during any given mode of oil operation
• Insights that can be used in regular gas operation as well as during oil operation

What Non-Standard Procedures Do You Plan For?
Adverse Weather Events ?
Utility Outages ?
Burst Pipes / Flooding ?
Others ?
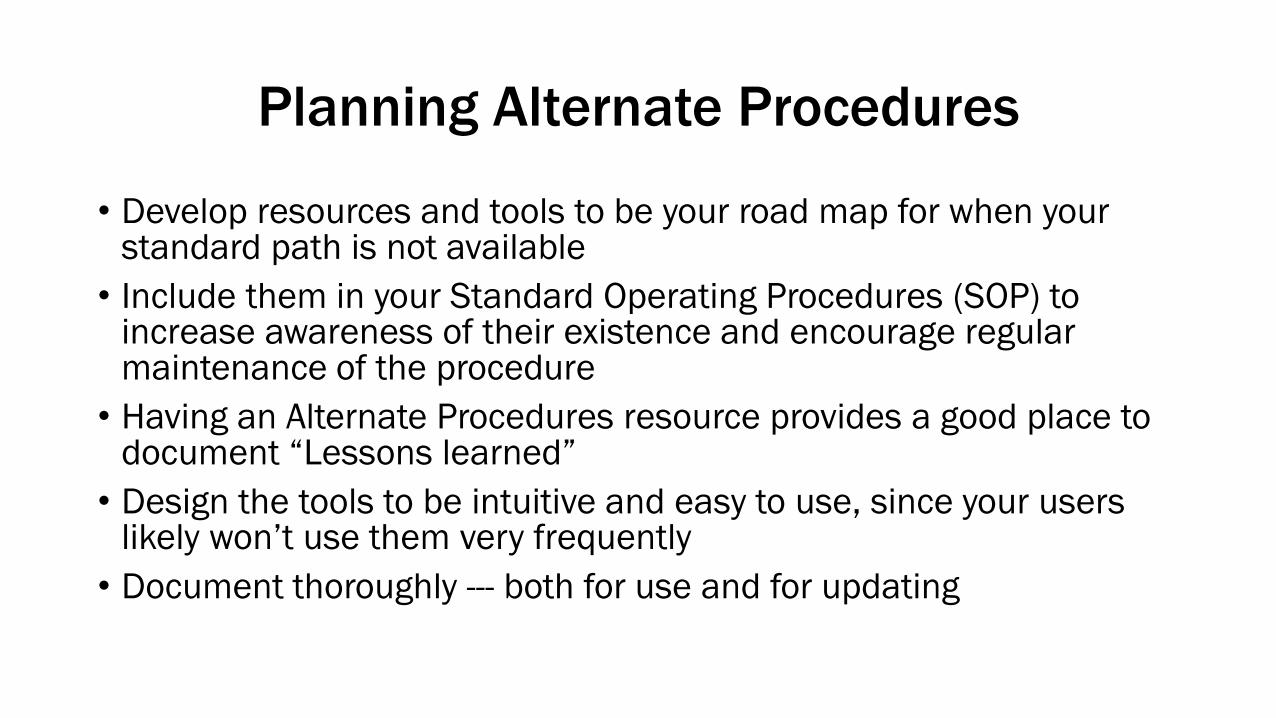
Planning Alternate Procedures
• Develop resources and tools to be your road map for when your standard path is not available
• Include them in your Standard Operating Procedures (SOP) to increase awareness of their existence and encourage regular maintenance of the procedure
• Having an Alternate Procedures resource provides a good place to document “Lessons learned”
• Design the tools to be intuitive and easy to use, since your users likely won’t use them very frequently
• Document thoroughly --- both for use and for updating
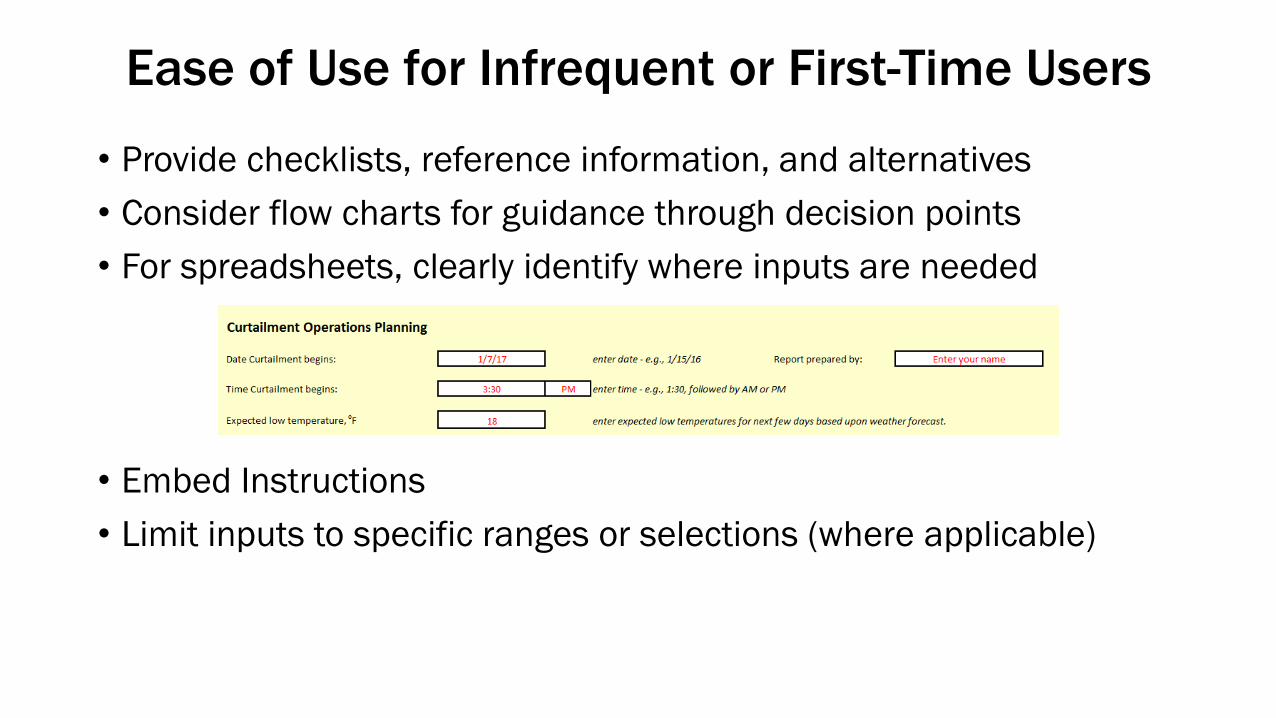
Ease of Use for Infrequent or First-Time Users
• Provide checklists, reference information, and alternatives
• Consider flow charts for guidance through decision points
• For spreadsheets, clearly identify where inputs are needed
• Embed Instructions
• Limit inputs to specific ranges or selections (where applicable)
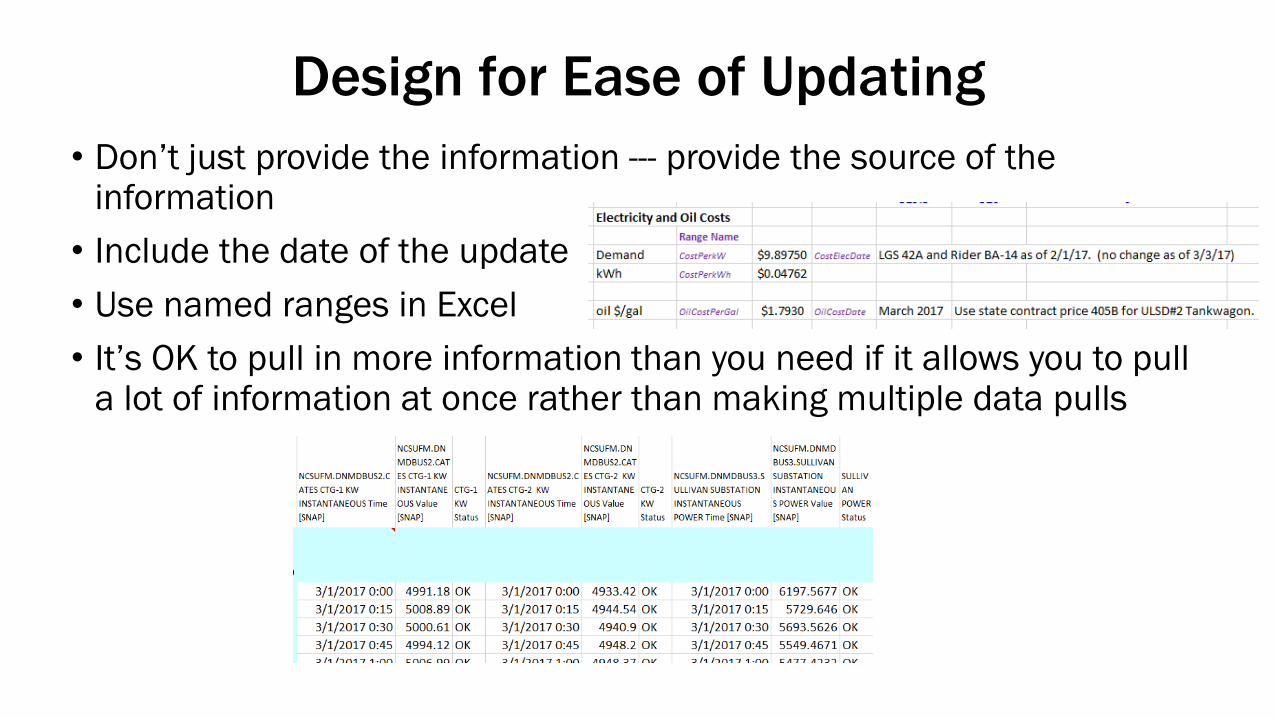
Design for Ease of Updating
• Don’t just provide the information --- provide the source of the information
• Include the date of the update
• Use named ranges in Excel
• It’s OK to pull in more information than you need if it allows you to pull a lot of information at once rather than making multiple data pulls
Documentation and Archiving
• Living documents are great --- but you will appreciate having a dated snapshot of previous versions as reference
• Include version/update date in the filename
• Avoid the allure of linked Excel files
• Consider distributing pdf versions rather than editable files (but don’t lose the live file!)
• Use self-documentation to avoid having it get separated from the document
• Gmail is the poor university employee’s archive
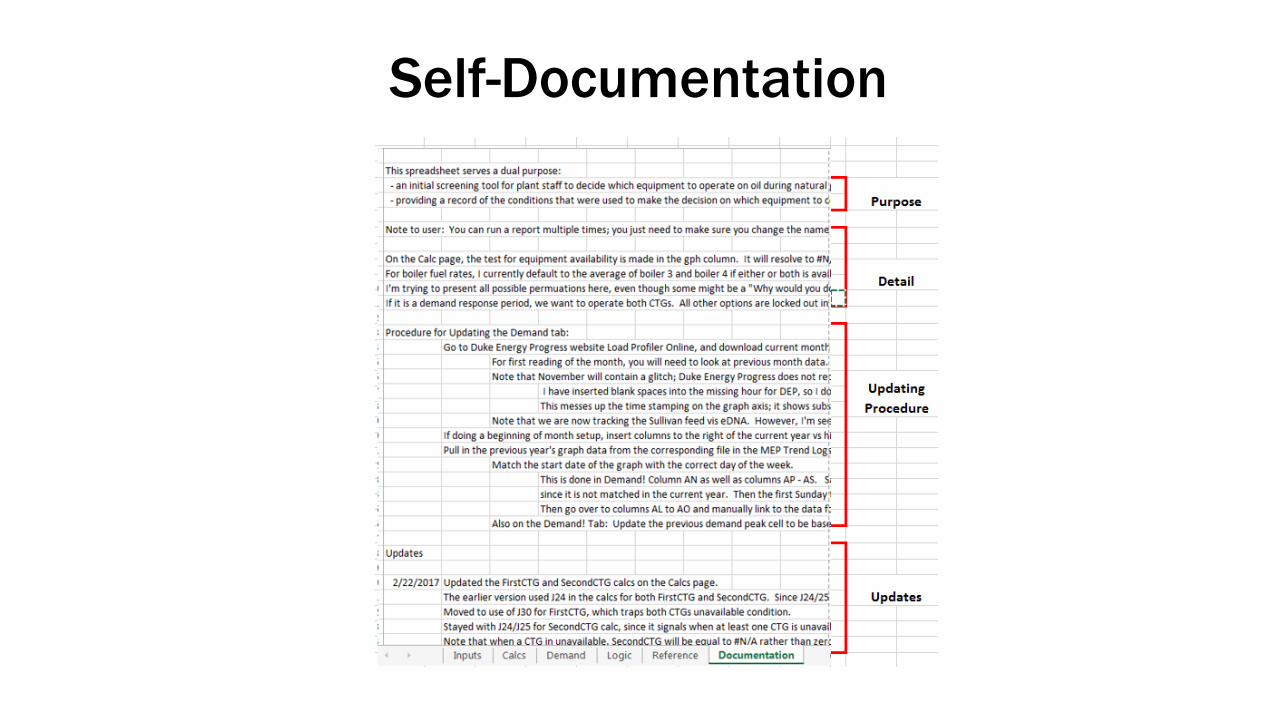
Self-Documentation
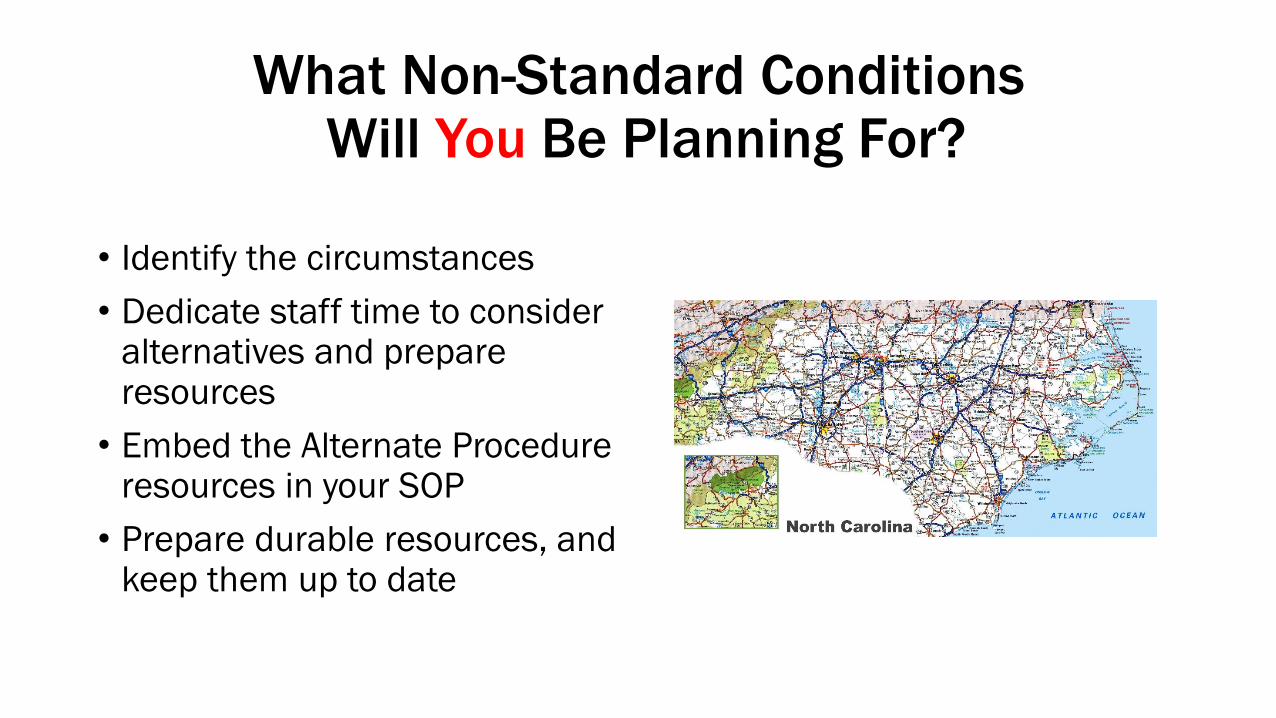
What Non-Standard ConditionsWill You Be Planning For?
• Identify the circumstances
• Dedicate staff time to consider alternatives and prepare resources
• Embed the Alternate Procedure resources in your SOP
• Prepare durable resources, and keep them up to date
Questions? Comments?
Lib Reid McGowan, MS, CEM, CDSM, CEA
Energy Data Analyst
Energy Management
North Carolina State University