facets can understanding facets of personality lead to a better understanding of behaviour
TRANSCRIPT

FACETS
Can Understanding Facets of Personality lead to a Better
Understanding of Behaviour
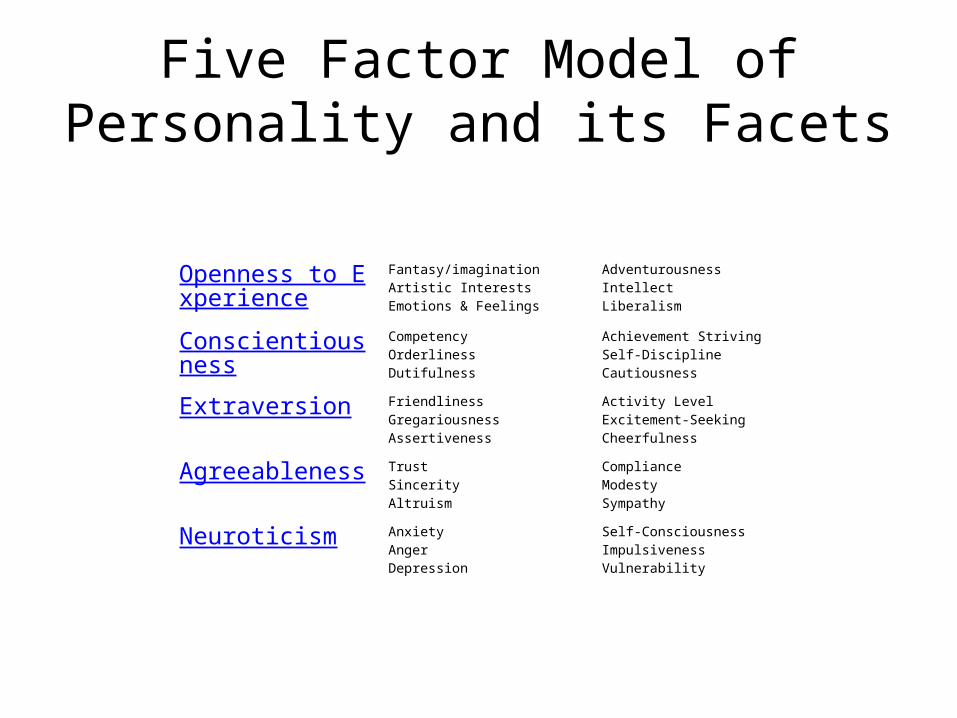
Five Factor Model of Personality and its Facets
Openness to Experience
Fantasy/imaginationArtistic InterestsEmotions & Feelings
AdventurousnessIntellectLiberalism
Conscientiousness CompetencyOrderlinessDutifulness
Achievement StrivingSelf-DisciplineCautiousness
Extraversion FriendlinessGregariousnessAssertiveness
Activity LevelExcitement-SeekingCheerfulness
Agreeableness TrustSincerityAltruism
ComplianceModestySympathy
Neuroticism AnxietyAngerDepression
Self-ConsciousnessImpulsivenessVulnerability

Impulsiveness
• One of the facets of Neuroticism• Strong cravings and urges which are difficult
to resist• Short term pleasure rather than long term
consequences

Whiteside and Lynam, 2001
• Explored the relationship between the FFM and the multi-faceted Impulsivity
• 4 distinct factors linked to N,C,E– Urgency – experience strong impulses under negative
conditions– Lack of Premeditation –Spur of the moment– Lack of Perseverance – difficulty staying focussed– Sensation seeking- enjoy and pursue risky
experiences.

Psychopathology
• Substance use– Hypothesis that impulsivity is a risk factor for
substance use (Acton, 2003),
• Antisocial Behaviour and ADHD– (Nigg et al, 2002).

Why use facets?
Paunonen and Ashton (2001)

Big Five Factors and Facets and the Prediction of Behaviour
• Hierarchy: Big Five Factors ↓ narrower traits ↓ even narrower behaviours

Behaviour variation Independent of the Big Five
• Some other variables not covered by Big Five?– Some traits independent of the 5FM?– Other personality variables that might contribute
to the prediction and understanding of behaviour beyond that achieved by the 5FM
• Debate about utility to the measurement of the narrow constituent facets of BF factors

Research Purpose
• Further evaluate the relative contributions of personality factors and personality facets to the prediction of behaviour.

Paunonen (1998)
• “aggregating personality traits into their underlying personality factors could result in decreased predictive accuracy due to the loss of trait-specific but criterion-valid variance”
• Criticism: lower level trait > higher level factor• Differences between the present study and
Paunonen’s

Method
• 141 students (46M, 95F)• 2 sessions separated by a week
– 1st session: a battery of self-report measures– 2nd session: additional self-report measures &
peer-rating form

• Personality Measures– PRF-JPI & NEO-PI-R – (self-report; both lower level traits and higher level
factors)
• Criterion Measures:– Behaviour Report Form (self-rated & peer-rated);
pencil-paper task; experimenter rating; university record; other records.
• Rater Judgments– Personality-Criterion Association

Results• Overview• Reliability of Rater Judgments:
– PRF-JPI mean 0.39• 0.72 mean reliability for combined panel of 5 judges
– NEO-PI-R mean 0.50• 0.81 mean reliability for 5-member panel.
• Reliability of Personality Measures– Internal consistency and reliability of self-reports
on PRF-JPI trait scales and NEO-PI-R facets scales.

Criterion Validity of Personality Predictors
4 separate multiple regression:1. PRF-JPI factor scales2. PRE-JPI trait scales3. NEO-PI-R domain scales4. NEO-PI-R facet scales

Incremental Validity of Personality Predictors
• PRF-JPI trait scales over NEO-PI-R domain scales
• NEO-PI-R facet scales over PRF-JPI factor scales

Result of Comparisons
• A few carefully selected personality facet scales can predict as well as or better than can all of the Big Five factors scales combined
• A substantial part of the criterion variance predicted by the facet scales is variance not predicted by the factor scales

Discussion
• Generalizability of the Present Results
• Expected Prediction Results?
• Unidimensional vs. Multidimensional Criteria
• Beyond the Big Five

Conclusion
• Measures of Big Five factors can help to predict and understand behaviour.
• Also reliable personality-based variation in behaviour not accounted for by Big Five.
• Sources of non-Big Five personality variance can and should be used for the purposes of reducing error in behaviour prediction and increasing accuracy in behaviour explanation.
Female student‘s disordered eating and the Big 5 facets
MacLaren & Best, 2009; Eating behaviours

Lit review + Intro
• 2.8% of women and 0.5% of men reported significant symptoms of eating disorders (Gadalla & Piran, 2007)
• Eating disorders relatively rare, but unhealthy preoccupations with weight common (Hautala et al., 2008)– 25% of normal white US girls perceive themselves as fat– 50% report controlling their weight in unhealthy manner
• Eating disorders and Personality disorder– N most consistently associated with eating disorder diagnosis and correlated
with eating disorder symptoms in non-clinical samples– Specifically, combination of high N and low E risk factor (Miller et al, 2006)

Purpose of study
• To characterise individual dispositions that may increase vulnerability to disordered eating at factor and facet level

Method• N = 378 nonclinical female university students• All completed NEO-PI-R and Eating attitudes test-26 (EAT)
– EAT measures atypical behaviours and attitudes about eating; Ps indicate frequency of eating-related thoughts, feelings and behaviours; 3 subscales: 1. Dieting, 2. Bulimia and food preoccupation,3. oral control
• EAT used to assign participants into 2 groups:- Sympomatic group (N = 43)- Nonsymptomatic groups (N= 335)
• Nonsymptomatic group‘s trait/facet scores were compared with symptomatic groups‘ scores
• Symptomatic group‘s scores were correlated with their EAT-subscale scores

Results –group comparisons
• Symptomatic group:• Domains
– Higher N, lower E
• N– Higher on all facets, except impulsiveness
• A– Higher on tender-mindedness
• E– Lower on assertiveness and excitement-seeking

Results- Subscale correlates..
• Dieting: High dieting scores associated with– Low impulsiveness (r = -.34)– High self-discipline (r = .34)
• Oral control: High oral control associated with– Low overall N (esp. Impulsiveness and angry-hostility)– High overall A (esp. Compliance and Modesty)– High self-discipline (r=.43); impulsiveness (r = - .62); angry-
hostility (r = -.37), Compliance (r = .46), Modesty (r = .36),
• Bulimia: high bulimia score associated with– high impulsivity (r = .35)
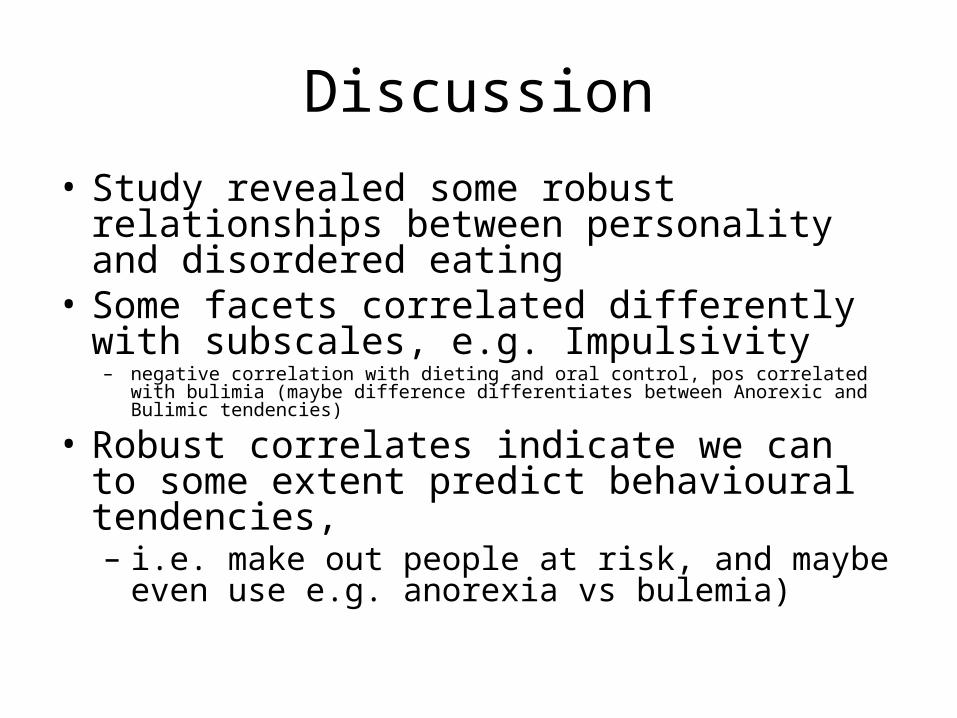
Discussion• Study revealed some robust relationships
between personality and disordered eating• Some facets correlated differently with subscales,
e.g. Impulsivity– negative correlation with dieting and oral control, pos correlated with bulimia (maybe
difference differentiates between Anorexic and Bulimic tendencies)
• Robust correlates indicate we can to some extent predict behavioural tendencies, – i.e. make out people at risk, and maybe even use e.g.
anorexia vs bulemia)