face to face(4)
TRANSCRIPT
8/3/2019 Face to Face(4)
http://slidepdf.com/reader/full/face-to-face4 1/6
[1]
8/3/2019 Face to Face(4)
http://slidepdf.com/reader/full/face-to-face4 2/6
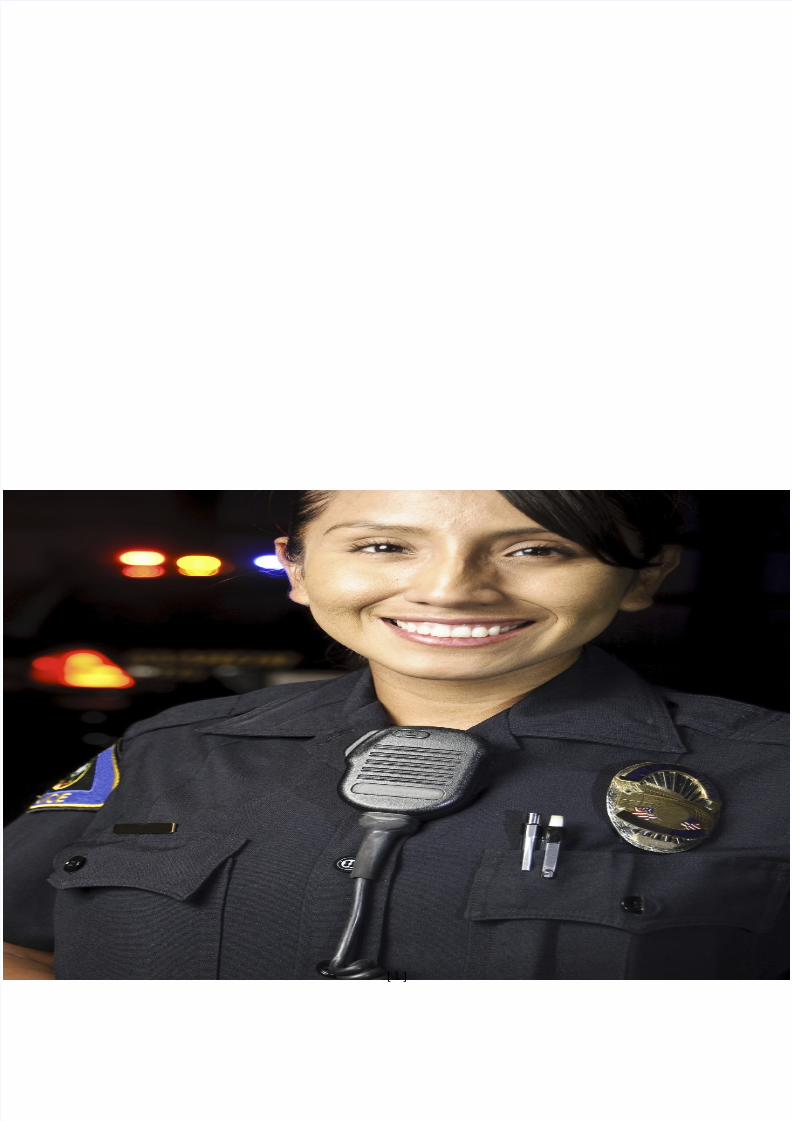
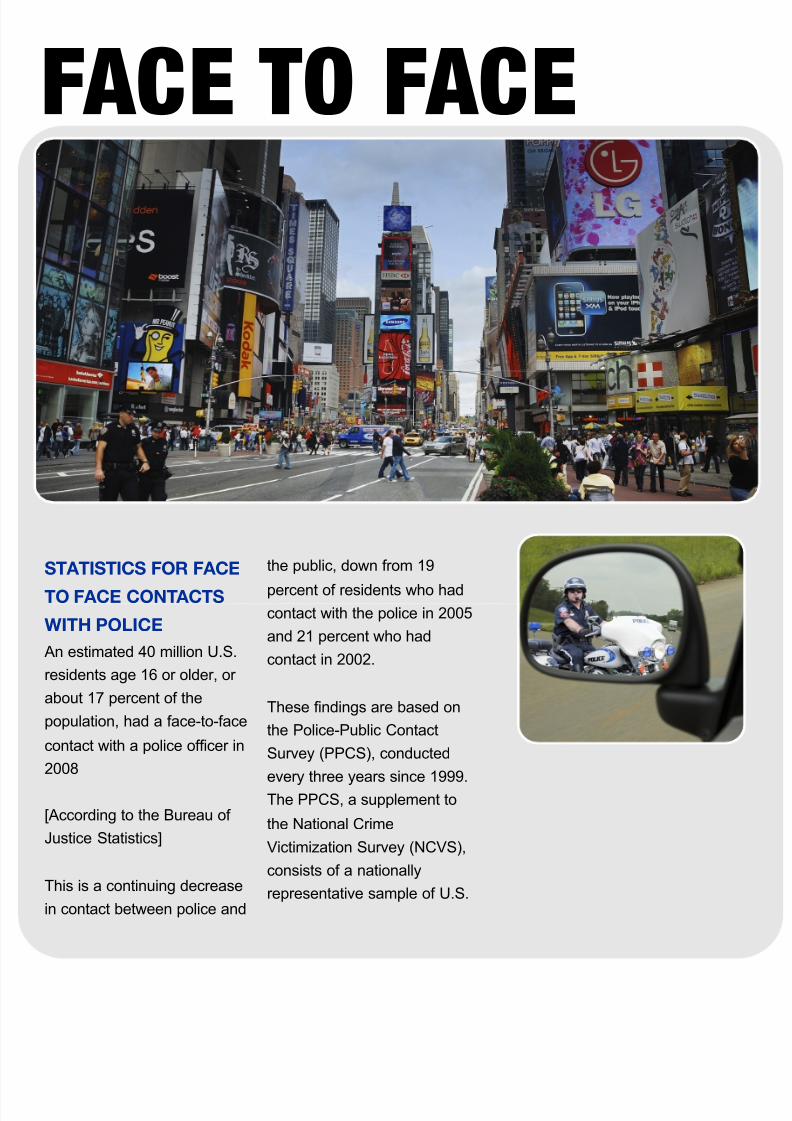
STATISTICS FOR FACE
TO FACE CONTACTS
WITH POLICE
An estimated 40 million U.S.
residents age 16 or older, or
about 17 percent of the
population, had a face-to-face
contact with a police officer in
2008
[According to the Bureau of
Justice Statistics]
This is a continuing decrease
in contact between police and
the public, down from 19
percent of residents who hadcontact with the police in 2005
and 21 percent who had
contact in 2002.
These findings are based on
the Police-Public Contact
Survey (PPCS), conducted
every three years since 1999.
The PPCS, a supplement to
the National Crime
Victimization Survey (NCVS),
consists of a nationally
representative sample of U.S.
FACE TO FACE
8/3/2019 Face to Face(4)
http://slidepdf.com/reader/full/face-to-face4 3/6
residents age 16 or
older. Nearly 60,000
people participated in
the most recent PPCS,
which was conducted
during the last six
months of 2008.
About five million fewer
residents had face-to-
face contact with the
police in 2008,
compared to the 45
million residents who
had police contact in
2002.
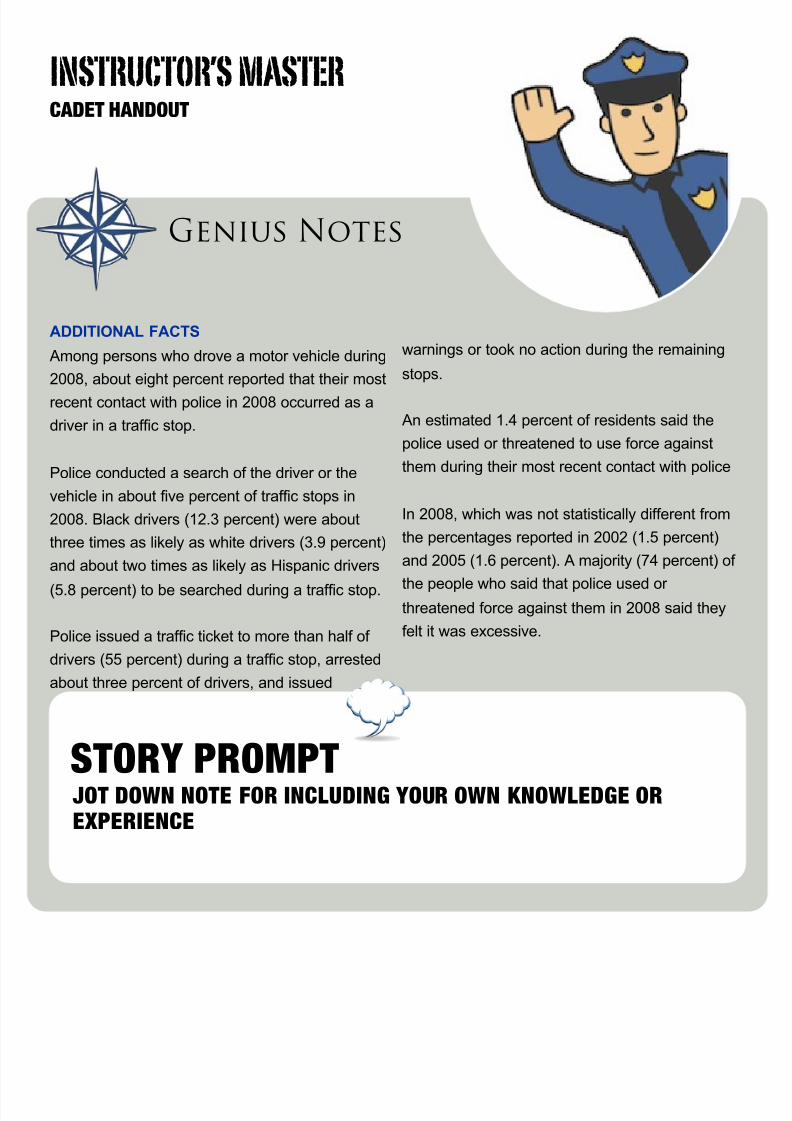
1# Reason: traffic
stop
During this period, the
most common situation
in which people came
into contact with thepolice was as a driver
in a traffic stop.
1# Reason: Report
a Crime
The second most
common reason for
contact with police
continued to be
reporting a crime or
problem, although the
number of contacts that
occurred for this reason
decreased. Nearly 12
million residents said
their most recent
contact in 2002 was to
report a crime or
problem to police,
compared to about 8
million residents in
2008.
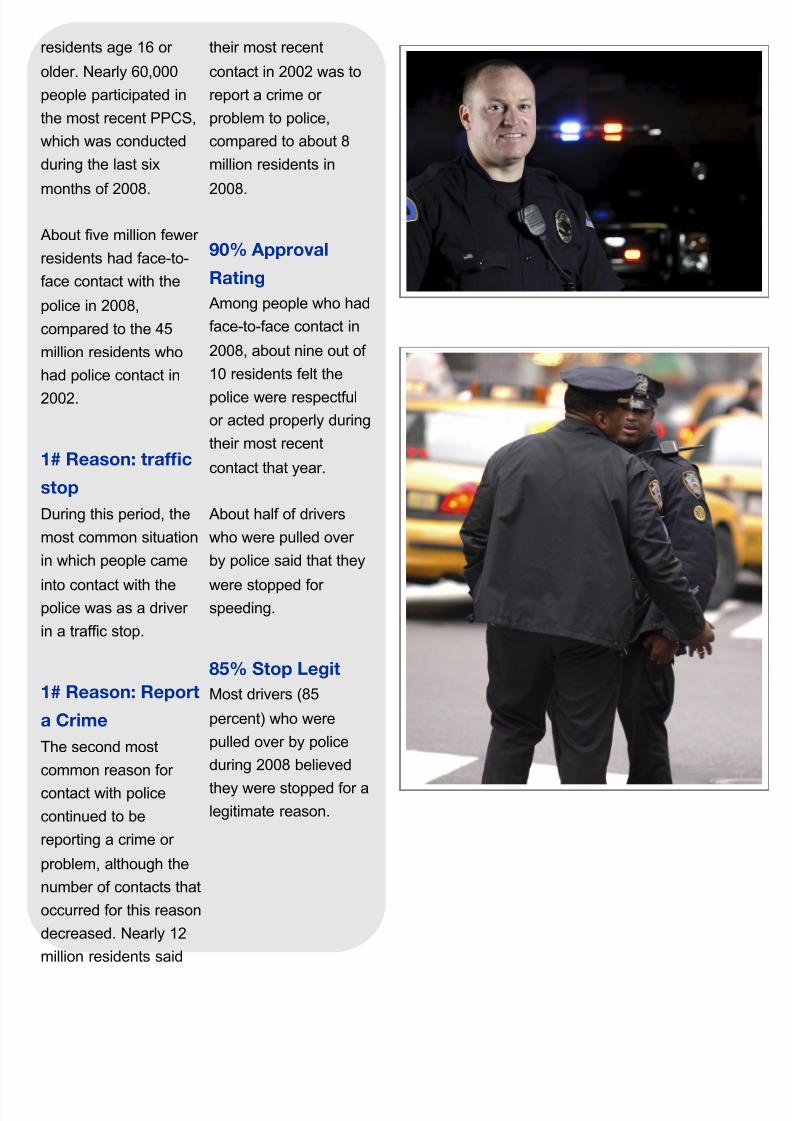
90% Approval
Rating
Among people who had
face-to-face contact in
2008, about nine out of
10 residents felt the
police were respectful
or acted properly during
their most recent
contact that year.
About half of drivers
who were pulled over
by police said that they
were stopped for speeding.
85% Stop Legit
Most drivers (85
percent) who were
pulled over by police
during 2008 believed
they were stopped for a
legitimate reason.
8/3/2019 Face to Face(4)
http://slidepdf.com/reader/full/face-to-face4 4/6
ADDITIONAL FACTS
Among persons who drove a motor vehicle during
2008, about eight percent reported that their most
recent contact with police in 2008 occurred as a
driver in a traffic stop.
Police conducted a search of the driver or the
vehicle in about five percent of traffic stops in
2008. Black drivers (12.3 percent) were about
three times as likely as white drivers (3.9 percent)
and about two times as likely as Hispanic drivers
(5.8 percent) to be searched during a traffic stop.
Police issued a traffic ticket to more than half of
drivers (55 percent) during a traffic stop, arrested
about three percent of drivers, and issued
warnings or took no action during the remaining
stops.
An estimated 1.4 percent of residents said the
police used or threatened to use force against
them during their most recent contact with police
In 2008, which was not statistically different from
the percentages reported in 2002 (1.5 percent)
and 2005 (1.6 percent). A majority (74 percent) of
the people who said that police used or threatened force against them in 2008 said they
felt it was excessive.
INSTRUCTOR’S MASTERCADET HANDOUT
STORY PROMPT
Genius Notes
JOT DOWN NOTE FOR INCLUDING YOUR OWN KNOWLEDGE OR
EXPERIENCE
8/3/2019 Face to Face(4)
http://slidepdf.com/reader/full/face-to-face4 5/6
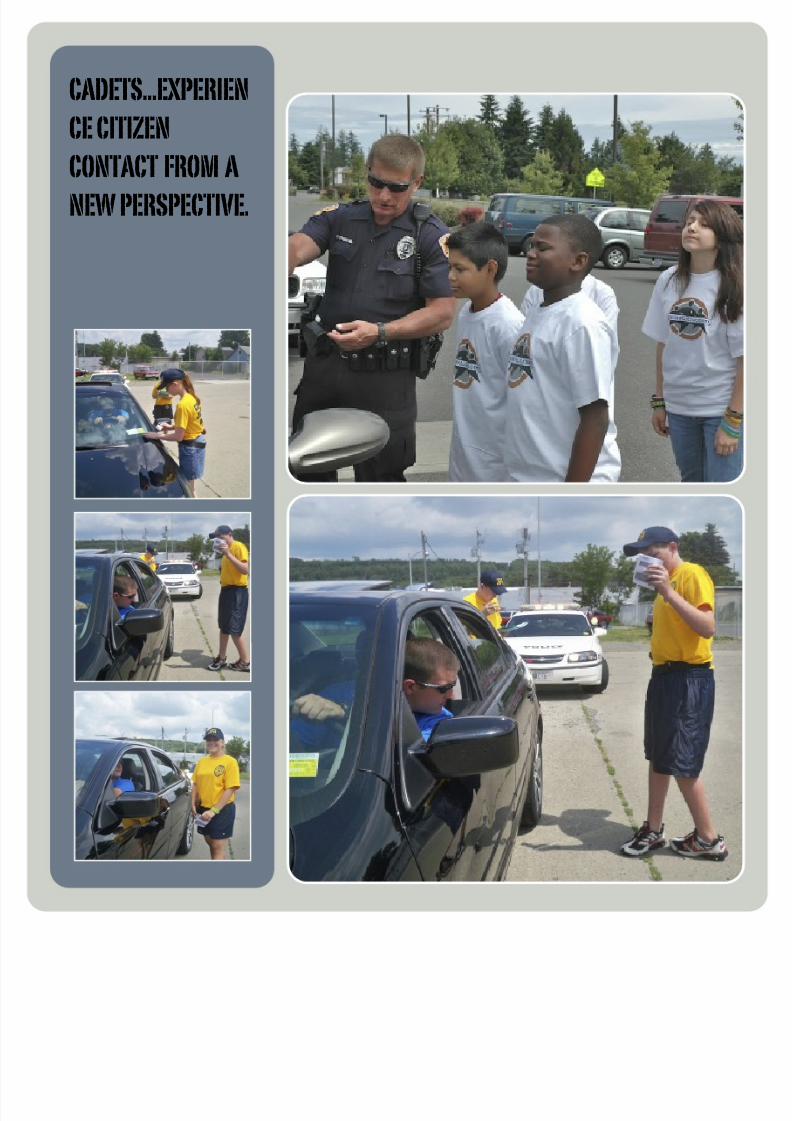
CADETS...EXPERIEN
CE CITIZEN
CONTACT FROM A
NEW PERSPECTIVE.

8/3/2019 Face to Face(4)
http://slidepdf.com/reader/full/face-to-face4 6/6