face-name association 1 running head: face-name ... -...
TRANSCRIPT
Face-name association 1
Running head: FACE-NAME ASSOCIATION
Why are some people’s names easier to learn than others?
The e!ects of face similarity on memory for face-name associations
Peter C. Pantelis, Marieke K. van Vugt
Department of Psychology
University of Pennsylvania
Robert Sekuler
Volen Center for Complex Systems
Brandeis University
Hugh R. Wilson
Center for Vision Research
York University
Michael J. Kahana
Department of Psychology
University of Pennsylvania

Face-name association 2
Abstract
Using synthetic faces that varied along four perceptual dimensions (Wilson, Lo"er, &
Wilkinson, 2002), we examined the e!ects of face similarity on memory for face-name
associations. The nature of these stimuli allowed us to go beyond the categorical similarity
manipulations used in previous verbal associative memory studies to trace out the
parametric relation between similarity and various performance measures. In Experiment
1, we found that recall performance diminished as a function of how many studied faces
were in the vicinity of the cue face in similarity space. Also, incorrect recalls were more
likely to come from nearby positions in face space. Experiments 2 and 3 demonstrated
analogous e!ects with a set of more distinguishable, photorealistic faces, and in an
associative recognition task, respectively. These results highlight the similarity between
associative recall and associative recognition, and between face-name association and
other domains of associative memory.

Face-name association 3
Why are some people’s names easier to learn than others?
The e!ects of face similarity on memory for face-name
associations
Introduction
In the study of associative memory, similarity has served as one of the major factors
that influences recall performance. High levels of within-pair similarity facilitates recall,
whereas high levels of between-pair similarity impairs recall (Keppel, 1968; McGeoch,
1942; Osgood, 1949; Robinson, 1927; Skaggs, 1925). The negative e!ects of between-pair
similarity on recall are often understood in terms of the construct of interference.
Specifically, if items are represented as vectors of attributes, then the degree of overlap
between the attributes of either the cue or the target should determine the degree to
which non-target representations are activated (Gibson, 1940; Murdock, 1989).
In the verbal memory literature, studies of associative interference have typically
manipulated similarity as a categorical variable with similar items belonging to the same
category or sharing a single critical feature (Feldman & Underwood, 1957; Levitt & Goss,
1961; Newman & Buckhout, 1962; Underwood, 1953). Although it would be ideal to
parametrically assess similarity e!ects in associative memory, verbal materials do not
readily lend themselves to such manipulations. Unlike verbal stimuli, the similarity
relations among perceptually defined stimuli, such as faces, can be parametrically
varied (Wilson et al., 2002). In addition, the relatively high-dimensional nature of faces as
stimuli makes them more easily distinguishable and nameable than other classes of
perceptual stimuli (e.g., Kahana & Sekuler, 2002), and the task of putting a name to a
face is indeed both natural and commonplace. Our primary goal in the present study was
to systematically examine the role of face similarity in both cued recall and associative

Face-name association 4
recognition of face-name pairs. In studying both cued recall and associative recognition,
we also sought to test the hypothesis that similarity e!ects obey common principles in
these two domains of associative memory (Hockley, 2008; Nobel & Shi!rin, 2001; Verde &
Rotello, 2004; Yonelinas, 1997).
In a study of associative interference for face-name pairs, Fraas et al. (2002)
examined the errors participants made as they attempted to recall names when cued with
faces. Overall, extra-list intrusions tended to be phonologically similar to the target name
(meaning that the intrusion and target names tended to share two or more consonants or
a vowel-consonant sequence), whereas intralist intrusions tended to be phonologically
dissimilar. This study showed the e!ect of name similarity on memory for face-name
associations. Although face similarity has been widely shown to influence performance in
item recognition tasks (Busey & Tunnicli!, 1999; Knapp, Nosofsky, & Busey, 2006;
Yotsumoto, Kahana, Wilson, & Sekuler, 2007), to our knowledge this factor has not been
studied in the domain of face-name associations.
In verbal studies, similarity e!ects have been studied in terms of both inter- and
intra-pair similarity. In a study that explored interpair similarity, Bower,
Thompson-Schill, and Tulving (1994) had participants learn A-B and then A-C word pairs
in a modified modified free recall (MMFR) paradigm. A and B were always from the same
category (e.g., apple–banana), and the authors examined how the number of other words
in the study list of the same semantic category as A and B a!ected participants’ ability to
correctly recall B (banana) when cued with A (apple). The more same-category words in
the study list, the worse the initial learning and subsequent retention of the A-B
association. Additionally, Nelson, Bajo, McEvoy, and Schreiber (1989) found that when a
cue word had more and stronger semantic associates, this lowered the probability of
sampling the target item at test (see, also, Nelson, McKinney, Gee, and Janczura (1998)
for a related study of verbal association).

Face-name association 5
Building on these studies of interpair similarity, we asked whether an analogous
e!ect of neighborhood density would occur with memory for face-name pairs. However, we
went beyond these previous studies in several ways. First, we explored the role of
perceptual similarity among visual, non-verbal stimuli (faces), rather than similarity
between verbal stimuli based on phonetic or semantic relationships. Also, whereas the
Bower et al. (1994) study assessed similarity on the basis of how many same-category
competitors a given cue had, ours explores within-category similarity, conceiving of the
perceived similarity between any two faces as existing along a continuous metric. Finally,
in both our recall and recognition experiments we examined the e!ect of inter-stimulus
similarity on both accuracy and latency measures.
We explored neighborhood density e!ects in both cued recall and associative
recognition, tasks for which associative interference e!ects are not necessarily predicted or
observed to be the same (Postman, 1976). We hypothesized that a face’s name will be
more di#cult to learn if that face is studied among many perceptually similar faces.
Experiment 1
We first examined learning of face-name associations in a cued recall task. The
principal motivation of this experiment was to determine whether participants’ recall
performance would vary with the number of other faces in the study set similar to the cue
face.
Methods
Participants. Participants were 25 undergraduate and graduate students (11 male
and 14 female) who participated for payment. Each participated in one hour-long session.
Stimuli. We used a set of achromatic male faces (for examples, see Fig. 1, Panel a).
The face stimuli were designed to vary along the 4 principal components of a

Face-name association 6
37-dimensional face space (Wilson et al., 2002). This face space had been created by
taking 37 measurements on a set of photographs of Caucasian males (normalized to have
the same head radius), and then reconstructing the faces from the principal components
that are extracted from the vector of these measurements. The resulting faces were
low-pass filtered at 10 cycles per face width, which is optimal for face processing, and
removes components like hair color, hair curliness and skin texture (Wilson et al., 2002).
The advantages of using this face set are that although the faces are well-controlled, they
still can be identified with high accuracy (Wilson et al., 2002), and it is possible to
measure their inter-item similarity precisely. Moreover, the faces are realistic enough to
generate responses in the fusiform face area (Lo"er, Yourganov, Wilkinson, & Wilson,
2005), a face-sensitive area in the brain.
The current experiment used only a 4-dimensional subset of this 37-dimensional face
space. Our stimulus set of 16 faces was created from all permutations of steps of one
standard deviation away from the mean face (of the 37-dimensional face space) in the
directions of each of the four principal components (one standard deviation is the
threshold for 75% correct discrimination between two faces that are flashed for 110 ms).
In order to determine how our particular face set’s dimensions were perceived, a
separate multidimensional scaling (MDS) study was performed (also reported in van Vugt,
Sekuler, Wilson, & Kahana, submitted). In this MDS study, 23 participants served for two
sessions, in which they saw all combinations of three faces (triads) twice, and had to
determine the “odd-one-out”. From these ratings, a similarity matrix was constructed by
increasing the similarity value for each of the two non-chosen faces (see Kahana &
Bennett, 1994, for details). This similarity matrix was transformed into similarity
coordinates for every face using individual di!erences multidimensional
scaling (INDSCAL/ALSCAL; Takane, Young, & Leeuw, 1977).

Face-name association 7
Insert Figure 1 about here
The experimenters derived four-dimensional stimulus coordinates for each of the 16
faces. Four dimensions was a good fit according to an inspection of the scree plot, and
also corresponded to the number of dimensions on the basis of which the faces had been
generated. Fig. 2 shows the coordinates of the faces in the MDS-derived space. Because
the faces were generated based on a set of physical measurements, we can use these
measurements to help interpret the meaning of the four obtained dimensions. The first
MDS dimension correlated significantly with nose width [r(15) = 0.89, p < 0.001] and one
of the components of the head shape [r(15) = 0.88, p < 0.01]. The second MDS dimension
correlated significantly with parameters representing the geometry of the hairline
[r(15) = 0.89, p < 0.001], and the separation of the eyes [r(15) = 0.85, p < 0.001]. The
third MDS dimension correlated significantly with the thickness of the top lip
[r(15) = 0.82, p < 0.001], as well a component of head shape [r(15) = !0.73, p < 0.01].
Finally, the fourth MDS dimension also correlated significantly with thickness of the top
lip [r(15) = !0.72, p < 0.01] and with head shape [r(15) = 0.70, p < 0.01]. The
thus-obtained face coordinates were used in the subsequent analyses. All distances
reported for these faces are the Euclidean distances between the compared faces.
The faces were paired during the experiments with 16 of the most common male
American names, as confirmed by the 1990 census. These names were truncated to their
one-syllable equivalents: Jim, John, Rob, Bill, Dave, Rich, Charles, Joe, Tom, Chris, Dan,
Paul, Mark, Mike, and George. Stimuli were presented subtending a visual angle of 3.7
degrees on a 1280"1024 computer screen, against a white background. The names were
presented under the faces in black capital letters.
Face-name association 8
Insert Figure 2 about here
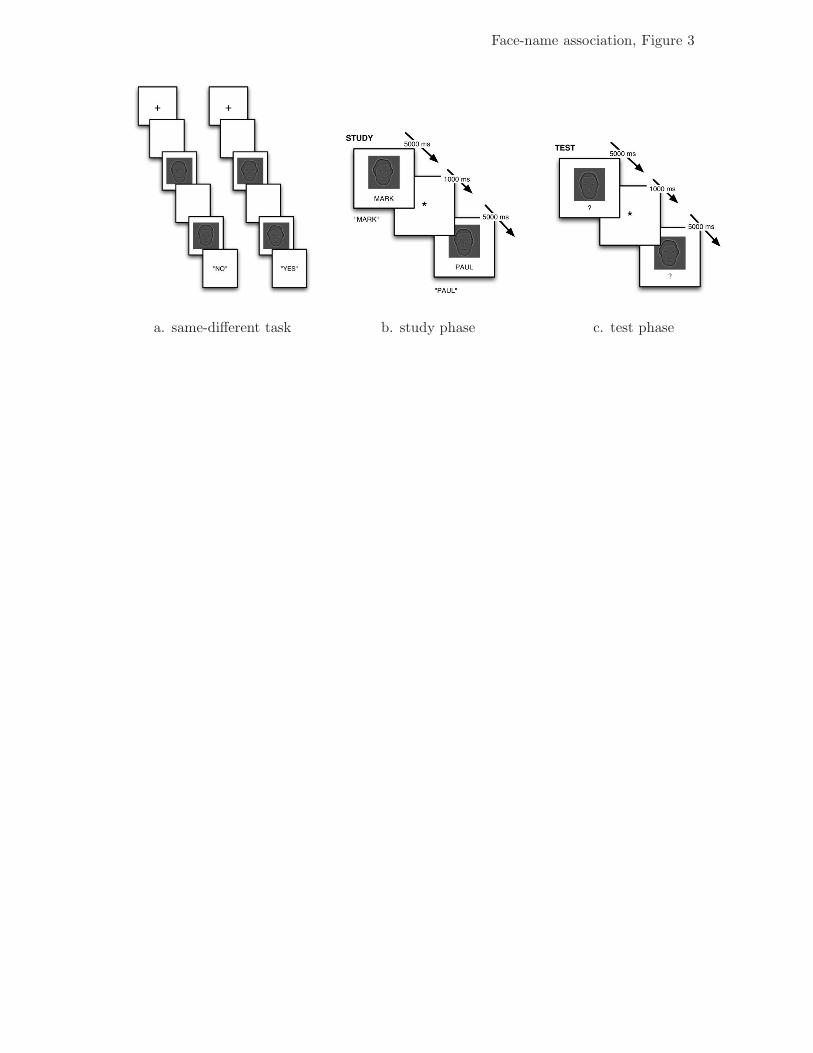
Procedure. Participants first completed 64 trials of a same-di!erent task (see Fig. 3,
Panel a). This introductory part of the experiment was implemented to help better
familiarize participants with the stimulus set. On each trial, an orienting stimulus (+) was
presented for 1 s at the center of the computer screen. After a 200 ms blank screen, a face
was shown for 700 ms, followed by another 3 s of blank screen and the presentation of a
second face. Each of the intervals described above was jittered by a period between 0 and
75 ms. This was done because we intended comparison with parallel EEG experiments for
which the jitter is necessary to decorrelate brain signals across successive stimulus events.
Participants reported whether the second face was the same or di!erent from the first by
pressing a designated button. The experiment waited for as long as it took for the
participant to respond, informed the participant whether the response was correct or
incorrect, and then moved on to the next trial.
For every participant, the main experiment consisted of two study sets, each
consisting of eight face-name associations. Facial stereotypes are known to be associated
with certain male names (Lea, Thomas, Lamkin, & Bell, in press); therefore, we
randomized the face-name pairings across participants in order to avoid spurious
performance e!ects for particular face-name combinations. Each face-name pair was
randomly assigned to one of the two study sets for every participant.
Each study set consisted of ten blocks, and each of these ten blocks consisted of a
study phase and a test phase. During the study phases, the eight face-name pairs were
shown in random order for 5 s and their names were presented auditorily. During the test
phases, faces were shown in random order for 5 s with a question mark underneath, and
participants verbally recalled the corresponding names (Fig. 3, Panels b and c). The

Face-name association 9
testing computer digitally recorded participants’ vocal responses. These recordings were
analyzed o!-line to mark the onset time of each vocalization and to identify the
participants’ responses. The software used to record and analyze vocal responses (Geller,
Schleifer, Sederberg, Jacobs, & Kahana, 2007) has been used extensively in prior studies
of spoken recall (Sederberg et al., 2006) and is freely available at
http://pyepl.sourceforge.net.
Insert Figure 3 about here
Results
During the introductory 64-trial same-di!erent task, hits and false alarms were
defined as trials on which participants correctly or incorrectly judged the two successively
presented faces as being identical. Participants’ hit rate (HR) was 77% (SEM = 5%) over
the first eight trials and 92% (SEM = 3%) over the last eight. Participants’ false alarm
rate (FAR) was 23% (SEM = 4%) over the first eight trials and 22% (SEM = 5%) over
the last eight. Improvement in performance was significant for HR [t(24) = 2.96, p < .01]
but not for FAR [t(24) = 0.13, n.s.].
In the cued recall task, participants’ performance improved from 28% correct recall
on the first block to 83% correct recall on the tenth block. Similarly, reaction time (RT)
for correct recalls became gradually faster over the 10 test cycles. Descriptive data are
given in Table 1.
Insert Table 1 about here
“Neighborhood” E!ect: Our primary question of interest was whether participants
would exhibit worse associative recall performance for faces that had a greater number of

Face-name association 10
similar “neighbors”. Two faces were considered neighbors if they were previously judged
to be highly similar to each other; that is, they were situated within a certain radius of
each other in four-dimensional face space. The size of this radius was selected such that
each face had 1 to 7 neighbors within its respective study set (i.e. the set of faces also seen
during the run), and the number of faces within this radius defined each face’s
“neighborhood density”.
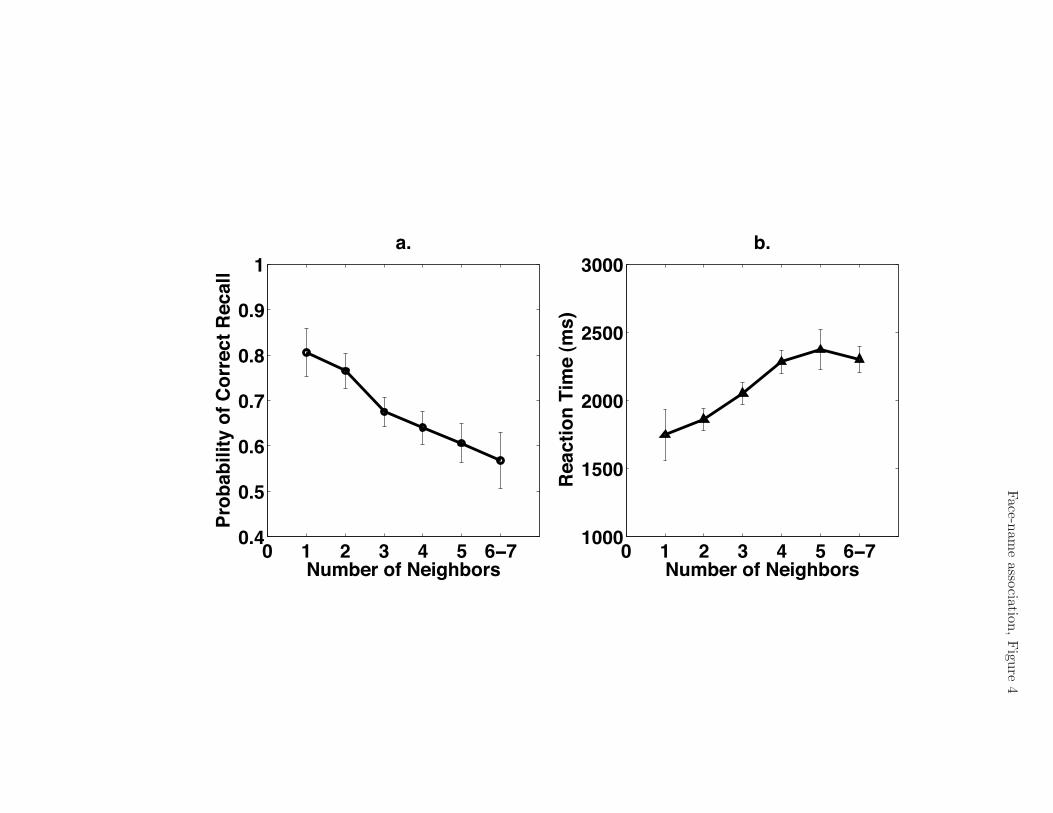
At test, the more neighbors a cue face had within the study set, the less likely that
the correct name was recalled (see Fig. 4). The 95% confidence interval (CI) for the slope
of the linear regression fitting probability of correct recall to neighborhood density was
(-0.09, -0.03), [t(24) = !4.07, p < .001]. These recalls also were slower; the 95% confidence
interval for the slope of the regression for RT on neighborhood density was (83, 249) ms,
[t(24) = 4.13, p < .001].
We performed one-way repeated measures ANOVAs across levels of neighborhood
density [“low” (1-2 neighbors),“medium”(3-4 neighbors),“high” (5-7 neighbors)]. Two
participants were excluded due to missing data. These ANOVAs confirmed the
significance of the neighborhood e!ect. The di!erence across neighborhood density
conditions for mean probability of correct recall was significant [M(low) = .767,
M(medium) = .664, M(high) = .595; F (2, 44) = 12.99, MSe = .013, p < .001], and the
same was true for mean RT [M(low) = 1836 ms, M(medium) = 2158 ms, M(high) = 2365
ms; F (2, 44) = 10.55, MSe = 1.6 x 10⁵ ms, p < .001]. Separate two-way ANOVAs (with
three participants removed due to missing data) demonstrated that there was no
significant interaction between number of neighbors (low, medium, high) and block
[“early” (blocks 1-5) versus “late” (blocks 6-10)], neither for probability of correct recall
nor RT [F (2, 42) < 1, n.s. for both interactions].
We then explored whether this neighborhood e!ect was the result of associative
interference from studying a particular face set, or instead a property of the global

Face-name association 11
typicality or distinctiveness of a given face in the complete face space. Each face had 1-7
neighbors within its own study set, but since each participant studied two di!erent lists of
8 face-name pairs during his session, each face could additionally be considered to have
another set of neighbors in the set studied during the other half of his experimental
session. We examined whether the neighborhood e!ect di!ered for faces with the same
number of neighbors within their study set but a “low” (2-4) or “high” (5-7) number of
neighbors in the set studied during the other half of the experimental session. Note that
while participants were exposed to the whole face space at the start of the experiment
(during the same-di!erent task), one might still expect that this e!ect would be stronger
during the second half of the experiment, after the participant had studied all of the faces
and not just half of them.
We performed paired sample t-tests (two-tailed) to compare the slopes of
“neighborhood” regressions for “high” versus “low” other-half neighbor conditions. For
probability of correct recall, no significant di!erence was found between the slopes of
“neighborhood” regressions for high versus low other-half neighbors [t(24) = 0.42, n.s.],
and likewise for RT, no significant di!erence was found between the slopes of regressions
for high versus low other-half neighbors [t(24) = 1.25, n.s.]. When looking only at the
second half of each participant’s experimental session, once again no reliable di!erences
were found between the slopes of regressions for high versus low other-half neighbor
conditions, neither for probability of correct recall, [t(24) = 0.83, n.s.], nor for RT
[t(24) = 1.98, n.s.].
Two-way repeated measures ANOVAs revealed no significant e!ect of other-half
neighbors (low, high) when crossed with within-half neighbors [“low”(1-3 neighbors),
“high” (4-7 neighbors)], neither for probability of correct recall [F (1, 24) < 1, n.s.] nor for
RT [F (1, 24) < 1, n.s.]. The same was true if one looked only at the second half of each
session (with 6 participants removed due to missing data), both for probability of correct

Face-name association 12
recall [F (1, 18) < 1, n.s.] and for RT [F (1, 18) = 1.48, n.s.]. We concluded that the
observed neighborhood density e!ects occurred independently of given faces’ global
typicality or distinctiveness. Rather, these e!ects were primarily the result of associative
interference within a face’s study set.
Additionally, we examined the possibility that cue faces with more neighbors came
from lists that in general were more densely packed with faces (i.e., more crowded). In
this case, the neighborhood e!ect could result not from these faces themselves being more
di#cult to learn relative to other faces in their respective study lists, but from the relative
di#culty of the study lists themselves. To explore this issue, we classified each of the
study lists into lower- or higher-density conditions. The classification was based on
whether the dispersion among the face coordinates (the average of the distances between
each of the 8 list faces and the mean of the face coordinates for the given list) exceeded
the median of the distribution across lists. If a study list did not vary significantly in face
density, then the hypothesis that the neighborhood e!ects we had observed were the result
of this variation would be demonstrably false, since there is no variation. Below we show
that even if there is a di!erence in density among lists, this does not a!ect the
neighborhood density results.
We observed a neighborhood e!ect for both low and high density study lists, for the
probability of correct recall—high: 95% CI for the slope of the neighborhood density
function =(-.09, -.02), [t(16) = !3.69, p < .01]; low: 95% CI = (-.10, -.03), [t(17) = !3.95,
p < .01]. A similar e!ect was observed for reaction time—high: 95% CI = (69, 217) ms,
[t(16) = 4.10, p < .001]; low: 95% CI = (85, 353) ms, [t(17) = 3.47, p < .01]. In addition,
paired sample t-tests (two-tailed) were performed to compare the regressions for high
versus low density lists, for the 10 (of 25) participants who by chance studied both a high
density list and a low density list. For probability of correct recall, no significant di!erence
was found between the slopes of neighborhood density regressions for high density lists

Face-name association 13
versus low density lists [t(9) = 0.04, n.s.], and no significant di!erence was found between
the intercepts for high density versus low density [t(9) = 0.14, n.s.]. Likewise for RT, no
significant di!erence was found between the slopes of regressions for high density lists
versus low density lists [t(9) = 0.18, n.s.], and no significant di!erence was found between
the intercepts for high density versus low density [t(9) = 0.38, n.s.]. A possible caveat of
this analysis is that the small number of participants limited statistical power; however, as
explained below, data from Experiments 2 and 3 help to further rule out the alternative
hypothesis considered here.
Insert Figure 4 about here
Intra-list Intrusions: Virtually all intrusions made by participants were intra-list
intrusions (ILIs), i.e. incorrectly recalled names of other faces within the study set.
During each test trial, participants could make an ILI by recalling any of the seven names
of the other faces presented. For each ILI, we calculated the Euclidean distance in face
space between the cue face and the face belonging to the incorrectly-recalled name.
Because the eight faces used in each run of the experimental session were selected
randomly from a larger pool, ILIs to certain distances in similarity space were not always
possible during a given session or study set. Therefore, the conditional probability of
making an ILI was calculated by dividing the number of ILIs made by the number of
possible ILIs for respective distance bins (Fig. 5.) The 95% CI for the slope of the linear
regression fitting probability of ILI to Euclidean distance was (-.03, -.02), [t(24) = !8.85,
p < .001] and the 95% CI for the slope of the regression for the latencies of these
intrusions was (106, 215) ms, [t(24) = 6.09, p < .001]. These data demonstrate that
intrusions are likely to come from nearby positions in similarity space.

Face-name association 14
Insert Figure 5 about here
Errors of Memory vs. Perceptual Confusion: The possibility remained that the
similarity e!ects on memory we observed were the result of perceptual confusion between
the highly similar faces. These two cognitive processes are inherently di#cult to dissociate,
but we attempted to do so by re-examining the main e!ects observed in Experiment 1
only for the subset of eight participants that achieved 100% accuracy over the last eight
trials of their introductory same-di!erent task. Presumably, participants who achieved
this accuracy criterion had little di#culty discriminating among the 16 synthetic faces.
With this reduced pool of participants, we still observed a significant neighborhood
density e!ect. The 95% CI for the slope of the regression of probability of correct recall on
number of neighbors was (-.11, -.02), [t(7) = !3.47, p < .05], and the 95% CI for the slope
of the regression for RT was (42, 223) ms, [t(7) = 3.45, p < .05]. One-way repeated
measures ANOVAs (with one participant excluded due to missing data) also showed a
significant e!ect of neighborhood density (low, medium, or high) on both probability of
correct recall [F (2, 12) = 7.32, MSe = .013, p < .01] and RT [F (2, 12) = 10.55, MSe = 3.3
x 104, p < .01]. Additionally, we observed a significant similarity e!ect on intra-list
intrusions. The 95% CI for the slope of the regression of probability of intra-list intrusion
on Euclidean distance was (-.04, -.01), [t(7) = !5.72, p < .001], and the 95% CI for the
slope of the regression of the latencies of these intrusions on distance was (12, 272) ms,
[t(7) = 2.58, p < .05].
We then asked whether the neighborhood density e!ect could also be found for the
subset of the eight worst discriminators.This set of participants, which averaged a 79%
HR and 38% FAR over these last eight trials, presumably had the most di#cult time
discriminating between the faces, even after having been given significant exposure to

Face-name association 15
them. If the neighborhood e!ect did indeed result in large part from problems of
perceptual confusion rather than memory, then one would expect this e!ect to be greater
for poor discriminators than for perfect discriminators. However, the slope of the linear
regression fitting probability of correct recall to number of neighbors was virtually the
same for poor discriminators (M = .063, 95% CI=(-.11, -.02)) and perfect discriminators
(M = .068), with no significant di!erence between the two groups [t(14) = 0.17, n.s.].
Likewise for RT, the slope of neighborhood density regression was similar for poor
discriminators (M = 211 ms, 95% CI=(-26, 448) ms) versus perfect discriminators
(M = 133 ms), and there was no significant di!erence between the groups [t(14) = 0.73,
n.s.]. These data suggest that the similarity e!ects we observed reflected something
beyond perceptual di#culty in discriminating between the faces.
Discussion
Experiment 1 demonstrated that the number of faces within a cue face’s similarity
neighborhood modulated performance in an approximately monotonic manner. Greater
neighborhood density for a face was associated with lower accuracy and slower reaction
time. This e!ect appears to have been the result of associative interference within the
study set, independently of the global typicality of a given face within the context of the
larger pool of faces. We also demonstrated that this e!ect was not a consequence of the
overall crowdedness or density of lists being studied. To the extent that an intra-list
intrusion to Name B when cued with Face A is a measure of the interference of a Face
B-Name B association with the correct recall of a Face A-Name A association, Experiment
1 also demonstrated that the closer Face A and Face B were in similarity space, the more
associative interference took place between the two pairs.
The faces in the set we used were highly similar (see Methods), which raises the
possibility that some memory e!ects we observed were actually the result of perceptual

Face-name association 16
errors. Arguing against this alternative hypothesis, however, we restricted our analysis to
the groups of eight participants who best and worst learned to correctly discriminate
between the faces during our introductory same-di!erent task. With this approach, we
found the same pattern of similarity-based associative interference. There are two
additional reasons why perceptual confusions are an unlikely source of memory errors.
First, nearest neighbors in face space were created to be one just-noticable-di!erence
apart in face space at a presentation time of 110 ms (see Methods). A recent study
by Habak, Wilkinson, and Wilson (2008) indicated that perceptual thresholds for the face
stimuli we used decrease quite rapidly with additional viewing time in the time range
between 110 ms and 1000 ms. This suggests that it is likely that with the 700-ms viewing
times we used in the current experiment, the faces are well-discriminable. This is further
corroborated by the fact that the average accuracy towards the end of the same-di!erent
task was 92%, indicating that participants were generally able to discriminate between the
faces fairly easily. We further addressed this issue in Experiment 2, which utilized a set of
more distinctive faces.
Experiment 2
We next considered the possibility that the demonstrated e!ects of face similarity
on associative recall were limited to the synthetic and highly confusable face set we
employed in Experiment 1. To address this question, we conducted a methodologically
similar experiment using a set of highly distinctive faces that more closely resembled
actual photographs.
Methods
Participants. Thirty-two undergraduates in a human memory lecture participated in
the experiment as part of an optional in-class experiment.

Face-name association 17
Stimuli. For Experiment 2, a di!erent set of 13 color renderings of Caucasian male
faces from the Max Planck Institute (MPI) Tubingen database (O’Toole, Edelman, &
Bultho!, 1998; for examples, see Fig. 1, Panel b) were paired with 13 names out of the set
of 16 utilized in Experiments 1 and 3. The faces used in this experiment were selected
from among the 100 male faces in the MPI
database (http://faces.kyb.tuebingen.mpg.de/). The renderings of these faces were
derived from three-dimensional laser scans of the models’ faces. Color information was
also recorded, however, models were scanned without makeup and while wearing bathing
caps (which were subsequently digitally removed). A normalization procedure was then
used to bring each face into a common orientation and position. For the renderings used
in this study, all faces were oriented towards the camera.
The similarity coordinates for these faces were determined using a MDS procedure.
A separate sample of 69 participants drawn from a introductory psychology course rated
the similarity of all possible pairs of faces on a scale from 1 (highly similar) to 10 (highly
dissimilar). To remove inter-subject variation in the mean and standard deviation of
similarity ratings, we z-transformed each participant’s ratings prior to forming the
similarity matrix. Because this was a group experiment and the resultant data had many
ties, individual-di!erences MDS was not feasible. Therefore, the dissimilarity matrix
consisting of the average ratings across participants was subjected to Sammon non-metric
MDS (Sammon, 1969) to yield a two-dimensional space for this face set. Sammon MDS
di!ers from individual di!erences MDS in that it does not allow di!erent perceptual
weighting of the retrieved dimensions by individual participants. Instead, the solution is
computed on the subject-averaged similarity matrix. As there was no theory-based
estimate of the number of dimensions of the face space, we determined the optimal
number of dimensions by inspection of the Bayesion Information Criterion or BIC (Lee,
2001), and found that 5 dimensions corresponded to the minimum BIC (BIC=742.53). We

Face-name association 18
used the 5-dimensional MDS solution in the analyses presented below.
The names were presented under the faces in black capital letters, and the
face-name stimuli were projected onto a screen in a lecture hall (visual angle varied
between roughly 2 and 9.5 degrees, depending on where the participant was seated). In
contrast to Experiments 1 and 3, no audio accompanied this experiment.
Procedure. In addition to utilizing a di!erent set of faces, the procedure for
Experiment 2 di!ered from that of Experiment 1 in five noteworthy ways. First, no
same/di!erent task preceded the experiment. Second, Experiment 2 utilized a single study
set of 13 face-name pairs, instead of two study sets of 8. Third, Experiment 2 consisted of
5 study-test blocks, each employing the same set of 13 face-name pairs, instead of the 10
blocks per study set used in Experiment 1. Fourth, participants provided written instead
of spoken recall, and therefore we did not obtain RT data in this experiment. Finally,
whereas for Experiment 1 names were randomly reassigned to di!erent faces for each
participant, for Experiment 2 each participant necessarily saw the same names paired with
the same faces.
Results and Discussion
Although no RT data were recorded, in Experiment 2 we replicated the similarity
e!ects that were observed in Experiment 1 for correct and incorrect recalls. Learning
Curve: Participants correctly recalled 19% of the faces’ names on the first block, 42% on
block 2, 56% on block 3, 72% on block 4, and 83% on the fifth and final block.
Neighborhood E!ect: The faces in this experiment each had between 0 and 5
neighbors in the study set, with “neighbors” and “neighborhoods” being defined in the
same manner as in Experiment 1. The slope of the linear regression fitting the probability
of correct recall to the number of neighbors (0-5) was calculated for each participant, and
the 95% CI for the slope of this regression was significantly negative, (-.067, -.036)
Face-name association 19
[t(31)=-6.85, p < .001]. Then, separating the face-name pairs into “low”, “medium”, or
“high” neighborhood density conditions (0-1, 2-3, or 4-5 neighbors, respectively), we
performed a repeated measures ANOVA for condition (low, medium, or high
neighborhood density) on probability of correct recall, which also demonstrated a
significant e!ect [F (2, 62) = 26.29, MSe = .012, p < .001]. The e!ects of neighborhood
density on probability of correct recall are shown in Figure 6.
A separate two-way ANOVA revealed a significant interaction e!ect between
neighborhood density condition and block [“early” (blocks 1-3) versus “late” (blocks 4-5)],
[F (2, 62) = 6.84, p < .01]. The slope of the linear regression fitting probability of correct
recall to neighborhood density (low, medium, or high) was indeed more negative for early
blocks (M = !.11) versus later blocks (M = !.06), [t(31) = 2.24, p < .05], though this
neighborhood density e!ect retained statistical significance in the latter condition
[t(31) = !3.50, p < .01].
Insert Figure 6 about here
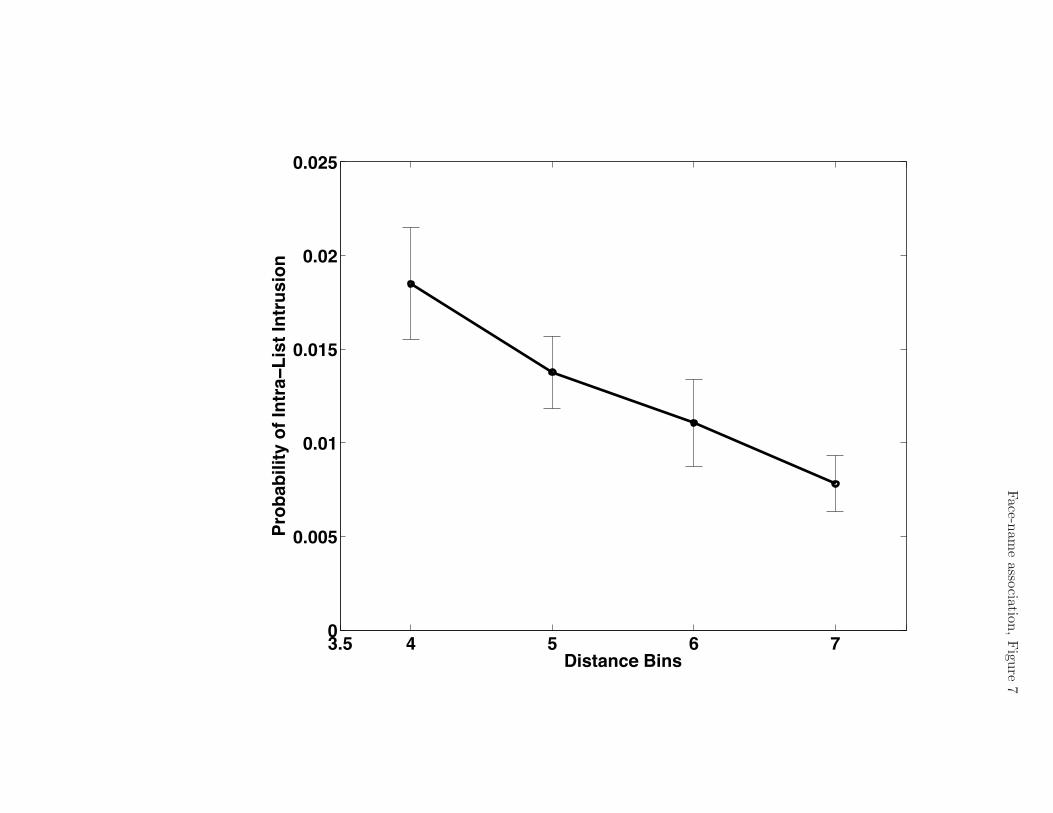
Intra-list Intrusions: The slope of the linear regression predicting conditional
probability of intra-list intrusion from the Euclidean distance between the cue face and
the intrusion name’s face was calculated for each participant. The 95% CI for the slope of
this regression was significantly negative, (-.006, -.002) [t(31)=-3.55, p < .01] (see Fig. 7).
Insert Figure 7 about here
These results demonstrate that the similarity e!ects observed in Experiment 1
generalize to a more discriminable and arguably more ecologically valid set of faces. One
Face-name association 20
might have argued that the similarity e!ects observed in Experiment 1 were actually the
result of participants not being able to e!ectively discriminate between some faces in the
set, within which all the faces were remarkably similar in appearance. This possibility was
not entirely ruled out when we examined participants who performed with perfect
discrimination toward the ends of their introductory same-di!erent tasks. However, the
faces employed in Experiment 2 were far more distinctive and readily distinguishable from
one another than those used in Experiment 1. While overall this made the task of learning
their names much easier, the neighborhood density and similarity e!ects observed in
Experiment 1 were replicated.
Experiment 3
Having established the e!ects of face similarity on recall accuracy and latency, we
asked whether these e!ects could also be observed in an associative recognition task, using
the well-controlled synthetic faces from Experiment 1. To measure associative recognition
at varying degrees of confidence, we asked the participants to make confidence judgments
on a 6-point scale. At the end of the associative recognition task, we gave participants a
final cued recall task to assess similarity e!ects following extensive exposure to the
synthetic faces.
Methods
Participants. Thirty-six undergraduate and graduate students of the University of
Pennsylvania (ten male and twenty-six female) participated for payment and could
additionally earn a bonus based on their accuracy and reaction time. Each participated in
one hour-long session.
Stimuli. The stimuli were identical to those utilized in Experiment 1.
Face-name association 21
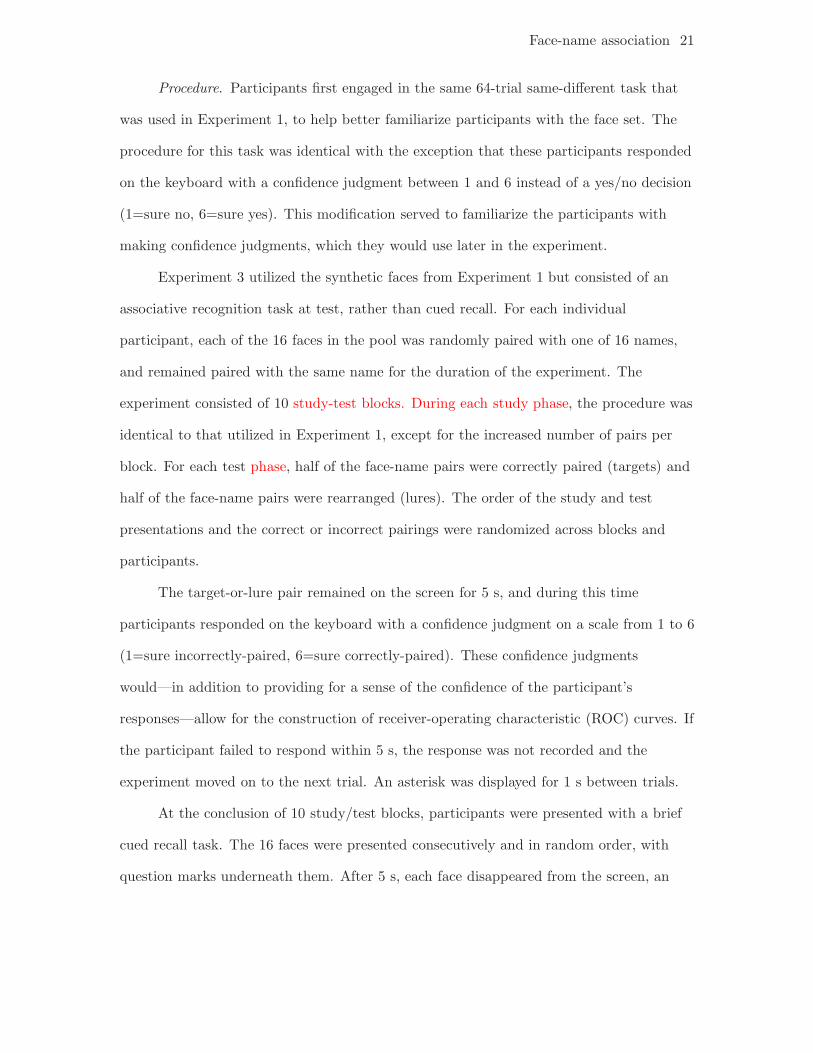
Procedure. Participants first engaged in the same 64-trial same-di!erent task that
was used in Experiment 1, to help better familiarize participants with the face set. The
procedure for this task was identical with the exception that these participants responded
on the keyboard with a confidence judgment between 1 and 6 instead of a yes/no decision
(1=sure no, 6=sure yes). This modification served to familiarize the participants with
making confidence judgments, which they would use later in the experiment.
Experiment 3 utilized the synthetic faces from Experiment 1 but consisted of an
associative recognition task at test, rather than cued recall. For each individual
participant, each of the 16 faces in the pool was randomly paired with one of 16 names,
and remained paired with the same name for the duration of the experiment. The
experiment consisted of 10 study-test blocks. During each study phase, the procedure was
identical to that utilized in Experiment 1, except for the increased number of pairs per
block. For each test phase, half of the face-name pairs were correctly paired (targets) and
half of the face-name pairs were rearranged (lures). The order of the study and test
presentations and the correct or incorrect pairings were randomized across blocks and
participants.
The target-or-lure pair remained on the screen for 5 s, and during this time
participants responded on the keyboard with a confidence judgment on a scale from 1 to 6
(1=sure incorrectly-paired, 6=sure correctly-paired). These confidence judgments
would—in addition to providing for a sense of the confidence of the participant’s
responses—allow for the construction of receiver-operating characteristic (ROC) curves. If
the participant failed to respond within 5 s, the response was not recorded and the
experiment moved on to the next trial. An asterisk was displayed for 1 s between trials.
At the conclusion of 10 study/test blocks, participants were presented with a brief
cued recall task. The 16 faces were presented consecutively and in random order, with
question marks underneath them. After 5 s, each face disappeared from the screen, an
Face-name association 22
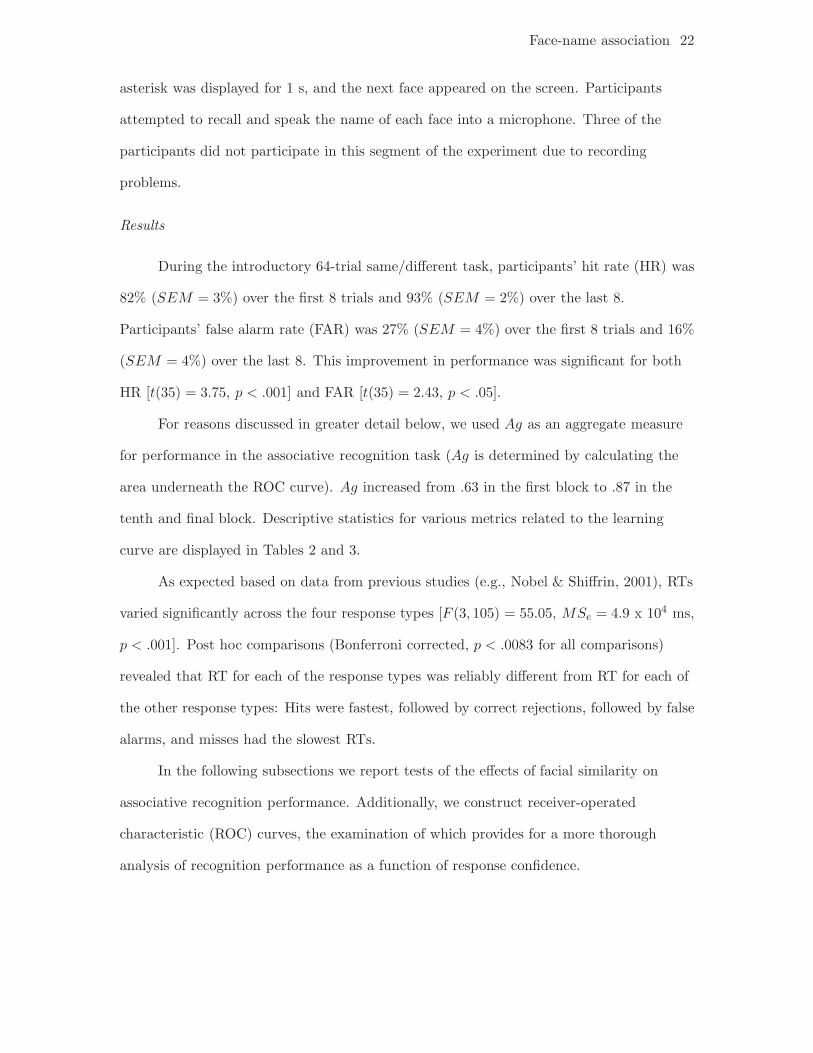
asterisk was displayed for 1 s, and the next face appeared on the screen. Participants
attempted to recall and speak the name of each face into a microphone. Three of the
participants did not participate in this segment of the experiment due to recording
problems.
Results
During the introductory 64-trial same/di!erent task, participants’ hit rate (HR) was
82% (SEM = 3%) over the first 8 trials and 93% (SEM = 2%) over the last 8.
Participants’ false alarm rate (FAR) was 27% (SEM = 4%) over the first 8 trials and 16%
(SEM = 4%) over the last 8. This improvement in performance was significant for both
HR [t(35) = 3.75, p < .001] and FAR [t(35) = 2.43, p < .05].
For reasons discussed in greater detail below, we used Ag as an aggregate measure
for performance in the associative recognition task (Ag is determined by calculating the
area underneath the ROC curve). Ag increased from .63 in the first block to .87 in the
tenth and final block. Descriptive statistics for various metrics related to the learning
curve are displayed in Tables 2 and 3.
As expected based on data from previous studies (e.g., Nobel & Shi!rin, 2001), RTs
varied significantly across the four response types [F (3, 105) = 55.05, MSe = 4.9 x 10⁴ ms,
p < .001]. Post hoc comparisons (Bonferroni corrected, p < .0083 for all comparisons)
revealed that RT for each of the response types was reliably di!erent from RT for each of
the other response types: Hits were fastest, followed by correct rejections, followed by false
alarms, and misses had the slowest RTs.
In the following subsections we report tests of the e!ects of facial similarity on
associative recognition performance. Additionally, we construct receiver-operated
characteristic (ROC) curves, the examination of which provides for a more thorough
analysis of recognition performance as a function of response confidence.

Face-name association 23
Insert Table 2 about here
Neighborhood E!ect: As in previous experiments, our question of primary interest
was whether memory for a face-name association was a!ected by how many faces in the
study set were in proximity to the face in similarity space. Each of the 16 faces had
between 5 and 10 neighbors within the study set. We first separated the faces into “low”
(5-6 neighbors), “medium” (7-8), and “high” (9-10) neighbor conditions.
To assess the reliability of the neighborhood e!ect, we regressed our aggregate
performance measure, Ag, on number of neighbors (low, medium, high). The
neighborhood e!ect was significant for Ag (i.e., the fewer the neighbors within the study
set, the higher the Ag at test) [t(35) = !2.05, p < .05]1. However, when the e!ect was
analyzed separately for hit rate (HR) and false alarm rate (FAR), it was only marginally
significant for HR [t(35) = !1.99, p = .055] and not significant for FAR [t(35) = !0.50,
n.s.] (see Table 4 for full descriptions of statistics for these regressions and those to follow).
We also examined neighborhood density e!ects on confidence judgments and
reaction time. Participants gave significantly higher confidence judgments to target pairs
with lower neighborhood density (fewer neighbors) [t(35) = !2.38, p < .05]. They also
responded more quickly when correctly identifying these pairs as targets [t(35) = 3.64,
p < .001]. In the case of lure pairs, the e!ect of neighborhood density on confidence did
not reach significance [t(35) = 0.79, n.s.]. Similarly, RT for correct rejections was not
significantly a!ected by the number of neighbors [t(35) = !0.19, n.s.]. There was no
significant neighborhood density e!ect on RT for misses [t(35) = 0.67, n.s.] or false alarms
[t(35) = 0.16, n.s.].
The e!ect of neighborhood density condition (low, medium, or high) on all of these
metrics was also analyzed with repeated measures ANOVAs (see Table 5). Consistent

Face-name association 24
with the previous set of analyses, one-way ANOVAs revealed a significant e!ect of
neighborhood density on Ag, reaction time for hits, and confidence for target trials.
Neighborhood density e!ects on other metrics were not significant. Another set of
two-way ANOVAs showed no significant interaction e!ects between neighborhood density
(low, medium, high) and block number [“early” (blocks 1-5) versus “late” (blocks 6-10)],
[F (2, 70) < 1 for all interactions, n.s.].
Insert Table 3 about here
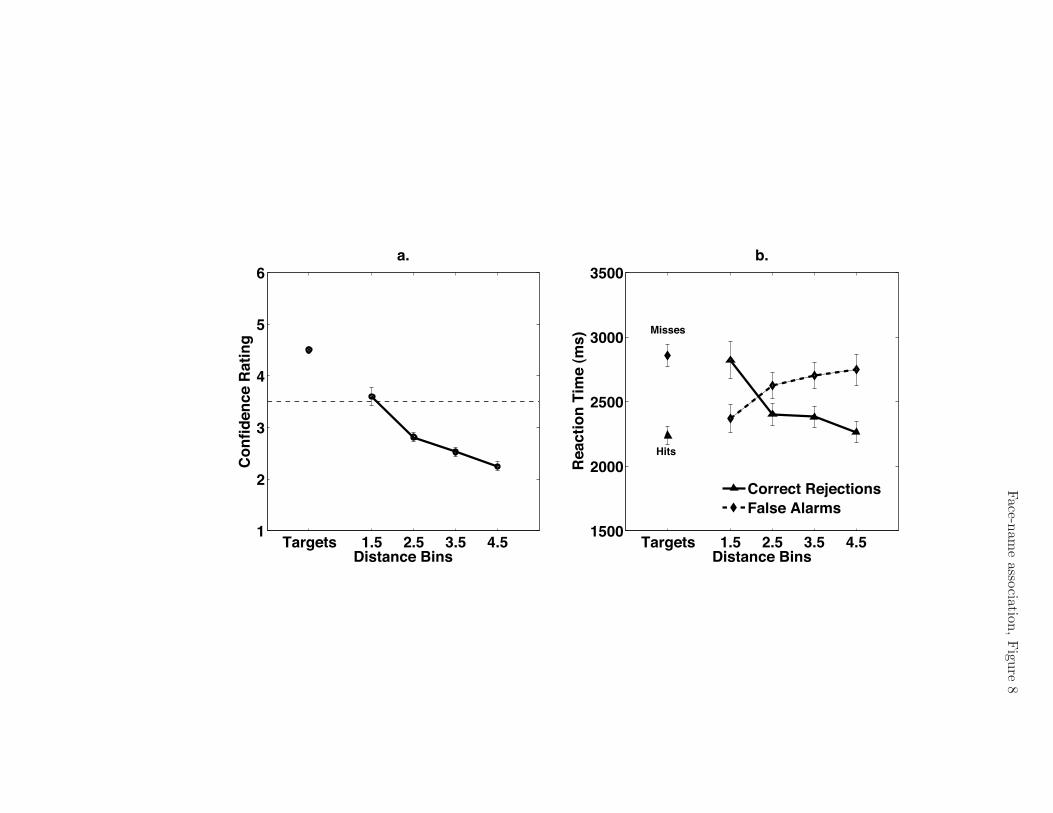
Confidence Judgments: Because confidence judgments may provide a more sensitive
metric of probe familiarity than HR or FAR, we examined the average confidence
judgments participants gave, as a function of the Euclidean distance in similarity space
between the probe face in the pair and the face belonging to the probe name (see Fig. 8,
Panel a). One would expect greater associative interference for a given face-name pair to
result in a less confident—and for the purposes of this experiment, less accurate—response.
For this analysis, a target (correctly-paired) pair was assigned a Euclidean distance
of 0, and lure (incorrectly-paired) pairs could have varying distances. Lure trials were
placed into four distance bins, and average confidence judgment was regressed on distance
for each participant. Not surprisingly, the closer the lure face was to the correct face, the
higher the judgment given. The 95% confidence interval for the slope of this line was (-.54,
-.33), [t(35) = !8.18, p < .001].
RT data were in line with the results observed in confidence judgments. For target
trials, hits (M = 2237 ms, SD = 421 ms) were significantly faster than misses (M = 2858
ms, SD = 518 ms), [t(35) = 11.99, p < .001]. For lure trials, RTs showed opposite trends
depending on whether they were false alarms (lure trials on which participants responded
with confidence ratings between 4 and 6) or correct rejections (lure trials on which

Face-name association 25
participants responded with confidence ratings between 1 and 3) (see Fig. 8, Panel b).
The shorter the distance, the faster the false alarm, and the 95% confidence interval for
the slope of this regression was (58, 198) ms, [t(35) = 3.70, p < .001]. Conversely, the
shorter the distance, the slower the reaction time if the participant was to correctly reject
the lure. The 95% confidence interval for the slope of this regression was (-236, -80) ms,
[t(35) = !4.10, p < .001].
Insert Figure 8 about here
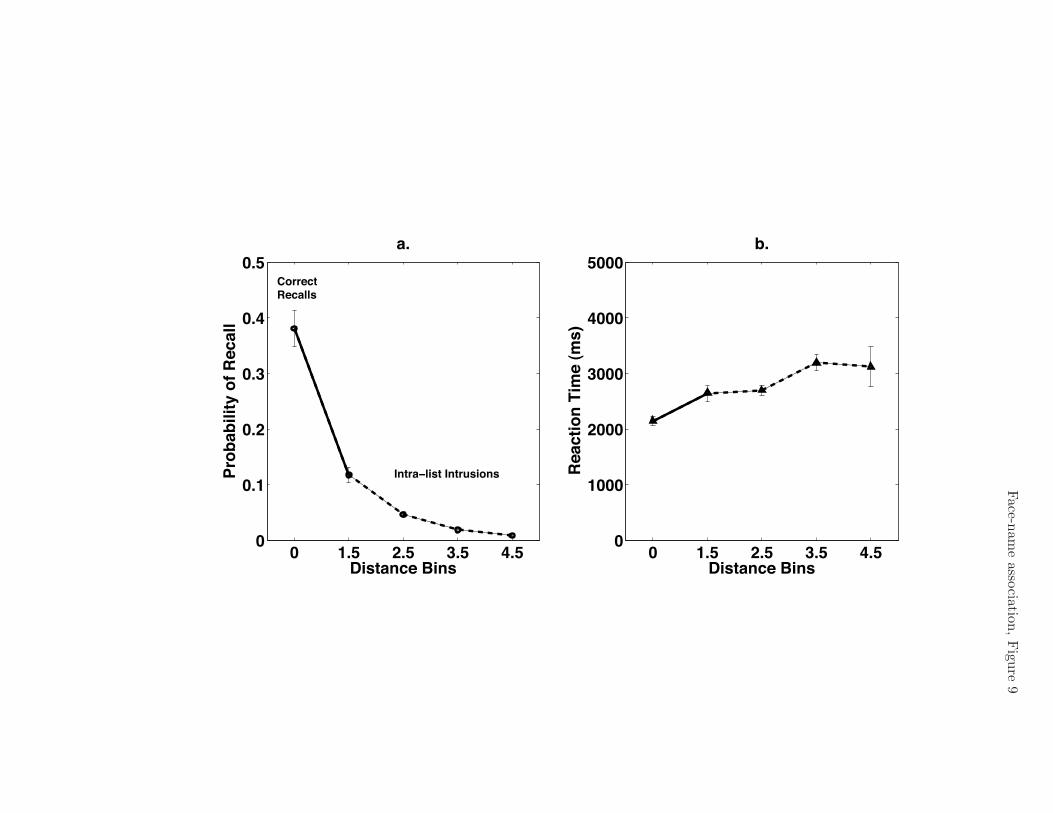
Final Cued Recall: We further examined to what extent the e!ects observed in
direct cued recall (Experiments 1 and 2) could be extended to final cued recall in the
current experiment. The intra-list intrusion e!ects observed in Experiments 1 and 2
replicated in the cued recall task presented at the end of each participant’s experimental
session. Figure 9a shows the probability of correct recall data alongside the data for
conditional probability of intra-list intrusion, on the same Euclidean distance scale.
Corresponding RTs for these recalls are shown in Figure 9b.
Both of these similarity e!ects were significant. The 95% CI for the regression of
probability of intra-list intrusion on distance was (-.04, -.03), [t(32) = !8.42, p < .001].
The 95% CI for the slope of the regression of intrusions’ RT on distance was (90, 453) ms,
[t(32) = 3.05, p < .01]. We then recalculated these linear regressions when including data
from correct recall trials along with the intra-list intrusion trials. In this case, the 95% CI
for the slope of the regression of probability of recall on distance was (-.10, -.07),
[t(32) = !13.05, p < .001], and the 95% CI for the slope of the regression of RT on
distance was (253, 388) ms, [t(32) = 9.71, p < .001].

Face-name association 26
Insert Figure 9 about here
Discussion
Experiment 3 demonstrated that the ability to recognize a face-name pair decreased
as a function of the number of similar faces that were present on the study list, and how
distant the probe face was in similarity space from the face that had been paired with the
probe name at study. Although the observation of a neighborhood e!ect in recognition
may seem intuitive given that we observed similar results in our cued recall experiments,
the previous literature on verbal associations suggests that net performance in associative
recognition may be immune to similarity-based interference. For instance, Dyne,
Humphreys, Bain, and Pike (1990) presented participants with a verbal associative
recognition task, for which some pairs were studied among other pairs designed to produce
interference (i.e., A-B and later A-C in the same study list). Test items were constructed
by rearranging some of the word pairs and leaving others intact. The experimenters found
that both HR and FAR were greater for probe pairs that had been subject to interference
at study. As a result, while cued recall performance had been reliably worse under
associative interference conditions, they found no net e!ect in associative recognition, and
this was put forth as evidence for a fundamental di!erence between associative recognition
and associative recall (see, also, Postman, 1976). These results were consistent with the
predictions of various summed similarity or global matching memory models (e.g., Gillund
& Shi!rin, 1984; D. Hintzman, 1984; Humphreys, Bain, & Pike, 1989; Murdock, 1982).
Another study, however, has found some evidence for similarity-based interference in
associative recognition. Criss and Shi!rin (2004) had participants study lists of three
categories of associations, varying the proportions of face-face, name-name, and face-name

Face-name association 27
associations. The larger the proportion of face-name associations, the worse associative
recognition performance for pairs from this category. This was interpreted as an increase
in similarity-based interference, because the larger the number of associations of the same
category, the stronger the interference from competing pairs in this category. In contrast
to our parametric analysis of similarity, the manipulation of similarity in this study was
categorical.
The results observed in Experiment 3 demonstrated an e!ect on performance (Ag)
resulting from associative interference. Dyne et al. (1990) note that the concept of
associative interference suggests that the learning of A-C somehow weakens the learning of
A-B. In an associative recognition task, this would lead one to expect worse performance
for target (intact) pairs in high-interference conditions and yet no marked e!ect on
performance related to lure (rearranged) pairs. This is a scenario consistent with the
results we observed when examining neighborhood density e!ects on HR, FAR, reaction
time, and confidence in Experiment 3.
However, the interference e!ects we observed were of a subtly di!erent variety than
those searched for by Dyne et al. (1990). In our results, confidence and latency of
responses for target and lure trials of varying distances suggested that the associative
interference was attributable not only to a weakening of the association between Face A
and Name A, but, relatedly, to partial association of Name A to the other competing faces
studied in the list. With faces whose similarities were known, we observed in Experiments
1 and 3 that the relative magnitudes of these partial associations were a direct function of
the Euclidean distances in similarity space between the target and competitor faces. For
example, the confidence judgment data indicated that for lure pairs extremely close to
what would have been the correct pairing, participants could typically not discriminate, as
the average response was approximately halfway between a “yes” or “no” response.

Face-name association 28
General Discussion
We observed that in both cued recall (Experiment 1 and 2) and associative
recognition (Experiment 3) participants’ memory for face-name pairs depended
parametrically on the number of similar competitors within the study set. Specifically,
faces that were distinctive among the study set yielded superior recall and recognition
performance than faces that were situated in a dense region of the face similarity space.
Furthermore, whenever participants made intrusions, they were more likely to come from
nearby faces in face space. Thus, these findings show that similarity among faces for
which names are being learned plays a major role in modulating the e#cacy of an
imperfect memory system during this task.
Although similarity e!ects have long been known to play an important role in a wide
range of memory tasks (Kahana, in press) the dominance of verbal materials in associative
memory studies has made it di#cult to examine similarity e!ects parametrically. By
employing a special class of di#cult-to-verbalize visual stimuli, namely faces, and by using
similarity ratings to obtain a multidimensional scaling solution for these stimuli, we were
able to more precisely characterize the role of similarity in associative memory. We can
thus go beyond the qualitative observation that highly similar stimuli produce greater
interference than weakly similar stimuli, by illustrating the functional relation between
similarity and a variety of measures of memory performance, including recall accuracy and
latency, intrusion rates, hit rates, false alarm rates, and response confidence.
One of our major research questions was whether interference e!ects would di!er
between associative recognition and cued recall, as has been proposed
previously (Postman, 1976). Yet, the interference e!ects we observed were quite similar
across the two tasks. This is further evidence for cognitive similarity between these two
memory tasks (Nobel & Shi!rin, 2001).
Finally, our data suggests that these interference e!ects were most likely not an

Face-name association 29
artifact of the di#cult and abstract face set we used in Experiments 1 and 3, but are
probably generalizable to the everyday task of learning the names of actual faces. The
faces we employed in Experiments 1 and 3 were more di#cult to tell apart than most faces
we encounter in every-day life. However, other studies support the claim that—especially
when one removes distinguishing features such as hairstyle, facial hair and skin
pigmentation—the general ability to discriminate between faces viewed in isolation is
cognitively complex and specifically vulnerable to a variety of perceptual manipulations
(for an extensive discussion of various factors related to face processing and recognition,
see Sinha, Balas, Ostrovsky, & Russell, 2006). Nonetheless, even when we restricted our
analysis to those participants who were able to discriminate among the faces without
making any errors on 8 consecutive trials, we observed the same neighborhood density
e!ects (see Experiment 1). Furthermore, Experiment 2 demonstrated that even when
discrimination between faces in a study set is made easier, the e!ects of similarity on
associative memory are still quite apparent. This helps to support the claim that these
memory e!ects are dissociable from perceptual confusion.
When we attempt to associate a name—an identity—to a person, we probably rely
on features other than the person’s face more than we realize. The person’s hairstyle, the
clothes he typically wears, his physical stature, semantic information known about the
person, and the context within which we typically encounter the person all provide cues
and mediating associations for the identification of a person and retrieval of his name (see
Goshen-Gottstein & Ganel, 2000 and Ganel & Goshen-Gottstein, 2002 for examples of
how hair, for instance, is used heuristically to process faces). Using a combination of cues
may be more reliable than relying on facial features alone. In Experiments 1 and 3, the
presented face was accompanied by a spoken name, but the voice was identical for every
face. We expect that if these experiments would have been performed with distinctive
voices for each face, participants would have learned the associations more easily. In

Face-name association 30
essence, the distinctiveness of the additional auditory information would act to reduce to
similarities among the name representations (and possibly even among the face
representations). If one assumes that voice, clothing and so on are additional elements in
the similarity vector, which would be auto-associated upon learning, then these additional
features should facilitate performance on both recall and recognition tasks (cf.
Underwood, 1969; Polyn, Norman, & Kahana, submitted). This hypothesis could be
tested by future experiments or simulations.
We interpret the data from all three experiments as indicating that the associative
interference resulted from names being partially associated with faces in the study set
other than the correct face. Because the extent of an incorrect partial association was a
function of how near in similarity space the also-studied face was to the correct face,
learning was weaker for faces with a greater number of competing faces nearby in
similarity space. Within an experiment, all face-name pairs were studied among lists of
the same size, but performance su!ered most for those faces with greater within-study set
neighborhood density.
This interpretation comports well with attribute similarity and neural network
models of associative memory (Bogacz, Brown, & Giraud-Carrier, 2001; D. L. Hintzman,
1988; Humphreys, Pike, Bain, & Tehan, 1989; Kahana, Rizzuto, & Schneider, 2005;
Murdock, 1982; Nosofsky, 1991; Rizzuto & Kahana, 2001). According to these models,
items in memory are represented as either vectors of attribute values or as patterns of
neural firing rates. Both cued recall and associative recognition rely on the formation and
retrieval of associative structures binding the constituent vectors. It can easily be shown
that similarity increases the interference between item representations during the
associative retrieval process (e.g., Monaco, Abbott, & Kahana, 2007; Murdock, 1989,
1992). Applying computational memory models to the similarity e!ects observed in both
cued recall and associative recognition constitutes an important direction for future work.
Face-name association 31
References
Bogacz, R., Brown, M. W., & Giraud-Carrier, C. (2001, Jan-Feb). Model of familiarity
discrimination in the perirhinal cortex. Journal of Computational Neuroscience,
10 (1), 5-23.
Bower, G. H., Thompson-Schill, S., & Tulving, E. (1994). Reducing retroactive
interference: An interference analysis. Journal of Experimental Psychology:
Learning, Memory and Cognition, 20, 51-66.
Busey, T. A., & Tunnicli!, J. L. (1999). Accounts of blending, distinctiveness, and
typicality in the false recognition of faces. Journal of Experimental Psychology:
Learning, Memory, and Cognition, 25 (5), 1210-1235.
Criss, A. H., & Shi!rin, R. M. (2004). Pairs do not su!er interference from other types of
pairs or single items in associative recognition. Memory & Cognition, 32 (8),
1284–1297.
Dyne, A. M., Humphreys, M. S., Bain, J. D., & Pike, R. (1990). Associative interference
e!ects in recognition and recall. Journal of Experimental Psychology: Learning,
Memory, and Cognition, 16, 813-824.
Feldman, S. M., & Underwood, B. J. (1957). Stimulus recall following paired-associate
learning. Journal of Experimental Psychology, 53 (1), 11–15.
Fraas, M., Lockwood, J., Neils-Strunjas, J., Shidler, M., Krikorian, R., & Weiler, E.
(2002). ‘What’s his name?’ a comparison of elderly participants’ and undergraduate
students’ misnamings. Archives of Gerontology and Geriatrics, 34, 155–165.
Ganel, T., & Goshen-Gottstein, Y. (2002). Perceptual integrality of sex and identity of
faces: Further evidence for the single-route hypothesis. Human Perception and
Performance, 28(4), 854–867.
Geller, A. S., Schleifer, I. K., Sederberg, P. B., Jacobs, J., & Kahana, M. J. (2007).
PyEPL: A cross-platform experiment-programming library. Behavior Research

Face-name association 32
Methods, 39 (4).
Gibson, E. J. (1940). A systematic application of the concepts of generalization and
di!erentiation to verbal learning. Psychological Review, 47 (3), 196–229.
Gillund, G., & Shi!rin, R. M. (1984). A retrieval model for both recognition and recall.
Psychological Review, 91, 1-67.
Goshen-Gottstein, Y., & Ganel, T. (2000). Repetition priming for familiar and unfamiliar
faces in a sex-judgment task: Evidence for a common route for the processing of sex
and identity. Journal of Experimental Psychology: Learning, Memory, and
Cognition, 26(5), 1198–1214.
Habak, C., Wilkinson, F., & Wilson, H. R. (2008). Aging disrupts the neural
transformations that link facial identity across views. Vision Research, 48, 9–15.
Hintzman, D. (1984). Minerva 2: A simulation of human memory. Behavioral Research
Methods, Instrumentation, and Computers, 26, 96–101.
Hintzman, D. L. (1988). Judgments of frequency and recognition memory in
multiple-trace memory model. Psychological Review, 95, 528-551.
Hockley, W. E. (2008). Memory search: A matter of time. In Learning and memory: A
comprehensive reference. Elsevier.
Humphreys, M. S., Bain, J. D., & Pike, R. (1989). Di!erent ways to cue a coherent
memory system: A theory for episodic, semantic, and procedural tasks.
Psychological Review, 96, 208-233.
Humphreys, M. S., Pike, R., Bain, J. D., & Tehan, G. (1989). Global matching: A
comparison of the SAM, Minerva II, Matrix, and TODAM models. Journal of
Mathematical Psychology, 33, 36-67.
Kahana, M. J. (in press). Foundations of human memory. Oxford University Press.
Kahana, M. J., & Bennett, P. J. (1994). Classification and perceived similarity of
compound gratings that di!er in relative spatial phase. Perception & Psychophysics,

Face-name association 33
55, 642-656.
Kahana, M. J., Rizzuto, D. S., & Schneider, A. (2005). Theoretical correlations and
measured correlations: Relating recognition and recall in four distributed memory
models. Journal of Experimental Psychology: Learning, Memory, and Cognition, 31,
933-953.
Kahana, M. J., & Sekuler, R. (2002). Recognizing spatial patterns: A noisy exemplar
approach. Vision Research, 42, 2177-2192.
Keppel, G. (1968). Verbal behavior and general behavior theory. In T. R. Dixon & D. L.
Horton (Eds.), (chap. Retroactive and proactive inhibition). Prentice-Hall.
Knapp, B. R., Nosofsky, R. M., & Busey, T. A. (2006). Recognizing distinctive faces: A
hybrid-similarity exemplar model account. Memory and Cognition, 34(4), 877–889.
Lea, M. A., Thomas, R. D., Lamkin, N. A., & Bell, A. (in press). Who do you look like?
evidence for facial stereotypes for male names. Psychonomic Bulletin & Review.
Lee, M. D. (2001). Determining the dimensionality of multidimensional scaling
representations for cognitive modeling. Journal of Mathematical Psychology, 45,
149–166.
Levitt, H., & Goss, A. E. (1961). Stimulus attributes and drive in paired-associate
learning. Journal of Experimental Psychology, 62 (3), 243–252.
Lo"er, G., Yourganov, G., Wilkinson, F., & Wilson, H. R. (2005). fMRI evidence for the
neural representation of faces. Nature Neuroscience, 8 (10), 1386-1390.
McGeoch, J. A. (1942). The psychology of human learning: An introduction. New York:
Longmans.
Monaco, J. D., Abbott, L. F., & Kahana, M. J. (2007). Lexico-semantic structure and the
word-frequency e!ect in recognition memory. Learning and Memory, 14 (2), 204–13.
Murdock, B. B. (1982). A theory for the storage and retrieval of item and associative
information. Psychological Review, 89, 609-626.

Face-name association 34
Murdock, B. B. (1989). Learning in a distributed memory model. In C. Izawa (Ed.),
Current issues in cognitive processes: The floweree symposium on cognition (p.
69-106). Hillsdale, NJ: Lawrence Erlbaum and Associates.
Murdock, B. B. (1992). Item and associative information in a distributed memory model.
Journal of Mathematical Psychology, 36, 68-99.
Nelson, D. L., Bajo, M., McEvoy, C. L., & Schreiber, T. A. (1989). Prior knowledge: The
e!ects of natural category size on memory for implicitly encoded concepts. Journal
of Experimental Psychology: Learning, Memory, and Cognition, 15(5), 957–967.
Nelson, D. L., McKinney, V. M., Gee, N. R., & Janczura, G. A. (1998). Interpreting the
influence of implicitly activated memories on recall and recognition. Psychological
Review, 105, 299-324.
Newman, S. E., & Buckhout, R. (1962). S-R and R-S learning as functions of intralist
similarity. American Journal of Psychology, 75 (3), 429–436.
Nobel, P. A., & Shi!rin, R. M. (2001). Retrieval processes in recognition and cued recall.
Journal of Experimental Psychology: Learning Memory, and Cognition, 27, 384-413.
Nosofsky, R. M. (1991). Tests of an exemplar model for relating perceptual classification
and recognition memory. Journal of Experimental Psychology: Human Perception
and Performance, 17 (1), 3-27.
Osgood, C. E. (1949). The similarity paradox in human learning. Psychological Review,
56, 132-143.
O’Toole, A. J., Edelman, S., & Bultho!, H. H. (1998). Stimulus-specific e!ects in face
recognition over changes in viewpoint. Vision Research, 38, 2351-2363.
Polyn, S. M., Norman, K. A., & Kahana, M. J. (submitted). Episodic and semantic
organization during free recall: The control of memory search. Submitted.
Postman, L. (1976). Interference theory revisited. In J. Brown (Ed.), Recall and
recognition. Oxford, England: John Wiley and Sons.

Face-name association 35
Rizzuto, D. S., & Kahana, M. J. (2001). An autoassociative neural network model of
paired-associate learning. Neural Computation, 13, 2075-2092.
Robinson, E. S. (1927). The ’similarity’ factor in retroaction. American Journal of
Psychology, 39 (1/4), 297-312.
Sammon, J. W. (1969). A nonlinear mapping for data structure analysis. IEEE
Transactions on Computers, C-18 (5), 401–409.
Sederberg, P. B., Gauthier, L. V., Terushkin, V., Miller, J. F., Barnathan, J. A., &
Kahana, M. J. (2006). Oscillatory correlates of the primacy e!ect in episodic
memory. NeuroImage, 32 (3), 1422–1431.
Sinha, P., Balas, B., Ostrovsky, Y., & Russell, R. (2006). Face recognition by humans: 19
results all computer vision researchers should know about. Proceedings of the IEEE,
94(11), 1948-1962.
Skaggs, E. B. (1925). Further studies in retroactive inhibition. Psychological Monographs,
34 (161), 1–60.
Takane, Y., Young, F. W., & Leeuw, J. de. (1977). Nonmetric individual di!erences
multidimensional scaling: an alternating least squares method with optimal scaling
features. Psychometrika, 42 (1), 7-67.
Underwood, B. J. (1953). Studies of distributed practice: VIII. Learning and retention of
paired nonsense syllables as a function of intralist similarity. Journal of
Experimental Psychology, 45 (3), 133–142.
Underwood, B. J. (1969). Some correlates of item repetition in free-recall learning.
Journal of Verbal Learning and Verbal Behavior, 8, 83-94.
van Vugt, M. K., Sekuler, R., Wilson, H. R., & Kahana, M. J. (submitted). Distinct
electrophysiological correlates of proactive and similarity-based interference in visual
working memory. Submitted.
Verde, M. F., & Rotello, C. M. (2004). Strong memories obscure weak memories in

Face-name association 36
associative recognition. Psychonomic Bulletin & Review, 11, 1062-1066.
Wilson, H. R., Lo"er, G., & Wilkinson, F. (2002). Synthetic faces, face cubes, and the
geometry of face space. Vision Research, 42 (27), 2909-2923.
Yonelinas, A. P. (1997). Recognition memory ROCs for item and associative information:
The contribution of recollection and familiarity. Memory & Cognition, 25, 747-763.
Yotsumoto, Y., Kahana, M. J., Wilson, H. R., & Sekuler, R. (2007, Sep). Recognition
memory for realistic synthetic faces. Memory & Cognition, 35 (6), 1233-1244.

Face-name association 37
Author Note
Corresponding author: M. J. Kahana ([email protected]); Dept of
Psychology; 3401 Walnut St, Rm 302C; Phialadelphia PA 19104. phone 215-746-3501.
The authors acknowledge support from the CELEST grant SBE 0354378, Conte center
grant P50 MH062196, NIH grants RO1 MH061975, MH068404, EY002158 and MH055678,
and the University of Pennsylvania Vagelos Fund.

Face-name association 38
Notes
1An receiver-operating characteristic (ROC) analysis confirmed that the e!ect of
neighborhood density was consistent across varying decision criteria, and that the
z-transformed ROC curve for associative recognition was approximately linear, and the
slope had a 95% CI of (1.10, 1.28)).

Face-name association 39
Table 1
Means and standard deviations (in parentheses) of recall probability and reaction time, by
block in cued recall (Experiment 1).
Block Recall probability Reaction Time (s)
1 .28(.14) 2.5(.5)
2 .44(.15) 2.5(.7)
3 .56(.19) 2.2(.4)
4 .66(.17) 2.2(.4)
5 .66(.19) 2.2(.5)
6 .70(.16) 2.1(.4)
7 .76(.23) 2.1(.4)
8 .81(.17) 2.1(.4)
9 .80(.19) 2.0(.4)
10 .83(.20) 2.1(.5)
Face-name association 40
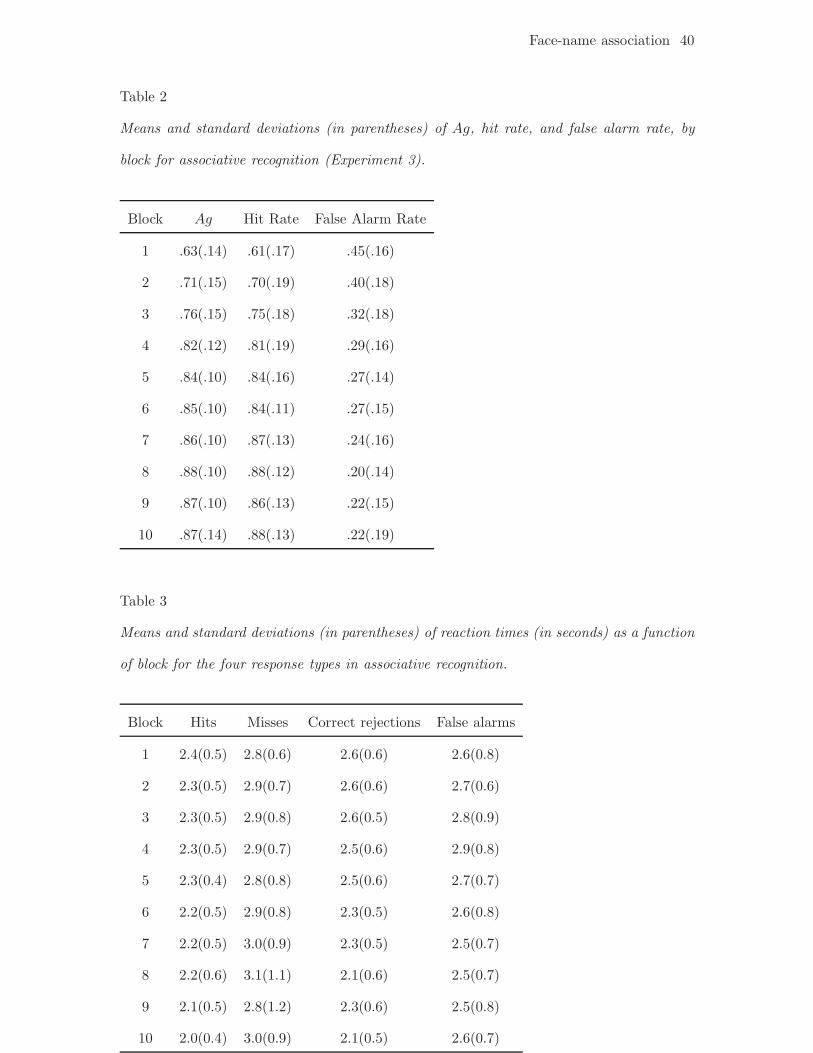
Table 2
Means and standard deviations (in parentheses) of Ag, hit rate, and false alarm rate, by
block for associative recognition (Experiment 3).
Block Ag Hit Rate False Alarm Rate
1 .63(.14) .61(.17) .45(.16)
2 .71(.15) .70(.19) .40(.18)
3 .76(.15) .75(.18) .32(.18)
4 .82(.12) .81(.19) .29(.16)
5 .84(.10) .84(.16) .27(.14)
6 .85(.10) .84(.11) .27(.15)
7 .86(.10) .87(.13) .24(.16)
8 .88(.10) .88(.12) .20(.14)
9 .87(.10) .86(.13) .22(.15)
10 .87(.14) .88(.13) .22(.19)
Table 3
Means and standard deviations (in parentheses) of reaction times (in seconds) as a function
of block for the four response types in associative recognition.
Block Hits Misses Correct rejections False alarms
1 2.4(0.5) 2.8(0.6) 2.6(0.6) 2.6(0.8)
2 2.3(0.5) 2.9(0.7) 2.6(0.6) 2.7(0.6)
3 2.3(0.5) 2.9(0.8) 2.6(0.5) 2.8(0.9)
4 2.3(0.5) 2.9(0.7) 2.5(0.6) 2.9(0.8)
5 2.3(0.4) 2.8(0.8) 2.5(0.6) 2.7(0.7)
6 2.2(0.5) 2.9(0.8) 2.3(0.5) 2.6(0.8)
7 2.2(0.5) 3.0(0.9) 2.3(0.5) 2.5(0.7)
8 2.2(0.6) 3.1(1.1) 2.1(0.6) 2.5(0.7)
9 2.1(0.5) 2.8(1.2) 2.3(0.6) 2.5(0.8)
10 2.0(0.4) 3.0(0.9) 2.1(0.5) 2.6(0.7)
Face-name association 41
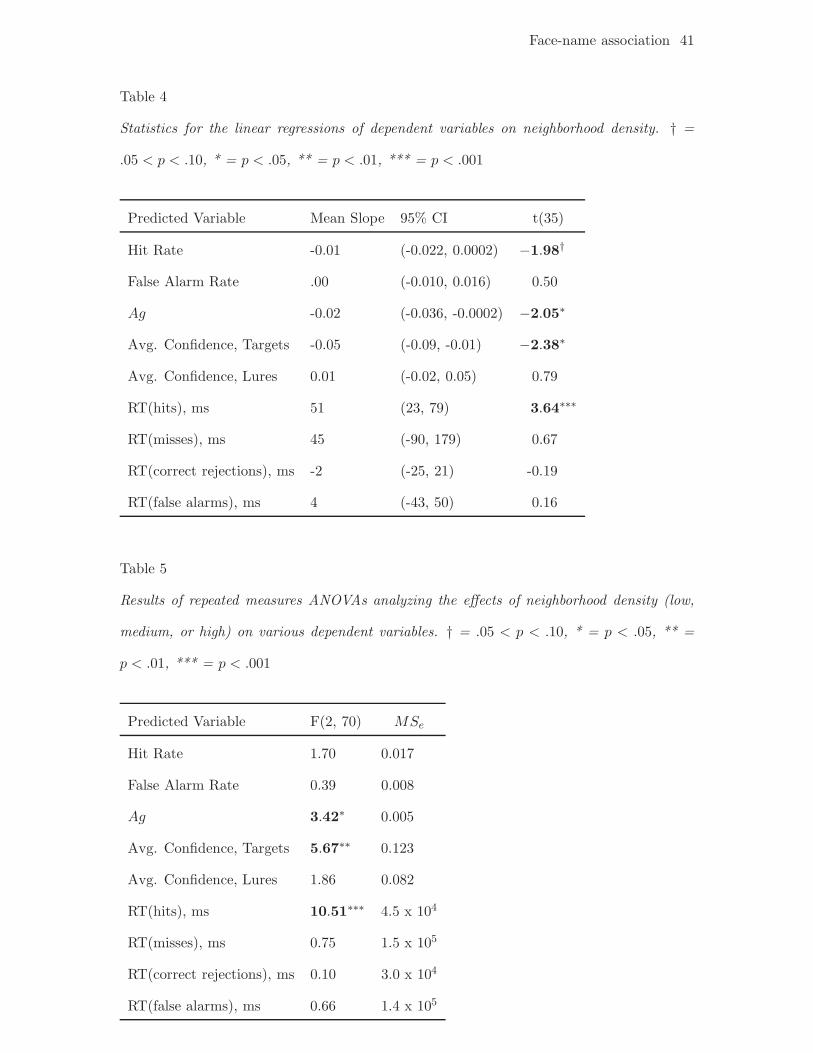
Table 4
Statistics for the linear regressions of dependent variables on neighborhood density. † =
.05 < p < .10, * = p < .05, ** = p < .01, *** = p < .001
Predicted Variable Mean Slope 95% CI t(35)
Hit Rate -0.01 (-0.022, 0.0002) !1.98†
False Alarm Rate .00 (-0.010, 0.016) 0.50
Ag -0.02 (-0.036, -0.0002) !2.05!
Avg. Confidence, Targets -0.05 (-0.09, -0.01) !2.38!
Avg. Confidence, Lures 0.01 (-0.02, 0.05) 0.79
RT(hits), ms 51 (23, 79) 3.64!!!
RT(misses), ms 45 (-90, 179) 0.67
RT(correct rejections), ms -2 (-25, 21) -0.19
RT(false alarms), ms 4 (-43, 50) 0.16
Table 5
Results of repeated measures ANOVAs analyzing the e!ects of neighborhood density (low,
medium, or high) on various dependent variables. † = .05 < p < .10, * = p < .05, ** =
p < .01, *** = p < .001
Predicted Variable F(2, 70) MSe
Hit Rate 1.70 0.017
False Alarm Rate 0.39 0.008
Ag 3.42! 0.005
Avg. Confidence, Targets 5.67!! 0.123
Avg. Confidence, Lures 1.86 0.082
RT(hits), ms 10.51!!! 4.5 x 10⁴
RT(misses), ms 0.75 1.5 x 10⁵
RT(correct rejections), ms 0.10 3.0 x 10⁴
RT(false alarms), ms 0.66 1.4 x 10⁵

Face-name association 42
Figure Captions
Figure 1. Sample face-name pairs from Experiments 1 & 3 (a) and Experiment 2 (b).
Figure 2. Face stimuli used in Experiment 1, plotted in their four-dimensional
MDS-derived face space. The fourth dimension is indicated by the brightness of the face;
negative coordinates in this dimension are associated with darker colors.
Figure 3. Illustration of the procedures used during the introductory same-di!erent task
(a), study phases (b), and test phases (c) of Experiment 1.
Figure 4. The “Neighborhood” E!ect. Because of scarcity of data for faces with 7
neighbors, faces with 6 and 7 neighbors are collapsed into one bin. Error bars represent
±1 standard error of the mean.
Figure 5. Intra-list Intrusions. The left panel demonstrates the conditional probability of
making an intra-list intrusion, as a function of the Euclidean distance between the face
corresponding to the recalled name and the cue face. The right panel shows the
corresponding response latencies for these intrusions. Error bars represent ±1 standard
error of the mean.
Figure 6. The “Neighborhood” E!ect in Experiment 2. Low=0-1 neighbors, Medium=2-3,
High=4-5. Error bars represent ±1 standard error of the mean.
Figure 7. Experiment 2, Conditional probability of intra-list intrusion as a function of the
Euclidean distance between the face corresponding to the recalled name and the cue face.
Error bars represent ±1 standard error of the mean.
Figure 8. Average confidence judgment (left panel) and reaction time (right panel) as
functions of Euclidean distance between the probe face and the face belonging to the
Face-name association 43
probe name. In the left panel, confidence judgments above the dotted line were defined as
a response of “correct pairing”, and judgments below the dotted line represented a
response of “incorrect pairing.” Error bars represent ±1 standard error of the mean.
Figure 9. Final Cued Recall. The left panel demonstrates the conditional probability of
recalling a name as a function of the Euclidean distance between the cue face and the
corresponding face of the name (a correct recall has a distance of zero.) The right panel
demonstrates the corresponding reaction times of these recalls. Error bars represent ±1
standard error of the mean.

Face-name association, Figure 1

Face-name association, Figure 2
Face-name association, Figure 3
a. same-di!erent task b. study phase c. test phase
Face-n
ame
association,Figu
re4
0 1 2 3 4 5 6−70.4
0.5
0.6
0.7
0.8
0.9
1a.
Number of Neighbors
Prob
abili
ty o
f Cor
rect
Rec
all
0 1 2 3 4 5 6−71000
1500
2000
2500
3000b.
Number of NeighborsRe
actio
n Ti
me
(ms)

Face-n
ame
association,Figu
re5
.5 1 1.5 2 2.5 3 3.5 >3.50
0.05
0.1
0.15
0.2a.
Distance Bins
Prob
abili
ty o
f Int
ra−L
ist I
ntru
sion
.5 1 1.5 2 2.5 3 3.5 >3.52000
2500
3000
3500
4000b.
Reac
tion
Tim
e (m
s)Distance Bins

Face-n
ame
association,Figu
re6
Low Medium High0.3
0.4
0.5
0.6
0.7
0.8
0.9
Number of Neighbors
Prob
abili
ty o
f Cor
rect
Rec
all
Face-n
ame
association,Figu
re7
3.5 4 5 6 70
0.005
0.01
0.015
0.02
0.025
Distance Bins
Prob
abili
ty o
f Int
ra−L
ist I
ntru
sion
Face-n
ame
association,Figu
re8
Targets 1.5 2.5 3.5 4.51
2
3
4
5
6a.
Distance Bins
Conf
iden
ce R
atin
g
Targets 1.5 2.5 3.5 4.51500
2000
2500
3000
3500b.
Distance BinsRe
actio
n Ti
me
(ms)
Correct RejectionsFalse Alarms
Misses
Hits
Face-n
ame
association,Figu
re9
0 1.5 2.5 3.5 4.50
0.1
0.2
0.3
0.4
0.5
Distance Bins
Prob
abili
ty o
f Rec
all
a.
0 1.5 2.5 3.5 4.50
1000
2000
3000
4000
5000
Distance BinsRe
actio
n Ti
me
(ms)
b.
CorrectRecalls
Intra−list Intrusions