faar homes sales report
TRANSCRIPT
FAAR Homes Sales Report
Virginia Home Sales Report Fourth Quarter and Year-End 2018

1
FAAR Home Sales Report
Second Quarter 2021
Fredericksburg Area Association of REALTORS® Market Report Key Takeaways
Economic Conditions • In the second quarter of 2021, economic growth continued to expand both statewide and in the
Fredericksburg region. The unemployment rate is still falling, though the pace of job growth slowed a bit in May.
• Consumer confidence was up strongly in the second quarter, reflecting optimism about the economy and pent-up consumer demand.
• Mortgage rates have settled back to around 3% and likely will remain below 3.5% for the rest of the year.
Housing Market Conditions • There were 2,892 homes sold in the FAAR region during the second quarter, a 25% increase from
last year.
• Home prices continue to climb in the FAAR area. The second quarter median sales price was $383,000, which is 15% higher than a year ago, a gain of $49,000.
• Inventory continued to shrink in the FAAR footprint, but the pace of decline has slowed compared
to recent quarters. There were 843 active listings in the region at the end of the second quarter, 19% fewer listings than a year ago.

2
Economy
4% Is the May-2021 unemployment rate in the FAAR footprint, which is up from Apr-2021
2.98% Is the 30-year fixed-rate mortgage rate during the first week of July 2021, which is down 0.09% from a year ago
Housing Market
575 More home sales in the FAAR footprint in Q2-2021 compared to last year
15% Percent change in median sales price in the FAAR region in Q2-2021 compared to a year ago
$381.9 Million dollars more in total sold volume in the FAAR footprint in Q2-2021 compared to last year
-19% Percent change in active listings at the end of Q2-2021 in the FAAR market compared to a year ago
1 Month of supply in the FAAR footprint in Q2-2021, which is down from a year ago
Key Trends Dashboard, FAAR

3
Economic Overview
Virginia’s economy is opening back up as vaccination rates climb and restrictions have been lifted. There have been job gains across most sectors of the economy. In addition, there is significant pent-up consumer demand in the market, which is a good sign for strong economic growth this year. Even as signs are positive, there remains uncertainty about how COVID-19 will impact the economy over the long-term.
In May 2021, which is the latest data available, there was a total of 3.89 million jobs in Virginia. After several months of job gains, the number of jobs in the state declined slightly between April and May. This slowdown indicates the uncertainty that remains in the economy, although the overall employment picture remains positive in the commonwealth.
The statewide unemployment rate was 4.1% in May 2021. The unemployment rate has fallen significantly from its peak last spring, although it remains higher than pre-pandemic levels. The unemployment rate in the Fredericksburg region was 4% in May 2021, up slightly from 3.8% in April 2021, but down significantly from the peak of 10.5%. Like the rest of the state, the region’s economy should continue to improve in 2021 and unemployment likely will fall in the months ahead.
-500
-400
-300
-200
-100
0
100
Figure 1 Virginia Month-to-Month Change in Jobs
Source: U.S. Bureau of Labor Statistics, Seasonally Adjusted
In Thousands

4
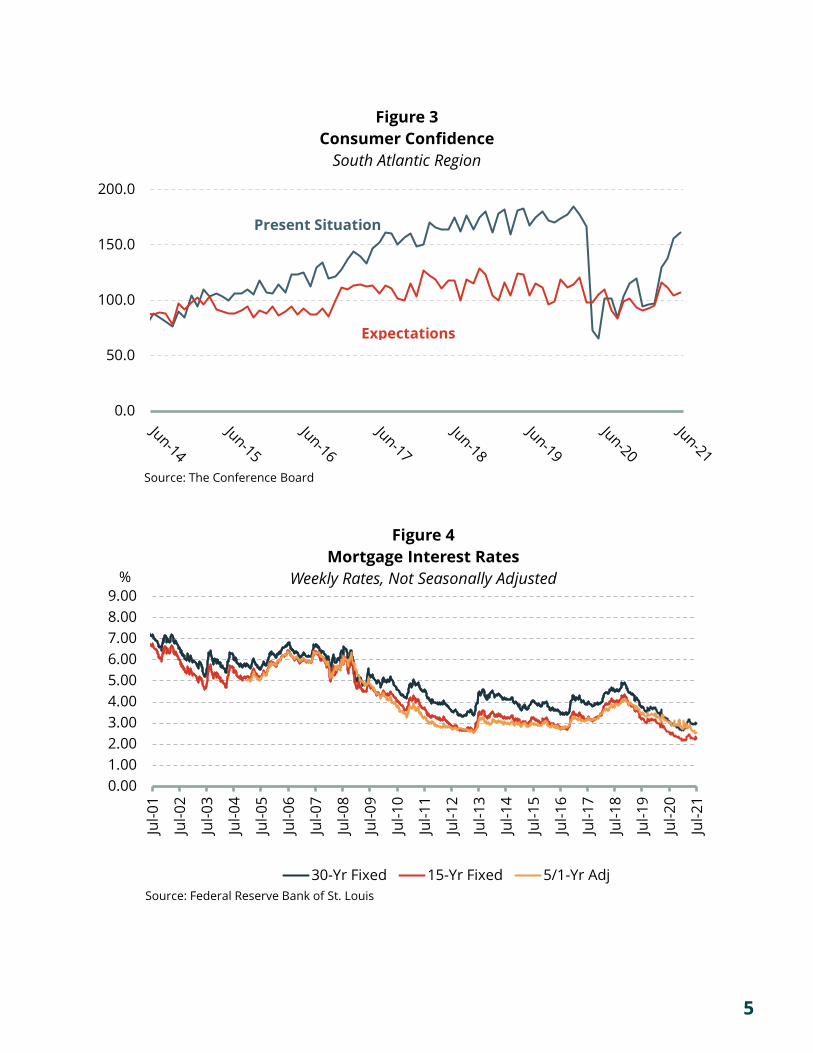
Consumer confidence continues to improve into the summer. In June 2021, the measure of confidence in the present economic situation was 161.7, up from 155.6 in May. The measure of consumers’ confidence in future economic conditions rose to 107.2 in June, an increase from May, though below earlier springtime levels. A consumer confidence index above 100 indicates people are feeling more optimistic about economic conditions.
Mortgage rates hit rock bottom levels at the end of last year and into early 2021. Despite a brief uptick in rates in late March and early April, the average 30-year fixed-rate mortgage rate has settled back down to around 3% at the beginning of July. Mortgage rates will rise slightly over the course of the next several months, but it is likely that rates will remain below 3.5% throughout the year.
0.0%
2.0%
4.0%
6.0%
8.0%
10.0%
12.0%
14.0%
16.0%
Figure 2Unemployment Rate
May 20215.5%4.1%
U.S.VA
FAAR4.0%
Source: U.S. Bureau of Labor Statistics, Local Area Unemployment Statistics
5
0.001.002.003.004.005.006.007.008.009.00
Jul-0
1
Jul-0
2
Jul-0
3
Jul-0
4
Jul-0
5
Jul-0
6
Jul-0
7
Jul-0
8
Jul-0
9
Jul-1
0
Jul-1
1
Jul-1
2
Jul-1
3
Jul-1
4
Jul-1
5
Jul-1
6
Jul-1
7
Jul-1
8
Jul-1
9
Jul-2
0
Jul-2
1
Figure 4Mortgage Interest Rates
Weekly Rates, Not Seasonally Adjusted
30-Yr Fixed 15-Yr Fixed 5/1-Yr AdjSource: Federal Reserve Bank of St. Louis
%
0.0
50.0
100.0
150.0
200.0
Figure 3Consumer Confidence
South Atlantic Region
Source: The Conference Board
Present Situation
Expectations

6
Housing Market Overview
It was a very busy spring in the FAAR regional housing market. Sales activity surged, and home prices rose throughout the footprint, which drove up the sold dollar volume in the area significantly. Homes sold much faster compared to last year and the inventory of active listings continued to shrink, but the rate of decline slowed down in the second quarter.
Sales
There were 2,892 homes sold across the FAAR footprint during the second quarter, which is 575 more sales than a year ago, representing a 25% increase. Sales activity was up in all three months of the quarter (April through June) compared to last year. While last spring home sales activity was down significantly in most markets at the onset of the pandemic, the FAAR area was one of only a few regional markets in Virginia that did not experience an overall market slowdown. While sales activity in the region as a whole did not decline last spring, some local markets did have a decrease in sales when the pandemic began including Caroline County, Orange County, Spotsylvania County, and Westmoreland County. Statewide, the number of home sales in the second quarter was up 30% compared to last year and is 16% higher than second quarter 2019 sales totals.
2,217 2,171 2,254 2,317
2,892
0
500
1,000
1,500
2,000
2,500
3,000
3,500
2017 - Q2 2018 - Q2 2019 - Q2 2020 - Q2 2021 - Q2
Sale
s
Figure 5Second Quarter Home Sales, FAAR
2017-2021
Source: Virginia REALTORS®, data accessed July 15, 2021
+25%-2%
+3%+4%

7
Caroline County: There were 216 sales in Caroline County during the second quarter, 27% more sales than a year ago, which is 46 additional sales. Caroline County was one market in the FAAR area where sales slowed last year. As a result, it is not surprising that sales activity this quarter exceeded last year, when the market slowed down with the onset of the pandemic.
Fredericksburg: Sales activity continued to surge in Fredericksburg. There were 136 sales in the city in the second quarter, 38 more sales than last year, representing a 39% increase. Sales activity in the city’s housing market has been expanding for five straight quarters.
King George County: There were 137 sales in King George County in the second quarter, eight more sales than last year, which is a 6% increase. Sales have been trending up in the county seven of the last eight quarters.
Orange County: There were 245 sales in Orange County during the second quarter, 57 more sales than last year, which is a 30% surge. Similar to some other local areas, sales were higher than last spring partially because of the slowdown in the county’s housing market triggered by the onset of the pandemic.
Spotsylvania County: Sales activity continued to increase in Spotsylvania County. There were 897 sales in the county during the second quarter, 178 more sales than a year ago, which is a 25% increase.
Stafford County: There were 1,096 sales in Stafford County in the second quarter, 175 more sales than this time last year, representing a 19% increase.
Westmoreland County: There were 165 sales in Westmoreland County in the second quarter, 73 more sales than this time last year, which is a 79% surge. The large influx of sales this quarter compared to last year partly reflects the slowdown that occurred last spring at the start of the pandemic.
Local Snapshot – Total Home Sales

8
‘
Jurisdiction 2020 - Q2 2021 - Q2 % Change
Caroline County 170 216 27%
Fredericksburg 98 136 39%
King George County 129 137 6%
Orange County 188 245 30%
Spotsylvania County 719 897 25%
Stafford County 921 1,096 19%
Westmoreland County 92 165 79%
Source: Virginia REALTORS®, data accessed July 15, 2021
Figure 6 Change in Sales by Jurisdiction
FAAR Second Quarter 2020 to Second Quarter 2021
+19%
+6%
+79% +27%
+25%
+30% +39%

9
Sales Prices
Home prices in the FAAR region continued to rise rapidly. The second quarter median sales price in the area was $383,000, which is 15% higher than last year, a gain of $49,000. This is the largest median price increase the region has had in more than five years. Upward pressure on prices driven by shrinking inventory and active buyers has been consistent in the FAAR market for several years. The second quarter median sales price is now $118,000 higher than it was at this time five years ago. In the second quarter, the median sales price statewide was $365,000, up 16% compared to a year ago.
$280,000 $285,500
$310,000
$334,000
$383,000
$225,000
$250,000
$275,000
$300,000
$325,000
$350,000
$375,000
$400,000
2017 - Q2 2018 - Q2 2019 - Q2 2020 - Q2 2021 - Q2
Figure 7Second Quarter Median Sales Price, FAAR
2017-2021
Source: Virginia REALTORS®, data accessed July 15, 2021
+15%
+8%
+9%
+2%
10
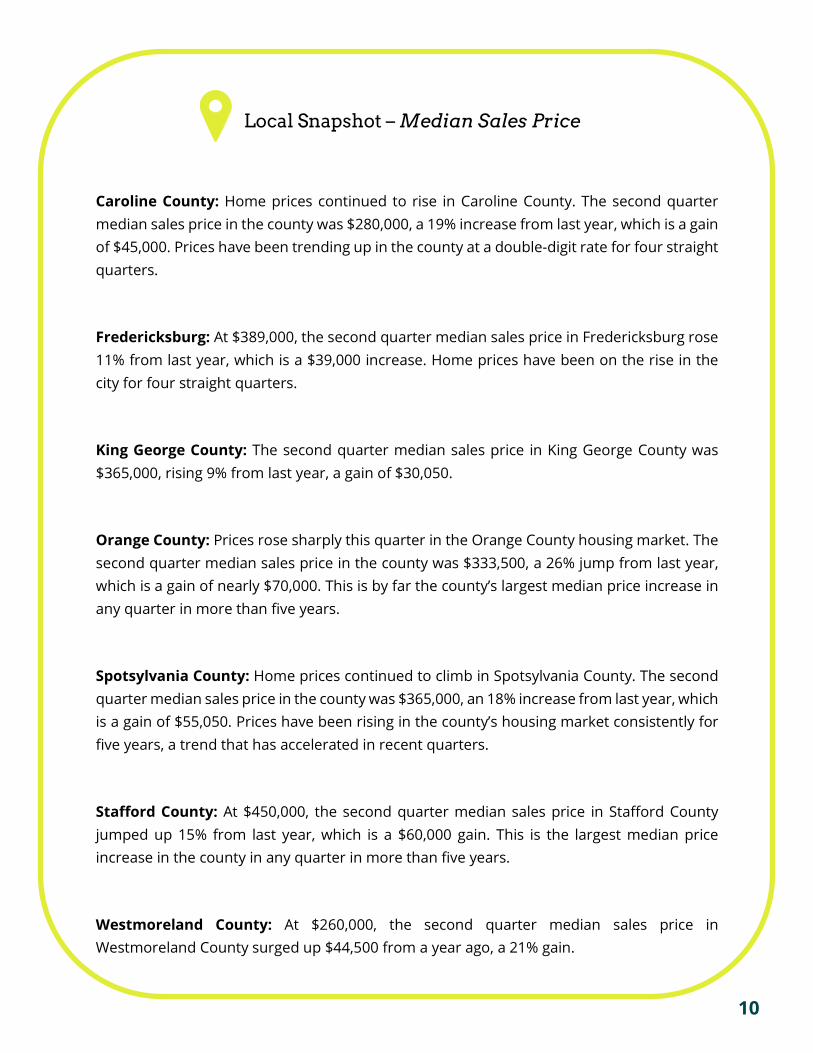
Caroline County: Home prices continued to rise in Caroline County. The second quarter median sales price in the county was $280,000, a 19% increase from last year, which is a gain of $45,000. Prices have been trending up in the county at a double-digit rate for four straight quarters.
Fredericksburg: At $389,000, the second quarter median sales price in Fredericksburg rose 11% from last year, which is a $39,000 increase. Home prices have been on the rise in the city for four straight quarters.
King George County: The second quarter median sales price in King George County was $365,000, rising 9% from last year, a gain of $30,050.
Orange County: Prices rose sharply this quarter in the Orange County housing market. The second quarter median sales price in the county was $333,500, a 26% jump from last year, which is a gain of nearly $70,000. This is by far the county’s largest median price increase in any quarter in more than five years.
Spotsylvania County: Home prices continued to climb in Spotsylvania County. The second quarter median sales price in the county was $365,000, an 18% increase from last year, which is a gain of $55,050. Prices have been rising in the county’s housing market consistently for five years, a trend that has accelerated in recent quarters.
Stafford County: At $450,000, the second quarter median sales price in Stafford County jumped up 15% from last year, which is a $60,000 gain. This is the largest median price increase in the county in any quarter in more than five years.
Westmoreland County: At $260,000, the second quarter median sales price in Westmoreland County surged up $44,500 from a year ago, a 21% gain.
Local Snapshot – Median Sales Price

11
Jurisdiction 2020 - Q2 2021 - Q2 % Change
Caroline County $235,000 $280,000 19%
Fredericksburg $350,000 $389,000 11%
King George County $334,950 $365,000 9%
Orange County $263,750 $333,500 26%
Spotsylvania County $309,950 $365,000 18%
Stafford County $390,000 $450,000 15%
Westmoreland County $215,500 $260,000 21%
Source: Virginia REALTORS®, data accessed July 15, 2021
Figure 8 Change in Median Sales Price by Jurisdiction
FAAR Second Quarter 2020 to Second Quarter 2021
+19%
+9%
+18%
+11% +26%
+15%
+21%

12
Sold Volume
As home prices soared and sales activity expanded, the sold dollar volume in the region’s housing market continued to surge. There was approximately $1.2 billion of sold volume in the FAAR housing market in the second quarter, an influx of $381.9 million compared to last year, which is a 47% jump. This is the largest sold volume increase in the FAAR region in more than five years.
$672.7 $679.9$737.9
$810.3
$1,192.2
$0$100$200$300$400$500$600$700$800$900
$1,000$1,100$1,200$1,300
2017 - Q2 2018 - Q2 2019 - Q2 2020 - Q2 2021 - Q2
Mill
ions
($)
Figure 9Second Quarter Sold Dollar Volume (Millions), FAAR
2017-2021
Source: Virginia REALTORS®, data accessed July 15, 2021
+47%
+10%+9%+1%
13
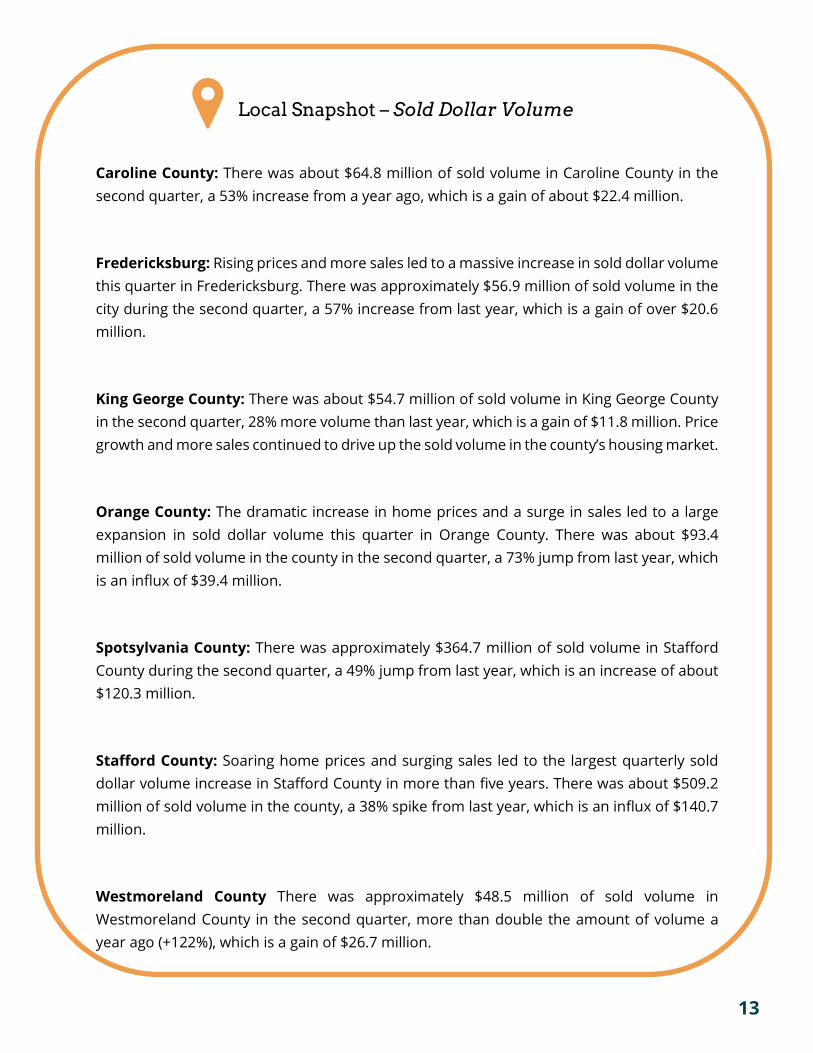
Caroline County: There was about $64.8 million of sold volume in Caroline County in the second quarter, a 53% increase from a year ago, which is a gain of about $22.4 million.
Fredericksburg: Rising prices and more sales led to a massive increase in sold dollar volume this quarter in Fredericksburg. There was approximately $56.9 million of sold volume in the city during the second quarter, a 57% increase from last year, which is a gain of over $20.6 million.
King George County: There was about $54.7 million of sold volume in King George County in the second quarter, 28% more volume than last year, which is a gain of $11.8 million. Price growth and more sales continued to drive up the sold volume in the county’s housing market.
Orange County: The dramatic increase in home prices and a surge in sales led to a large expansion in sold dollar volume this quarter in Orange County. There was about $93.4 million of sold volume in the county in the second quarter, a 73% jump from last year, which is an influx of $39.4 million.
Spotsylvania County: There was approximately $364.7 million of sold volume in Stafford County during the second quarter, a 49% jump from last year, which is an increase of about $120.3 million.
Stafford County: Soaring home prices and surging sales led to the largest quarterly sold dollar volume increase in Stafford County in more than five years. There was about $509.2 million of sold volume in the county, a 38% spike from last year, which is an influx of $140.7 million.
Westmoreland County There was approximately $48.5 million of sold volume in Westmoreland County in the second quarter, more than double the amount of volume a year ago (+122%), which is a gain of $26.7 million.
Local Snapshot – Sold Dollar Volume

14
$21.8
$368.5
$244.4
$54.0
$42.9
$36.3
$42.4
$48.5
$509.2
$364.7
$93.4
$54.7
$56.9
$64.8
$0 $100 $200 $300 $400 $500 $600
Westmoreland County
Stafford County
Spotsylvania County
Orange County
King George County
Fredericksburg
Caroline County
Millions ($)
Figure 10Second Quarter Sold Dollar Volume, FAAR Jurisdictions
2020 and 2021
2021 - Q2
2020 - Q2
Source: Virginia REALTORS®, data accessed July 15, 2021

15
Days on Market
Homes in the FAAR market continued to sell much faster than last year. Homes that sold in the second quarter in the region were on the market for two weeks on average (14 days), which is about three weeks faster than a year ago (-20 days). The shrinking supply of homes listed for sale in the area is causing more competition among active buyers in the market, leading to faster-selling homes, a trend that has been consistent for much of the past five years. Statewide, homes sold in an average of 22 days in the second quarter, down from 40 days a year ago.
53
4240
34
14
0
15
30
45
60
75
2017 - Q2 2018 - Q2 2019 - Q2 2020 - Q2 2021 - Q2
Day
s
Figure 11Second Quarter Average Days on Market, FAAR
2017-2021
Source: Virginia REALTORS®, data accessed July 15, 2021

16
Caroline County: It took 16 days on average for homes to sell in Caroline County during the second quarter, which is 23 days faster than last year.
Fredericksburg: Homes that sold in Fredericksburg during the second quarter were on the market an average of two weeks (14 days), which is about three weeks faster than last year (-23 days). Homes have been selling faster in the city for five straight quarters.
King George County: The average days on market in King George County during the second quarter was 17 days, which is 16 days faster than last year. Homes have been selling faster on average in the county for seven consecutive quarters.
Orange County: At 26 days, the average days on market in the second quarter in Orange County is 24 days faster than a year ago.
Spotsylvania County: Homes continued to sell much faster in Spotsylvania County compared to a year ago. The average days on market in the county in the second quarter was 13 days, which is 17 days faster than this time last year.
Stafford County: It took one week on average to sell a home in Stafford County during the second quarter (7 days), which is about three weeks faster than a year ago (-20 days). This is the lowest average days on market for Spotsylvania County in any quarter in more than five years.
Westmoreland County: Homes that sold in Westmoreland County during the second quarter were on the market an average of 51 days, which is 37 days faster than last year. Homes have been selling faster on average in the county for much of the last four years.
Local Snapshot – Average Days on Market

17
88
27
30
50
33
37
39
51
7
13
26
17
14
16
0 30 60 90 120
Westmoreland County
Stafford County
Spotsylvania County
Orange County
King George County
Fredericksburg
Caroline County
Days
Figure 12Second Quarter Average Days on Market, FAAR Jurisdictions
2020 and 2021
2021 - Q2
2020 - Q2
Source: Virginia REALTORS®, data accessed July 15, 2021

18
Inventory
Inventory continued to shrink in the FAAR footprint; however, the pace of decline slowed down considerably compared to recent quarters. There were 843 active listings in the region at the end of the second quarter, 19% fewer listings than were available last year, which is a decrease of 199 listings. For context, the inventory in the FAAR housing market declined by more than half in the previous four quarters compared to the prior year. The shrinking supply of homes available in the FAAR market continues to be a factor for both buyers and sellers. Some potential buyers, particularly first-time homebuyers, have trouble competing with other buyers due to rising prices and limited options. In addition, would-be sellers also are impacted by the low supply because there are fewer options of homes to move into after they sell their existing home, which is causing many to remain in their current homes. These trends are occurring both locally and all throughout the commonwealth. At the end of the second quarter, there was a total of 19,346 active listings on the market statewide, down 18% from a year ago.
There was about one month of supply at the end of the second quarter in the FAAR area, down from 1.6 months of supply a year ago. The months of supply metric is calculated by taking the average monthly sales over the preceding 12-month period and dividing it by the inventory of active listings.
4.34.0 4.3
1.6
1.0
0.0
1.0
2.0
3.0
4.0
5.0
2017 - Q2 2018 - Q2 2019 - Q2 2020 - Q2 2021 - Q2
Mon
ths
of S
uppl
y
Figure 14End of Second Quarter Months Supply, FAAR
2017-2021
Source: Virginia REALTORS®, data accessed July 15, 2021

19
Caroline County: There were 75 active listings in Caroline County at the end of the second quarter, six fewer listings than last year, representing a 7% decrease.
Fredericksburg: Supply in the Fredericksburg housing market continued to shrink. There were 51 active listings on the market in the city at the end of the second quarter, 30% fewer listings than a year ago, which is a reduction of 22 listings.
King George County: There were 52 active listings in King George County at the end of the second quarter, four fewer listings than a year ago, which is a 7% decline.
Orange County: At the end of the second quarter, there were 94 active listings on the market in Orange County, 38 fewer listings than last year, which is a 29% supply drop.
Spotsylvania County: There were 255 homes listed for sale in Spotsylvania County at the end of the second quarter, 18 fewer listings than a year ago, which is a 7% inventory reduction.
Stafford County: There were 211 active listings in Stafford County at the end of the second quarter, 48 fewer listings than a year ago, which is a 19% decline. The supply of homes for sale has been shrinking in the county for eight straight quarters.
Westmoreland County: At the end of the second quarter there were 105 active listings on the market in Westmoreland County, 63 fewer listings than last year, which is a 38% supply drop.
Local Snapshot – Active Listings

20
168
259
273
132
56
73
81
105
211
255
94
52
51
75
0 250 500
Westmoreland County
Stafford County
Spotsylvania County
Orange County
King George County
Fredericksburg
Caroline County
Active Listings
Figure 14End of Second Quarter Active Listings, FAAR Jurisdictions
2020 and 2021
2021 - Q2
2020 - Q2
Source: Virginia REALTORS®, data accessed July 15, 2021

21