eye tracking based experiments in explorviz -...
TRANSCRIPT

Eye Tracking Based Experimentsin ExplorViz
Master’s Thesis
Maria-Anna Kandsorra
May 20, 2017
Kiel University
Department of Computer Science
Software Engineering Group
Advised by: Prof. Dr. Wilhelm HasselbringM.Sc. Christian Zirkelbach


Statutory Declaration
I declare that I have authored this thesis independently, that I have not used other than thedeclared sources / resources and that I have explicitly marked all material which has beenquoted either literally or by content from the used sources.
Kiel, 20. Mai 2017
iii


Abstract
Software was never more complex then today. To improve program comprehension, severalvisualization tools and techniques are researched. The web-based tool ExplorViz helpsdevelopers to achieve an understanding of large software landscapes more easily thanlooking at source code. The communication of the landscape is visualized with live traces[Fittkau et al. 2013].
To improve a software development process and product, according to [Basili et al.1986], are experiments necessary. Further, they help to understand, evaluate and control theprocess and product. Thus, the improvement to conduct experiments will help to improve aproduct. And in modern society and technology, it was never easier or cheaper than todayto track the user’s gaze. And to understand and enhance human computer interaction isan asset to be pursued.
In this thesis we present an approach to improve the optional ExplorViz experimentmode, which can create and manage questionnaires to conduct interactive experiments inExplorViz. The approach improves the usability and enhances the experiment mode withthe feature of eye tracking and recording the screen during an experiment. Further, weevaluate the approach with an experiment and confirm its functionality. The eye trackingdata results do not display immediate correlations, but the data is versatile and useful.
v


Contents
1 Introduction 11.1 Motivation . . . . . . . . . . . . . . . . . . . . . . . . . . . . . . . . . . . . . . . 11.2 Goals . . . . . . . . . . . . . . . . . . . . . . . . . . . . . . . . . . . . . . . . . . 1
1.2.1 G1: Determine Experiment Management Systems Requirements . . . 21.2.2 G2: Concept and Implementation of Experiment Mode with Eye
Tracking . . . . . . . . . . . . . . . . . . . . . . . . . . . . . . . . . . . . 21.2.3 G3: Evaluation of the Experiment Mode with Eye Tracking . . . . . . 2
1.3 Document Structure . . . . . . . . . . . . . . . . . . . . . . . . . . . . . . . . . 2
2 Foundations and Technologies 32.1 ExplorViz . . . . . . . . . . . . . . . . . . . . . . . . . . . . . . . . . . . . . . . . 32.2 Eclipse . . . . . . . . . . . . . . . . . . . . . . . . . . . . . . . . . . . . . . . . . 62.3 Google Web Toolkit (GWT) . . . . . . . . . . . . . . . . . . . . . . . . . . . . . 62.4 CanJS . . . . . . . . . . . . . . . . . . . . . . . . . . . . . . . . . . . . . . . . . . 62.5 Eye tracking . . . . . . . . . . . . . . . . . . . . . . . . . . . . . . . . . . . . . . 72.6 Qt . . . . . . . . . . . . . . . . . . . . . . . . . . . . . . . . . . . . . . . . . . . . 82.7 JPetStore . . . . . . . . . . . . . . . . . . . . . . . . . . . . . . . . . . . . . . . . 82.8 Project WebRTC . . . . . . . . . . . . . . . . . . . . . . . . . . . . . . . . . . . . 8
3 Approach 93.1 Requirements for Experiment Management Systems . . . . . . . . . . . . . . 103.2 ExplorViz’ Experiment Mode . . . . . . . . . . . . . . . . . . . . . . . . . . . . 103.3 Questionnaire Concept . . . . . . . . . . . . . . . . . . . . . . . . . . . . . . . . 11
3.3.1 Questiontypes . . . . . . . . . . . . . . . . . . . . . . . . . . . . . . . . . 113.3.2 Format for Saving Questions and Answers . . . . . . . . . . . . . . . . 123.3.3 Management and Display . . . . . . . . . . . . . . . . . . . . . . . . . . 13
3.4 Concept of the Experiment Mode with Eye Tracking . . . . . . . . . . . . . . 153.4.1 Questionnaire Requirements . . . . . . . . . . . . . . . . . . . . . . . . 163.4.2 Eye Tracking . . . . . . . . . . . . . . . . . . . . . . . . . . . . . . . . . . 173.4.3 Screen Recording . . . . . . . . . . . . . . . . . . . . . . . . . . . . . . . 18
4 Implementation of Questionnaire Extension 214.1 JSON File . . . . . . . . . . . . . . . . . . . . . . . . . . . . . . . . . . . . . . . . 224.2 Model . . . . . . . . . . . . . . . . . . . . . . . . . . . . . . . . . . . . . . . . . . 234.3 ExplorViz server . . . . . . . . . . . . . . . . . . . . . . . . . . . . . . . . . . . . 234.4 Client . . . . . . . . . . . . . . . . . . . . . . . . . . . . . . . . . . . . . . . . . . 23
vii
Contents
4.4.1 ExperimentToolsPage . . . . . . . . . . . . . . . . . . . . . . . . . . . . 244.4.2 Option Question-Interface . . . . . . . . . . . . . . . . . . . . . . . . . . . 274.4.3 Display during Experiment . . . . . . . . . . . . . . . . . . . . . . . . . 30
5 Implementation of Eye Tracking Extension 335.1 JSON File . . . . . . . . . . . . . . . . . . . . . . . . . . . . . . . . . . . . . . . . 345.2 Server . . . . . . . . . . . . . . . . . . . . . . . . . . . . . . . . . . . . . . . . . . 35
5.2.1 Eye Tracking Data . . . . . . . . . . . . . . . . . . . . . . . . . . . . . . 355.2.2 Screen Recording Data . . . . . . . . . . . . . . . . . . . . . . . . . . . . 35
5.3 Client . . . . . . . . . . . . . . . . . . . . . . . . . . . . . . . . . . . . . . . . . . 355.3.1 ExperimentToolsPage . . . . . . . . . . . . . . . . . . . . . . . . . . . . 365.3.2 Experiment . . . . . . . . . . . . . . . . . . . . . . . . . . . . . . . . . . 40
6 Evaluation 476.1 Experiment Design . . . . . . . . . . . . . . . . . . . . . . . . . . . . . . . . . . 47
6.1.1 Research Questions and Hypotheses . . . . . . . . . . . . . . . . . . . . 476.1.2 Empirical Methods . . . . . . . . . . . . . . . . . . . . . . . . . . . . . . 486.1.3 Tasks . . . . . . . . . . . . . . . . . . . . . . . . . . . . . . . . . . . . . . 48
6.2 Operation . . . . . . . . . . . . . . . . . . . . . . . . . . . . . . . . . . . . . . . 516.2.1 Experimental Set-up . . . . . . . . . . . . . . . . . . . . . . . . . . . . . 516.2.2 Create Input . . . . . . . . . . . . . . . . . . . . . . . . . . . . . . . . . . 516.2.3 Tutorial . . . . . . . . . . . . . . . . . . . . . . . . . . . . . . . . . . . . . 516.2.4 Questionnaire . . . . . . . . . . . . . . . . . . . . . . . . . . . . . . . . . 516.2.5 Pilot Study . . . . . . . . . . . . . . . . . . . . . . . . . . . . . . . . . . . 516.2.6 Procedure . . . . . . . . . . . . . . . . . . . . . . . . . . . . . . . . . . . 52
6.3 Data Collection . . . . . . . . . . . . . . . . . . . . . . . . . . . . . . . . . . . . 526.3.1 Timing and Tracking Information . . . . . . . . . . . . . . . . . . . . . 526.3.2 Correctness Information . . . . . . . . . . . . . . . . . . . . . . . . . . . 53
6.4 Results . . . . . . . . . . . . . . . . . . . . . . . . . . . . . . . . . . . . . . . . . 536.5 Discussion . . . . . . . . . . . . . . . . . . . . . . . . . . . . . . . . . . . . . . . 55
6.5.1 Correctness of Tasks . . . . . . . . . . . . . . . . . . . . . . . . . . . . . 556.5.2 Eye Tracking Data . . . . . . . . . . . . . . . . . . . . . . . . . . . . . . 566.5.3 Postquestions . . . . . . . . . . . . . . . . . . . . . . . . . . . . . . . . . 60
6.6 Threads to Validity . . . . . . . . . . . . . . . . . . . . . . . . . . . . . . . . . . 616.6.1 Internal Validity . . . . . . . . . . . . . . . . . . . . . . . . . . . . . . . 616.6.2 External Validity . . . . . . . . . . . . . . . . . . . . . . . . . . . . . . . 63
6.7 Lessons Learned and Challenges Occurred . . . . . . . . . . . . . . . . . . . . 636.8 Summary . . . . . . . . . . . . . . . . . . . . . . . . . . . . . . . . . . . . . . . . 64
7 Related Work 65
viii

Contents
8 Conclusions and Future Work 678.1 Conclusions . . . . . . . . . . . . . . . . . . . . . . . . . . . . . . . . . . . . . . 678.2 Future Work . . . . . . . . . . . . . . . . . . . . . . . . . . . . . . . . . . . . . . 67
Bibliography 69
Appendix A: Install Instructions 71
Appendix B: Informed Consent 73
Appendix C: Raw Experiment Results 74
ix


List of Figures
2.1 Landscape Perspective . . . . . . . . . . . . . . . . . . . . . . . . . . . . . . . . 32.2 Application Perspective . . . . . . . . . . . . . . . . . . . . . . . . . . . . . . . 42.3 Experiment Interface, Screenshot of ExplorViz website . . . . . . . . . . . . . 5
3.1 ExplorViz Concept . . . . . . . . . . . . . . . . . . . . . . . . . . . . . . . . . . 93.2 Experiment Mode Questionnaires . . . . . . . . . . . . . . . . . . . . . . . . . 123.3 Input Interface for Questionnaire Questions . . . . . . . . . . . . . . . . . . . 133.4 Display of Prequestions . . . . . . . . . . . . . . . . . . . . . . . . . . . . . . . 143.5 Display of Postquestions . . . . . . . . . . . . . . . . . . . . . . . . . . . . . . . 153.6 Schematic Example of Eye Tracking Data during Experiment . . . . . . . . . 163.7 Options for Administrator . . . . . . . . . . . . . . . . . . . . . . . . . . . . . . 17
4.1 ExplorViz Implementation . . . . . . . . . . . . . . . . . . . . . . . . . . . . . . 214.2 Experiment Overview RootPanel . . . . . . . . . . . . . . . . . . . . . . . . . . 244.3 Integration of CanJS . . . . . . . . . . . . . . . . . . . . . . . . . . . . . . . . . 284.4 Extract of Question-Interface Page . . . . . . . . . . . . . . . . . . . . . . . . . 29
5.1 ExplorViz Implementation . . . . . . . . . . . . . . . . . . . . . . . . . . . . . . 335.2 Screenshot of a Results Modal . . . . . . . . . . . . . . . . . . . . . . . . . . . 375.3 Screenshot of a Replay Modal . . . . . . . . . . . . . . . . . . . . . . . . . . . . 375.4 Simple Modal before first normal Questions during Experiment . . . . . . . . 415.5 Security Modal when starting Screen Recording . . . . . . . . . . . . . . . . . 425.6 Communication on Participants Computer . . . . . . . . . . . . . . . . . . . . 44
6.1 Correctness of Tasks . . . . . . . . . . . . . . . . . . . . . . . . . . . . . . . . . 566.2 Information on the Participants Gazes . . . . . . . . . . . . . . . . . . . . . . . 576.3 Duration of Experiment Participation . . . . . . . . . . . . . . . . . . . . . . . 586.4 Participants Individual Correctness Information . . . . . . . . . . . . . . . . . 596.5 Assessed Average Difficulty of Tasks . . . . . . . . . . . . . . . . . . . . . . . . 61
xi


List of Tables
6.1 Description of the Task for the Experiment . . . . . . . . . . . . . . . . . . . . 496.2 Correctness Results of Participants . . . . . . . . . . . . . . . . . . . . . . . . . 536.3 Information Ratio of Eye Tracking Data . . . . . . . . . . . . . . . . . . . . . . 546.4 Postquestions Mean and Standard Deviation . . . . . . . . . . . . . . . . . . . 55
1 Postquestions Mean and Standard Deviation . . . . . . . . . . . . . . . . . . . 72
xiii


Listings
2.1 Questions in TXT Format . . . . . . . . . . . . . . . . . . . . . . . . . . . . . . 52.2 Extract of an Experiment in JSON Format . . . . . . . . . . . . . . . . . . . . . 64.1 Extract of an Experiment in JSON Format . . . . . . . . . . . . . . . . . . . . . 224.2 Extract of ExperimentToolsPage method render . . . . . . . . . . . . . . . . . 254.3 Extract of ExperimentToolsPage’s method showExperimentList . . . . . . . . 264.4 Extract of ExperimentToolsPage method togglePreAndPostquestions . . . . . 275.1 Extract of an experiment JSON file . . . . . . . . . . . . . . . . . . . . . . . . . 345.2 Extract of an eye tracking data file . . . . . . . . . . . . . . . . . . . . . . . . . 385.3 Extract of exp_eyeTracking Javascript file . . . . . . . . . . . . . . . . . . . . . 395.4 Extract of eyeApi.js . . . . . . . . . . . . . . . . . . . . . . . . . . . . . . . . . . 435.5 Extract of eyejsonprotocollserializer.cpp . . . . . . . . . . . . . . . . . . . . . . 451 Command to Transform webm to mp4 . . . . . . . . . . . . . . . . . . . . . . 71
xv


Chapter 1
Introduction
1.1 Motivation
In modern society and technology, to understand and enhance human computer interactionis an asset to be pursued. Considering that eye tracking for usability purposes was alreadyused in the 1950s [Jacob and Karn 2003], it was never easier or cheaper than today to trackthe user’s gaze.Software was never more complex then today. To improve program comprehension, severalvisualization tools and techniques are researched. The web-based tool ExplorViz helpsdevelopers to achieve an understanding of large software landscapes more easily thanlooking at source code. The communication of the landscape is visualized with livetraces [Fittkau et al. 2013]. The ExplorViz interface is interactive and allows the user toswitch between two perspective levels. The landscape level shows components and theircommunication on different abstraction levels. On application level, ExplorViz shows asingle application as an interactive 3D city model with their communications.To improve a software development process and product, according to [Basili et al. 1986],experiments are conducted. Further, they would help to understand, evaluate and controlthe process and product. Thus, the improvement to conduct experiments will help us toimprove a product. Tools exist for managing electronic questionnaires and automating thecollection of their data, analyzing and visualizing them. An optional part of the ExplorViztool is also an experiment mode, to create and manage interactive questionnaires to performsurveys in ExplorViz.In this work, we want to extent the current experiment mode of ExplorViz to integrate eyetracking. The experiment mode was recently enhanced for more usability and we want tofurther improve it for more usability.
1.2 Goals
The main goal of this master’s thesis is to enhance the ExplorViz’ tool experiment modewith an eye tracking and a screen recording feature. We want to evaluate our approachand detect with empirical methods whether the eye tracking feature is a reasonableimprovement for experiments with ExplorViz interactive interface. To determine this, wesplit our goal to three subgoals. In the following sections, we will describe them.
1
1. Introduction
1.2.1 G1: Determine Experiment Management Systems Requirements
Our first subgoal is to do a literature research for experiment management systems andtheir requirements. ExplorViz’ system for managing experiments was implemented by[Finke 2014]. We want to compare the identified requirements and develop an approach toimprove the experiment mode accordingly.
1.2.2 G2: Concept and Implementation of Experiment Mode with EyeTracking
To enhance the possibilities for experiments, we want to develop an approach to enhancethe ExplorViz experiment mode with eye tracking. Including identified requirementsfor experiment management systems, we will produce a concept which integrates withExplorViz and implement it.
1.2.3 G3: Evaluation of the Experiment Mode with Eye Tracking
To test the implemented feature for functionality with real users, a small pilot study will beconducted. Afterwards, an experiment with the eye tracking and screen recording featurewill be performed. With the results of the experiment, we will determine, whether the eyetracking and screen recording is a meaningful improvement to the experiment mode ofExplorViz.
1.3 Document Structure
This document contains the following topics. Chapter 2 describes important technologiesand foundations for this thesis. Chapter 3 contains the description of our concept forimproving the experiment mode and how the goals of the thesis can be achieved. Chapter 4presents the changes we make to implement the approach for the experiment mode toachieve identified requirements. And Chapter 5 contains information about the imple-mentation of the part of the approach to enhance the experiment mode with eye trackingand screen recording. In Chapter 6 we evaluate the changes and our approach with anexperiment, also testing the functionality of the implementations and presenting the results.In Chapter 7 we present other approaches which are similar to our approach. And inChapter 8 we will summarize our findings and results, and conclude this thesis.
2
Chapter 2
Foundations and Technologies
2.1 ExplorViz
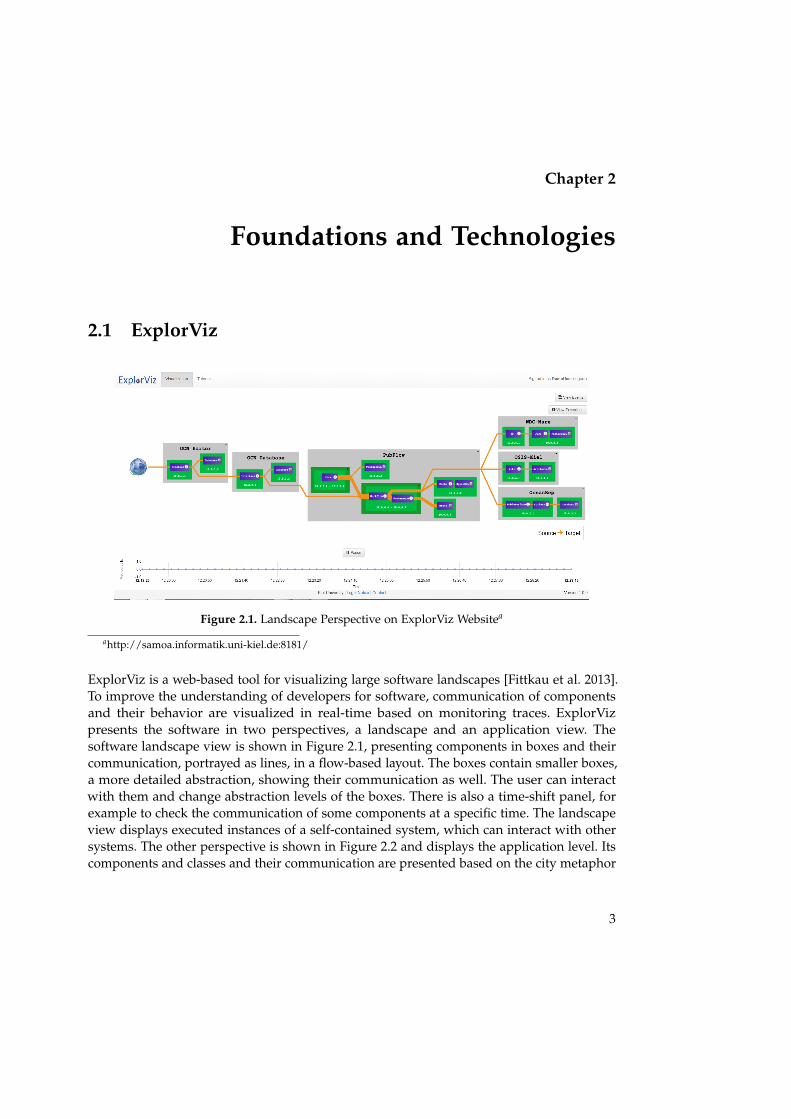
Figure 2.1. Landscape Perspective on ExplorViz Websitea
ahttp://samoa.informatik.uni-kiel.de:8181/
ExplorViz is a web-based tool for visualizing large software landscapes [Fittkau et al. 2013].To improve the understanding of developers for software, communication of componentsand their behavior are visualized in real-time based on monitoring traces. ExplorVizpresents the software in two perspectives, a landscape and an application view. Thesoftware landscape view is shown in Figure 2.1, presenting components in boxes and theircommunication, portrayed as lines, in a flow-based layout. The boxes contain smaller boxes,a more detailed abstraction, showing their communication as well. The user can interactwith them and change abstraction levels of the boxes. There is also a time-shift panel, forexample to check the communication of some components at a specific time. The landscapeview displays executed instances of a self-contained system, which can interact with othersystems. The other perspective is shown in Figure 2.2 and displays the application level. Itscomponents and classes and their communication are presented based on the city metaphor
3

2. Foundations and Technologies
[Wettel et al. 2011]. The user can interact with the components and change their abstractionlevel, as well as get information about the amount of communication between components.The application view represents an abstraction of the source code of the software system.
Figure 2.2. Application Perspective on ExplorViz Websitea
ahttp://samoa.informatik.uni-kiel.de:8181/
In [Fittkau et al. 2016] it was scientifically proven that ExplorViz increases the correctnessin contrast to another software visualization tool, ExTraVis [Cornelissen et al. 2007]. Incomparison to ExTraVis [Cornelissen et al. 2007] it was observed by [Fittkau et al. 2016]that ExplorViz increases significantly the correct answers of participants. [Fittkau et al.2016] used controlled experiments for this comparison as well as for different visualizationvariations of ExplorViz like virtual reality.
ExplorViz is implemented with GWT, Google Web Toolkit, and consists of three mainparts. One is the model, containing information about classes that are important for theother two parts, the server and the client. The server holds all information and servesfor the client side, giving requested information. The client side interacts through awebsite with user, displaying the interactive interface from Figure 2.1 and Figure 2.2. Theseaforementioned experiments were conducted in ExplorViz with an experiment mode by[Finke 2014] to test for usability and can also be used to evaluate new implemented features.Plain text files have to be in a specific folder on the server to be uploaded as experiments. Anexample can be seen in Listing 2.1. The text files can be edited via the website, are written ina custom syntax, and must be saved as ‘questions.txt’. Statistical questions are also possiblein the beginning of an experiment, to determine what kind of experience participantsmight have for example with programming languages or ExplorViz. Statistical questionsafterwards can be for example their assessment of the questionnaire. The experiment modewas extended during the summer semester 2016 in the scope of a masterproject. They
4

2.1. ExplorViz
Figure 2.3. Experiment Interface, Screenshot of ExplorViz website
created a webinterface, shown in Figure 2.3. Users logged in with administrator access cancreate and manage new experiments. Questionnaires for specific experiments can also becreated in the webinterface, with different groups in experiments and each having theirown questionnaire. The experiment, its attributes and related questionnaires are saved asfiles in a JSON representation on the server. An example can be seen in Listing 2.2.
Listing 2.1. Questions in TXT Format
1 --Dialog 1 before questions, do not remove this line
2 Text: Now that you have passed the tutorial, the questionnaire will begin. Please
give a few information about your person. Those will only be used to analyze
the results of the experiment.
3 Number: Age
4 Placeholder: Years
5 Min: 16
6 Max: 75
7 Combobox: Gender
8 Choices: Male, Female, other
9 Tooltip:
10 Combobox: Highest completed degree
11 Choices: None, Bachelor, Master, Diploma, PhD, none of the above
12 Tooltip:
5

2. Foundations and Technologies
Listing 2.2. Extract of an Experiment in JSON Format
1 {
2 "questionnaires": [{
3 "questionnareID": "quest1475325290274",
4 "questions": [{
5 "expApplication": "",
6 "answers": [
7 {
8 "answerText": "Antwort 1",
9 "checkboxChecked": false
10 },
2.2 Eclipse
Eclipse is an open source community, offering IDEs (integrated development environment)for different requirements. The tools can be extended with plugins and eclipse encouragesteamwork and new plugins and projects. The most popular IDE is for Java developersbut there are tools and plugins for nearly all programming languages. Following theinstructions for developing with ExplorViz, we will use Eclipse IDE for Java and DSLDevelopers.
2.3 Google Web Toolkit (GWT)
GWT is used to optimize and build browser-based applications [GWT]. The developerdoes not need specific knowledge about the browser, XMLHttpRequest or JavaScriptbecause Java is compiled to them, but there is also the possibility to write source codein native JavaScript. It is not only Java, but there is also the possibility to write code inXtend, a modernized Java. Xtend allows for example type inference and is translated toJava. A drawback of GWT is its self-contained system, which makes it complicated tointegrate other frameworks to it. When interacting with JavaScript objects, there mustalways be native JavaScript functions be implemented, which act as facilitator. ExplorVizis implemented with GWT and we will use the framework to extend the features of theexperiment mode.
2.4 CanJS
CanJS is a JavaScript framework and can be used with alternative DOM libraries [CanJS].The used elements are implemented as components which reduces dependencies and
6
2.5. Eye tracking
produces more independent code. Components changed through interaction of the usercan trigger rerendering parts of the interface without loading the whole page. Usingtemplates, the amount of code is reduced and often readability is improved, instead ofinjecting html elements with JQuery. A part of the webinterface for managing questions ofExplorViz is already coded with CanJS. Its integration is done over GWT’s native JavaScriptfunctions, which acts among other things as facilitator between CanJS and GWT. We willextend the functionality of this implementation with the possibility of managing statisticalquestions, questions the user can be asked before and after the questions the experimentrevolves.
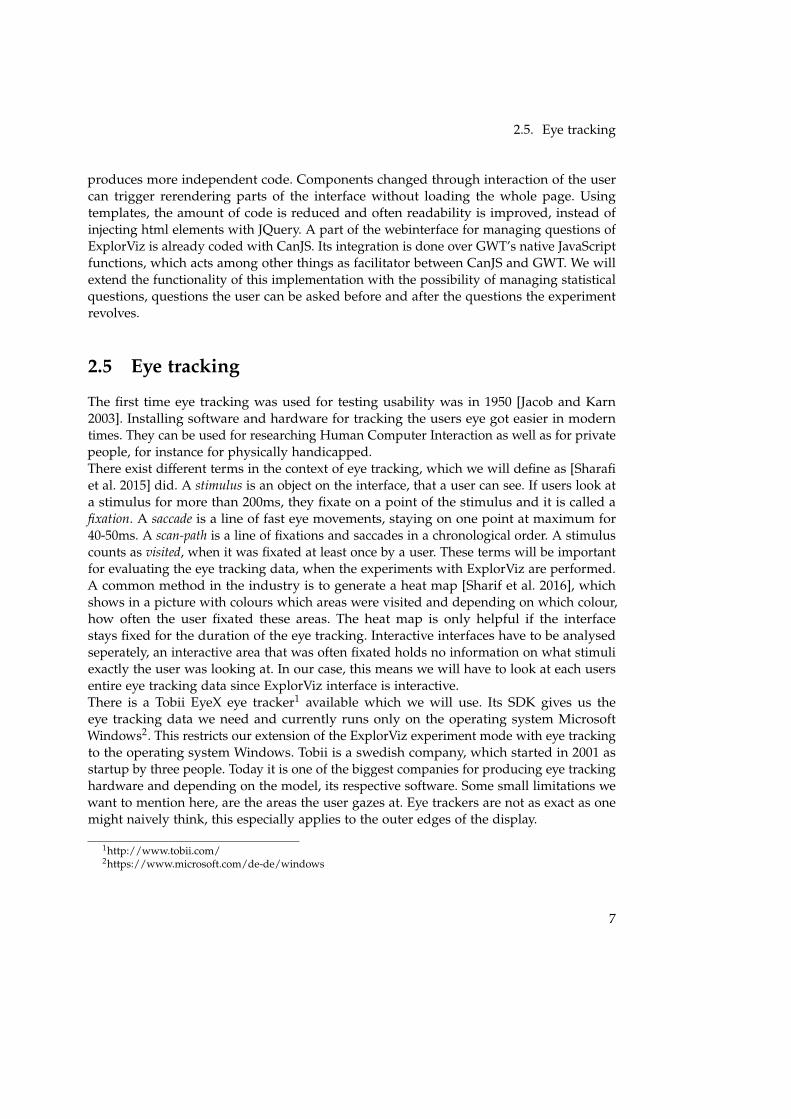
2.5 Eye tracking
The first time eye tracking was used for testing usability was in 1950 [Jacob and Karn2003]. Installing software and hardware for tracking the users eye got easier in moderntimes. They can be used for researching Human Computer Interaction as well as for privatepeople, for instance for physically handicapped.There exist different terms in the context of eye tracking, which we will define as [Sharafiet al. 2015] did. A stimulus is an object on the interface, that a user can see. If users look ata stimulus for more than 200ms, they fixate on a point of the stimulus and it is called afixation. A saccade is a line of fast eye movements, staying on one point at maximum for40-50ms. A scan-path is a line of fixations and saccades in a chronological order. A stimuluscounts as visited, when it was fixated at least once by a user. These terms will be importantfor evaluating the eye tracking data, when the experiments with ExplorViz are performed.A common method in the industry is to generate a heat map [Sharif et al. 2016], whichshows in a picture with colours which areas were visited and depending on which colour,how often the user fixated these areas. The heat map is only helpful if the interfacestays fixed for the duration of the eye tracking. Interactive interfaces have to be analysedseperately, an interactive area that was often fixated holds no information on what stimuliexactly the user was looking at. In our case, this means we will have to look at each usersentire eye tracking data since ExplorViz interface is interactive.There is a Tobii EyeX eye tracker1 available which we will use. Its SDK gives us theeye tracking data we need and currently runs only on the operating system MicrosoftWindows2. This restricts our extension of the ExplorViz experiment mode with eye trackingto the operating system Windows. Tobii is a swedish company, which started in 2001 asstartup by three people. Today it is one of the biggest companies for producing eye trackinghardware and depending on the model, its respective software. Some small limitations wewant to mention here, are the areas the user gazes at. Eye trackers are not as exact as onemight naively think, this especially applies to the outer edges of the display.
1http://www.tobii.com/2https://www.microsoft.com/de-de/windows
7
2. Foundations and Technologies
2.6 Qt
We are building upon another students work and he implemented a local server whichhandles the communication with the SDK of the eye tracking device. The source code runsin Qt, a cross-platform framework for software development. The programming languageis C++. The executable communication server is available in the git repository3 of thisthesis.
2.7 JPetStore
The JPetStore 64 is a full web application built on top of MyBatis 3, Spring 4 and Stripes. Itis a sample application, used to demonstrate how a web application with some classes canbe build5. We use it as sample application for a monitoring with ExplorViz and use thecreated traces for the experiment for evaluating our work.
2.8 Project WebRTC
As mentioned before, we are building on top of another students work. It uses a projectcalled ‘WebRTC-Experiment’ by Muaz Khan [WebRTC-Experiment] to record the contentof the screen. Currently, there exists a Chrome-Extension called Screen Capturing6, whichcan record the screen in cooperation with JavaScript-files and can also be saved as a localdownload afterwards. At the same time, the gaze of the user is recorded and saved as alocal download afterwards as well. Loading these two downloads, they can be played atthe same time with the gaze of the user on top of the video of the recorded screen, showingwhere the user gazed during the recording. Upon this Chrome-Extension, Javascript andHTML files we will base the eye tracking feature for the experiment mode in ExplorViz.Due to the chrome extension, our implementation will be restricted to the chrome browser.
3https://build.se.informatik.uni-kiel.de/thesis/maria-anna-kandsorra-msc/tree/master/MSC-Abgabe/LocalServerForEyeTracking/bin
4https://github.com/mybatis/jpetstore-65http://www.mybatis.org/jpetstore-6/6https://chrome.google.com/webstore/detail/screen-capturing/ajhifddimkapgcifgcodmmfdlknahffk
8

Chapter 3
Approach
As shown in Figure 3.1, the ExplorViz project consists of three components. The serverside, a client side and a model. The client and server use classes from the model, andthey communicate with each other only through asynchronous remote procedure calls(RPC). The asynchronous RPC is a feature of GWT to make it easy to exchange Java objectsbetween the server and the client. Our approach is going to modify parts in all threecomponents.
Figure 3.1. ExplorViz Concept
This chapter is about which requirements we want to fulfill with our approach and adetailed description what our approach entails. We will first take a look at requirementsfor experiment management systems that other scientists identified. Afterwards we willsummarize what our approach is about and where we integrate it. Then we will developour approach for the extension of ExplorViz.
9

3. Approach
3.1 Requirements for Experiment Management Systems
In an analysis in [Ioannidis et al. 1997], they determined three important requirements forexperiment management systems. One is a uniform interface for scientists. The second isthat users should not have to handle data management issues more than they need to. Itshould be made as simple as possible. And the last requirement is for the user to not noticethe complexity of the software underneath.
[Jakobovits et al. 2000] identified even more requirements for experiment managementsystems. They referred to seven requirements. These requirements are originally listed withthe context of experiments in the medical domain, but we can relate them to our context.
1. System Integration: The experiment management system should be applicable in manyenvironments.
2. Data Integration: The input of the data should be the same for the user without restric-tions on format or form.
3. Workflow Support: The system should keep track on who has done what on theexperiments.
4. Remote Collaboration Facilities: Different parties should be able to work with theexperiments and get their results.
5. Advanced Data Type Management: The experiment management system should be ableto handle specific formats and types needed in the domain, as well their integratedconversion if needed.
6. Intelligent Navigation: The navigation in the experiment management system should beintuitive and constant.
7. Adaptive User Interface: Depending on the user rights, users are shown differentinterfaces and restrictions to access data.
3.2 ExplorViz’ Experiment Mode
As mentioned in the motivation, we want to extend ExplorViz’ experiment mode. ExplorVizwas implemented in GWT and the code part with the experiment mode was implementedby [Finke 2014]. We will refer to it as legacy system. Of that legacy system a part of theinput process for experiments was changed due to a masterproject by students in SS16. Wewill use the term present implementation to make it easier to refer to it.
The present experiment mode consists of a management interface for the experiments,which can only be accessed by a logged in user with an administrator role. And thereexists a special interface with questions, if a user is logged in as a specific participant of anexperiment, fulfilling the seventh requirement of [Jakobovits et al. 2000]. An administrator
10
3.3. Questionnaire Concept
also manages the user for an experiment. An experiment in ExplorViz’ experiment mode inthe present implementation can be a set of different questionnaires with questions. During aparticipation in the experiment, statistical questions are asked before and after the questionsinside the questionnaire. These statistical questions can contain for example questionsabout the participants knowledge in a specific domain or the users age. The statisticalquestions after the main questions can be for example about whether the questions wereeasy or difficult. We want to improve the usability of this part, since the input of the datafor statistical questions differs to the input of the normal questions. This contradicts thesecond requirement of [Jakobovits et al. 2000] and we will modify it so it is satisfied.
The details will be described in the later sections. Our approach should take thementioned requirements in the last section into account for improving the present imple-mentation and extending the experiment mode with eye tracking.
3.3 Questionnaire Concept
First we need to define what our future questionnaire for the ExplorViz’ experiment modeshould entail. There are currently the normal questions, usually why the questionnaire isdone. And there are statistical questions before and after the main questions. We will referto the questions before the main part as prequestions and to the questions after the mainpart as postquestions, also referring to them as questionstyles.
3.3.1 Questiontypes
In the present implementation, the normal questions offer two possible types to choosefrom. One is the free text type and the other is the multiple choice type. In case of the freetext type, the answer of the user is put in as a text. A question with the multiple choicetype gives the participant, depending on the amount of possible right answers, some textinput possibilities.
The legacy system offers for the statistical questions seven possibilities for types. Thereis the type of number, email and input, which are nearly self exploratory. With type number,the user must put in a number, with type email, it must put in an email and with typeinput, the user must put in some kind of text, limited to a specific length. There is alsothe type binary, which lets the user choose between two possibilities. The type commentshows a bigger area for text input to the user and expects text as input and the type choiceis like the type multiple choice mentioned before. There are differences in their display,but often types could be used for the same kind of statistical questions. For examplecould type binary be replaced by type choice, if we input just two choices. Our approachassembles all types together to just three types of pre- and postquestions. They are freetext, multiple choice and number range. Free text and multiple choice comply with thetypes of the normal questions in the present implementation, mentioned before and lapover with the legacy types of comment and choice. They also replace binary and input. The
11

3. Approach
Figure 3.2. Experiment Mode Questionnaires
new type number range complies with the legacy type number. The type email was notadopted, because usually experiments and studies are done anonymously and in case thata questionnaire creator really needs the email of a user, he could let the user put it in a freetext type question.
3.3.2 Format for Saving Questions and Answers
The present implementation saves the questionnaire and normal questions as part of anexperiment inside a JSON file on the server. An experiment can have more than onequestionnaire, see figure X, and questionnaires have questions and other attributes. Thelegacy system saved normal questions and saves statistical questions in text files with aself-made line by line format. We want a consistent format for the pre- and postquestions.So we choose to add prequestions and postquestions as attributes to a questionnaire andsave them as well inside the JSON file like the present implementation. In Figure 3.2 wecan see the questionstyles on both communication sides colored in green.
The answers are currently saved in a CSV file after every submission of the answer.Together with the answers for the normal questions are the taken time in milliseconds, thetime when the question was started and ended in milliseconds and the id of the user. Theanswers for statistical questions are split in pre- and postquestions. Each have one line withall answers and the userId of the participant. This is needed to interpret the data with R.
12

3.3. Questionnaire Concept
Figure 3.3. Input Interface for Questionnaire Questions
3.3.3 Management and Display
For our defined questionnaire, there a two points really important in this context. One is,how to create, delete, and manage the questionnaire from an administrators view. And thesecond point is, how a participant experiences doing the questionnaire. The legacy systemof course supports these points, as well as the present implementation. In the presentimplementation the usability of the first point for normal questions was increased.
The present implementation entails a webinterface for the administrator, to modify,load and create new experiments. There is a possibility to drag and drop experiment-and landscapefiles into the webinterface, to upload and save them. There is also a usermanagement, for creating, deleting and printing users out. Continuing on, to modify,delete and add questions to the questionnaire, another interface was implemented. In thelegacy code base, textfiles had to be edited inside a basic interface, with a specific line byline format. In the present implementation a new site is opened and next to a landscape,a slideable interface gives the administrator the option to modify questions. To have aconsistent and intuitive design, an interface for the pre- and postquestions should be asclose to the mentioned slider as possible and add buttons to switch between the questionstyles, see Figure 3.3. We do this also for conforming to the requirement of [Ioannidis et al.
13

3. Approach
Figure 3.4. Display of Prequestions
1997]. Further, the person creating the questionnaire should be able to either turn on or offthe option of pre- and postquestions. If during the input process, pre- or postquestionswere not added, they will of course not be displayed and be skipped. They would alsobe skipped, if there were any pre- or postquestions created but the option was turned off.Like that, the possibility of only prequestions or only postquestions would be possible.The present implementation changed the process to save and load the main questions asattributes of the questionnaire. We will update this process for the pre- and postquestionsas well.
Now to the before mentioned second point, how a participant experiences the question-naire. This part was not changed from a participants view in the present implementation.It is still the same from the legacy system. At first all statistical prequestions are dividedinto two modals, which are shown after each other. Then the main part with the normalquestions starts, where each question has their own modal. The statistical questions after-wards are again shown in two modals. We want to change that and display all prequestionsat once inside one modal and do the same with all postquestions, see Figure 3.4 andFigure 3.5. The user has the possibility to overview all prequestions at the beginning andthere is no confusion about when the normal questions start. Also, this way the user canintuitively differentiate between the prequestions and the normal questions, that there
14

3.4. Concept of the Experiment Mode with Eye Tracking
Figure 3.5. Display of Postquestions
lays more importance to the normal questions than to the prequestions. The same goesafterwards to the postquestions. The user might be impatient to finish the questionnaireafter he answered many normal questions. When all postquestions are shown at once, theuser is able to overview them and can guess, that the questionnaire is finished afterwards.We make it more transparent for users to see how many questions are left to answer.
3.4 Concept of the Experiment Mode with Eye Tracking
To have the eye tracking data of the eye tracker alone, is not very useful. We know whenand where on the display the user gazed, but we do not know what was displayed, forexample see Figure 3.6. So a recording of the time the eyes are tracked is needed. Thefollowing section will be about the requirements for the questionnaire and then the eyetracking part. Afterwards we will talk about how we will record the screen during the timewe track the users eyes.
15

3. Approach
Figure 3.6. Schematic Example of Eye Tracking Data during Experiment
3.4.1 Questionnaire Requirements
As an administrator creating and managing questionnaires, it should be possible to turnthese two options on and off individually, because one might not have an eye tracker butstill want to record the screen of a user during the participation of an experiment. The otherway is not possible, because only the eye tracking data without the recording of the screenwould not be useful. The default should be off for both, because they are special optionswhich need specific hardware and software and someone who only wants to create aquestionnaire would not want a special option turned on. As mentioned, these options canbe turned on or off for every questionnaire, and the other questionnaires of the experimentare left untouched. A mockup desgin is shwon in Figure 3.7 . It should be possible to playthe recording after a user participated in an experiment. The administrator should be able toselect a users recording. This can be achieved through a modal showing information aboutall users of the questionnaire. These information should be about whether a user finishedthe questionnaire, if there exists any eye tracking data, or screen recording. Also, thereshould be a possibility for downloading the users information after ending a questionnaire.From this modal, the administrator should be able to select a user and watch his screenrecording. Before and during the playing of the recording, the watcher should also be able
16

3.4. Concept of the Experiment Mode with Eye Tracking
Figure 3.7. Options for Administrator
to turn the displaying of the eye tracking data on or off in the recording. So they can watch,where the user gazed during the recording.
3.4.2 Eye Tracking
To track the eyes, we should take four points into account. What is the eye tracking data,how do we get the eye tracking data, what do we do with the eye tracking data and whatabout calibration of the eye tracker.
Eye Tracking Data Format
What the eye tracking data consists of, is dictated by the SDK of the eye tracker, but weneed the x and y position of the point on the display where the user gazed and whenthe eye tracker recorded that. Also, for the sake of displaying afterwards where the usergazed during the recording, we need to save the width and height of the screen where therecording took place. This can be handled by the common format JSON.
17

3. Approach
Get Eye Tracking Data
To get the eye tracking data, we need an eye tracker and communicate with it during theparticipation of the questionnaire. In our case, we restrict it to the normal questions, wherethe participant interacts with the ExplorViz interface. So before starting the main part,we have to start the communication with the hardware and end it after the last normalquestion is answered. We need a SDK for the eye tracker and its software, in our case wewill use an external server which communicates with the hardware and then sends the eyetracking data to the questionnaire website. This will limit the first requirement, SystemIntegration, of [Jakobovits et al. 2000].
Eye Tracking Data at the Client
At the clients side, we save it first in an array and save the array afterwards in a morepermanent form. In our case, we upload it to the server of ExplorViz where it is saved inthe mentioned format, JSON, as a file.
Calibration of Hardware
Usually, this has to be done for every participant. Depending on the SDK and eye tracker,the calibration can be implemented by us before the participation in an experiment. Or, ifthis is not possible with the SDK, the eye tracker offers software to do this. The calibrationshould take place as close as possible to the actual recording, so it is as accurate as possiblebut without disturbing the questionnaire flow. If we calibrate for instance directly after theprequestions and before the main part, the normal questions, the pressure at first might behigh and the user might act and look differently as usual.
3.4.3 Screen Recording
The recording of the screen should take place as close as possible to the start and stop ofthe recording of the eyes. Depending on the implementation, to start and stop in parallelwould be optimal, but in a one threaded browser, this is not possible. Further, the recordingshould be in a common format and uploaded and saved on a server. The last mentionedpart is really important to make it possible to watch the video together with the eye trackingdata afterwards. To reuse already written code, we can use an open source library whichrecords the screen with the help of an extension in the browser, since the experiment isdone in a browser. But there are drawbacks. For security reasons, the browser needs theexplicit permission of the participant to record the screen, which interrupts the flow ofthe experiment. Also, we have to mind memory restrictions of the browser because videomedia is usually relatively big in contrast to text and images, which are more commonlyused in websites. Alternatively, we could use a desktop software, but in this case we haveto record the screen from the beginning until the end of the full experiment, which leavestoo much footage that we do not need. Another drawback is the software must be first
18

3.4. Concept of the Experiment Mode with Eye Tracking
downloaded and then be installed by the user, and further the recording must be uploadedby the participant manually. We want to make it as simple as possible for participants, evenif we have to work with the mentioned drawbacks, so we decide for the recording of thescreen via a library.
19

Chapter 4
Implementation of QuestionnaireExtension
In section 3.3 we developed our approach to extend the questionnaire inside the experimentmode of ExplorViz so it will conform more to the requirements of Experiment ManagementSystems. We describe how we modified the current ExplorViz project at different parts toadd the questionstyles prequestion and postquestion to the Questionnaire.
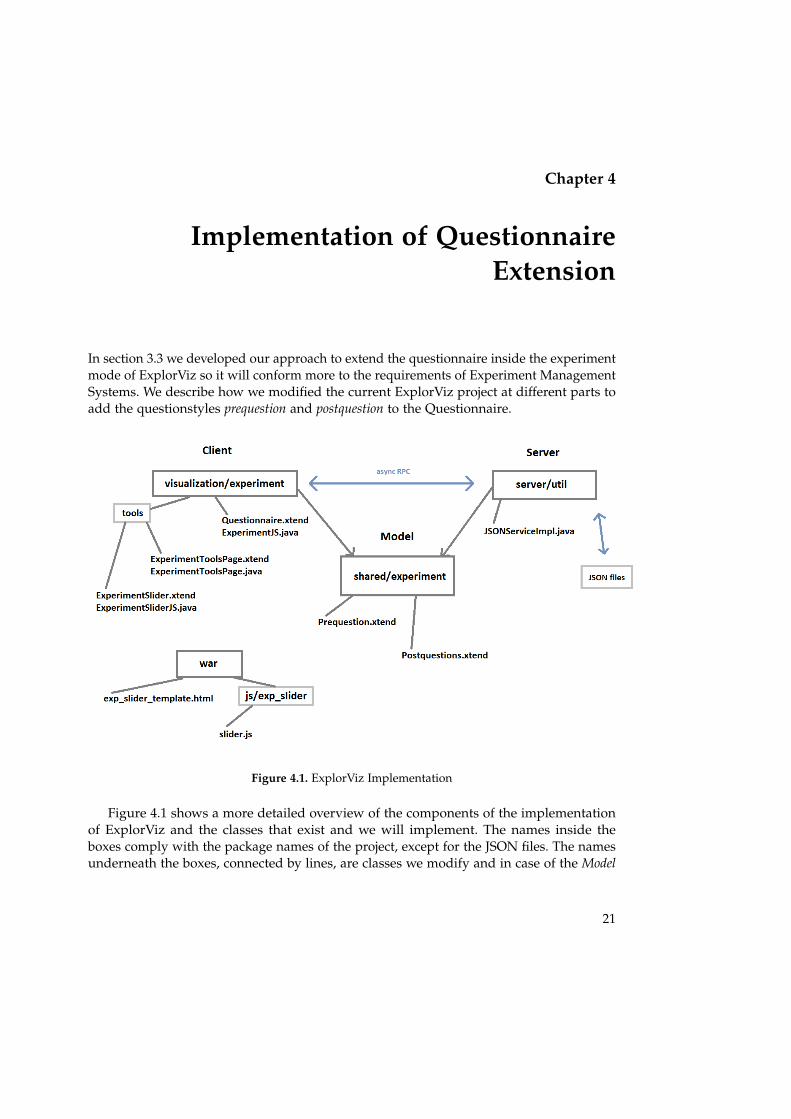
Figure 4.1. ExplorViz Implementation
Figure 4.1 shows a more detailed overview of the components of the implementationof ExplorViz and the classes that exist and we will implement. The names inside theboxes comply with the package names of the project, except for the JSON files. The namesunderneath the boxes, connected by lines, are classes we modify and in case of the Model
21

4. Implementation of Questionnaire Extension
part, create. The blue lines represent a communication between components or in case ofthe JSON files the access of them. The package war is not in the source code but is thestatic files of the website. In the following sections, we describe the illustrated and theirrelationships in detail.
4.1 JSON File
Listing 4.1. Extract of an Experiment in JSON Format
1 {
2 "questionnaires": [{
3 "preAndPostquestions": true,
4 "questionnareID": "quest1493635916790",
5 "prequestions": [{
6 "expApplication": "",
7 "answers": [],
8 "workingTime": "",
9 "type": "freeText",
10 "questionText": "Prequestion One"
11 }],
12 "recordScreen": false,
13 "questions": [{
14 "expApplication": "",
15 "answers": [
16 {
17 "answerText": "Answer One",
18 "checkboxChecked": false
19 },
20 {
21 "answerText": "Answer Two",
22 "checkboxChecked": false
23 }
24 ],
25 "workingTime": "5",
26 "type": "freeText",
27 "expLandscape": "1467188123864-6247035",
28 "questionText": "Question One"
29 }],
As shown in Listing 4.1, the attribute questionnaire is extended by two additional listsfor questions. They are called prequestions and postquestions. Important is also the attribute
22

4.2. Model
preAndPostquestions inside every questionnaire. This determines the option whether pre-and postquestions should be enabled during the input of the questions and during anexperiment.
4.2 Model
The model side of ExplorViz project is named shared and contains classes which are used onthe client and the server side of the project. This circumstance is based on the characteristicsof GWT, that the client side is implemented in Java. Before, in the legacy code, there was aclass named StatisticalQuestion. We replace this class with two other classes, the Prequestionand the Postquestion. StatisticalQuestion assign a type to each question, for example numberand depending on this, the inserted HTML will change for the representation of thequestion inside the questionnaire-modal during an experiment. Important attributes likeanswers, the text of a question, and ids are part of the class as well.
Prequestion possesses these attributes as well, inheriting from already existing classQuestion and we add the integer attributes min and max, for the new type number rangementioned in the approach. We also add the functionality for inserting the correct HTMLfor the representation of the new types mentioned in the approach, free text, multiple choice,and number range.
4.3 ExplorViz server
On the server side of the architecture of ExplorViz, which is illustrated as server. As shownin Figure 4.1, the interface JSONServiceImpl provides operations to handle experimentfiles, which are stored in the JSON format. This means, we implement functions to accessthe JSON files to modify the questionnaire attribute preAndPostquestions. There is no needfor a set-function of the list attributes prequestions and postquestions, because they get setwhen an experiment as a whole gets saved or modified. In that case a JSON string is sentas parameter and saved in the respective file as a whole, without modifying or filtering thecontent, except validating it as JSON and match it to a prefabricated experiment schema.
4.4 Client
As seen in Figure 4.1 and mentioned before, ExplorViz project has a client side, calledvisualization. In the following, we describe the relevant parts on the side of the client, whichneed to be changed or developed.
23

4. Implementation of Questionnaire Extension
Figure 4.2. Experiment Overview RootPanel
4.4.1 ExperimentToolsPage
The class ExperimentToolsPage.xtend and its counterpart ExperimentToolsPageJS.java, seeFigure 4.1, create the administrator experiment overview page shown in a screenshotin Figure 4.2. We want to modify this existing interface and add the option of pre- andpostquestions. Since that name is long, we name it Statistic Questions. Based on the mockupas shown in Figure 3.6, we add a menu option Special Settings, add the menu option StatisticQuestions, and show with a glyphicon, a small picture of a black tick, whether the optionis enabled or disabled. In the following sections we will also explain some importantprinciples of the ExplorViz project implementation and its used features of GWT.
Add Option Statistic Questions
To add the two menu options Special Settings and Statistic Questions, we need to addtheir HTML representation into their respective places. To describe where we add theirrepresentation, we need to explain how the administrators overview is created. GWTgives the developer the possibility to use Java to implement the web pages. One of theclasses to act as a HTML element, is RootPanel. When compiled to HTML and Javascript,the RootPanel is the first container inside the body after a navigation bar, as shown inFigure 4.2 with an indication where RootPanel is located. If we set the RootPanels viewwith a string containing valid HTML, we set the content of the page. To do this, there
24

4.4. Client
is a big HTML string in class ExperimentToolsPage in method showExperimentList. Duringthe loading of the page, the ExperimentToolsPage first requests the experiments fromthe ExplorViz server, see Listing 4.3. They are sent back as string, containing a JSONstring and given to the function showExperimentList which gets executed afterwards. Thecommunication between ExperimentToolsPage and the server is done via asynchronousRPC. As mentioned before, this kind of communication is a feature of GWT to make iteasy to exchange Java objects. When the RPC returns, a callback is invoked. In this case,the GenericFuncCallback is called and it invokes the function we pass on to it, as shownin Listing 4.3, the function showExperimentList. The callback also needs the type of thereturn-value by the server, to pass it on as parameter to the function, in Listing 4.3 it is thecommon type of String.
Listing 4.2. Extract of ExperimentToolsPage method render
1 jsonService.getExperimentTitlesAndFilenames(
2 new GenericFuncCallback<String>([showExperimentList])
3 )
With the information about the experiments as parameter, the HTML for the contentof the page is built and set inside the function showExperimentList. This string containingHTML is the part we add the menu options. See Listing 4.4 with the specific code partwe add. Due to Xtend and the source code generation, we can generate the string. Thecode extract in Listing 4.4 does not show it, but it is located inside two for-loops of codegeneration. We see an indication first in line 13, where the expression «i.toString + j.toString»is shown. The variables i and j are the counters of each for-loop. They indicate how manyexperiments and questionnaires we went through, making the id of the link unique.
25
4. Implementation of Questionnaire Extension
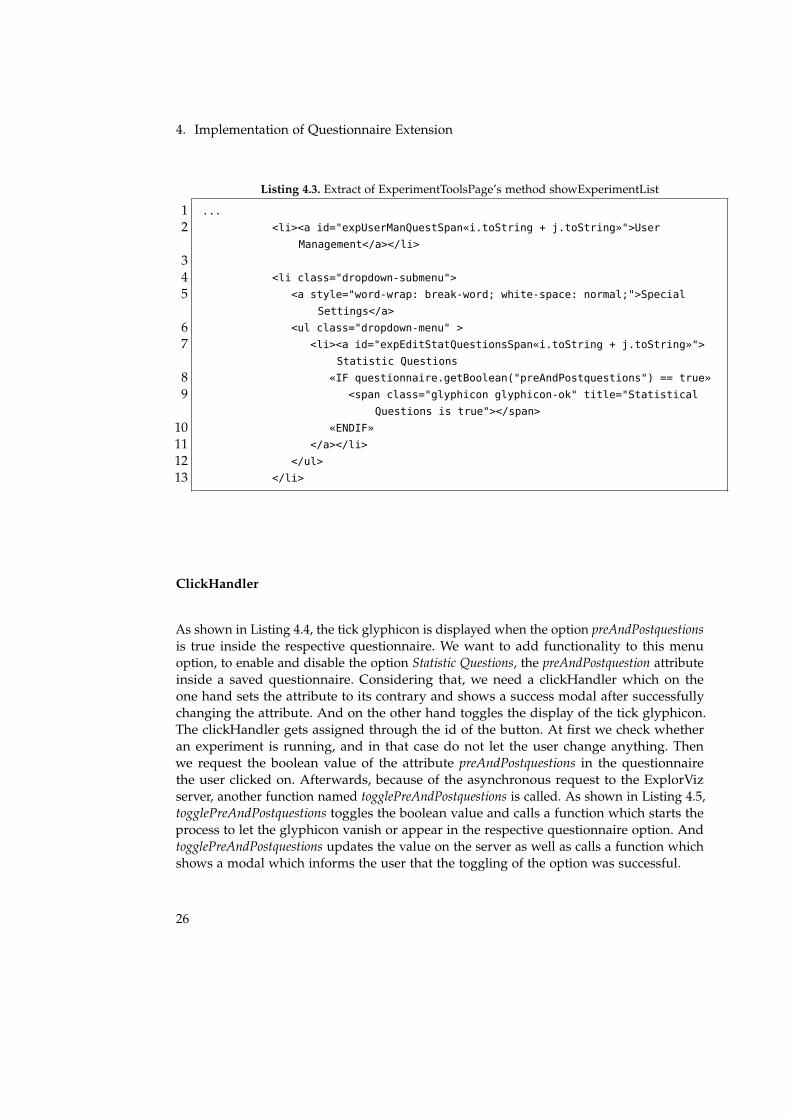
Listing 4.3. Extract of ExperimentToolsPage’s method showExperimentList
1 ...
2 <li><a id="expUserManQuestSpan«i.toString + j.toString»">User
Management</a></li>
34 <li class="dropdown-submenu">
5 <a style="word-wrap: break-word; white-space: normal;">Special
Settings</a>
6 <ul class="dropdown-menu" >
7 <li><a id="expEditStatQuestionsSpan«i.toString + j.toString»">
Statistic Questions
8 «IF questionnaire.getBoolean("preAndPostquestions") == true»
9 <span class="glyphicon glyphicon-ok" title="Statistical
Questions is true"></span>
10 «ENDIF»
11 </a></li>
12 </ul>
13 </li>
ClickHandler
As shown in Listing 4.4, the tick glyphicon is displayed when the option preAndPostquestionsis true inside the respective questionnaire. We want to add functionality to this menuoption, to enable and disable the option Statistic Questions, the preAndPostquestion attributeinside a saved questionnaire. Considering that, we need a clickHandler which on theone hand sets the attribute to its contrary and shows a success modal after successfullychanging the attribute. And on the other hand toggles the display of the tick glyphicon.The clickHandler gets assigned through the id of the button. At first we check whetheran experiment is running, and in that case do not let the user change anything. Thenwe request the boolean value of the attribute preAndPostquestions in the questionnairethe user clicked on. Afterwards, because of the asynchronous request to the ExplorVizserver, another function named togglePreAndPostquestions is called. As shown in Listing 4.5,togglePreAndPostquestions toggles the boolean value and calls a function which starts theprocess to let the glyphicon vanish or appear in the respective questionnaire option. AndtogglePreAndPostquestions updates the value on the server as well as calls a function whichshows a modal which informs the user that the toggling of the option was successful.
26

4.4. Client
Listing 4.4. Extract of ExperimentToolsPage method togglePreAndPostquestions
1 def static togglePreAndPostquestions(String experimentFileName, String
questionnaireID, boolean serverPreAndPostquestions) {
2 //toggle and update preAndPostquestions
3 var preAndPostquestions = !serverPreAndPostquestions;
4 toggleGlyphicon(serverPreAndPostquestions, "expEditStatQuestionsSpan",
experimentFileName, questionnaireID);
5 jsonService.setQuestionnairePreAndPostquestions(experimentFileName,
questionnaireID, preAndPostquestions, new GenericFuncCallback<Void>([]))
;
6 ExperimentToolsPageJS::showSuccessMessage("Option Statistical Questions", "
The option for pre- and postquestions was set to " + preAndPostquestions
.toString() + ".")
7 }
Toggling the Glyphicon
We are now inside the function toggleGlyphicon, that we called in line 4 of Listing 4.5. Totoggle the tick glyphicon in the menu option, we need to know the id of the menu option.But we only have the experiment name and the questionnaireId as context. We start withrequesting all experiments and their questionnaire, which we go through in the searchfor the correct experiment name and then the correct questionnaireId. Then we call afunction which is implemented with native Javascript, named the same as our currentfunction: toggleGlyphicon. These kind of native Javascript functions exist in the ExplorVizproject quite often and are implemented inside a counterpart Java class, in this case calledExperimentToolsPageJS.java. The functions are usually public, static, and because of thenative Javascript are they also tagged native, and are called JavaScript Native Interface1
(JSNI) methods. And here the native function toggleGlyphicon either removes or appendsthe tick glyphicon with the help of JQuery. It is noteworthy that it is called native Javascript,but that there are differences to normal Javascript. One of them is, that we need to add$wnd to access Javascript instances of the page. Also, and this is a big advantage, we cancall Java methods and pass on variables as parameters.
4.4.2 Option Question-Interface
The administrator has more possibilities than just to change an option of a questionnaire.An important part is to add questions. It was already mentioned that there exists aninterface to add, modify and delete questions of a questionnaire. But as mentioned before,we added the pre- and postquestions to the questionnaire. And in the approach, we want
1http://www.gwtproject.org/doc/latest/DevGuideCodingBasicsJSNI.html
27

4. Implementation of Questionnaire Extension
GWT
ExplorViz.html...war/css/*
war/js/*
war/experiment/slider.js exp_slider_template.html
create Slider object
declaration of Slider constructor
Figure 4.3. Integration of CanJS
to add the possibility of managing them inside the already existing interface, for consistentdesign. The interface was implemented with CanJS and we implement our approach thereas well.
The menu option Question-Interface, shown in the approach mockup Figure 3.7, is imple-mented like the menu option before. As HTML added to the view in ExperimentToolsPageand combined with a clickHandler. But this clickHandler changes to a page called Ex-perimentSlider. This Xtend class implements specific methods and requests and transfersrespective questionnaire data to a Javascript object. In Javascript a function is an object atthe same time and the mentioned Javascript object is named Slider. As shown in Figure 4.3,the connections here exists through the main HTML file, ExplorViz.html. It includes variousJavascript libraries and also the slider.js. The call and passing on of the data happens insidethe counterpart class of ExperimentSlider, ExperimentSliderJS.java, inside the blue GWT boxin Figure 4.3, illustrated with light blue. The Slider receives for parameters questionnairedata but also functions, which are implemented in the class ExperimentSlider. As statedbefore, we can invoke Java functions from inside the native JavaScript. Therefore, we createfunctions inside the ExperimentSliderJS native JavaScript and pass them on as parameters
28

4.4. Client
Figure 4.4. Extract of Question-Interface Page
to the external JavaScript object Slider, as illustrated as light blue line in Figure 4.3. As aresult, the Slider outside of the GWT environment can use the functionality and contextvariables of class ExperimentSlider inside GWT. The functions that are given as parameterentail to save data on the ExplorViz server, get the last viewed landscape, to load a specificlandscape, and a function to get back to ExperimentToolsPage, the Experiment Overviewpage.
CanJS interacts via components, which can be parts of each other. A component consistsof a template containing HTML, variables and events. And they are named via a tag. Wecan access values inside the template with variables declared in the component. Alsonoteworthy is, that if the variables are changed, a rerendering of the component getstriggered.
To add functionality to make questions of the styles prequestions or postquestions, wemust give the Slider the information whether Statistic Questions are enabled or not. We
29

4. Implementation of Questionnaire Extension
do that with a boolean parameter called preAndPostQuestions. Inside the root componentstemplate of Slider, we check for the value preAndPostQuestions and either disable orenable a components with a group of buttons. As shown is an example screenshot inFigure 4.4, the button series with Pre-, Questions, and Post- are disabled. When they aredisabled, the Slider shows only normal questions. When the option is enabled, it followsthat the buttons are enabled, except the one in which context the administrator is. Thatbutton is disabled and the questions of that question style are shown. During a switchof the questionstyle context, the data gets saved if it is valid. Modals pop up if questionsare not valid, and the invalid questions gets discarded if the modals are accepted. Dueto CanJS, we only need to change a variable inside the root component, and the Slidergets updated. Important to note here is, that we also need to create a new component forthe input in case of the pre- or postquestiontype of Number Range. Therefore we add atemplate and append the component at their respective places inside the code. Thereforewhenever the current questiontype Number Range is, to change the root components inputto the one of Number Range. The new component contains two number inputs, a minimumand a maximum, to input a restriction for the range of numbers experiment participantscan input.
Inside the class ExperimentSliderJS exists also the implementation for a tour an admin-istrator gets shown when he opens the Question-Interface page for the first time. TheQuestion-Interface page is manipulated by native functions to show small text modals onspecific elements inside the Slider. Since we added a button group, we update the tourwith some information.
4.4.3 Display during Experiment
With the sections before, we modified the possibilities for the questionnaire input and itssaving process. Hereafter, we describe the editing of the questionnaire display during anexperiment participation.
When a participant logs into ExplorViz, the web page recognizes him as such andrefers him first to the tutorial. The page class is called Experiment.xtend and there exists thecounterpart class ExperimentJS.java. The Experiment class handles mostly the tutorial, itssteps and the loading of its texts. When the tutorial is completed or if the participant clickson the navigation bar link Visualization, the class Questionnaire instead acts as Experiment,also calling methods from ExperimentJS.java.
The class Questionnaire starts with requesting the questionnaire attribute preAndPostques-tions, to determine whether the experiment process should start with the prequestions orskip them and continue with the normal questions. The request happens, as mentionedbefore, with an asynchronous RPC to the server. We request the experiment name andthe normal questions from the server and save them as attribute of class Questionnaire.Afterwards we start a process to begin the experiment visually.
A modal that informs the participant that he takes part in an experiment gets injectedinto the page, showing the name of the experiment. When the participant confirms, either all
30
4.4. Client
prequestions or the first normal question gets shown in the modal. In case of prequestions,is the attribute preAndPostquestions of the class Questionnaire not false. We request theprequestions from the server and create a form containing them in HTML. This form isinserted into the modal. The form gets created with the help of the methods of Modelpackageshared.experiment, remember Figure 4.1, class Prequestion. Depending on the typeof Prequestion, the HTML code elements get added to the form. When the participantanswered all prequestions and confirmed the modal, the first normal question gets injectedinto the modal. After the confirmation and before the injecting of the questions, the answersof the participant to the prequestions get saved. We can reuse the old function to save theanswers, since the format of the HTML form of the prequestions is the same as before.
The normal questions get shown one after the other, the time the participant takesis tracked and also shown inside the modal. Also, the respective software landscape forthe question gets loaded. After each question, the answer is saved and the next questionsdisplayed. This was implemented by [Finke 2014], as mentioned before. We do not modifyanything here.
After the last normal question, the visualization of the software landscape is emptiedand checked whether preAndPostquestions for the Questionnaire is true. If it is false, thequestion modal gets closed and the participant gets logged out and the user login is set todone. If the postquestions are to be displayed, they are first requested from the server andthen put into a form, like the prequestions before. And after the input and confirmation inthe modal, the answers also get saved, the participant gets logged out and set to done.
31

Chapter 5
Implementation of Eye TrackingExtension
In section 3.4 we modeled our approach to track the eyes of a participant during anexperiment. We explain here, what we modify in the ExplorViz project to implement ourapproach.
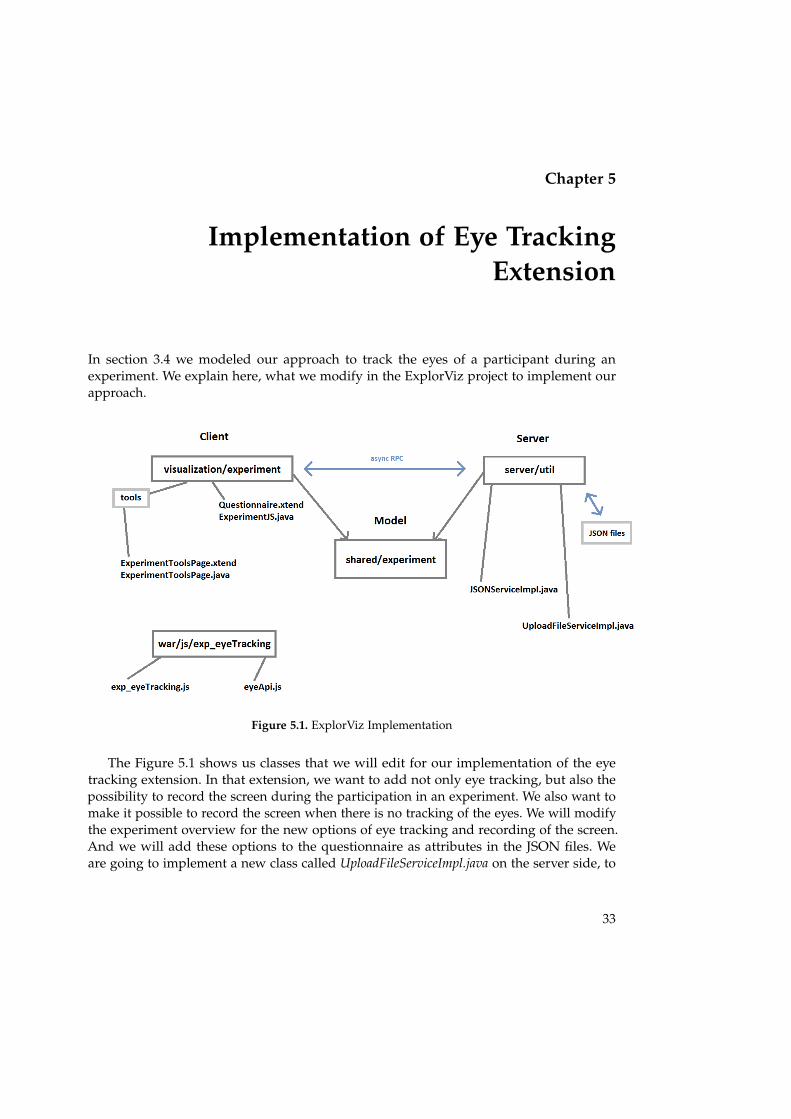
Figure 5.1. ExplorViz Implementation
The Figure 5.1 shows us classes that we will edit for our implementation of the eyetracking extension. In that extension, we want to add not only eye tracking, but also thepossibility to record the screen during the participation in an experiment. We also want tomake it possible to record the screen when there is no tracking of the eyes. We will modifythe experiment overview for the new options of eye tracking and recording of the screen.And we will add these options to the questionnaire as attributes in the JSON files. Weare going to implement a new class called UploadFileServiceImpl.java on the server side, to
33
5. Implementation of Eye Tracking Extension
receive and save the big media files of the screen recordings. Like in Chapter 4, there arestatic files in the war folder for the website. There is nothing to change inside the modelside, so we will skip this side in our explanation. We will start with the description of theformat of the JSON file, then the server side and what we change there, and it is followedby a description of the client side.
5.1 JSON File
Listing 5.1. Extract of an experiment JSON file
1 "questionnaires": [{
2 ...
3 "recordScreen": false,
4 "questions": [{
5 "expApplication": "",
6 "answers": [
7 {
8 "answerText": "Answer One",
9 "checkboxChecked": false
10 },
11 {
12 "answerText": "Answer Two",
13 "checkboxChecked": false
14 }
15 ],
16 "workingTime": "5",
17 "type": "freeText",
18 "expLandscape": "1467188123864-6247035",
19 "questionText": "Question One"
20 }],
21 "questionnareTitle": "Questionnaire One",
22 "eyeTracking": false,
23 ...
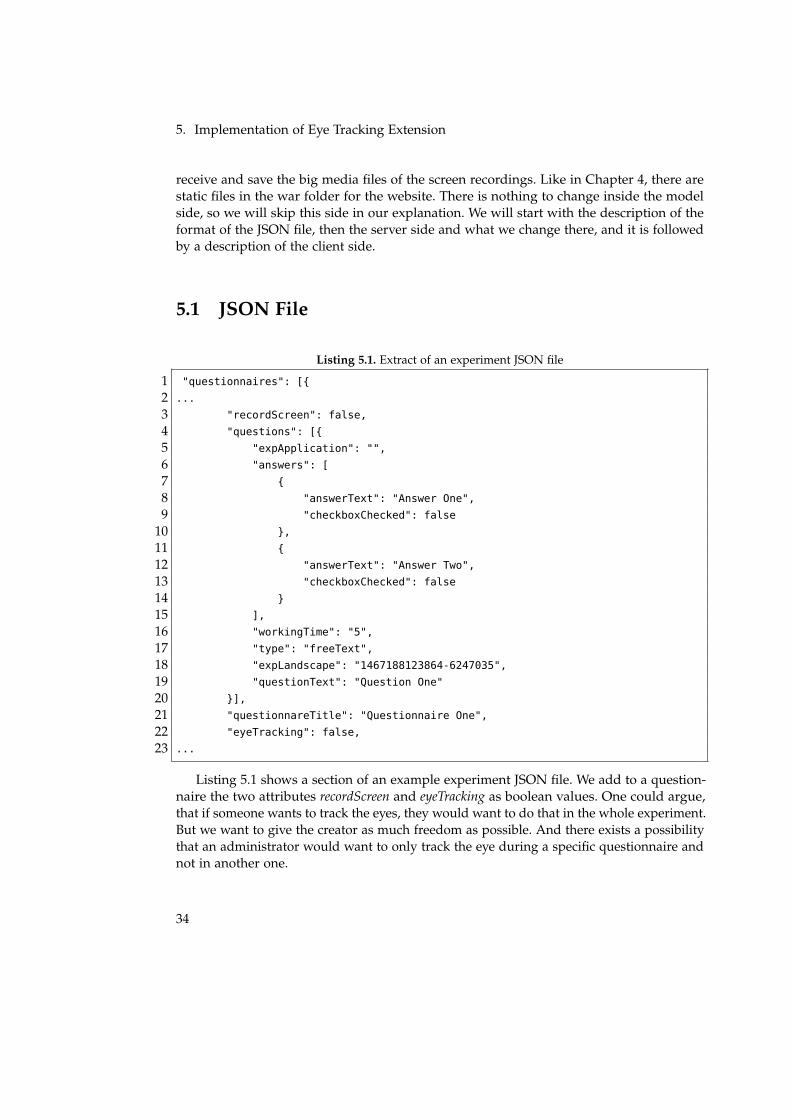
Listing 5.1 shows a section of an example experiment JSON file. We add to a question-naire the two attributes recordScreen and eyeTracking as boolean values. One could argue,that if someone wants to track the eyes, they would want to do that in the whole experiment.But we want to give the creator as much freedom as possible. And there exists a possibilitythat an administrator would want to only track the eye during a specific questionnaire andnot in another one.
34
5.2. Server
5.2 Server
Like in the approach in section 3.4 specified with the new questionnaire attribute preAnd-Postquestions, we add get- and set-functions to the JSONServiceImpl.java for each attribute,eyeTracking and recordScreen.
5.2.1 Eye Tracking Data
During the participation of an experiment, as mentioned before, we want to track the eyesand record the screen. These two processes generate data and we want to save the dataproduced in these processes on the ExplorViz server. In terms of size is the data of the eyetracking small. We can send it to the already existing server class JSONServiceImpl.java asstring and save it there locally like the JSON data of the experiments. We save it in a foldercalled eyeTrackingData next to where the answers of the participants are saved. This functionis called uploadEyeTrackingData. As mentioned in the approach, we also want to give anadministrator the possibility to look at the data, look at the recording of the screen and atthe same time mark where the participant looked at that moment. Therefore we need tooffer a get-function for the eye tracking data. This function is called getEyeTrackingData.
5.2.2 Screen Recording Data
To get and set the screen recording data is more difficult due to the size of the data thanthe eye tracking data. To upload the screen recording data, we will create a new class, theUploadFileServiceImpl.java. The function takes the data from the request, which is a HTMLform element, parses for the file, and saves it locally, like the eye tracking data, in a foldercalled screenRecords next to the answers of the participants. As mentioned before, the sizeof the data by the screen recording is quite big and in the media format webm. More detailsabout the topic of the media format are given later, in section 5.3. So an alternative totransferring the whole file back to the client, is to move a copy to the static files of thewebsite and answer the request with a link to that location. The functionality for this islocated inside the JSONServiceImpl.java. In summary, we copy the requested file to a specificlocation of the static files and answer the request with that location. But we do not wantto have many copies of the same file on the server, we want to stay as small as possible.Therefore, after copying the file to the specific location, we delete all other files that mightexists there. Since the requested file is in use, the server will not delete it.
5.3 Client
On the client side, we need to add the options eyeTracking and screenRecording to theexperiment overview page, to make an administrator able to change them. Then we needto add functions to the current process of displaying an experiment during a participation.
35

5. Implementation of Eye Tracking Extension
We need to trigger the screen recording and the recording of the eye tracking data. We alsoneed to implement the mentioned external server to communicate with the hardware of theeye tracker, to get the data, mentioned in the approach. And there is also the functionalitywe want to implement, that an administrator can watch the results of the eye tracking andscreen recording together. For this, we need to add an option in the experiment overviewpage, let the administrator choose between the participates that finished an experimentand then display their recording of the screen and the eye tracking.
5.3.1 ExperimentToolsPage
We want to add the questionnaire attributes eyeTracking and screenRecording as optionsto the experiment overview page, as well as the option Results, as shown in the mockupin the approach in Figure 3.7. The menu option Results should open a modal with thequestionnaire participants and their state, if they are done or not with their participation.
Menu Options eyeTracking and screenRecording
Similar to section 4.4.1, we add HTML menu expressions to the string that gets injectedinto a modal and then the RootPanel of the experiment overview page for both options.And we add for each clickHandler, which opens a modal, informing the administrator thatthe option was changed and invokes a request to the ExplorViz server to set the toggledvalue of the attribute. We also reuse the function to toggle and display a tick glyphicon foreach option.
Menu Option Results
Analog to the section before, we add the menu option to the experiment overview page.There is no need for a tick glyphicon, because this menu option is no attribute that getstoggled. In this case the clickHandler requests a list of the participants. Then we create aHTML table showing the participants, if they are done and if there is eye tracking data ofthe participant on the server. As shown in Figure 5.2, these columns are indicated with atick glyphicon in case of this column being true. There are two more columns with theirvalue indicated by a disabled or enabled button. The columns are called Screen Recordingand declares whether there exists a file of the recording on the server. The last columnis a disabled button if the participant did not finish the experiment yet and downloadsthe experiment and the participants answers and results, the eye tracking data and screenrecording, as a zip folder. Noteworthy is here, that we specifically request the server if thereare eye tracking data and screen recording saved on the server. In case of the eye trackingdata, a false positive is possible. If there is no eye tracking data during the participation,for example there is no eye tracker or the communication fails, the experiment still savesthe empty eye tracking data on the server. The data is empty, but the JSON object is there.
36

5.3. Client
Figure 5.2. Screenshot of a Results Modal
Screen Recording Replay
The button of the column Screen Recording, if enabled, opens another modal, a videoplayerwith buttons underneath, as shown in Figure 5.3.
Figure 5.3. Screenshot of a Replay Modal
We control with the buttons both the videoplayer and the replay of the eye tracking data,so we do not show the videoplayers native controls. We create the videoplayer, a canvas
37

5. Implementation of Eye Tracking Extension
and the buttons inside a string in the scope of the ExperimentToolsPage.xtend and inject itinto a modal. Like the slider.js in Section 4.4.2 and the Figure 4.3, there exists a JavaScriptfile outside the scope of ExplorViz. The constructor startReplayModeJS gets invoked frominside GWT after the modal is created. His parameters are the eye tracking data, after arequest, transferred by the server, and a link to the screen recording media file in the staticfiles of the website. The link gets set as source of the videoplayer.
As shown in Figure 5.3, the button to the left is the start button, showing a playglyphicon, and changes to a pause button with pause glyphicon if clicked. The button onthe right controls the display of the eye tracking. Similar to the mockup Figure 3.6, wedraw a small translucent red circle on top of the video, onto a canvas. And with the rightbutton the canvas is displayed or hidden.
Listing 5.2. Extract of an eye tracking data file
1 {
2 "eyeData": [
3 [
4 0.9116856157779694,
5 0.16776859760284424,
6 1490864805552
7 ],
8 [
9 0.9194962084293365,
10 0.1583147794008255,
11 1490864805567
12 ],
13 [
14 0.9013174474239349,
15 0.1775306835770607,
16 1490864805582
17 ],
18 ...
19 [
20 0.09196797013282776,
21 0.6925255656242371,
22 1490866323934
23 ]
24 ],
25 "width": 1920,
26 "videostart": 1490864814760,
27 "height": 1200
28 }
38

5.3. Client
The small bar underneath the buttons controls the progress of the video and eye trackingdata. As mentioned before, we draw a red translucent circle with a function called draw,which calls itself after a timeout. The draw function also sets the progress bar of the videoand manages the synchronization of the drawing of the eye tracking circle with the videotime. There a two important functionalities the progress bar has to master. One is thedisplay of the current time of the video and the eye tracking data. And the other is thecontrolling of the progress. That way a user viewing the replay of a participation of anexperiment can fast-forward or go back to another point of the video. In the Listings 5.2,the third number of the list item in eyeData shows the Unix Timestamp1 of the computerwhere a participant took part in an experiment with an eye tracker. We can see, that theeye tracking data entries do not happen in a regular time distance. But we can synchronizeit with the timestamps. We know the start point of the recording of the eye tracking data,seen in the Listing 5.2 as attribute videostart, and the videoplayer has a time attribute ofthe duration of the video. The videoplayer also has an attribute currentTime that we canaccess. With these information, we can determine when the eye tracking circle is too far inthe future and reset it. After the reset, we go through the whole list until we get to a pointwhere the videotime and the timestamp of the eye tracking data correspond vaguely toanother. We make these eye tracking data resets when the timestamp and videotime aremore than 40 ms apart from each other.
Listing 5.3. Extract of exp_eyeTracking Javascript file
1 var videoTime = loadedReplay.videostart + (v.currentTime * 1000);
2 setTimeOfSeekBar();
3 if(currentGaze[2]-videoTime >= 40 && !userOutsideDisplay) {
4 gazeCopy = loadedReplay.eyeData.slice();
5 currentGaze = gazeCopy.shift();
6 console.log("eyeTracking reset " + i);
7 }
In Listing 5.3 we see an extract of the file exp_eyeTracking.js which is noted in Figure 5.1.The variable videotime converts the current time of the video into a representation thatwe can compare to the eye tracking data timestamp. As mentioned before, we check thenwhether the video and the eye tracking data, in line 3 of Listing 5.3 represented as variablecurrentGaze[], are more than 40 ms different from another. Specifically if the eye trackingdata is more than 40 ms further than the video. Depending on the gaps between the eyetracking data entries, the reset happens quite often. We see in Listing 5.3, line 3, also avariable called userOutsideDisplay. This is a boolean value which indicates whether twoeye tracking data entries differ in their timestamp of more than 210 ms. We defined then,that this means, that the experiment participant looked away from the screen and theeye tracker could not get any eye tracking data because of that. The value of 210 ms may
1http://www.unixtimestamp.com/
39

5. Implementation of Eye Tracking Extension
appear arbitrary, but we checked with example eye tracking data we created during thedevelopment and in general transmits the eye tracker its data in intervals under 210 ms.The small bar underneath the buttons controls the progress of the video and eye trackingdata.
5.3.2 Experiment
During a participation in an experiment, we need to start the tracking of the eye andthe recording of the screen, if the options are enabled. And after the participant finishedthe experiment, we want to upload the eye tracking data and the screen recording to theExplorViz server.
Questionnaire
Similar to section 4.4.3, we modify the process during the beginning and at the end ofa participation of an experiment. We intervene in the starting process after the attributepreAndPostquestions is requested from the server. We request for the attributes eyeTrackingand screenRecording from the server and set them as attributes of class Questionnaire.
The starting of the two options must then be done right before the first normal questionis injected into the question dialog. In the approach, Section 3.4.3, it was mentioned thatthe flow of the experiment is interrupted by a window asking for permission to recordthe screen when the screen recording is started. We want to inject an extra modal beforethe first question, otherwise would the tracking of the time of the first question alreadystart and pressure the participant unnecessarily when he sees after confirming the securitymodal, that he had lost time. This would also interfere with the data of the results, sincethe participant is innocent of the time loss for the first question. As shown in Figure 5.4,the content of the modal announces the begin of the normal questions.
After the confirmation, the first question starts. The screen recording starts after theconfirmation of the security modal. An example is shown in Figure 5.5. Before the modalof Figure 5.4 is created and shown, invokes the class Questionnaire a native JavaScriptfunction in ExperimentJS, which calls similar to Section 4.4.2, a constructor function withone function as parameter, called EyeTrackScreenRecordExperiment. The parameter functionsaves the eye tracking data on the ExplorViz server. Other parameters are the booleanvalues for eyeTracking and screenRecording, as well as the Id of the user and a name of thequestionnaire.
EyeTrackScreenRecordExperiment
We implement EyeTrackScreenRecordExperiment in the external exp_eyeTracking.js file. Thereare different noteworthy aspects that the object takes care of. We start and stop the eyetracking and the screen recording from there, as well as transfer data to the ExplorViz server.And we establish a communication with the before mentioned external communications
40

5.3. Client
Figure 5.4. Simple Modal before first normal Questions during Experiment
server, which transfers the eye tracking data to us. To stop the recording and tracking, weimplement eventListener for the EyeTrackScreenRecordExperiment object, since we cannotinteract with the object from the GWT side after its construction. As mentioned before,the recorded media files of the screen recording are relatively big. Because of that, weneed a process which ensures that the experiment is not finished and closed before themedia file is uploaded to the ExplorViz server. We will follow with our description of thesementioned aspects the process during an experiment participation.
It was mentioned before, that we invoke the JavaScript constructor of EyeTrackScreen-RecordExperiment from the GWT side and receive important parameters, like a functionto save the eye tracking data and boolean values for eyeTracking and screenRecording,as well as information of the user and the questionnaire. The screen recording is startedfirst. In Figure 5.5, we see the security modal, mentioned before. As stated before, we use achrome extension called Screen Capturing to get access to the screen. And we use a librarycalled MediaStreamRecorder.js, which interacts with the chrome extension and captures thescreen for us. We construct the object mediaRecorder to use the functions of the library.Noteworthy is here, that we overwrite its function ondataavailable, which gets invoked aftera set time. When the ondataavailable gets called, a part of the screen recording gets send tothe ExplorViz server. We transfer parts during the screen recording, because of memory
41

5. Implementation of Eye Tracking Extension
Figure 5.5. Security Modal when starting Screen Recording
restrictions of the browser. We will mention this later again, but if the recording takes toolong, the recording object, a so called blob, becomes very big and is deleted.
We start the eye tracking by calling the function startEyetracker, which we find in theexternal JavaScript file eyeApi.js. This file was implemented by a student in the scope of hisbachelorthesis. A connection with a specific local port is established, the before stated exter-nal communications server for communicating with the eye tracker. The communication istranslated into JavaScript events, to which we let EyeTrackScreenRecordExperiment listen. Forexample, when new eye tracking data is received, did startEyetracker implement, that it getstranslated to an event called newGazeData, on which the document listens and saves the eyetracking data inside the event. Listing 5.4 shows an extract from the startEyetracker function,translating received data from the established connection to the external communicationserver to an event.
42

5.3. Client
Listing 5.4. Extract of eyeApi.js
1 connection.onmessage = function (e) {
2 var resp = JSON.parse(e.data);
3 switch(resp.responseType){
4 case "trackerStatus":
5 if(trackerStatus != resp.status){
6 trackerStatus = resp.status;
7 $( document ).trigger( "trackerStatusChanged", trackerStatus);
8 }
9 break;
10 case "gazeData":
11 trackerStatus = resp.status;
12 $( document ).trigger( "newGazeData", {"x" : resp.calX, "y" : resp.
calY, "time" : resp.time});
13 break;
14 default:
15 console.log(’invalid request type: ’ + e.data);
16 }
17 }
As stated before, after EyeTrackScreenRecordExperiment is constructed, we cannot interactwith it via function calls. So we implement a function, which triggers an event calledstopExperiment. We implement in EyeTrackScreenRecordExperimentto let the document listento this event and react with stopping the screen recording and the eye tracking.
We mentioned before, that we want to implement a mechanism to stop a participantfrom closing and finishing the experiment before the screen recording is uploaded. There-fore, we create a JavaScript function, which waits for two triggers, before it gives anokay, for the participant to close and finish the experiment. One from the GWT side,after all questions, and if enabled postquestions, were answered. And the other is theupload of the screen recording. We implement this function in exp_eyeTracking.js and callit uploadAndQuestionnaireFinished. The function lets the document listen to specific events,uploadFinishedSuccessful, uploadFinishedFailure in case of a failure during the upload of thescreen recording, and questionnaireFinished. When the participant has finished with thequestionnaire, but the upload is not done yet, a simple modal comes up and informs theparticipant about it. When a failure happens during the upload and the participant endedthe experiment, the modal informs him about these circumstances as well. The participantcan leave without any modal, if the upload was finished in time.
43

5. Implementation of Eye Tracking Extension
Eye Tracker Communications Server
Browser
Figure 5.6. Communication on Participants Computer
External Communications Server
As shown in Figure 5.6, the external communications server communicates with the eyetracker via a SDK and with the browser through a specific connection. The source code isin C++ and was implemented by the bachelor student that also implement eyeApi.js. Asstated in the foundations, we use a tobii EyeX eye tracker, and include the TobiiGazeSdk-CApi-4.1.0.806-Win64 as SDK for the tracker. When we started with our development of ourapproach in November 2016, this SDK was already depreciated by tobii and not availableonline anymore. Since tobii did not provide any other SDK during that timeframe, we usedthe SDK the bachelor student used.
The communications server basically establishes a connection to the eye tracker withthe SDK, which starts a process that sends data from the eye tracker to the communicationsserver, when the eye tracker notices that it has eye tracking data. The communicationsserver receives this data and transforms it to JSON. Listing 5.5 shows an extract of thetransformation process. We can see the attributes of the eye tracking data. After thetransformation, the data gets transferred to the browser, due to sending it to the socketand the browser listening to that socket.
44

5.3. Client
Listing 5.5. Extract of eyejsonprotocollserializer.cpp
1 void EyeJSONProtocollSerializer::serializeTrackingData(QSharedPointer<QPointF>
gaze, QSharedPointer<QDateTime> timestamp, QSharedPointer<QString> message)
2 {
34 QJsonObject json;
5 QJsonValue jResponseType("gazeData");
6 QJsonValue jX(gaze->rx());
7 QJsonValue jY(gaze->ry());
8 QJsonValue jTimestamp(timestamp->currentMSecsSinceEpoch());
9 json["responseType"] = jResponseType;
10 json["calX"] = jX;
11 json["calY"] = jY;
12 json["time"] = jTimestamp;
13 QJsonDocument doc(json);
14 *message = QString(doc.toJson());
15 }
Optional Local Improvements
We implemented a process to record the screen and we left the recording in its mediaformat, because the media object inside the browser scope is very big and we had problemswith memory restrictions. Our solution was to split the big media file into smaller parts,and implement this idea. We create the parts during the recording and upload them to theExplorViz server. The problem left is, that during the implementation of the replay of thescreen recording, we expected only one media file. For future work, we could implement amechanism on the server side of ExplorViz to merge the media file parts together. Anotherproblem factor is, that even though we develop and debug on a localhost, the replay of thescreen recording still stutters sometimes. This seems to be the case, because the media filesare in the webm format. For future work, we could implement that the media files not onlyget merged for one user, but also gets transformed in the more common mp4 format. But itis also possible to install software and do it on the local computer.
45


Chapter 6
Evaluation
In this chapter we evaluate our implementation. We conduct an experiment for the sakeof testing the functionality of our implementation. We describe its design, its results anddiscuss them. The goal of our evaluation is, to test the functionality of our implementationand assess the complexity for analyzing the eye tracking data and screen recordings.
6.1 Experiment Design
An experiment needs to be developed first and our design decisions have to be documented.Then we will describe and show our tasks, describe independent and dependent variablesinfluencing the experiment, the treatment during the experiment, and the participants.
6.1.1 Research Questions and Hypotheses
The experiment is based on three research questions, which we try to answer by conductingthe experiment.
1. What is the ratio between participants gazing not at the display, gazing at the questionmodal, and the ExplorViz interactive interface?
2. Is there a correlation between correctness of answers and amount of gaze time on thequestion modal versus on the interactive interface?
3. What does a participant mostly do (gaze and interaction with interface) when answeringa question incorrect?
Further, we define two hypotheses:
1. The ratio of gazing at the question modal, interface and not at the display differs betweenparticipants.
2. The correctness of answers differs between participants that gaze more at the questionmodal than the interface and vice versa.
And we specify accordingly two null hypotheses:
47

6. Evaluation
1. The ratio of gazing at the question modal, interface and not at the display does notdiffer between participants.
2. The correctness of answers does not differ between participants that gaze more at thequestion modal than the interface and vice versa.
6.1.2 Empirical Methods
The empirical method we use for trying to answer our research questions and provingour hypotheses, we will use an experiment. Not only do experiments help us to evaluate,according to [Basili et al. 1986], through gathering data but we can test the functionalityof our implementation. We will use tasks, that cover different features of the ExplorVizinteractive interface. And participants can vote afterwards the difficulty of the tasks. Theeyes are tracked during the questionnaire, as well as the screen.
6.1.3 Tasks
Our goal for the experiment is to find out whether our hypotheses are correct and to answerour research questions, while taking into account that we want to test the functionality ofour implementations. To our knowledge there does not exist an experiment which checkswhether eye tracking is valuable for a non static interface. We develop the tasks with thegoal, that the participants have to use various methods and features of the ExplorViz tool.The displayed software landscape is a monitored JPetStore instance, that we use because itmakes a slightly complex software landscape inside ExplorViz. The tasks are in a sequenceto build up in difficulty. They start with easy tasks. All tasks require at least two answers,which are displayed as text input fields. The amount of answers the participants need togive is displayed in the amount of text fields shown. They act like a hint for the correctanswers. Furthermore, we choose text input fields to make it impossible for participants toguess a correct answer when there are given answers from which they just have to choose.
We want to introduce the participant with the first question. The participant has toopen some packages and gains an overview of the packages and classes. Through thesecond and third tasks, gets the participants even more information about JPetStore, andlets the participant search through the displayed components. For solving task T2, mustthe participant understand, that not all communications with other class are shown whenparent packages are closed. The communications are summarized to one line then. Andthis is important to understand, when searching for classes to improve. Task T3 concernsfollowing the communications line and using a specific tool of ExplorViz, the trace analyzer.But it can also be correctly answered if the trace analyzer feature is not used and onlyfollowing a shortest possible path. The last task makes use of the communication summarywhen a parent package is closed. But through clicking each communication in the context,this solving is also possible and the participant needs find the correct column of aninformation modal.
48

6.1. Experiment Design
As shown in Table 6.1, we assigned to each task an id, that we will use to refer to thetasks. And we have assigned a score for each task. They are the points we give if the taskwas solved fully correct. Our evaluation schema for the scores is the following. For tasksT1.1 and T1.3 we grade one point only if the answers are correct. In task T1.2 it is possibleto get one point, when one answer is correct and two points of both are correct. The schemafor task T2, we grade one point for two correct answers of five. Furthermore, we grade twopoints for three correct answers and three points if all five answers were correct. Task T3 isgraded only full two points if the path is correct and we grade one point for task T4 if oneof the answers is correct and two points if both answers are correct.
Table 6.1. Description of the Task for the Experiment
ID Description Score
Context: Gaining an overview of interfaceT1.1 Take a look at the packages. There are two packages named ‘impl’.
Write their hierarchy in form ‘JPetStore.com.ibatis.xx’ down.1
T1.2 Take a look at package com.ibatis.jpetstore. Which classes havethe lowest and highest amount of active instances. Ignore theclasses with 0 active instances. Write only the class name andstart with the class with the lowest.
2
T1.3 Take a look at the given data of the whole application. Betweenwhich classes exists the most communication (requests)?
1
Context: Identifying refactor potentialT2 Take a look inside package com.ibatis.sqlmap.engine.mapping.
Which classes have high fan-in (at least 3 incoming communica-tions) and almost no fan-out (at max. 1 outgoing communication)with other classes?
3
Context:Following traces or communicationsT3 Take a look at class ’CatalogBean’ in package
com.ibatis.jpetstore.presentation and class ’DaoImpl’ in-side com.ibatis.dao.engine.impl. Name the classes which arebetween a communication of ’CatalogBean’ and ’DaoImpl’. Startwith naming ’CatalogBean’ and write down the shortest possiblepath. (Hint: you can use the traceanalyser.)
2
Context: Determining detailsT4 Take a look at package com.ibatis.sqlmap.engine.mapping.statement
and the given traces. Which class has a communication with thebiggest average method duration. Write down the class and thename of the method call, each in their own answer field.
2
49

6. Evaluation
Dependent and Independent Variables
The dependent variables in the experiment are the correctness of the answers and the timespent on each task. And another is where the participant gazes on the screen during theexperiment. The independent variable is the tool ExplorViz that the participants use forsolving the tasks.
Treatment
All participants used ExplorViz to solve the program comprehension tasks after theyfinished an integrated interactive tutorial. Before they started with the tutorial, theycompleted a calibration of the eye tracker.
Personal Information
Before and after the tasks, we will ask the participants personal questions. The initialquestions demand statictistical information, like gender, age, and highest completed degree.Also we request them to perform a self-assessment in regard to their experience withthe monitored application, JPetStore, and with the ExplorViz tool. The scale that theycould choose from for their experience of JPetStore ranged from ’None’, ’Beginner (sawsource code)’, ’Regular (implemented a feature)’, ’Advanced (implemented more than onefeature)’, to ’Expert (several years of experience)’. The options for the assessment of theirexperience with ExplorViz ranges from ’None (never used it)’, ’Beginner (used it casually)’,’Regular (familiar with some features)’, ’Advanced (familiar with most features)’, to ’Expert(years of experience)’. We referred here to the 5-point approach of [Likert 1932].
After the questionnaire, the participants are questioned about their experiences duringsolving of the tasks. They are asked about the pressure they perceived from the giventime, the tracking of the eye and the recording of the screen. And afterwards about theirview of the difficulty of the solved tasks. They could choose for all answers concerning thedifficulty of the tasks, on a scale from 1 (too easy) to 4 (too difficult), using a 4-point LikertScale [Likert 1932]. In case of the perceived pressure, the scale went from 1 (no pressure),to 4 (high pressure) and is also a 4-point Likert Scale [Likert 1932].
Population
We asked students, PHD students and research assistants for their participation. Weinformed the future participants, that we will provide them during the experiment withcookies and chocolate bonbons. 20 persons participated.
Due to bugs and an accident where the eye tracker was moved by a participant, fiveparticipants had to be eliminated because we did not have any screen recording or usableeye tracking data as results for the participants.
50

6.2. Operation
6.2 Operation
The following sections explain how we executed our experiments.
6.2.1 Experimental Set-up
In this part, we describe relevant hardware and software we used for the experiment. Thecomputer we used, had a 24 inch monitor with a resolution of 1920 x 1200 pixels. Theoperation system is a Microsoft Windows 10 64-bit version with an installed JDK(JavaDevelopment Kit) in version 1.8. Further, as mentioned before, we installed an eye tracker,the tobii EyeX Controller. And we installed the chrome browser, where we installed thechrome extension Screen Capturing. And we need to start the communications server locallyon the computer. Further information on install instructions and versions of the installedsoft- and hardware are described in Appendix A.
6.2.2 Create Input
We created the execution trace based on a running instance of the JPetStore 6. The JPetStorewas instrumented to be monitored with ExplorViz. During the execution of the JPetStoreinstance, the monitoring is done and we interacted with the JPetStore web application,producing process chains, producing the execution trace that we used.
6.2.3 Tutorial
We introduced the participants to the tool ExplorViz with the guided and interactivetutorial ExplorViz provides. The tutorial showed the functionality that the participantswould need to solve the tasks.
6.2.4 Questionnaire
We used the electronic questionnaire integrated in ExplorViz, which we extended inthis thesis. That way we have the answers in digital form, track the time and track theparticipants eyes during their reading and answering of their tasks and the participant isforced to enter answers into the given number of answer input fields.
6.2.5 Pilot Study
Before we performed our experiment, we asked two people to perform as participantsin a pilot study. We checked whether the assigned time to each task is reasonable, if thetasks and tutorial texts are comprehensible and if there are any careless mistakes left inthe tutorial or tasks. We changed the tasks and tutorial according to their feedback andadded a task regarding the structure of packages in the software application view, see task
51

6. Evaluation
T1.1, and added hints to other tasks. Task T1.1 is added, to introduce the participants intothe software structure. The hints, one explicit and other implicit through bold letters, areadded to mark important parts of the question. It was indicated that they are otherwiseeasily overlooked.
6.2.6 Procedure
The experiment took place at CAU Kiel with one computer. One participant could takepart in the experiment at a time. The participants were provided with cookies and choco-late bonbons during their participation. They started with reading information aboutthe experiment, which is located in Appendix B. It describes that they can cancel theirparticipation anytime and that we use their data anonymously. Also why we are carryingout an experiment and that their eyes are going to be tracked and the screen is going tobe recorded. We told them to tell us, when the security modal for the screen recordingappears, so we as the attendants are sure they clicked the right button. Then we start thecalibration of the eye tracker for the participant. The tobii EyeX Tracker we use providesa calibration process and we use it for the participant. Afterwards we put the browserin full-display mode (F11) before the participants log in and they start the tutorial. Theexperiment’s questionnaire starts afterwards, first the prequestions, then the tasks fromTable 6.1 and the postquestions afterwards. The first task from Table 6.1 appears, shows upa security modal asking permission to transmit the content of the screen to the ExplorVizserver, which the participant confirms under our supervision.
We assigned the first task 8 and the Second 7 minutes. For all other tasks are 10 minutesdesignated.
6.3 Data Collection
We collected during the experiment the answers of the prequestions, the normal questionsand the postquestions. We also tracked the time participants needed for each task andtracked their eye during solving of the normal questions. Additionally we recorded thescreen during the time the participant’s eyes were tracked.
6.3.1 Timing and Tracking Information
The tracking of the time that each participant takes, is done automatically by the electronicquestionnaire system of ExplorViz. The recording of the screen is done with the help of achrome extension, see Section 2.8, to see what the participants did during the experiment.And we track the eyes of the participant with an eye tracker, which we use in connectionwith the recorded screen to see where participants looked during the experiment. We willuse this data to discuss our hypotheses later in the section Discussion.
52
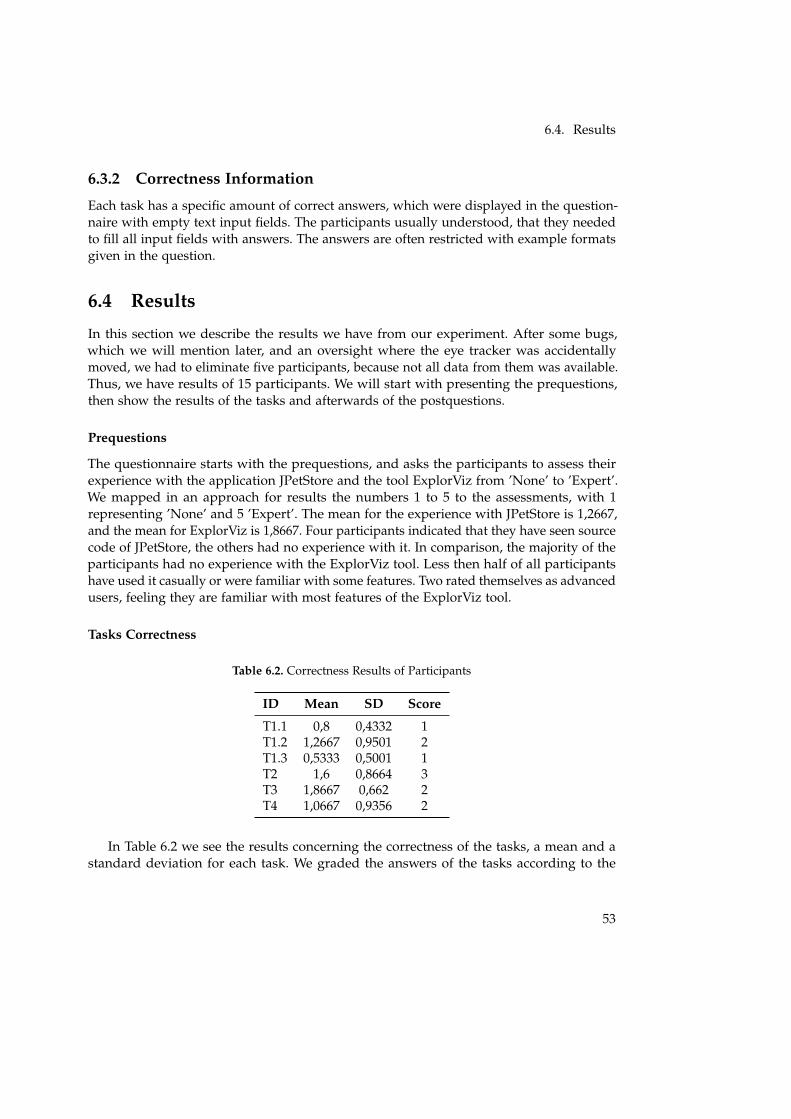
6.4. Results
6.3.2 Correctness Information
Each task has a specific amount of correct answers, which were displayed in the question-naire with empty text input fields. The participants usually understood, that they neededto fill all input fields with answers. The answers are often restricted with example formatsgiven in the question.
6.4 Results
In this section we describe the results we have from our experiment. After some bugs,which we will mention later, and an oversight where the eye tracker was accidentallymoved, we had to eliminate five participants, because not all data from them was available.Thus, we have results of 15 participants. We will start with presenting the prequestions,then show the results of the tasks and afterwards of the postquestions.
Prequestions
The questionnaire starts with the prequestions, and asks the participants to assess theirexperience with the application JPetStore and the tool ExplorViz from ’None’ to ’Expert’.We mapped in an approach for results the numbers 1 to 5 to the assessments, with 1representing ’None’ and 5 ’Expert’. The mean for the experience with JPetStore is 1,2667,and the mean for ExplorViz is 1,8667. Four participants indicated that they have seen sourcecode of JPetStore, the others had no experience with it. In comparison, the majority of theparticipants had no experience with the ExplorViz tool. Less then half of all participantshave used it casually or were familiar with some features. Two rated themselves as advancedusers, feeling they are familiar with most features of the ExplorViz tool.
Tasks Correctness
Table 6.2. Correctness Results of Participants
ID Mean SD Score
T1.1 0,8 0,4332 1T1.2 1,2667 0,9501 2T1.3 0,5333 0,5001 1T2 1,6 0,8664 3T3 1,8667 0,662 2T4 1,0667 0,9356 2
In Table 6.2 we see the results concerning the correctness of the tasks, a mean and astandard deviation for each task. We graded the answers of the tasks according to the
53

6. Evaluation
points we assigned the tasks. Noteworthy is here, that we gave in T3 task 4, 2 points for3 correct answers of 5 and 1 point for 2 correct answers. 3 points are given only if 5 of 5answers in T3 are correct, this happened only once. And in T4, task 5, we assigned only 2points or 0. We assigned 2 points to the task, because of the difficulty and the answers is apath of one correct answer, so we marked it either correct with full points or incorrect with0 points. All individual results are documented in the Appendix C.
Eye Data Results
For analyzing the data, we developed a website with local JavaScript inside to compute ourresults. It is located in the git repository1. We enter the data, the offset at the beginningof the video and for each time the participant moved the question modal, a start and endpoint in format <minutes,seconds> and the upper left and down right coordinates of thenew location of the question modal in format <x,y>. The x and y numbers are assessedwith another website (testCanvas.html) and opening the respective media file of the screenrecording to compare the locations of the question modal with a displayed line. The resultsof all participants concerning the ratio where they looked is in Appendix C.
Table 6.3. Information Ratio of Eye Tracking Data
Category Mean SD
Question Modal 17,0679 8,0997Interface 78,0356 20,0754Non-Display 4,8965 4,137
The Table 6.3 shows in the first line the mean of the percent that the participants lookedat the question modal, during the solving of the tasks. The define the mean as the averageof all participants. And the results in Table 6.3 are measured in regard to percentage. Wecomputed the percentage value for each category, for each participant and then calculatedthe mean and standard deviation. The category question modal represents, the amountof time, in percentage, the participants looked at the question modal. Category Interfacerepresents the amount of time that participants looked at anything else on the display, thusthe interface of the ExplorViz tool. And Non-Display shows the amount of time, the eyetracker could not track the eyes of the participant and thus means, they looked away fromthe computer monitor, for example to the keyboard. We defined, that whenever the eyetracker could not track the eyes for longer than 210ms, the participant looked not at thedisplay.
It is noteworthy, that the standard deviation of the Interface in very high.
54

6.5. Discussion
Table 6.4. Postquestions Mean and Standard Deviation
Category Mean SD
Pressure Time 1,733 0,7988Pressure Eye Tracking 1,2 0,6399Pressure Screen Recording 1,467 0,7988Difficulty T1.1 1,933 0,4577Difficulty T1.2 1,933 0,4577Difficulty T1.3 2,333 0,8997Difficulty T2 2,929 0,8287Difficulty T3 2,429 0,9376Difficulty T4 2,857 0,663
Postquestions
Table 1 shows the mean and the standard deviation of the assessment that all participantsgave for perceived pressures and difficulty of each task. The pressures are scaled from 1,for no pressure, to 4, for high pressure. The pressure for time is nearly a little for the mean,and the pressure for eye tracking is with a mean of 1,2 the most near to the assessmentchoice of no pressure. The screen recording is in comparison slightly higher with a mean of1,467, resulting in the assessment choice of a little if round up.
The lowest mean have tasks T1.1 and T1.2 with 1,933, which is nearest to assessmentchoice appropriate. The highest mean with 2,929 is task T2, which is nearest assessmentchoice a little difficult.
6.5 Discussion
In this section, we discuss our results that we presented before. We are interested whetherthere is a correlation between correctness of a participant and their amount of time lookingat the question modal. In case of the results of the prequestions, the information about theparticipants experience, would appear to correlate with the correctness concerning theirexperience with ExplorViz, if it is higher than a ’Beginner’(1). The correctness is clearlyhigher than average in case of our four participants where this applies.
6.5.1 Correctness of Tasks
Figure 6.1 shows, that the correctness decreases during the questionnaire. This implies, thatthe first tasks were appropriately set to the beginning of the questionnaire. The first threetasks were created to get a rough overview of the software. Many participants could not
1xxx/AnalyzeExperiment/getRatio.html
55

6. Evaluation
80,00%
63,33%
53,33% 53,33%
93,33%
53,33%
0%
10%
20%
30%
40%
50%
60%
70%
80%
90%
100%
T1.1 T1.2 T1.3 T2 T3 T4
PAR
TIC
IPA
NTS
CO
RR
ECTN
ESS
TASK IDS
CORRECTNESS OF TASKS:
Figure 6.1. Correctness of Tasks
name all answers for the task T2, because they did not open all linked packages, as hintedin the question. The hint is, that the word classes was in bold letters, see table 6.1. Thismight have been to difficult to detect, since the majority, as seen with the prequestions, arenovices with the ExplorViz tool. In comparison, the task T3 achieved the highest correctnessin our experiment with an average correctness of 93,33% and the following task, T4, hasvery little correctness with 53,33%. With the exception of task T3, the correctness of thetasks implies a correlation with the participants’ perceived difficulty.
6.5.2 Eye Tracking Data
56

6.5. Discussion
17
,07
%1
4,3
3%
23
,14
%2
5,9
1%
11
,91
%6
,05
%
21
,52
%
14
,67
%
21
,28
%
8,7
8%
15
,31
%1
6,8
4%
21
,47
%
5,0
9%
32
,13
%
17
,59
%
78
,04
%
77
,22
%
75
,67
%7
1,6
9%
71
,37
%
89
,88
%
75
,88
%
78
,34
%
73
,59
%
85
,86
%
79
,82
%7
4,3
1%
76
,98
%
94
,54
%
67
,57
%
77
,82
%
4,9
0%
8,4
5%
1,1
9%
2,4
0%
16
,71
%
4,0
6%
2,6
0%
7,0
0%
5,1
3%
5,3
6%
4,8
7%
8,8
4%
1,5
5%
0,3
8%
0,3
0%
4,5
9%
0%
10
%
20
%
30
%
40
%
50
%
60
%
70
%
80
%
90
%
10
0%
Mea
n1
23
45
67
89
10
11
12
13
14
15
PARTICIPATION TIME
PA
RTI
CIP
AN
TS
PAR
TIC
IPA
NT
S G
AZ
E-R
AT
IOS:
Qu
esti
on
Mo
dal
Inte
rfac
eN
on
-Dis
pla
y
Figu
re6.
2.In
form
atio
non
the
Part
icip
ants
Gaz
es
57

6. Evaluation
3,9
3,8
4,7
5,2
1,5
1,3
5,2
2,8
4,1
2,8
4,1
4,2
4,1
0,9
9,1
4,3
17
,5
20
,5
15
,31
4,4
8,9
19
,5
18
,5
15
,01
4,1
27
,5
21
,3
18
,6
14
,8
16
,5
19
,1
19
,1
1,0
2,2
0,2
0,5
2,1
0,8
0,6
1,3
1,0
1,7
1,3
2,2
0,3
0,1
0,1
1,1
05
10
15
20
25
30
35
Mea
n1
23
45
67
89
10
11
12
13
14
15
Experiment Duration in Minutes
Part
icip
ants
Du
rati
on
of
Exp
erim
ent
Part
icip
atio
n
qu
esti
on
Mo
dal
MS
inte
rfac
eMS
no
nD
isp
layM
S
Figu
re6.
3.D
urat
ion
ofEx
peri
men
tPa
rtic
ipat
ion
58
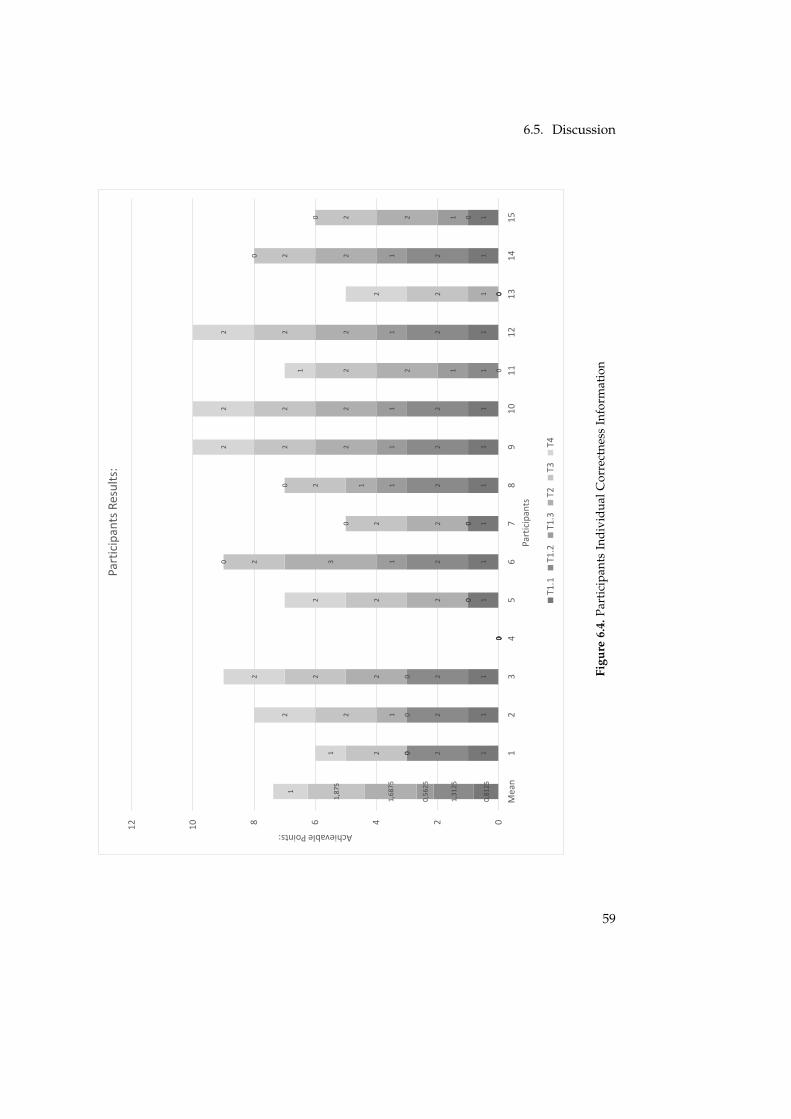
6.5. Discussion
0,8
12
51
11
0
11
11
11
0
1
0
11
1,3
12
5
22
2
0
0
2
0
22
2
1
2
0
2
0
0,5
62
5
00
0
0
0
1
0
11
1
1
1
0
1
1
1,6
87
5
0
1
2
0
2
3
2
1
22
2
2
1
2
2
1,8
75
2
2
2
0
2
2
2
2
22
2
2
2
2
2
1
1
2
2
0
2
0
0
0
22
1
2
2
0
0
02468
10
12
Mea
n1
23
45
67
89
10
11
12
13
14
15
Achievable Points:
Par
tici
pan
ts
Part
icip
ants
Res
ult
s:
T1.1
T1.2
T1.3
T2T3
T4
Figu
re6.
4.Pa
rtic
ipan
tsIn
divi
dual
Cor
rect
ness
Info
rmat
ion
59

6. Evaluation
As shown in Figure 6.2, the amount of time participants spent on looking at the interface,the question modal, and not at the display, in relation to their respective time they took theexperiment, differs from each other. Figure 6.3 contains shows also the for the participantsthe amount of time they looked at the question modal, the interface and not at the display.Figure 6.3 displays the variables in minutes.
In Table 6.3 we can see that the standard deviation is especially high for the amount oftime looked at the interface. In the beginning of this chapter, we constructed the hypothesis,that participants have different ratios concerning question modal, interface and non-display.Our data concerning the ratio and the standard deviation imply, that they do differ, in caseof our small experiment.
In Figure 6.4 we see the participants individual points they got for each task. This rep-resents their correctness individually. We can see in Figure 6.4, that there is one participantthat got 0 points. Participant number 4 has a relatively high amount of time, in which shedid not look at the display. This might be a correlation, but we do not have enough datato make this assumption. Another participant that has a small correctness, is participantnumber 13 with 5 points. The amount of time spent looking at the question modal is incomparison to the mean of everyone, 17,07%, small with 5,09%. In comparison, participantnumber 14 looked relatively often with 32,13% at the question modal. With his eight point,it is slightly above average and one of the seventh best in regards to correctness. The otherparticipant that has the same amount of points, is participant number 2. We developed ahypothesis, which implied that the gaze ratios of participants with the same correctnessare similar. The ratio of looking at the question modal is for participants number 2 andnumber 14 both higher than average, but they differ 8,99% in their amount of time lookedat the question modal. This implies that that there might be no correlation between pointsand amount of time spent looking at the question modal.
6.5.3 Postquestions
In Figure 6.5 are the results transformed into percentages, showing of, how the participantsassessed the difficulty of each task. This assessment was filled in after they solved the tasks.The percentage ranges from 0% as easy to 100% as very difficult. As shown in Figure 6.5, arethe tasks rated in general as not easy and mostly not too difficult. The difficulty increasesfrom the first to the last task, except for task T2, where the assessed difficulty is the highest.In Figure 6.1 is shown, that the correctness was relatively small in task T2, therefore itseems plausible to say that the task was difficult.
Task T3 correctness is according to Figure 6.1 with 93,33% even higher then the firsttask T1.1 with 80%, which was supposed to be the easiest task. With a perceived difficulty,third highest with 47,62% in Figure 6.5, the task T3 seems to be a difficult task which onaverage still got solved correctly.
60

6.6. Threads to Validity
31,11% 31,11%
44,44%
64,29%
47,62%
61,90%
0%
10%
20%
30%
40%
50%
60%
70%
80%
90%
100%
T1.1 T1.2 T1.3 T2 T3 T4
OP
INIO
N F
RO
M E
ASY
TO
DIF
FIC
ULT
TASKS
Average Opinion of Tasks:
Figure 6.5. Assessed Average Difficulty of Tasks
6.6 Threads to Validity
This section addresses experiment conditions that might threaten the validity of or in-fluenced our results of the experiment, (internal and external validity) [Shadish et al.2002].
6.6.1 Internal Validity
Reasons threatening the internal validity occur from the experiment and are explained inthe following sections.
Participants
Our participants were not many and they had various degrees of expertise. Our resultsand analysis could be different with more participants or when the participants hadmore expertise with the ExplorViz interface or software in general. Another threat is their
61

6. Evaluation
motivation. We provided cookies and chocolate, and some were interested in the subject,but this experiment provides no value to their professional life. The results could differ ifthe participant’s motivation was higher.
The participants rated the average pressure they perceived in regard to the time for eachtask as less than a little in average. The ratings for the eye tracking is no pressure, exceptfor three participants, who experience a little pressure. And the pressure concerning therecording of the screen is in average no pressure, but some did feel a little pressure and oneexperienced more pressure and rated it as maintainable. Therefore, if more or less pressurewould have been experienced, the results could have differed.
Another reason that might have influenced the participants, is that most of them have arelationship with the attendant and creator of the experiment. This might influence theparticipants to rate the tasks difficulty more as appropriate than difficult. If they did notknow the creator and attendant of the experiment, they might have rated more honestly.
A thread that concerning the participants is also, that their head movement and maybegestures with their hands might have influenced the results. Because of their movement orhand gestures, the eye tracking data could be different and if they might not have moved,the results might have been slightly different.
Tasks
A threat to our validity is that the tasks might have been too difficult. The assessment andcorrectness of the tasks, Table 1 and Table 6.2 respectively, do show that task T2 and T4were perceived as difficult and the incorrect answers imply this as well.
Tutorial
Another reason why participants might answer differently, is if the tutorial had a higherquality. We noticed during our experiment, that the tutorial did explain all necessaryfeatures and methods to solve the tasks, but that ExplorViz allows users to use severalshortcuts to get to the answers more efficiently. For one, the possibility to right click andturn the perspective inside the application view was not mentioned in the tutorial. Asstated, the tasks were still possible to solve, but using the feature to turn the perspectivemight have made solving them easier and even faster. And another thing is, that there existsa button in the interface to open all packages, on every layer, at once in the applicationview. That way we can view all classes at once and do not have to open every one of them,one after the other. If this was mentioned in the tutorial, the least correct answered task T2might have been solved successfully more often. As stated, it was possible to solve the task,but without the button more classes had to be opened manually.
Some participants mentioned afterwards, that even though it was shown in the tutorial,they forgot during the solving of the tasks how to open the trace analyzer feature. If thetutorial would take that into account and improve the way it explains this feature, thismight positively influence the results.
62

6.7. Lessons Learned and Challenges Occurred
Miscellaneous
An influence on our results could be the different kinds of pressures the participantsexperienced during the experiment. They could have felt pressure in regard to the timethey had for each task, the participants might have assessed the tasks differently becausethe time limit was set too small or too big. And also, if the eye tracker were more precise,our results might have differed concerning the looking ratio results. Another thread is thatour analyzing script for computing the results of the eye tracking data could be incorrect.
Some participants dragged the question modal to another place during the experiment.We mentioned in Section 6.4 that we followed the question modal’s movement to computethe correct ratio. We tried our best, but if some software would have tracked the absolutecorrect coordinates, also during the movement, the results might have been more precise.
6.6.2 External Validity
According to [Shadish et al. 2002] experiment results can not always be generalized. Forone, the tasks we developed are dependent on the software landscape. The structure andsize changes between different systems and JPetStore, on which basis we created our traces,is a sample software. So our results may not be applicable for other software systems.
Another reason why our results may not be applicable to generalization, is that theparticipants in the majority did not know the ExplorViz interface beforehand. They used itfor the first time and we do not know if the results might be influenced if they would usethe ExplorViz interface more often and in a professional sense. To eliminate this assumptionwe would need more experienced participants in another experiment.
Participants are situated in unusual circumstances during the experiment. In a way, theemployed tasks might not reflect real program comprehension tasks. They animate theparticipants to use the features of the ExplorViz interface but might not be applicable to realtasks that professionals would operate. So without further experiments with professionalsand validated tasks, our results might not be applicable to generalization.
6.7 Lessons Learned and Challenges Occurred
We experienced several challenges during the experiment. At first, some spelling mistakeswere not noticed during the pilot study inside the tutorial. They were not grave butinconvenient. Also one participant moved the eye tracker after their calibration and becausethe website is always in full screen, it was not noticed that the eye tracker could only rarelytrack the eyes of the participant, resulting in unusable eye tracking data. Four participantsexperienced a bug that was undiscovered within our implementation. When a participanttakes longer than expected, the communication between the ExplorViz client and therelated server happened to be disconnected and a failure occurs during the upload of thescreen recording. The problem handling should intercept there and download the screen
63

6. Evaluation
recording locally to the computer, but this command was implemented in a wrong scope,so the screen recording is empty and is lost. This was repaired during the experiment.
Two out of three participants experienced a specific bug during their interaction withthe ExplorViz tool. This bug is replicable, if one uses the trace analyzer, the interface zoomsinto the software application view and follows the trace that one chose. If we try to zoomin or out for a time and than close the trace analyzer, the interface does not react anymoreto left or right click. This can be solved with a workaround, to switch to the landscapeview and then back into the application view. This bug lead to some confusion for theparticipants.
Analyzing the eye tracking data was interesting but complex. There is no alternative tothe numbers we compute, so we do not know if there might be a miscalculation and ourresults concerning the ratios might be incorrect. Also, identifying the coordinates for thequestion modal as well as the points in time that they were moved, was time-consuming andvague. This can be improved if the question modal could not be moved by the participants.
6.8 Summary
In summary, we have lots of data implying that the tasks T2 and T4 might have been toodifficult. The difficulty of the first three tasks are perceived to increase in order and taskT3 was perceived as difficult but the correctness was in comparison to the other tasks, thehighest. Thus we could task T1.1, T1.2, T1.3 and T3 as appropriate.
We found data implying one hypothesis of our experiment design, that the amount oftime looking at the question modal, the interface and not at the display, do differ from eachother from one participant to another. And the hypothesis that there exists a correlationbetween the ratio of looking at the question modal and the correctness of the tasks, isimplied by the data to not be true.
With our experiment and its result we confirmed the functionality of a part of ourimplementation. This part is the display during an experiment. During our evaluation andanalysis of the results of the experiment, we confirmed the functionality of the other part,acting as an administrator.
64
Chapter 7
Related Work
There are several works with experiments in ExplorViz, like the master’s thesis [Finke 2014].She presented an approach to conduct interactive integrated experiments in ExplorViz andevaluated her approach with controlled experiments. In her experiments, she comparedExplorViz with another visualization tool called EXTRAVIS. Our approach bases on herwork, and we do not compare ExplorViz with other tools in our thesis. Our goal is,in comparison, to determine whether the feature of eye tracking and screen recordingenhances the experiment mode of ExplorViz.
In the work of [Fittkau et al. 2013], there were two controlled experiments conducted,also with screen recording. The screen recording data was not used and existed to belooked at when a participant answer is unusual. In comparison, we explicitly used thescreen recording for our analysis of the eye tracking data.
There are not many works which engage in eye tracking experiments with interactiveinterfaces. One is the work [Kevic et al. 2015], where they conducted an exploratory study todetermine what developers explicitly do during a change task. They used very fine-granulareye tracking data and they are automatically linked to the respective object, that they lookedat in the source code of the IDE. One of their findings is, that the eye tracking data containsother facets than interaction data. In comparison, our experiment was conducted with thesubgoal to find correlations between the amount of time a participant looked at the questionmodal, interface or non-display and the correctness of their answers to the experimenttasks.
Another work is by [Pretorius et al. 2010]. The assumption that they have and provethrough their work, is that eye tracking for usability only makes sense, when they aretesting interfaces for non-experts. Their use of eye tracking in this context was, to determinewhat kind of cognitive operations of participant happened. They conducted a study witheye tracking and a usability testing observations, which was a variation of the thinkingaloud protocol. The results showed that participants had unnoticed usability problems,which would not have been detected without eye tracking. They conclude, that expertswould notice the usability problems in the think aloud protocol and thus their assumptionis proven. In comparison, we did not use a think aloud protocol or any other usabilitytesting observations except the eye tracking and screen recording.
65


Chapter 8
Conclusions and Future Work
In the following, we will summarize this thesis and present ideas for future work.
8.1 Conclusions
In this thesis, we researched requirements for experiment management systems anddeveloped an approach for improving the usability of the ExplorViz experiment modeand enhancing it with the features of tracking the eyes and recording the screen duringan experiment. We implemented our approach and conducted an experiment to evaluateand test the functionality of our implementation. With the experiment, we confirmed thefunctionality. We analyzed the experiments results and we found data, which impliesthat the correctness of our developed tasks correlates with the amount of experience theparticipant has with ExplorViz. There was also data we found, implying that the percentageof the amount of time a participant looks at the question, the interactive interface, andnot at the display, differs between participants. Our experiment population was smalland we could not correlate any more eye tracking results. But the eye tracking data andscreen recording media files contain versatile information. Thus, we summarize that theydo enhance the experiment mode.
8.2 Future Work
During the development of our approach, we and others providing feedback, obtainedideas which would improve the ExplorViz experiment mode. We will present them in thefollowing.
During the set-up of the our experiment, we modified the legacy interactive tutorialof ExplorViz interface. The steps are saved in a configuration and for each step, there is amodal with text displayed. For each modal exists one text file with the text for the modalwhich is located in a specific folder on the ExplorViz server. Changing the steps and thetexts was tedious and complicated, because the order of the text files was set with their filenames. An idea would be to save the texts in a similar way to the experiments, as JSON fileon the server.
Then we mentioned the bug we experienced during the experiment, where the screenrecordings were lost. It is fixed, but now there are, as mentioned in Chapter 5, parts of the
67

8. Conclusions and Future Work
media file. An automated process where the media files gets merged together would bevery useful.
During our analysis of the experiment data, we noticed an important feature thatwould be really useful. The possibility to export the experiment data or download it isimplemented. There exists also the option to upload a single experiment file. But there is nopossibility to upload experiment results. We might not always have access to the ExplorVizserver, especially when it might only be in temporary use, to conduct an experiment. Thus,in our case it was not possible without a workaround to access the experiment data andreplay the video and eye tracking data in the browser.
In Chapter 6 we mentioned, that we used a script to compute results of the eye trackingdata. And that we used a vague method to enter the moment when and where the questionmodals were moved. It would be very useful if the computing could be automated. Theresults would be obtained easier and more precise. And there is potential in the eye trackingdata, for example if we would analyze the interface with a heatmap, determining whereparticipants looked at the most. And with a greater population including professionalusers, the results might be more distinct.
68

Bibliography
[Basili et al. 1986] V. R. Basili, R. W. Selby, and D. H. Hutchens. Experimentation insoftware engineering. IEEE Transactions on software engineering 7 (1986), pages 733–743.(Cited on pages v, 1, and 48)
[CanJS]. Canjs. url: https://v2.canjs.com/index.html. (Cited on page 6)
[Cornelissen et al. 2007] B. Cornelissen, D. Holten, A. Zaidman, L. Moonen, J. J. Van Wijk,and A. Van Deursen. Understanding execution traces using massive sequence andcircular bundle views. In: Program Comprehension, 2007. ICPC’07. 15th IEEE InternationalConference on. IEEE. 2007, pages 49–58. (Cited on page 4)
[Finke 2014] S. Finke. Automatische Anleitung einer Versuchsperson während eineskontrollierten Experiments in ExplorViz. Master’s thesis. Christian-Albrechts-Platz 4,24118 Kiel, Germany: Christian-Albrechts-Universität zu Kiel, 2014. (Cited on pages 2,4, 10, 31, and 65)
[Fittkau et al. 2013] F. Fittkau, J. Waller, C. Wulf, and W. Hasselbring. Live trace visualizationfor comprehending large software landscapes: the explorviz approach. In: SoftwareVisualization (VISSOFT), 2013 First IEEE Working Conference on. IEEE. 2013, pages 1–4.(Cited on pages v, 1, 3, and 65)
[Fittkau et al. 2016] F. Fittkau, A. Krause, and W. Hasselbring. Software landscape andapplication visualization for system comprehension with explorviz. Information andSoftware Technology (2016). (Cited on page 4)
[GWT]. Google web toolkit. url: http://www.gwtproject.org/. (Cited on page 6)
[Ioannidis et al. 1997] Y. E. Ioannidis, M. Livny, A. Ailamaki, A. Narayanan, and A. Therber.Zoo: a desktop experiment management environment. ACM SIGMOD Record 26.2(1997), pages 580–583. (Cited on pages 10 and 13)
[Jacob and Karn 2003] R. Jacob and K. S. Karn. Eye tracking in human-computer interactionand usability research: ready to deliver the promises. Mind 2.3 (2003), page 4. (Cited onpages 1 and 7)
[Jakobovits et al. 2000] R. Jakobovits, S. G. Soderland, R. K. Taira, and J. F. Brinkley.Requirements of a web-based experiment management system. In: Proceedings of theAMIA Symposium. American Medical Informatics Association. 2000, page 374. (Citedon pages 10, 11, and 18)
69

Bibliography
[Kevic et al. 2015] K. Kevic, B. M. Walters, T. R. Shaffer, B. Sharif, D. C. Shepherd, and T.Fritz. Tracing software developers’ eyes and interactions for change tasks. In: Proceedingsof the 2015 10th Joint Meeting on Foundations of Software Engineering. ESEC/FSE 2015.Bergamo, Italy: ACM, 2015, pages 202–213. url: http://doi.acm.org/10.1145/2786805.2786864.(Cited on page 65)
[Likert 1932] R. Likert. A technique for the measurement of attitudes. Archives of psychology(1932). (Cited on page 50)
[Pretorius et al. 2010] M. C. Pretorius, J. van Biljon, and E. de Kock. “Added value of eyetracking in usability studies: expert and non-expert participants”. In: Human-ComputerInteraction. Springer, 2010, pages 110–121. (Cited on page 65)
[Shadish et al. 2002] W. R. Shadish, T. D. Cook, and D. T. Campbell. Experimental andquasi-experimental designs for generalized causal inference. Wadsworth Cengage learning,2002. (Cited on pages 61 and 63)
[Sharafi et al. 2015] Z. Sharafi, Z. Soh, and Y.-G. Guéhéneuc. A systematic literature reviewon the usage of eye-tracking in software engineering. Information and Software Technology67 (2015), pages 79–107. (Cited on page 7)
[Sharif et al. 2016] B. Sharif, T. Shaffer, J. Wise, and J. I. Maletic. Tracking developers’ eyesin the ide. IEEE Softw. 33.3 (May 2016), pages 105–108. url: http://dx.doi.org/10.1109/MS.
2016.84. (Cited on page 7)
[WebRTC-Experiment]. Webrtc-experiment project. Muak Khan. url: https://www.webrtc-
experiment.com/. (Cited on page 8)
[Wettel et al. 2011] R. Wettel, M. Lanza, and R. Robbes. Software systems as cities: acontrolled experiment. In: Proceedings of the 33rd International Conference on SoftwareEngineering. ACM. 2011, pages 551–560. (Cited on page 4)
70

Appendix A: Install Instructions
The current state to carry out an experiment with eye tracking and screen recording on alocal computer, we have to go through the following different points.
� Download and install the Chrome Web Browser. We are restricted to this browserbecause of the chrome extension that we need to record the screen. Install the chromeextension Screen Capturing from Experiment WebRTC.
� Install the tobii EyeX Controller hardware and start it.
� Download the compiled version of the external communications server with all depen-dencies. Execute it.
� Download, install and run the ExplorViz server1. Because of security restrictions of thescreen capturing, it does only record when the website uses either SSL or exists onlocalhost.
� An Administrator creates an experiment and generates user. He sets the options eyetracking and screen recording to true and starts the experiment.
� A participant logs into the ExplorViz website. Fills out questionnaire and finishes theexperiment.
� An Administrator can watch the screen recording and the movement of the participantseyes.
When using the chrome extension, we have to be careful during the experiment. Thereare problems during the recording of the screen if we use two displays. Afterwards, themouse is not correctly displayed in the recording.
As optional improvement for the screen recordings, we used the popular free softwareffmpeg2 and installed it on the computer. Then we use the command shown in Listing Xon the command line to convert a webm media file to a mp4 media file.
Listing 1. Command to Transform webm to mp4
1 ffmpeg -i userX.webm userX.mp4
1https://github.com/ExplorViz/Docs/wiki/Installing-and-configuring-software-for-developers2http://ffmpeg.zeranoe.com/builds/
71
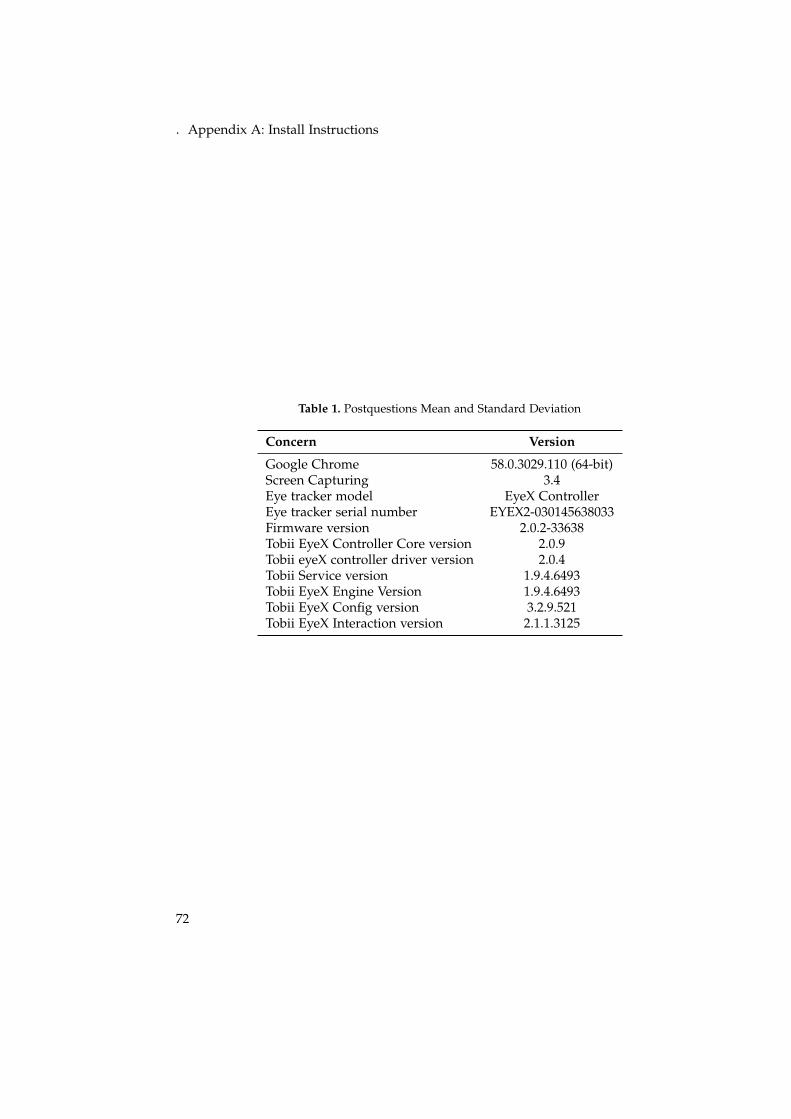
. Appendix A: Install Instructions
Table 1. Postquestions Mean and Standard Deviation
Concern Version
Google Chrome 58.0.3029.110 (64-bit)Screen Capturing 3.4Eye tracker model EyeX ControllerEye tracker serial number EYEX2-030145638033Firmware version 2.0.2-33638Tobii EyeX Controller Core version 2.0.9Tobii eyeX controller driver version 2.0.4Tobii Service version 1.9.4.6493Tobii EyeX Engine Version 1.9.4.6493Tobii EyeX Config version 3.2.9.521Tobii EyeX Interaction version 2.1.1.3125
72

. Appendix B: Informed Consent
Appendix B: Informed Consent
Informed Consent
Thank you very much for taking part in this experiment. You can stop
and cancel your participation anytime. Your data will be used
anonymously.
The goal of this experiment is to determine whether eye tracking
adds a value for studies with interactive interfaces, in particular
ExplorViz. ExplorViz is a web-based tool for visualizing large software
landscapes.
The study consists of three parts. In all three you will have to answer
questions. The first and third part are statistical questions about your
person and your experiences during the experiment. The second part
will take up most of the time and requires interacting with the
visualization interface of ExplorViz. During that time, your eyes will
be tracked and the screen will be recorded.
If you have any questions, ask your attendant anytime.
73

Appendix C: Raw Experiment Results
74
Par
tici
pan
tU
se
rID
Qu
est
ion
Mo
dal
%In
terf
ace
%N
on
-Dis
pla
y %
qu
esti
on
Mo
dal
in
ms
inte
rfac
e in
ms
17
14
,33
42
31
53
50
45
57
7,2
15
63
75
03
37
68
,45
01
30
96
15
78
22
8.2
11
1.2
29
.32
7
28
23
,13
95
24
64
46
27
37
5,6
69
82
37
97
06
58
1,1
90
65
15
58
30
68
28
1.1
76
91
9.4
89
39
25
,91
29
10
09
88
46
27
1,6
91
34
15
57
65
14
2,3
95
74
83
43
50
24
31
2.1
99
86
3.7
38
410
11
,91
41
67
71
41
31
87
1,3
72
17
48
59
22
87
16
,71
36
57
42
66
39
48
8.9
09
53
2.6
12
512
6,0
53
70
35
29
24
29
89
,88
25
30
53
93
68
04
,06
37
65
93
13
89
07
9.8
11
1.1
68
.94
4
613
21
,51
71
52
64
16
57
97
5,8
79
23
65
42
16
52
2,6
03
61
08
16
17
68
31
4.7
23
1.1
09
.85
6
714
14
,66
61
91
97
92
29
57
8,3
37
66
77
50
63
27
6,9
96
14
02
70
13
77
16
8.9
01
90
2.1
64
815
21
,27
52
65
68
03
50
07
3,5
90
85
22
60
88
76
5,1
33
88
20
58
76
22
24
5.0
40
84
5.5
95
917
8,7
80
70
37
02
41
31
85
,85
68
32
81
38
57
95
,36
24
63
48
37
29
01
68
.83
31
.65
0.8
32
10
18
15
,30
89
22
12
48
06
67
9,8
19
52
58
41
18
64
4,8
71
55
20
34
00
69
24
4.8
93
1.2
76
.85
3
11
20
16
,84
48
38
72
76
91
97
4,3
13
37
27
43
92
95
8,8
41
78
85
28
37
86
25
3.3
74
1.1
17
.79
5
12
21
21
,47
03
28
23
12
95
47
6,9
76
48
24
59
53
77
1,5
53
18
93
09
16
68
24
7.2
45
88
6.4
35
13
22
5,0
85
85
30
54
61
64
94
,53
84
50
54
99
73
80
,37
56
96
39
54
09
75
3.4
04
99
2.7
01
14
24
32
,12
63
24
70
08
66
36
7,5
71
12
23
46
47
14
0,3
02
55
29
52
66
21
54
4.9
37
1.1
46
.16
3
15
26
17
,58
90
39
15
74
31
87
7,8
18
49
89
73
05
03
4,5
92
46
18
69
51
79
25
8.5
39
1.1
43
.84
4

. Appendix C: Raw Experiment Results
75
no
nD
isp
lay
in m
s
fullT
ime
in
ms
T1.1
Sco
reT1
.2 S
core
T1.3
Sco
reT2
Sco
reT3
Sco
re T
4 S
core
Exp
erie
nce
JPet
Sto
re (
1-5
)
13
4.5
32
1.5
92
.07
01
20
02
12
14
.46
81
.21
5.1
33
12
01
22
1
28
.86
41
.20
4.8
01
12
02
22
2
12
4.7
25
74
6.2
46
00
00
00
1
49
.67
11
.29
8.4
26
10
02
22
1
38
.08
21
.46
2.6
61
12
13
20
1
80
.57
01
.15
1.6
35
10
02
20
2
59
.13
01
.14
9.7
65
12
11
20
1
10
3.1
08
1.9
22
.77
31
21
22
21
77
.92
91
.59
9.6
75
12
12
22
1
13
2.9
95
1.5
04
.16
40
11
22
11
17
.88
61
.15
1.5
66
12
12
22
2
3.9
45
1.0
50
.05
00
00
12
21
5.1
32
1.6
96
.23
21
21
22
01
67
.50
41
.46
9.8
87
10
12
20
1

76
. Appendix C: Raw Experiment Results
Exp
erie
nce
Exp
lorV
iz(1
-5)
Pre
ssu
re
tim
e (1
-4)
Pre
ssu
re e
ye
trac
kin
g (1
-4)
Pre
ssu
re S
cree
n
Rec
ord
ing
(1-4
)
Pe
rfo
rman
ce
Exp
lorV
iz (
1-4
)D
iffi
cult
y T1
.1D
iffi
cult
y T1
.2
12
11
31
2
11
11
12
2
11
11
42
2
12
11
22
3
22
11
31
2
31
22
33
2
23
12
22
2
41
21
32
2
12
11
42
2
12
11
32
1
13
12
22
2
31
12
32
2
11
11
22
2
43
12
32
2
21
23
32
1