extreme temperature in may - dhm.gov.np
TRANSCRIPT
Government of Nepal
Ministry of Energy, Water Resource and Irrigation
Department of Hydrology and Meteorology
Climate Division Babarmahal, Kathmandu
Extreme Temperature in May
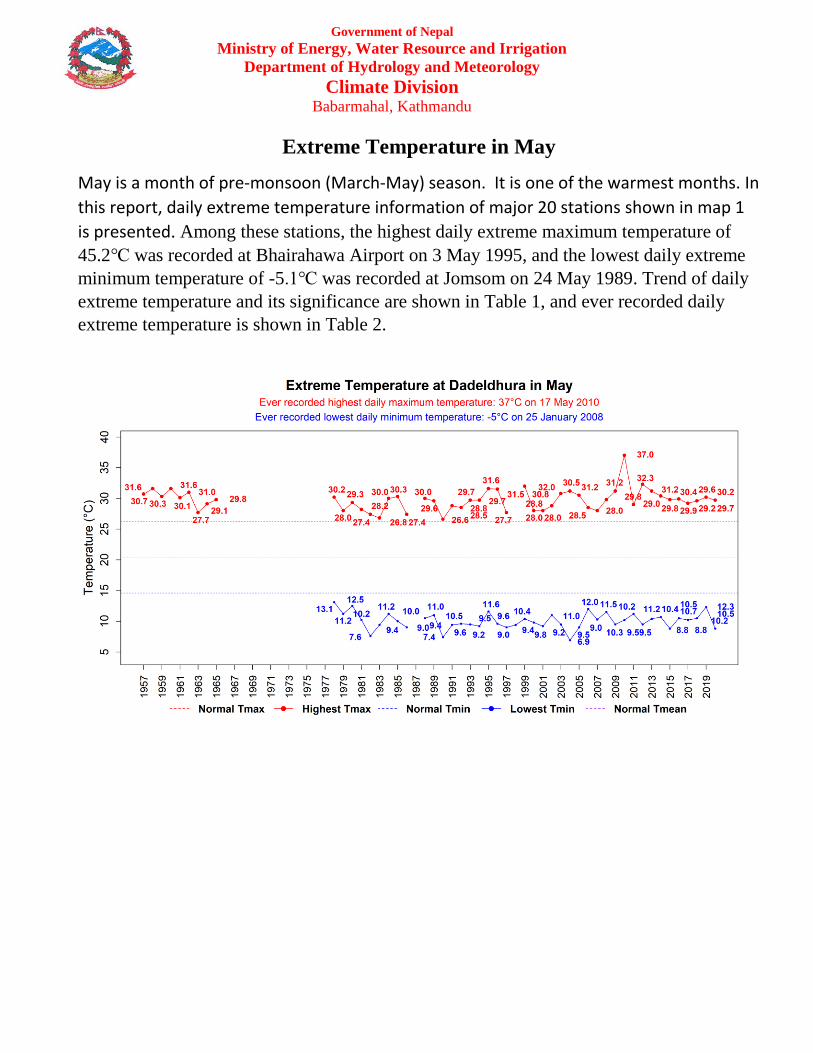
May is a month of pre-monsoon (March-May) season. It is one of the warmest months. In
this report, daily extreme temperature information of major 20 stations shown in map 1
is presented. Among these stations, the highest daily extreme maximum temperature of
45.2℃ was recorded at Bhairahawa Airport on 3 May 1995, and the lowest daily extreme
minimum temperature of -5.1℃ was recorded at Jomsom on 24 May 1989. Trend of daily
extreme temperature and its significance are shown in Table 1, and ever recorded daily
extreme temperature is shown in Table 2.

Government of Nepal
Ministry of Energy, Water Resource and Irrigation
Department of Hydrology and Meteorology
Climate Division Babarmahal, Kathmandu

Government of Nepal
Ministry of Energy, Water Resource and Irrigation
Department of Hydrology and Meteorology
Climate Division Babarmahal, Kathmandu
Government of Nepal
Ministry of Energy, Water Resource and Irrigation
Department of Hydrology and Meteorology
Climate Division Babarmahal, Kathmandu

Government of Nepal
Ministry of Energy, Water Resource and Irrigation
Department of Hydrology and Meteorology
Climate Division Babarmahal, Kathmandu

Government of Nepal
Ministry of Energy, Water Resource and Irrigation
Department of Hydrology and Meteorology
Climate Division Babarmahal, Kathmandu
Government of Nepal
Ministry of Energy, Water Resource and Irrigation
Department of Hydrology and Meteorology
Climate Division Babarmahal, Kathmandu

Government of Nepal
Ministry of Energy, Water Resource and Irrigation
Department of Hydrology and Meteorology
Climate Division Babarmahal, Kathmandu

Government of Nepal
Ministry of Energy, Water Resource and Irrigation
Department of Hydrology and Meteorology
Climate Division Babarmahal, Kathmandu

Government of Nepal
Ministry of Energy, Water Resource and Irrigation
Department of Hydrology and Meteorology
Climate Division Babarmahal, Kathmandu

Government of Nepal
Ministry of Energy, Water Resource and Irrigation
Department of Hydrology and Meteorology
Climate Division Babarmahal, Kathmandu

Government of Nepal
Ministry of Energy, Water Resource and Irrigation
Department of Hydrology and Meteorology
Climate Division Babarmahal, Kathmandu
Table 1: Trend and Significance of extreme daily Temperature in May
Stations Longitud
e (Deg)
Latitude
(Deg)
Trend of extreme
maximum temperature
in May
Trend of extreme minimum
temperature in May
Trend (Deg
Celsius/yea
r)
Significan
ce at 95 %
confidenc
e level (p-
value)
Trend (Deg
Celsius/year))
Significance at
95 %
confidence
level (p-value)
Dadeldhura 80.588 29.301 0.01 /
increasing
0.62 /
Insignifica
nt
No trend 0.97 / No trend
Dhangadhi 80.560 28.813 0 /
decreasing
0.71 /
Insignifica
nt
0.06 /
increasing
0.04 /
Significant
Dipayal 80.937 29.262 0.02 /
increasing
0.39 /
Insignifica
nt
0.06 /
increasing
0.05 /
Significant
Jumla 82.180 29.275 0.01 /
increasing
0.54 /
Insignifica
nt
0.02 /
increasing
0.39 /
Insignificant
Surkhet 81.635 28.588 0.02 /
increasing
0.22 /
Insignifica
nt
No trend 0.8 / No trend
Nepalgunj
Airport 81.668 28.101 No trend
0.96 / No
trend
0.16 /
increasing
0.05 /
Significant
Ghorahi
(Dang) 82.484 28.037
-0.01 /
decreasing
0.75 /
Insignifica
nt
0.02 /
increasing
0.62 /
Insignificant
Jomsom 83.730 28.784 -0.02 /
decreasing
0.15 /
Insignifica
nt
No trend 0.99 / No trend
Bhairahawa
Airport 83.420 27.507
0.01 /
increasing
0.79 /
Insignifica
nt
0.02 /
increasing
0.15 /
Insignificant
Pokhara
Airport 83.980 28.200
0.01 /
increasing
0.26 /
Insignifica
nt
0.02 /
increasing
0.15 /
Insignificant
Lumle 83.818 28.297 0.03 /
increasing
0.02 /
Significant
0.03 /
increasing
0.12 /
Insignificant
Simara
Airport 84.980 27.164 No trend
0.95 / No
trend
0.03 /
increasing
0.07 /
Insignificant

Government of Nepal
Ministry of Energy, Water Resource and Irrigation
Department of Hydrology and Meteorology
Climate Division Babarmahal, Kathmandu
Kathmandu
Airport 85.356 27.704
0.04 /
increasing
0 /
Significant
0.03 /
increasing
0.01 /
Significant
Jiri 86.232 27.630 0.03 /
increasing
0.01 /
Significant
-0.02 /
decreasing
0.16 /
Insignificant
Janakpur
Airport 85.924 26.711
-0.02 /
decreasing
0.42 /
Insignifica
nt
0.02 /
increasing
0.15 /
Insignificant
Okhaldhung
a 86.504 27.308
0.04 /
increasing
0 /
Significant
0.01 /
increasing
0.31 /
Insignificant
Dhankuta 87.346 26.983 0.09 /
increasing
0 /
Significant
0.06 /
increasing
0.01 /
Significant
Dharan
Bazzar 87.298 26.792
-0.04 /
decreasing
0.18 /
Insignifica
nt
No trend 0.69 / No trend
Biratnagar
Airport 87.267 26.484 No trend
0.91 / No
trend
0.03 /
increasing
0.03 /
Significant
Taplejung 87.670 27.359 0.03 /
increasing
0.01 /
Significant
0.02 /
increasing
0.09 /
Insignificant
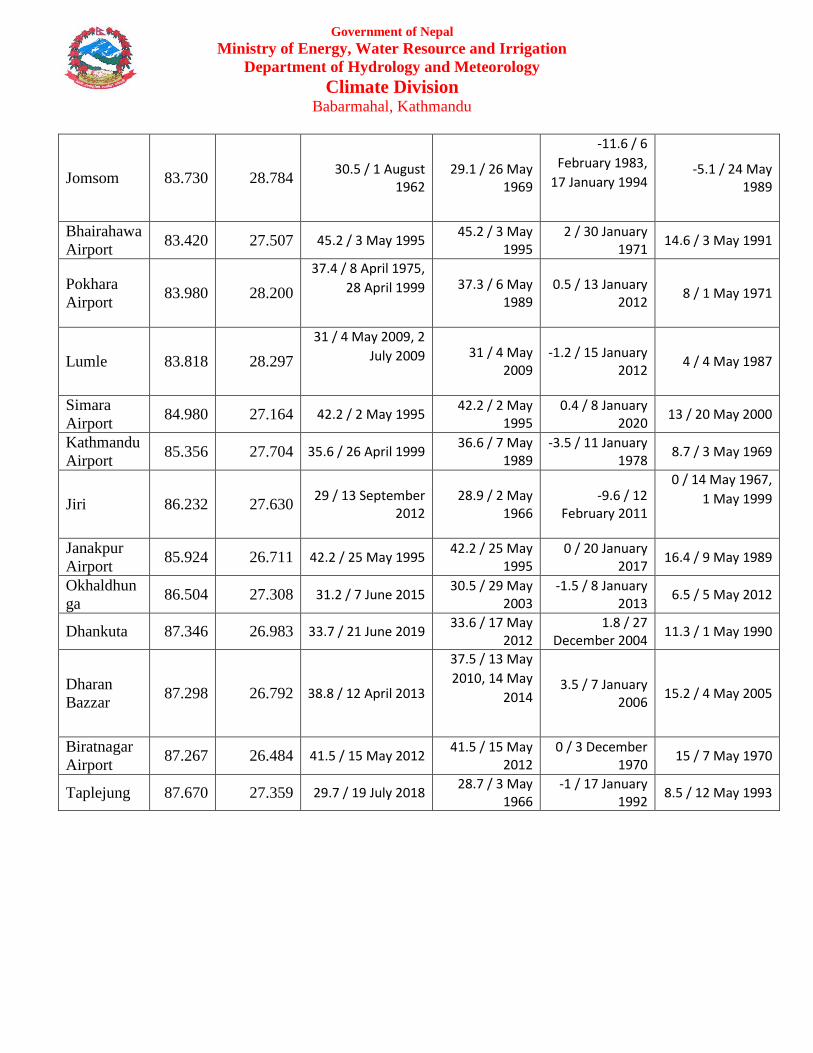
Table 2: Ever recorded annual and monthly highest daily temperature information
Stations Longitude (Deg)
Latitude (Deg)
Ever recorded highest daily maximum temperature information
Ever recorded highest daily minimum temperature information
Annual [value (Deg Celsius/date]
May [value (Deg
Celsius/date]
Annual [value (Deg
Celsius/date]
May [value (Deg Celsius/date]
Dadeldhura 80.588 29.301 37 / 17 May 2010 37 / 17 May
2010 -5 / 25 January
2008 6.9 / 1 May 2004
Dhangadhi 80.560 28.813 46.4 / 16 June 1995 44 / 17 May
2012 0 / 11 January
1985 11.1 / 14 May
2014
Dipayal 80.937 29.262 44.4 / 25 May 2015 45 / 28 May
2012 -0.6 / 13 January
1997 12 / 3 May 1988
Jumla 82.180 29.275 33.3 / 24 May 1998 33.3 / 24 May
1998 -14 / 4 February
2000 -1 / 4 May 1989
Surkhet 81.635 28.588 43.8 / 5 May 2012 43.8 / 5 May
2012 -0.7 / 9 January
2013 12.5 / 4 May 1987
Nepalgunj
Airport 81.668 28.101 45 / 14 June 2012
44.2 / 22 May 2012
0.3 / 9 January 2013
10.5 / 14 May 1999
Ghorahi
(Dang) 82.484 28.037 41 / 14 June 2012
40.3 / 15 May 2004
0 / 9 January 2001
11.2 / 7 May 2010
Government of Nepal
Ministry of Energy, Water Resource and Irrigation
Department of Hydrology and Meteorology
Climate Division Babarmahal, Kathmandu
Jomsom 83.730 28.784 30.5 / 1 August
1962 29.1 / 26 May
1969
-11.6 / 6
February 1983,
17 January 1994
-5.1 / 24 May 1989
Bhairahawa
Airport 83.420 27.507 45.2 / 3 May 1995
45.2 / 3 May 1995
2 / 30 January 1971
14.6 / 3 May 1991
Pokhara
Airport 83.980 28.200
37.4 / 8 April 1975,
28 April 1999
37.3 / 6 May 1989
0.5 / 13 January 2012
8 / 1 May 1971
Lumle 83.818 28.297
31 / 4 May 2009, 2
July 2009
31 / 4 May 2009
-1.2 / 15 January 2012
4 / 4 May 1987
Simara
Airport 84.980 27.164 42.2 / 2 May 1995
42.2 / 2 May 1995
0.4 / 8 January 2020
13 / 20 May 2000
Kathmandu
Airport 85.356 27.704 35.6 / 26 April 1999
36.6 / 7 May 1989
-3.5 / 11 January 1978
8.7 / 3 May 1969
Jiri 86.232 27.630 29 / 13 September
2012 28.9 / 2 May
1966 -9.6 / 12
February 2011
0 / 14 May 1967,
1 May 1999
Janakpur
Airport 85.924 26.711 42.2 / 25 May 1995
42.2 / 25 May 1995
0 / 20 January 2017
16.4 / 9 May 1989
Okhaldhun
ga 86.504 27.308 31.2 / 7 June 2015
30.5 / 29 May 2003
-1.5 / 8 January 2013
6.5 / 5 May 2012
Dhankuta 87.346 26.983 33.7 / 21 June 2019 33.6 / 17 May
2012 1.8 / 27
December 2004 11.3 / 1 May 1990
Dharan
Bazzar 87.298 26.792 38.8 / 12 April 2013
37.5 / 13 May
2010, 14 May
2014
3.5 / 7 January 2006
15.2 / 4 May 2005
Biratnagar
Airport 87.267 26.484 41.5 / 15 May 2012
41.5 / 15 May 2012
0 / 3 December 1970
15 / 7 May 1970
Taplejung 87.670 27.359 29.7 / 19 July 2018 28.7 / 3 May
1966 -1 / 17 January
1992 8.5 / 12 May 1993

Government of Nepal
Ministry of Energy, Water Resource and Irrigation
Department of Hydrology and Meteorology
Climate Division Babarmahal, Kathmandu
Map 1: Distribution of 20 stations used in this report.