extreme environmental loading of fixed o˙shore structures
TRANSCRIPT
Extreme Environmental Loading of Fixed O˙shore Structures: Directional Analysis
24 November 2020
OCG-50-04-14C
Rev Author Reviewer Date C R Gibson M Christou 24 November 2020 B R Gibson M Christou 6 April 2020 A R Gibson M Christou 3 January 2019
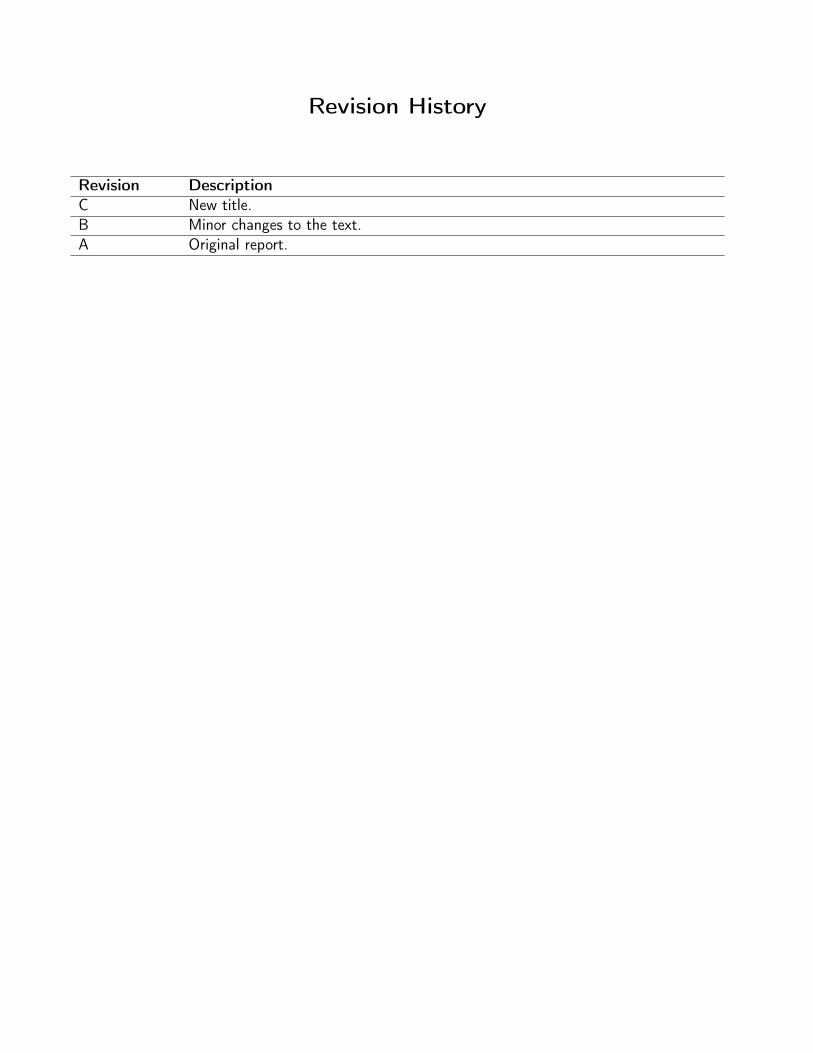
Revision History
Revision Description C New title. B Minor changes to the text. A Original report.

Directional Analysis OCG-50-04-14C
Contents
1 Summary 2
2 Introduction 3
3 Analysis 4
4 Application 6 4.1 Metocean Criteria . . . . . . . . . . . . . . . . . . . . . . . . . . . . . . . . . . . . . . 6 4.2 Structural Reliability Analysis . . . . . . . . . . . . . . . . . . . . . . . . . . . . . . . . 11
References 11
1 of 11

Directional Analysis OCG-50-04-14C
1 Summary
This report forms part of the research study into 10,000 year return period extreme environmental loading.
The overall aim of the study is to develop guidance on the management of the risks to the structural integrity of fxed o˙shore structures exposed to extreme environmental loading. This comprises two complementary objectives:
O1: Review of current prediction methods for, and the provision of recommendations on, the e˙ect of extreme environmental loads on the structural integrity of fxed o˙shore installations.
O2: Development of a risk-based framework for assessing the structural integrity of fxed o˙shore instal-lations.
This report concerns objective O1/D5:
A report on the application of metocean data with respect to direction joint probability, statistical analysis of hindcast metocean data, how it is applied in structural analysis and identifcation of limitations / areas for further development.
In most locations the characteristics and severity of the metocean environment varies with direction. It can be prudent to consider this in the analysis of an o˙shore structure in order to avoid unnecessary over-conservatism. However, there are a number of ways in which this can be included in both the long-term assessment of metocean conditions and in the subsequent analysis - whether that is via deterministic metocean criteria or through a probabilistic structural reliability study.
The report reviews how directionality can be included in a metocean analysis and then subsequently how it can be applied in either a deterministic or probabilistic analysis.
The following recommendations have been made:
1. The long-term extreme value analysis of metocean data should include all relevant covariates which typically include direction. This can be achieved by allowing the parameters of the extreme value distribution to be a function of direction. At present the best approach is through the use of splines as these allow a smooth, continuous, variation in metocean conditions.
2. Directional metocean criteria should be developed using a modifcation of the Norsok N006 (2015) approach: calculate the N × R (where N is the number of directional sectors and R the return period) return period value for each sector and limit the values such that none is larger than the omnidirectional result.
2 of 11

Directional Analysis OCG-50-04-14C
2 Introduction
This report forms part of the research study into 10,000 year return period extreme environmental loading.
The overall aim of the study is to develop guidance on the management of the risks to the structural integrity of fxed o˙shore structures exposed to extreme environmental loading. This comprises two complementary objectives:
O1: Review of current prediction methods for, and the provision of recommendations on, the e˙ect of extreme environmental loads on the structural integrity of fxed o˙shore installations.
O2: Development of a risk-based framework for assessing the structural integrity of fxed o˙shore instal-lations.
This report concerns objective O1/D5:
A report on the application of metocean data with respect to direction joint probability, statistical analysis of hindcast metocean data, how it is applied in structural analysis and identifcation of limitations / areas for further development.
In most locations the characteristics and severity of the metocean environment varies with direction. It can be prudent to consider this in the analysis of an o˙shore structure in order to avoid unnecessary over-conservatism. However, there are a number of ways in which this can be included in both the long-term assessment of metocean conditions and in the subsequent analysis - whether that is via deterministic metocean criteria or through a probabilistic structural reliability study.
The report is organised as follows:
• Section 3 reviews how directionality can be included in an extreme value analysis of metocean data.
• Section 4 reviews how directionality can be included in both deterministic and probabilistic analyses.
The report can be navigated using the bookmarks listed in the left hand panel of the pdf, or using the embedded hyperlinks, which include all section, fgure and table numbers.
3 of 11

Directional Analysis OCG-50-04-14C
3 Analysis
The long-term analysis of metocean data describes the statistical distribution of extreme wave, wind and current conditions. For example, at its simplest this might be used to derive the one hundred year return period signifcant wave height, average wind speed or current speed. Joint extremes, and other sets of conditions, might also be considered, the analysis that is required is often more involved, but the same principles apply.
The aim of a long-term analysis is to defne the probability distribution P (X|σ) where σ represent the model parameters, which may themselves be a function of direction σ = f(θ). As the resistance of a structure may very with direction including this in any assessment will result in a more accurate analysis. Furthermore, Jonathan and Ewans (2007) and Jonathan et al. (2008) have shown that even if this isn’t the case a more accurate statistical model of the long-term environment will be constructed if all relevant covariates are included - these are likely to comprise direction and season. That is, a statistical analysis of metocean extremes that ignores directionality is likely to contain an unknown bias. The reason for this is that the properties of the metocean environment vary with direction due to the type of storms that may arise, their fetch and duration. Hence, trying to describe them all using a single distribution will combine data from di˙erent populations of events.
There are essentially three general ways in which directionality can be included in a long-term analysis; they are described below:
1. Omnidirectional analysis: the approach that has often been applied historically is to ignore direction-ality in the long-term analysis, but then introduce its e˙ect in an approximate manner in a criteria report; hence, σ = α, where α is a constant. As discussed above, this has been shown to result in a bias and inaccurate estimates of extremes.
2. Sectors: the simplest manner in which directionality can be incorporated into the long-term analysis is to split the data into discrete directional sectors (perhaps, but not necessarily, centred on the cardinal directions); hence σ = αn, where αn is a constant for θn0 ≤ θ < θn1. The drawback with this approach is that it assumes that the metocean environment is piecewise constant, whereas, in reality this is unlikely to be the case.
3. Continuous: a more realistic approach is to allow the parameters to vary in a continuous, possibly smooth, manner. There are many ways in which this can be accomplished, however, the two thatP have been described in the metocean literature are: a Fourier series σ = α0 + exp(i nθ)P n αn
(Jonathan and Ewans, 2007); and splines σ = n αnBn, where B is a piecewise polynomial basis function (Randell et al., 2016). The principle di˙erence between these two approaches is that the functions used in the former have global support whereas those in the latter only have local support - which improves the stability and robustness of the ft.
4 of 11

Directional Analysis OCG-50-04-14C
The various methods are compared in fgure 1 which shows estimates of one hundred year return period values by direction. The analysis is of storm peak signifcant wave height for a location in the central North Sea to which the Generalised Pareto distribution has been ft using maximum likelihood. The results show that with a small number of components (that is, sectors, Fourier coeÿcients or spline knots) the Fourier and spline based approaches are similar, but are only able to provide a relatively simple model of the directionality of the metocean environment. However, with a large number of components whilst the spline method is realistic and versatile, the Fourier approach can be unstable1 with unrealistic estimates for some directions from which very few storms arise - this type of result is not atypical of this method. In contrast, the sector based approach is fairly stable and somewhat sensible, but the piecewise nature of the directionality that it imposes is quite obviously physically unrealistic.
The recommendation is to use the spline approach as it is more realistic than a sector based approach, and both more fexible and more stable than the Fourier method.
(a) (b)
Figure 1: Example showing the one hundred year return period value derived from four di˙erent analyses of storm peak signifcant wave height: omnidirectional, sector, Fourier and spline. The directional set of analyses have been completed using either two (top) or fve (bottom) components.
1This can be somewhat improved by using a threshold that varies with direction.
5 of 11
:1i
O Data 14 --Omnidirectional
-~-- Sector -- Fourier
12 - - Spline
10
4
i ----21:~,so~ 50 100 150 200 250
Direction (deg) 300 350
o Data 14 --Omnidirectional
- --- Sector -- Fourier
12 - - Spline
10
50 100 150 200 250 300 350 Direction ( deg)

Directional Analysis OCG-50-04-14C
4 Application
A long-term metocean analysis can be applied in two general ways: through a deterministic design code check that utilises values reported in a metocean criteria report; or a probabilistic structural reliability assessment.
4.1 Metocean Criteria
Metocean criteria reports almost always include directional criteria. This is irrespective of whether the long-term analysis has explicitly included this or not. However, the most appropriate method for calcu-lating deterministic metocean criteria is not entirely clear. The reason for this is that in order to include it within the metocean analysis the details of the structures’ directional response surface would have to be defned, however, traditional metocean analyses are typically generic and separate from any structural analyses. Furthermore, directionality is not explicitly included in the code calibration studies. ISO19901-1 requires the following:
‘...di˙erent wave, wind and/or current magnitudes may be used for di˙erent approach directions ... the owner of the structure shall ensure that the overall reliability of the structure is not compromised by the use of such lower directional environmental conditions.’
Similarly Norsok N006 (2015) states:
‘It should be ensured that the sum of the probability of failure for all directions for structures assessed by use of directional criteria is not larger than what would be obtained by using omnidirectional design values for a structure with the same resistance characteristics regardless of directions. The values of the characteristic waves to be used will be a function of the wave climate and the properties of the structure for the various directions. There is consequently, no general answer to this...’
There are three general approaches that are often applied when developing directional metocean criteria. First these are described and then subsequently assessed.
1. The traditional approach is to scale the directional values such that the most onerous sector equals the omnidirectional value: X(θ) = f(θ)Xomni. If criteria are developed through an omnidirectional analysis then the function f(θ) is often calculated using a high percentile (eg P90) of the empirical distribution: f(θ) = XP 90(θ)Xomni/XP 90(θ
∗), where the ∗ superscript represents the value for the most onerous sector. Whereas, if the long-term analysis includes the directionality then this can be used to determine return period values (eg the one hundred year value RP 100) for di˙erent directional sectors which can then be scaled: f(θ) = XRP 100(θ)Xomni/XRP 100(θ
∗).
2. Forristall et al. (2004) investigated the use of directional metocean criteria and observed that the traditional practice of scaling directional extremes such that the most onerous sector was equal to the omnidirectional value would not necessarily guarantee that the desired level of structural reliability was achieved. The paper notes that one method that would ensure this is to provide directional criteria at return periods of N × R (where N is the number of directional sectors and R the return period), but that this won’t necessarily lead to an eÿcient design or accurate assessment.
6 of 11

Directional Analysis OCG-50-04-14C
This approach leads to some sectors having criteria that are larger than the omnidirectional and some that are smaller.
3. N006 (2015) recommends an approach that is somewhere in-between the traditional scaling approach and the method suggested in Forristall et al. (2004). It suggests calculating the N/2 × R return period value for each sector, but limiting values such that none is larger than the omnidirectional. A slightly more conservative modifcation to this approach is to calculate the N × R return period value for each sector and limit the values such that none is larger than the omnidirectional.
The methods discussed above have been tested for generic structures in generic metocean environments which have been described in terms of three parameters α, β and τ , as shown in table 1. The parameters represent the following: the directional variation in the capacity, R, for a structure with a rectangular failure surface; the scale parameter of the long-term distribution of metocean loading λ; and the direc-tional distribution of the probability of storm occurrence (the proportion of storms from di˙erent sectors). Altogether this can be used to represent a range of generic situations: as β increases the environment becomes more directional (β = 0 represents omnidirectional severity), and as α increases the structure has a more directional response (α = 0 is a perfectly symmetrical structure).
The long-term distribution of metocean loading is assumed to be exponential with scale parameter λ, and hence, the annual probability distribution, P , can be derived as follows:
Fθ(X) = exp [−X/λ(θ)] (1) Pθ(X) = exp (−νp(θ)[1 − Fθ(X)]) (2)Y P (X) = Pθ(X) . (3)
The methods for defning directional metocean criteria have been tested as follows:
1. For each set of conditions, α, and β, a structure is created that has an annual probability of non exceedance P (X < γR) = 0.99 by substituting X = γR(θ) into equation 1 and then varying the free parameter γ. This represents a structure with a one hundred year return period capacity as
1RPact = 1−P .
2. Five methods for specifying directional metocean criteria have been considered: omnidirectional, scaling based on the one hundred year return period load, Forristall et al. (2004), Norsok N006 (2015), and the modifed Norsok method. In each case it is assumed that the structure is orientated such that its largest capacity is aligned with the most onerous metocean conditions.
3. A set of directional criteria is derived using each of the methods and the return period at which ‘failure’ is frst observed is noted. This represents the estimate of the return period of the capacity of the structure RPest. This will in general be di˙erent from the actual capacity of the structure as there will usually be a mismatch between the directionality specifed in the criteria and the directionality of the structural response surface. The ratio r = RPact/RPest defnes the conservatism (or lack of) in the method.
7 of 11

Directional Analysis OCG-50-04-14C
The results are plotted for τ = 1 in fgure 2 and for τ = 3 in fgure 3 on which the four white points represent actual conditions for a selection of BP platforms. The plots indicate the following:
• Omnidirectional criteria are never non-conservative, but often very conservative.
• The traditional scaling approach is rarely conservative and is often very non-conservative with typi-cally r < 0.75. This is also a fnding discussed in Forristall et al. (2004).
• The method suggested in Forristall et al. (2004) is never non-conservative and often very conserva-tive.
• The Norsok approach is often non-conservative, but rarely by very much: typically r > 0.75.
• The modifed Norsok approach is usually conservative, but rarely by very much: typically r < 1.25.
These conclusions are specifc to the assumptions inherent in this analysis: a structure with a rectangular failure surface; a metocean environment which has a severity that is symmetrical about the most onerous direction; and a platform that has its strongest axis aligned with the most severe weather. The results are not particularly sensitive to the frst two assumptions, but they are sensitive to the last assumption: if a platform is orientated such that its weakest axis is aligned with the most severe weather then it will be less eÿcient and will have a greater reliability - that is, there is ‘spare’ capacity in a number of directions.
Overall, in practice both the Norsok and modifed Norsok approaches generally provide a reasonable set of directional metocean conditions that will often more-or-less achieve the requirements specifed in ISO19901-1 and Norsok N006 (2015). The recommendation is to use the modifed approach as it is slightly more conservative. Moreover, in the idealisations considered in this study the original Norsok method is often slightly non-conservative.
Index Direction θ R λ p(θ) 1 2 3 4 5 6 7 8
0 45 90 135 180 225 270 315
1.0 1 − α
2 1 − α 1 − α
2 1.0
1 − α 2
1 − α 1 − α
2
1.0 1 − β
4 1 − β
2 1 − 3β
4 1 − β 1 − 3β
4 1 − β
2 1 − β
4
A A/τ A/τ 2
A/τ 3
A/τ 4
A/τ 3
A/τ 2
A/τ
Table 1: The directional distribution of structural capacity R, environmental loading λ and directionalP probability p(θ) where A is a normalising constant such that p(θ) = 1.
8 of 11

Directional Analysis OCG-50-04-14C
(a) Omnidirectional (b) Scaled
(c) Forristall (d) Norsok
(e) Modifed Norsok
Figure 2: The ratio of the actual return period to the estimated return period, r = RPact/RPest, based on a range of approaches for specifying directional metocean criteria. The results are shown for a range of generic structural, α, and environmental, β, situations as defned in table 1 with τ = 1. The white dots represents four actual structures. The red lines highlight three specifc contours: 0.75 (dashed); 1.0 (solid); and 1.25 (dash-dot).
9 of 11
0.5
0.45
0.3
0.25
0.2
0.15
0.1
0.05
0.35
0.3
0.25
0.2
0.15
0.1
0.05
0.1 0.2 0.3 0.4 0.5 0.6 0.7 0.8 0.9 Environmem /3
0.1 0.2 0.3 0.4 0.5 0.6 0.7 0.8 0.9 Environment (
0.5
0.45
0.4
0.35
0.3
0.25
0.2
0.15
0.1
0.05
0.5
0.45
0.4
0.35
0.3
0.25
0.2
0.15
0.1
0.05
, I ~ U ll M U M ~ U M
Environment, fJ
~ U ll M U M ~ U M Environment /3
... -I •·
' 0.3
3.5
2.5
0.25
0.2
0.15
0.1
0.05 0.5
0.1 0.2 0.3 0.4 0.5 0.6 0. 7 0.8 0.9 Environment ,B

Directional Analysis OCG-50-04-14C
(a) Omnidirectional (b) Scaled
(c) Forristall (d) Norsok
(e) Modifed Norsok
Figure 3: The ratio of the actual return period to the estimated return period, r = RPact/RPest, based on a range of approaches for specifying directional metocean criteria. The results are shown for a range of generic structural, α, and environmental, β, situations as defned in table 1 with τ = 3. The white dots represents four actual structures. The red lines highlight three specifc contours: 0.75 (dashed); 1.0 (solid); and 1.25 (dash-dot).
10 of 11
0.5
0.45
0.4
0.35
0.45
0.4
0.35
0.3
0.25
0.2
0.15
0.1
0.05
0.1 0.2 0.3 0.4 0.5 0.6 0.7 0.8 0.9 Environmem /3
o'--------------------' 0 0.1 0.2 0.3 0.4 0.5 0.6 0.7 0.8 0.9 Environment (
0.45
0.4
0.35
0.3
0.25
0.2
0.15
0.1
0.05
0.5
3.5 0.45
0.4
0.35
0.3
0.25
0.2
0.15
0.1
0.05
0.5
0.45
0.4
0.35
0.3
0.25
0.2
0.15
0.1
0.05
~ U ll M U M ~ U M Environment, fJ
~ U ll M U M ~ U M Environment /3
3.5
2.5
0.5
0.1 0.2 0.3 0.4 0.5 0.6 0. 7 0.8 0.9 Environment ,B

Directional Analysis OCG-50-04-14C
4.2 Structural Reliability Analysis
The diÿculty in specifying deterministic directional metocean conditions in a criteria report do not arise in a structural reliability analysis as in this situation the shape of the failure surface is known. Hence, equations 2 and 3 can be applied directly with X = R(θ).
References
G.Z. Forristall, S.F. Barstow, H.E. Krogstad, M. Prevost, P.H. Taylor, and P.S. Tromans. Wave Crest Sensor Intercomparison Study: An Overview of WACSIS. American Meteorological Society, 2004.
ISO19901-1. Metocean design and operating considerations. Technical report, ISO.
P. Jonathan and K. Ewans. The e˙ect of directionality in extreme wave design criteria. Ocean Engineering, 34:1977–1994, 2007.
P. Jonathan, K. Ewans, and G. Forristall. Statistical estimation of extreme ocean environments: The requirement for modelling directionality and other covariate e˙ects. Ocean Engineering, 35:1211–1225, 2008.
N006. Assessment of structural integrity for existing o˙shore load-bearing structures: Edition 2, 2015.
D. Randell, K. Turnbull, Ewans K., and Jonathan P. Bayesian inference for nonstationary marginal extremes. Environmetrics, 2016.
11 of 11