extra healthy years or just extra years? report of the reason for the mixed story described in...
TRANSCRIPT


2

Abbreviations ……………………………………………………………... 5
1. Introduction ……………………………………………………………... 6
2. Wider context ……………………………………………………………. 8
3. Methodological differences that matter …………………………... 8
3.1 Introduction ………………………………………………………….. 8
3.2 What is the impact of different methodologies? …………………. 10
3.2.1 Case study one: Differences within Northern Ireland …………………… 11
3.2.2 Case study two: Differences within Republic of Ireland ……………….. 12
3.2.3 Case study three: North-South comparisons …………………………….. 13
3.3 Summary ………………………………………………………………. 15
4. What the SLÁN surveys tell us about Republic of Ireland (RoI) … 16
5. What the NIHSWB surveys tell us about Northern Ireland (NI) ….. 19
6. Conclusions ..………………………..……………………………………. 22
6.1 Summary of findings …………………………………………………. 22
6.2 Recommendations …………………………………………………... 22
6.3 Overall conclusions ………………………………………………….. 23
Appendix 1:
List of health questions used in different data sources in RoI …..26
Appendix 2:
List of health questions used in different data sources in NI …...28
3

4

BHPS: British Household Panel Survey
CARDI: Centre for Ageing Research and Development in Ireland
CSO: Central Statistics Office
DFLE: Disability-Free Life Expectancy (DFLE (65))
Partial DFLE: Partial Disability-Free Life Expectancy (DFLE (65-74))
ECHP: European Community Household Panel
EHEMU: European Health Expectancy Monitoring Unit
EUROSTAT: Statistical Office of the European Union
EU-SILC: European Union Survey on Income and Living Conditions
GHS: General Household Survey
HALE: Health Adjusted Life Expectancy
HLE: Healthy Life Expectancy (HLE (65))
HLY: Healthy Life Years
IPH: Institute of Public Health in Ireland
LE: Life Expectancy (LE (65))
Partial HLE: Partial Healthy Life Expectancy (HLE (65-74))
Partial LE: Partial Life Expectancy (LE (65-74))
NI: Northern Ireland
NICHS: Northern Ireland Continuous Household Survey
NIHPS: Northern Ireland Household Panel Survey
NIHS: Northern Ireland Health Survey
NIHSWB: Northern Ireland Health and Social Wellbeing Survey
NISRA: Northern Ireland Statistics and Research Agency
NS-SEC: National Statistics Socio-economic Classification
ONS: Office for National Statistics
RoI: Republic of Ireland
SC: Social Class
SEG: Socio-economic group
SF-36: Short Form Health Survey
SHARE: Survey of Health, Ageing and Retirement in Europe
SLÁN: Survey of Lifestyle, Attitudes and Nutrition 5

As life expectancy continues to rise, the prevalence of chronic conditions is increasing in our society. However, we do not know if the extra years of life gained are being spent with disability and illness, or in good health. Furthermore, it is unclear if all groups in society experience their extra years of life in the same way. This report examines patterns of health expectancies across the island of Ireland, examining any North-South and socio-economic differences as well looking at differences in data sources.
Key facts
IPH conducted this study, with support from the Centre for Ageing Research and Development in Ireland (CARDI), to deepen understanding of increasing life expectancy in Ireland, North and South. Data on mortality and morbidity amongst people aged 65 years or over were examined in order to identify whether or not gains in life expectancy are offset by the prevalence of illness and disability. Specifically, this study:
Reviewed existing data sources, assessed the comparability of national and international data
sources and documented any data limitations
Included an analysis of patterns of health expectancies across the island including an
assessment of socio-economic and North-South differences.
Increasing life expectancy The older population (aged 65 or over) on the island of Ireland is growing and becoming a larger percentage of the total population. Republic of Ireland Census 2011 revealed that 12% of the RoI population was aged 65 or over (CSO, 2012), and Northern Ireland Census 2011 revealed that 13% of the NI population was aged 65 or over (NISRA, 2012). By 2041 the population aged 65 or over is projected to reach 22% in RoI and 24% in NI (McGill, 2010). It is unclear, however, if this increasing longevity will be enjoyed equally by all strata of society.
Increasing prevalence of chronic conditions A series of studies by the Institute of Public Health in Ireland (IPH) found that the number of people living with a chronic condition is expected to increase dramatically by 2020 and that disproportionately more of these people will belong to the older population. Where data was available, IPH also found that people living in more deprived areas of NI and RoI were more likely to have a chronic condition compared with those living in more affluent areas (Balanda et al. 2010, Institute of Public Health, 2012).
6

7
If the relative duration of freedom from illness and disability is increasing (ie the morbidity and
disability curves move to the right) then a “compression of morbidity” is said to be occurring. If the
reverse is happening whereby we are spending relatively more of the remaining years with illness and
disability (ie the morbidity and disability curves move to the left), then an “expansion of morbidity” is
said to be occurring. To make the most of increasing life expectancy, it is better that it is
accompanied by compression of morbidity rather than expansion of morbidity.
Figure 1 below shows a series of three survival curves labelled mortality, morbidity and disability. The
mortality curve represents the effects of mortality on overall survival; the morbidity curve represents
the probability of surviving to a given age free from chronic morbidity; and the disability curve
represents the probability of surviving to a given age free of illness and disability.
The study concentrated on a number of indicators dealing with disability and (self-rated) general health:
Life expectancy (LE) - how long we can expect to live
Disability-free life expectancy (DFLE) - how long we can expect to live without limitations on our daily activities
Relative duration of freedom from disability (%DFLE/LE) - the percentage of remaining years expected to be free of disability
Healthy life expectancy (HLE) - how long we can expect to live in (self-rated) good health
Relative duration of good health (%HLE/LE) - the percentage of remaining years expected to be spent in good health.
Figure 1: Mortality, morbidity and disability survival curves (adapted from The
Aging Population in the Twenty-First Century: Statistics for Health Policy, 1988)
Throughout the EU-27, women tend to live longer than men although men tend to spend a greater
proportion of their shorter lives free of disability. In 2010 Eurostat reported that in the EU-27, the
expected number of healthy life years (the number of years spent without disability) remaining at age
65 was 8.7 years for men and 8.8 years for women. Considerable differences were observed, across
EU-27 member states, with healthy life expectancy ranging from 3.3 years to 14.1 years for men and
from 2.8 years to 15.5 years for women (EHEMU, 2010).
It is interesting to note in recent studies looking at this issue, one example of compression of poor
health can be found in Austria between 1978 and 1998 (Doblhammer & Kytir, 2001). However a
study (with morbidity defined in terms of major diseases such as cancer or diabetes) found little
empirical evidence to support a recent compression of morbidity in the United States between 1998
and 2008 (Crimmins & Beltran-Sanchez, 2010).
3.1 Introduction
Part of the reason for the mixed story described in Section 2 may be the differences in the methodologies used in different studies. To explore this on the island of Ireland, mortality data and population figures were obtained from the Central Statistics Office (CSO) in RoI and the Northern Ireland Statistics and Research Agency (NISRA) in NI. To calculate DFLE and HLE, the prevalence of disability and (self-rated) poor health were incorporated into the life tables used to calculate LE.
We identified several potential sources of disability and (self-rated) general health data; eight in RoI and five in NI.
Table 1 shows that these data sources often tap into different aspects of health and healthcare, or
take different approaches to important methodological issues.
8

How the question is phrased: different aspects of health and healthcare
Some questions (such as those in European Union Survey on Income and Living Conditions (EU-SILC)) ask respondents to compare themselves to some normative group: l “... have you been limited … in activities people usually do, because …” Other questions (such as those in NIHSWB) ask respondents to describe how they would be in a particular situation: “Please note: If you are receiving medication or treatment, please consider what you were like without medication or treatment”
Some questions make no reference to the time; others ask respondents to consider a time period: “over the last 12 months” (NIHSWB) “at least the last 6 months” (EU-SILC) Some questions use quite general descriptions of health status while others are more specific: “any longstanding illness, or disability, infirmity or mental health problem” (EU-SILC) Other questions (such as those in SHARE) ask respondents to rank the “severity” of any limitation: “severely limited, Limited but not severely, Not limited”
How the responses are formatted
The number of response categories included in rating scales varies. How positively or negatively possible responses are expressed also varies.
How the questions are administered
Face-to-face interviews Self-administered postal surveys
How respondents are selected
Some data sources use independent cross-sectional sampling such as SLÁN (Department of Health and Children, 1998, 2002 & 2007) and NIHSWB Survey (Department of Health, Social Services and Public Safety, 1997, 2001, 2005/06). Others are panel surveys such as the Northern Ireland Household Panel Survey (NIHPS) and European Community Household Panel Survey (ECHP). Others use a hybrid approach such as the longitudinal rotating panel design used by the EU-SILC and Northern Ireland Continuous Household Survey (NICHS).
Socio-economic classifications used
Sometimes the occupational coding available in census data, mortality data and health survey data are not the same. For example, in this study a combination of CSO social class (SC) and socio-economic group (SEG) classifications had to be used in RoI. In NI, a slight modification of the three level NS-SEC social class classification was needed.
Socio-economic data is sometimes not available for all the relevant ages. For example; because social class variables were only asked of those aged 16-74 in the NI population census, only partial health expectancies could be used for social class analyses there. Partial expectancies reflect experiences between ages 65-74 only (rather than from age 65 to death) and are more difficult to interpret.
North–South comparisons Data sources from NI and RoI:
Look at different aspects of health or healthcare
Take quite different approaches to a number of important methodological issues listed above.
Table 1: Methodology issues in comparing data sources from NI, RoI and Europe
Often the impact of these methodological differences is exacerbated by changes made in different waves of the one data source. For example, if a question has been phrased differently throughout different waves, this can make true comparisons across waves difficult.
9

10
3.2 What is the impact of different methodologies?
The approach taken to these methodological issues can have significant impact on the findings. For example, in this study, methodological problems in both jurisdictions precluded any assessment of possible social gradients in DFLE and HLE1, and any analysis of any socio-economic differences amongst females.
A series of case studies revealed that some approaches are particularly sensitive to biases with some approaches inflating health expectancy estimates while others deflate them.
This section presents three case studies that deal with:
How the questions are phrased and how the responses are formatted (social desirability biases associated with peoples’ tendencies to view/present themselves as better than average and to avoid extreme responses)
How the questions are administered (non-response bias and social desirability biases) How respondents are selected (attribution bias and selection bias).
1 Assessments of socio-economic differences had to be (tentatively) based on comparisons of amalgamations of the lowest and highest social groupings rather than comparisons of all social groupings

11
3.2.1 Case study one: Differences within Northern Ireland
The NICHS and the NIHPS use very different sampling designs and very different general health questions2.
NIHPS surveys:
Routine follow-up of an original cohort over a long period Please think back over the last 12 months about how your health has been. Compared to people of your own age, would you say that your health has, on the whole, been:
Excellent
Good
Fair
Poor
Very Poor
NICHS surveys: Repeated independent cross-sectional samples Over the last 12 months would you say your health has, on the whole, been:
Good
Fairly good
Not good
The literature suggests (Jürges et al, 2008; WHO, 1996; Idler, 1993) that the estimated prevalence of (self-reported) good health will tend to be larger when:
Measured using questions with 5-point response categories and relatively negative
response wording (NIHPS) than with questions using 3-point response categories and relatively positive response wording (NICHS)
Measured using panels surveys (NIHPS) than with repeated independent cross-sectional samples (NICHS)
Measured with questions requiring normative comparisons (NIHPS) than with questions not
requiring such comparisons
As expected, HLE estimates based on NIHPS (5) are larger than those based on NICHS (3). However, we do not know how much of the difference between NIHPS figures and NICHS figures is caused by these methodological differences and how much is due to the fact the questions tap into different aspects of health.
Figure 2
2 Responses in red were used to define “poor health”

12
SLÁN Surveys4:
Repeated independent cross-sectional samples In general would you say your health is:
Excellent
Very Good
Good
Fair
Poor
EU-SILC Surveys: Routine follow-up of a rotating panel over a long period How is your health in general?
Very Good
Good
Fair
Bad
Very Bad
The literature suggests (Jürges et al, 2008; WHO, 1996) that the estimated prevalence of (self-reported) good health will tend to be larger when:
Measured using questions with relatively negative response wording (EU-SILC) than
using questions with relatively positive response wording (SLÁN )
Measured using rotating panels samples (EU-SILC) than in repeated independent
cross-sectional samples (SLÁN )
Figure 3
As expected, HLE estimates based on EU-SILC are larger than those based on SLÁN. However, we do not know how much of the difference between EU-SILC figures and SLÁN figures is caused by these methodological differences and how much is genuine because the questions tap into different aspects of health.
3.2.2 Case study two: Differences within Republic of Ireland
In a more complicated case study, the SLÁN in RoI and the EU-SILC use slightly different sampling designs and slightly different general health questions3.
3 Responses in red were used to define “poor health”
4 Part of SF-36 (a generic health survey with 36 questions yielding an 8-scale profile of functional health and
wellbeing scores)

13
NIHSWB survey 1997, 2001, 2005 (HLE1 - NIHSWB): Independent cross-sectional samples, face-to-face interviews. Over the last 12 months would you say your health has, on the whole, been:
Good
Fairly good
Not good
NIHSWB survey 1997 (HLE2 - NIHSWB): Cross-sectional sample, face-to-face interviews. In general, would you say your health is:
Excellent
Very Good
Good
Fair
Poor
SLÁN Surveys (RoI) 1998, 2002, 20066:
Independent cross-sectional samples, self-administered postal questionnaire in 1998 & 2002; face-to-face interviews in 2006. In general, would you say your health is:
Excellent
Very Good
Good
Fair
Poor
NIHSWB survey 2005 (HLE3 - NIHSWB): Cross-sectional sample, face-to-face interviews. How is your health in general?
Very Good
Good
Fair
Bad
Very bad
EU-SILC survey (RoI) 2003, 2004, 20057:
Longitudinal rotating panel sample, face-to-face interviews. How is your health in general?
Very Good
Good
Fair
Bad
Very bad
North-South comparison based on SLÁN general health question (1998) and NIHSWB (1997)
The literature suggests (WHO, 1996; Ekholm et al 2009) that the estimated prevalence of (self-reported) good health will tend to be:
Smaller in NI when measured using the HLE-SLÁN question than when using the usual NIHSWB question
(HLE1-NIHSWB) due to different number of categories
Larger when using self-administered postal questionnaire (SLÁN) than when using a face-to-face interview
(NIHSWB)
5 Responses in red were used to define “poor health” 6 Part of SF-36 7 EU harmonised question
3.2.3 Case study three: North-South comparisons
This is the most complicated case study. The usual general health question (called HLE-NIHSWB below) in
the NIHSWB survey (1997, 2001, 2005) was the same as the question used in the NICHS (see case study
one 3.2.1). However, in two different survey years a second health question was added:
In 1997 the NIHSWB included the general health question that was used in all waves of SLÁN in RoI
(called HLE2-NIHSWB or HLE-SLÁN)
In 2005 the NIHSWB included the general health question that was used in all waves of EU-SILC in RoI
(called HLE3-NIHSWB or HLE-EU-SILC)
Therefore 1997 and 2005 provide an opportunity to make North-South comparisons using similar general
health questions5. While both NIHSWB and SLÁN surveys use repeated independent cross-sectional samples
the EU-SILC used rotating panel design. Different methods of administering the questions also confound
these comparisons.

14
Figure 4a RoI SLÁN compared with NIHSWB
A simple North-South comparison based on the usual NIHSWB question in 1997 and the SLÁN question (HLE1-NIHSWB and HLE-SLÁN) in 1998 indicates that the estimated HLE in NI is larger than it is in RoI. However, a North-South comparison based on the same SLÁN question (HLE2-NIHSWB and HLE-SLÁN) shows that the estimated HLE in RoI was larger than it was NI. Of course, we expect less positive responses in face-to-face interviews (NIHSWB) than in self-completed postal questionnaires (SLÁN) (Smith and White, 2009).
The literature suggests (Idler, 1993; Jürges et al, 2008; WHO, 1996) that the estimated prevalence of
(self-reported) good health will tend to be:
Larger in RoI when measured in rotating panel samples (EU-SILC) than when measured in
repeated independent cross-sectional samples (SLÁN)
Larger when using the EU-SILC (or HLE3-NIHSWB) question than using the usual NIHSWB
questions (HLE1-NIHSWB) Figure 4b RoI EU-SILC compared with NIHSWB
North-South comparison based on EU-SILC general health question (2005)

15
3.3 Summary
The case studies revealed that:
Normative references, the time period the question focuses on, and the phrasing of possible responses can either inflate or deflate health expectancy estimates.
The effects of some methodological differences (eg differences between self-administered postal surveys and face-to-face interviews) may be ameliorated by statistical techniques such as post-hoc adjustment for non-response bias and complex survey design. However, these are less effective when data sources being compared differ in a number of ways.
Hybrid survey designs such as longitudinal rotating panel designs appear to address the attrition bias associated with long running panel surveys, and the resulting health expectancy estimates are less likely to be inflated.
Key data sources differ methodologically in ways that are not related to any shared underpinning health definition, policy or intervention target. Using the same name for two measures does not mean they measure the same aspect of health or healthcare. These differences undermine international comparisons, North-South comparisons, assessments of gender differences and socio-economic variation. If significant changes have been made to the waves of the same data source then the assessment of temporal trends is undermined.
It is important to be aware how complex measures such as health expectancies have been derived and not to make comparisons to other measures unless they have been derived in a similar way.
8 We do not know how much of the difference between NIHSWB and SLÁN figures are caused by methodological differences
and how much is due to genuine North-South differences in health expectancies
A simple North-South comparison based on the usual NIHSWB question and the SLÁN question in 2006
indicates that the estimated HLE in NI is larger than it is in RoI (Figure 4a).
A North-South comparison based on the EU-SILC question in 2005 (HLE-EU-SILC or HLE3-NIHSWB)
indicates that estimated HLE in RoI is larger than that in NI in 2005 (Figure 4b).
We expect less positive responses in repeated independent cross-sectional samples (NIHSWB) than in
rotating panel surveys (EU-SILC in RoI) (Smith and White, 2009)8.

Primary analyses for RoI used the Survey of Lifestyle, Attitudes and Nutrition (SLÁN) in 1998, 2002 & 2006. This data source was the only readily available data from which relatively comparable sets of disability prevalence and self-reported health by age, sex and socio-economic groups could be generated for several years.
The surveys, based on repeated independent cross sectional samples, used the following general health and disability questions
9:
In general would you say your health is 10
Excellent Very Good Good Fair Poor
Is your daily activity or work limited by long-term illness, health problem or disability? Yes No Do not have any of the above 11
9 Responses in red were used to define “poor health” 10 Part of SF-36 11 Not a response category in 2006
Figure 5: Health expectancies at age 65 in RoI (1998-2006)
Males Females
16
17
Gender differences in health expectancies (2006)
Unlike most international studies, SLÁN suggests that both males and females in RoI are expected to
live slightly longer without disability than they are expected to live in (self-rated) good health. For all
health expectancies at age 65, females enjoy a significant advantage over males of about 20% in 2006.
There was no evidence the female advantage had changed between 1998 and 2006. In 2006, males
and females aged 65 years could expect to spend similar percentages of their remaining years with
disability and similar percentages of their remaining years in (self-rated) poor health.
Compression / expansion of morbidity amongst males aged 65 years (1998 – 2006)
Among males in RoI, LE at age 65 years increased by about 3 years during the period 1998 – 2006.
Other health expectancies increased by about 2.5 years. The absolute number of years spent with
disability or spent in poor health was unchanged between 1998 and 2006. Because LE was increasing,
SLÁN suggests there was a small decrease in the relative duration of disability (from 32.1% to 26.9%)
and a small decrease in the relative duration of poor health (from 37.1% to 30.9%). Amongst males,
there was a small compression of disability and poor health in older age.
Compression / expansion of morbidity amongst females aged 65 years (1998 – 2006)
Amongst females in RoI, at age 65 years LE increased by about 2.5 years during the period 1998-2006
(slightly less than males). DFLE and HLE increased by about 3 years and slightly more quickly than LE.
The absolute number of years spent with disability or spent in poor health slightly decreased between
1998 and 2006. Consequently, SLÁN suggests there was a decrease in the relative duration of disability
(from 33.6% to 25.6%) and a decrease in the relative duration of poor health (from 38.8% to 31.1%).
Amongst females, there was a small compression of disability and poor health in older ages.

18
(Tentative) findings about socio-economic differences amongst males aged 65 years from SLÁN surveys in RoI (1998, 2002 and 2006)
12
Socio-economic inequalities in health expectancies (2006)
Compared to those in the highest Socio-economic group (SEG), RoI males aged 65 years in the lowest SEG can expect to live 20% fewer years free of disability and 28% less in (self-rated) good health.
Trends in socio-economic inequalities (1998-2006)
Comparing 1998 and 2006, amongst males aged 65 years in RoI the SEG gap in LE and DFLE appear to have increased while the SEG gap in HLE appears to have decreased.
Socio-economic group differences in compression /expansion (2006 vs 1998)
Comparing 1998 and 2006, males aged 65 years in RoI appear to have experienced an expansion of disability in the highest SEG, a compression in the middle SEG, and little change in the relative duration of disability in the lowest SEG.
Comparing 1998 and 2006, males aged 65 years in RoI appear to have experienced an expansion of poor health in the highest SEG and little change in the relative duration of poor health in the middle SEG and lowest SEG.
Commentary
In 2006 the words “or work” were deleted from the disability question “is your daily activity or work limited by long-term illness, health problem or disability” used in the previous two waves of SLÁN although it is not expected to affect the findings significantly.
Often there were no clear gradients in time plots – the 1998 and 2002 surveys were self-administered postal surveys while the 2006 survey comprised face-to-face interviews, and this may have affected the time plots in DFLE and HLE.
12 Extreme caution is needed when interpreting socio-economic findings as socio-economic data are problematic; particularly
when interpreting trends. Often there was no clear gradient in time plots and particular care is required when interpreting trends in socio-economic inequalities
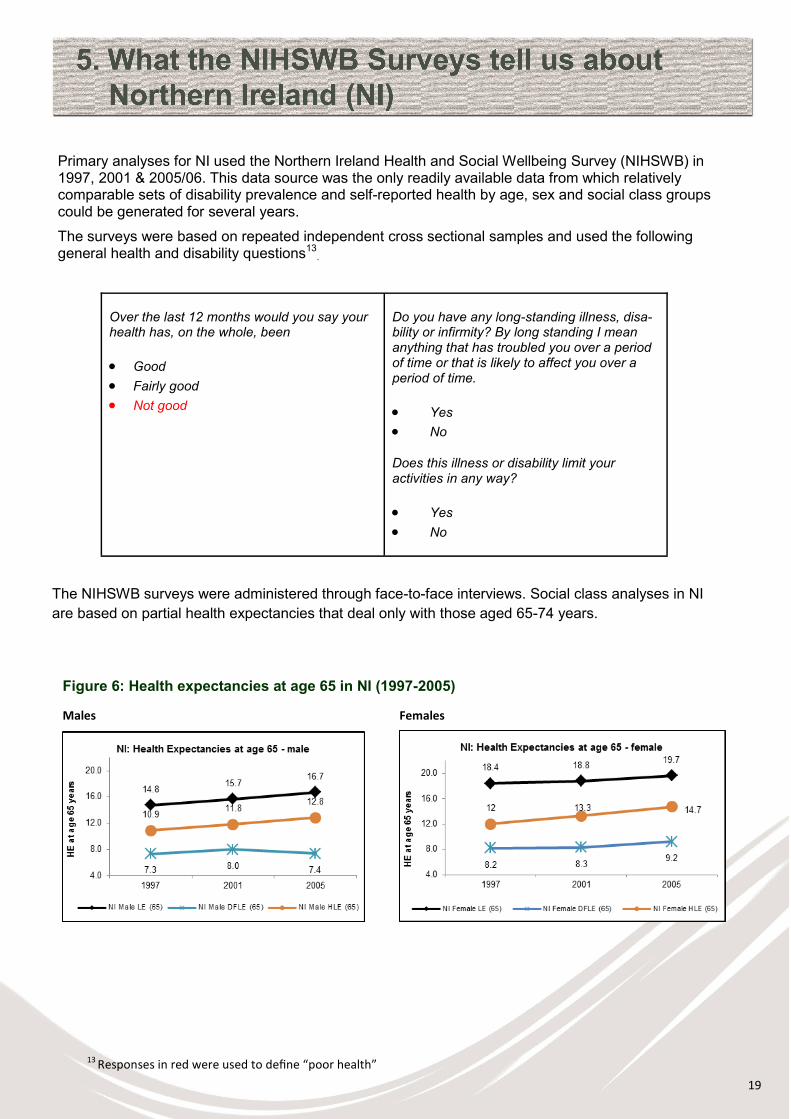
Primary analyses for NI used the Northern Ireland Health and Social Wellbeing Survey (NIHSWB) in 1997, 2001 & 2005/06. This data source was the only readily available data from which relatively comparable sets of disability prevalence and self-reported health by age, sex and social class groups could be generated for several years.
The surveys were based on repeated independent cross sectional samples and used the following general health and disability questions13
.
The NIHSWB surveys were administered through face-to-face interviews. Social class analyses in NI
are based on partial health expectancies that deal only with those aged 65-74 years.
Over the last 12 months would you say your health has, on the whole, been
Good
Fairly good
Not good
Do you have any long-standing illness, disa-bility or infirmity? By long standing I mean anything that has troubled you over a period of time or that is likely to affect you over a period of time.
Yes
No
Does this illness or disability limit your activities in any way?
Yes
No
Figure 6: Health expectancies at age 65 in NI (1997-2005)
Males Females
13 Responses in red were used to define “poor health”
19

20
Gender differences in health expectancies (2006)
The NIHSWB suggests that both males and females in NI are expected to live considerably longer in
(self-rated) good health than they are expected to live without disability. The opposite was observed
with the SLÁN in RoI.
For all health expectancies at age 65, females enjoy a significant advantage over males (approximately 25% for DFLE and approximately 15% for LE and HLE) in 200514. In 2005, males and females aged 65 years could expect to spend similar percentages of their remaining
years with disability and similar percentages of their remaining years with poor health.
Compression / expansion of morbidity amongst males aged 65 years (1997 – 2005)
Amongst males in NI, there was an expansion of disability and a (slight) compression of poor health in
older ages during the period 1997 - 2005. The NIHSWB suggests there was an increase in the relative
duration of disability (from 50.3% to 56.0%) and a slight decrease (from 26.1% to 23.3%) in the relative
duration of poor health among males. LE increased by about 3 years, HLE increased by about 2 years
and DFLE had shown little change. The absolute number of years spent with disability increased and
the absolute number of years spent in poor health was unchanged.
Compression / expansion of morbidity amongst females aged 65 years (1997 – 2005)
Among females in NI there was little change in the relative duration of freedom from disability and a
compression of self-rated poor health during the period 1997 - 2005. The NIHSWB suggests there was
a slight decrease in the relative duration of disability (from 55.5% to 53.2%) and a decrease in the
relative duration of poor health (from 34.9% to 25.2%) among females. LE at age 65 years increased by
about 1.5 years, HLE had increased by about 2.5 years and DFLE had increased by about 1 year. The
absolute number of years spent with disability was unchanged and the absolute number of years spent
in poor health decreased.
14 Unlike the SLÁN in RoI, there was some small evidence that these female advantages had decreased for LE and HLE, but
increased for DFLE, between 1997 and 2005.
(Tentative) findings about social class differences amongst males
aged 65 years from NIHSWB surveys in NI15
Social class inequalities in health expectancies (2005)
Compared to those in the highest social class, NI males aged 65 years in the lowest social class can expect to live 34% fewer years aged 65-74 free of disability and 24% fewer in (self-rated) good health.
Trends in socio-economic inequalities (1997 - 2005 )
Comparing 1997 and 2005 amongst males in NI the social class gap in partial LE (65-74 years) appears to have decreased; the social class gap in partial HLE (65-74 years) appears to have decreased slightly while the social class gap in partial DFLE (65-74 years) appears to have increased.
Social class differences in compression / expansion of morbidity (2005 vs 1997)
Comparing 1997 and 2005 amongst males in NI there appears to have been an expansion of disability between ages 65-74 in all social classes.
Comparing 1997 and 2005; amongst males in NI there appears to have been little change in the relative duration of poor health between ages 65-74 in the highest and lowest social classes, and a compression of poor health between ages 65-74 in the middle social class.
21
Are UK comparisons based on NICHS valid?
Because there are only relatively small differences in the disability questions in the NIHSWB and NICHS the values of DFLE reported here are similar to those reported by the Office of National Statistics (ONS). Consequently, values of and recent changes in %DFLE/LE are similar.
The story about HLE is more complex because, after 2005, the NICHS in NI and the equivalent GHS in England used a 3-point and a 5-point general health question. The NIHSWB used the 3-point general health question which gives lower poor health rates and higher HLE values than the 5-point question. As a consequence:
Findings reported here from NIHSWB are broadly similar to those based on the 3-point question
used in NICHS
Findings reported here from NIHSWB are not comparable to those based on the 5-point question
used in NICHS
Findings reported here from NIHSWB are consistent with findings for 2005-07 and 2008-10 that were published recently by ONS (although ONS compared 5-point questions used in NICHS and the NIHS) (ONS, 2012).
Commentary
In 1997 and 2005 the illness and activity limitation questions were sequenced. In 2001, however, the activities limitations question in the NIHSWB survey was asked independently of the illness question. In addition, the 2001 activities limitation question includes the clause “substantially limits” and asked respondents on medication to compare themselves to when they were not taking medication. These changes tended to produce lower estimates of DFLE in 2001 compared to 1997 and 2005.
Social class analyses in NI are based on partial health expectancies that deal only with those aged 65-74 years. This is because social class data in the NI population census is only collected among those aged under 75 years16.
15 Socio-economic gaps are represented by ((partial) DFLE in lowest SC / (partial) DFLE in highest SC) and ((partial) HLEin lowest SC / (partial) HLE in highest SC). Large ratio corresponds to a small socio-economic difference; a small ratio a large socio-economic difference. An increasing ratio represents a decrease in the socio-economic difference, a decreasing ratio an increase in the socio-economic difference. There may be a further socio-economic deficit in LE but this is not included in this calculation
16 In this study, both were used to identify those with a disability.

6.1 Summary of findings
The current national sources of health data are inadequate for monitoring trends and
socio-economic patterns in LE, DFLE and HLE.
Investigations into socio-economic inequalities in the health of the older population, North and
South, are particularly hampered by significant data limitations, especially among females and
people not in employment.
Any conclusions about North-South differences in DFLE and HLE based on current data sources
are very tentative.
Inequalities in mortality reported in earlier IPH studies (Balanda & Wilde, 2001) are reflected in
inequalities in DFLE and HLE. Despite important data limitations, socio-economic inequalities in
DFLE and HLE appear to be greater than socio-economic inequalities in LE. Because of
limitations in current data sources in both NI and RoI any broader conclusions about the
socio-economic gap in LE, DFLE and HLE and socio-economic patterns in recent changes in the
relative duration of freedom from disability and good health are not possible.
6.2 Recommendations
A number of data and research recommendations would support stronger examinations of life
expectancy and morbidity in the future.
1. Relevant information standards should be urgently developed and implemented to address data
inadequacies. Greater harmonisation through alignment with survey instruments such as the
EU-SILC and the European Health Interview Survey in both jurisdictions will strengthen North-
South comparability.
2. Further analysis of existing national and international data sources is required to better understand
the inconsistencies and clarify these findings.
3. Greater use of data linkage studies and longitudinal studies (with their associated micro-simulation
methods for calculating health expectancies) are needed to help us better understand changes in
life expectancy and other health expectancies.
22

23
Notwithstanding the data limitations, the following recommendations would help facilitate more
responsive policy and practice:
1. The use of LE in policy debates and service planning should be augmented by the use of DFLE
and HLE to reflect broader life course influences and quality of life in later years.
2. Because different disability and (self-rated) general health measures lead to different findings,
greater discussion is needed to identify the different measures that are relevant to different policy
and service areas. In this regard, it would be useful to:
Clarify the role of different health expectancies, and the data that they require, that tap into
different aspects of health and healthcare, and ensure they are fit for current policy and
practice.
Develop more specific health expectancies such as those associated with particular clinical
conditions (such as Dementia free LE) or utilisation of particular services.
6.3 Overall conclusions
With an ageing population across the island of Ireland, it is important to understand the impact of
chronic conditions as well as physical and mental health problems on our health as we grow older. It is
a great success story that life expectancy is increasing, but measures such as DFLE and HLE must
also be brought into the policy debate in order to reflect broader life course influences and quality of life
in later years. Greater harmonisation of the approach to data gathering methodology will lead to more
reliable data on health inequalities, enabling a more targeted approach to healthy ageing.

Balanda K.P., Barron S., Fahy L. Making Chronic Conditions Count (2010). Available from: http://chronicconditions.thehealthwell.info/. Last accessed 13 Aug 2012 Balanda K.P., Wilde, J. Inequalities in mortality (2001) Central Statistics Office, European Union Survey on Income and Living Conditions (2005) Central Statistics Office, Profile 2 Older and Younger (2012). Available from: http://www.cso.ie/en/media/csoie/census/documents/census2011profile2/Profile2_Older_and_Younger_Entire_Document.pdf. Last accessed 15 Aug 2012. Crimmins E., Beltran-Sanchez, H. Mortality and morbidity trends: Is there compression of Morbidity? (2010) Department of Health and Children, Survey of Lifestyle, Attitudes and Nutrition in Ireland (1997) Department of Health and Children, Survey of Lifestyle, Attitudes and Nutrition in Ireland (2002) Department of Health and Children, Survey of Lifestyle, Attitudes and Nutrition in Ireland (2007) Department of Health, Social Services and Public Safety, Northern Ireland Health and Social Wellbeing Survey (1997) Department of Health, Social Services and Public Safety, Northern Ireland Health and Social Wellbeing Survey (2001) Department of Health, Social Services and Public Safety, Northern Ireland Health and Social Wellbeing Survey (2005/06) Doblhammer G., Kytir J. Compression or expansion of morbidity? Trends in healthy-life expectancy in the elderly Austrian population between 1978 and 1998 (2001) Ekholm O., Brønnum-Hansen H. Cross-national comparisons of non-harmonized indicators may lead to more confusion than clarification (2009) European Commission, Survey of Health, Ageing and Retirement in Europe (2008) European Health Expectancy Monitoring Unit, Trends in Disability-free Life Expectancy at age 65 in the European Union 1995-2001: a comparison of 13 EU countries (2009) European Health Expectancy Monitoring Unit, EHEMU Country Reports, Issue 3: European Health Expectancy Monitoring Unit (2010) Eurostat, European Community Household Panel Survey, (1994-2001) Eurostat, Structural indicators on health, Healthy life years statistics (2009) Idler E.L. Age differences in self-assessments of health: age changes, cohort differences, or survivor-ship? (1993)
24

25
Institute of Public Health in Ireland. Chronic Airflow Obstruction Briefing. Dublin: Institute of Public Health; 2012 Institute of Public Health in Ireland. Coronary Heart Disease Briefing. Dublin: Institute of Public Health; 2012 Institute of Public Health in Ireland. Diabetes Briefing. Dublin: Institute of Public Health; 2012 Institute of Public Health in Ireland. Hypertension Briefing. Dublin: Institute of Public Health; 2012 Institute of Public Health in Ireland. Musculoskeletal Conditions Briefing. Dublin: Institute of Public Health; 2012 Institute of Public Health in Ireland. Stroke Briefing. Dublin: Institute of Public Health; 2012 Jürges H., Avendano M., Mackenbach J.P. Are different measures of self-rated health comparable? An assessment in five European countries (2008) McGill, P. Illustrating Ageing in Ireland North and South: Key Facts and Figures Belfast: Centre for Ageing Research and Development in Ireland (2010) Northern Ireland Statistics and Research Agency, Continuous Household Survey (2007) Northern Ireland Statistics and Research Agency, Northern Ireland Household Panel Survey (2001) Northern Ireland Statistics and Research Agency, Northern Ireland Household Panel Survey (2005) Northern Ireland Statistics and Research Agency, Northern Ireland Household Panel Survey (2007) Northern Ireland Statistics and Research Agency. First Release: Census 2011 - Population and Household Estimates for Northern Ireland (2012). Available from: http://www.nisra.gov.uk/Census/2011_results_population.html. Last accessed 15 Aug 2012. Office for National Statistics. Health Expectancies at birth and at age 65 in the United Kingdom, 2008–2010 (2012). Available from: http://www.ons.gov.uk/ons/dcp171778_277684.pdf. Last accessed 14 November 2012 Panel on Statistics for an Aging Population, Committee on National Statistics, National Research Council. The Aging Population in the Twenty-First Century: Statistics for Health Policy, pp 98 (1988) Smith, M., and White, C. “An investigation into the impact of question change on estimates of General Health Status and Healthy Life Expectancy” Health Statistics Quarterly 41, pp 28-41 (2009)

Source Year Disability questions Self-rated health questions
Northern Ireland
Household Panel
(NIHPS)
2001 – 2008
Can I check, do you consider yourself
a disabled person?
1. Yes 2. No
Does your health in any way limit your
daily activities compared to most
people of your age?
1. Yes 2. No
Does your health limit the type of work
or the amount of work you can do?
(Include both paid and unpaid work)
Does your health keep you from doing
some types of work?
Please think back over the last 12
months about how your health has
been. Compared to people of your own
age, would you say that your health has,
on the whole, been:
1. Excellent
2. Good
3. Fair
4. Poor
5. Or Very Poor?
6. Don’t know
Northern Ireland
Health and Social
Wellbeing Survey
(NIHSWB)
1997
Do you have any long-standing
illness, disability or infirmity? By long
standing I mean anything that has
troubled you over a period of time or
that is likely to affect you over a
period of time.
Does this illness or disability limit your
activities in any way?
Over the last 12 months would you say
your health has, on the whole, been:
1. Good
2. Fairly good 3. Not good
Part of SF-36:
In general, would you say your health is:
1. Excellent
2. Very good
3. Good
4. Fair
5. Poor
26

27
Source Year Disability questions Self-rated health questions
Northern Ireland
Health and Social
Wellbeing Survey
(NIHSWB)
2001
Do you have any long-standing
illness, disability or infirmity? By
long standing I mean anything that
has troubled you over a period of
time or that is likely to affect you
over a period of time.
Do you have any health problem or
disability that substantially limits
your ability to carry out day-to-day
activities? (Please note: If you are
receiving medication or treatment,
please consider what it would be
like without the medication or
treatment?)
Over the last 12 months would you say
your health has, on the whole, been:
1. Good
2. Fairly good
3. Not good
Northern Ireland
Health and Social
Wellbeing Survey
(NIHSWB)
2005
Do you have any long-standing
illness, disability or infirmity? By
long standing I mean anything that
has troubled you over a period of
time or that is likely to affect you
over a period of time.
Does this illness or disability limit
your activities in any way?
Over the last 12 months would you say
your health has, on the whole, been:
1. Good 2. Fairly good 3. Not good
How is your health in general? Would
you say it was:
1. Very good 2. Good 3. Fair 4. Bad 5. Very bad
Northern Ireland
Continuous
Household Survey
(NICHS)
1984 - 2009 Do you have any long-standing
illness, disability or infirmity? By
long standing I mean anything that
has troubled you over a period of
time or that is likely to affect you
over a period of time.
Does this illness or disability limit
your activities in any way?
Over the last 12 months would you say
your health has, on the whole, been:
1. Good
2. Fairly good
3. Not good

28
Source Year Disability questions Self-rated health questions
Survey of Life-
styles, Attitudes,
and Nutrition
(SLÁN)
1998
2002
Is your daily activity or work limited by
long-term illness, health problem or
disability:
1. Yes
2. No
3. Do not have any of the above
In general would you say your health is:
1. Excellent 2. Very Good 3. Good 4. Fair 5. Poor
Survey of Life-
styles, Attitudes,
and Nutrition
(SLÁN)
2006 Is your daily activity limited by long-term
illness, health problem or disability:
1. Yes
2. No
3. Do not have any of the above
In general would you say your health is:
1. Excellent 2. Very Good 3. Good 4. Fair 5. Poor
EU Survey of
Income and Living
Conditions (EU-
SILC)
2003 -
2008
For at least the last 6 months have you
been limited in activities people usually
do, because of a health problem? (If
limited, specify whether strongly limited
or limited).
1. Yes, strongly limited.
2. Yes, limited.
3. Not limited.
How is your health in general?
1. Very good 2. Good 3. Fair 4. Bad 5. Very bad

29

30