extend your toolbox with r
TRANSCRIPT
Extend your toolbox with
Szymon Skorupinski
CERN IT Lightning Talks Session
2nd October 2015
R
R is...
• Open source version of S ;)
• Programming language
• Computing environment
• Designed especially for data
• analysis
• manipulation
• visualization
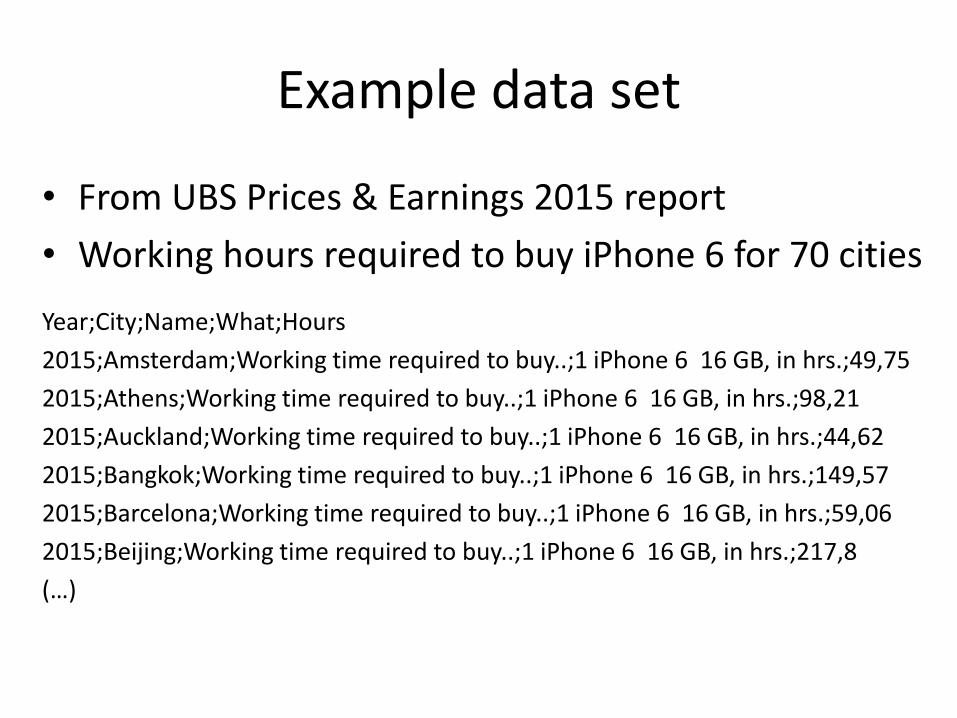
Example data set
• From UBS Prices & Earnings 2015 report
• Working hours required to buy iPhone 6 for 70 cities
Year;City;Name;What;Hours
2015;Amsterdam;Working time required to buy..;1 iPhone 6 16 GB, in hrs.;49,75
2015;Athens;Working time required to buy..;1 iPhone 6 16 GB, in hrs.;98,21
2015;Auckland;Working time required to buy..;1 iPhone 6 16 GB, in hrs.;44,62
2015;Bangkok;Working time required to buy..;1 iPhone 6 16 GB, in hrs.;149,57
2015;Barcelona;Working time required to buy..;1 iPhone 6 16 GB, in hrs.;59,06
2015;Beijing;Working time required to buy..;1 iPhone 6 16 GB, in hrs.;217,8
(…)
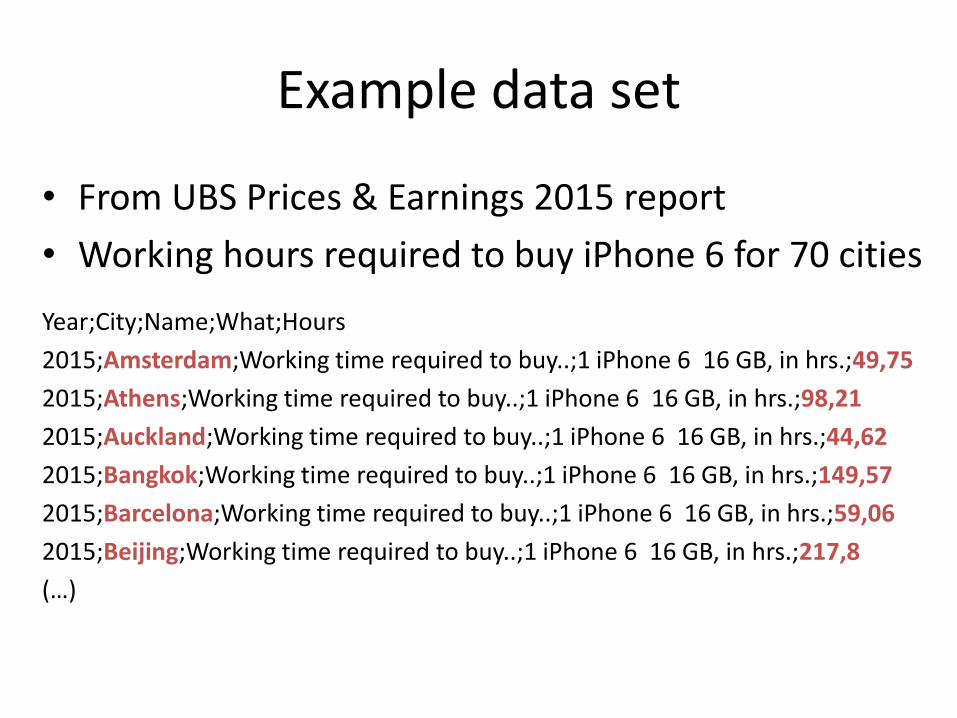
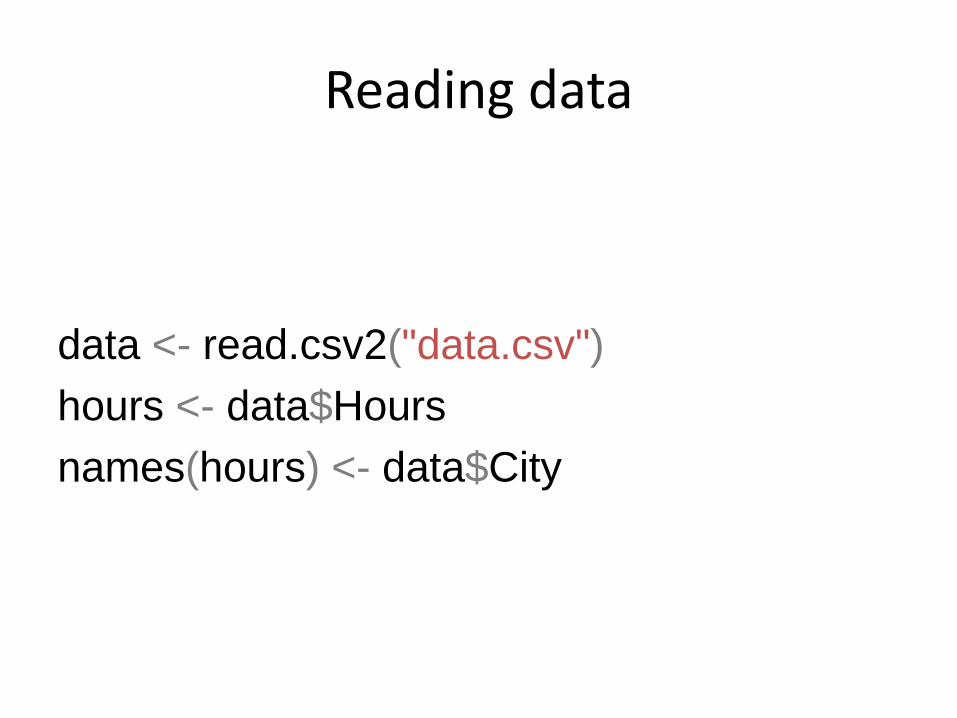
Reading data
data <- read.csv2("data.csv")
hours <- data$Hours
names(hours) <- data$City
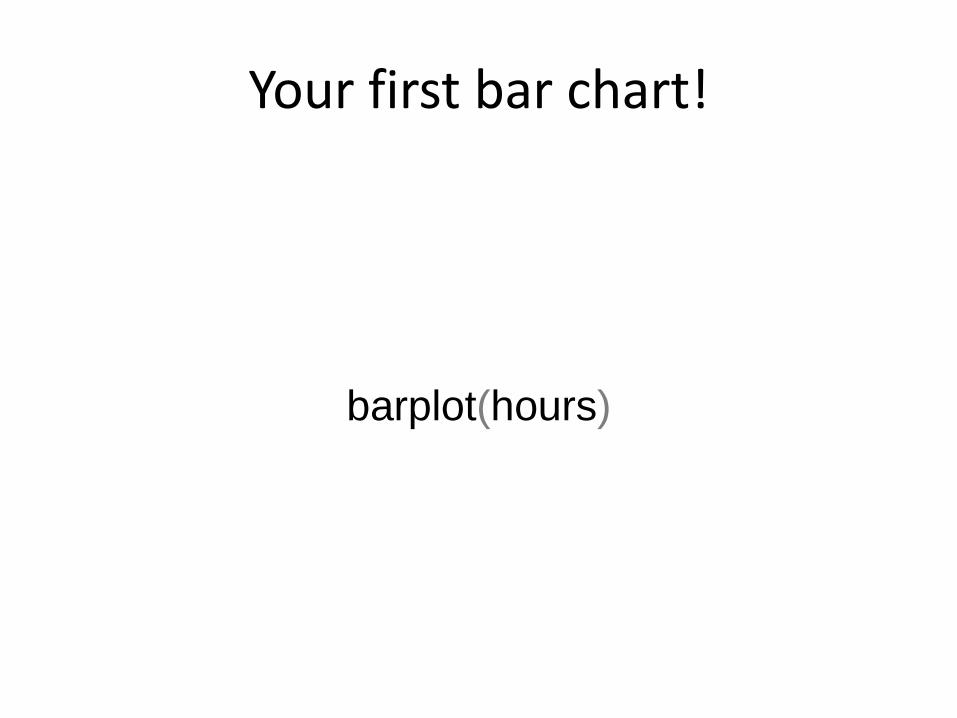
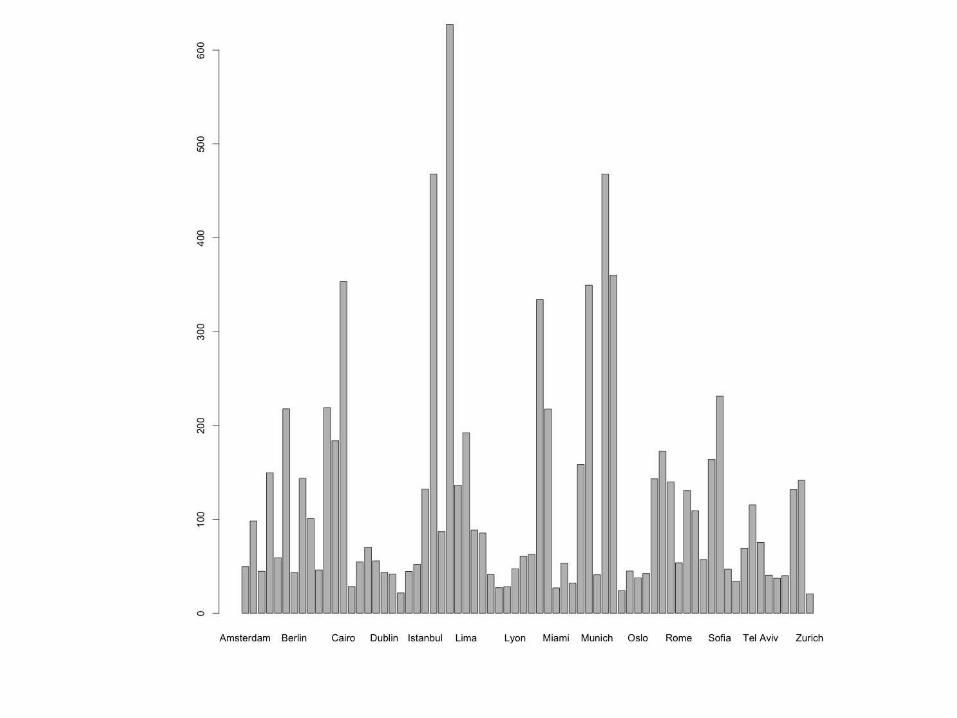
Your first bar chart!
barplot(hours)
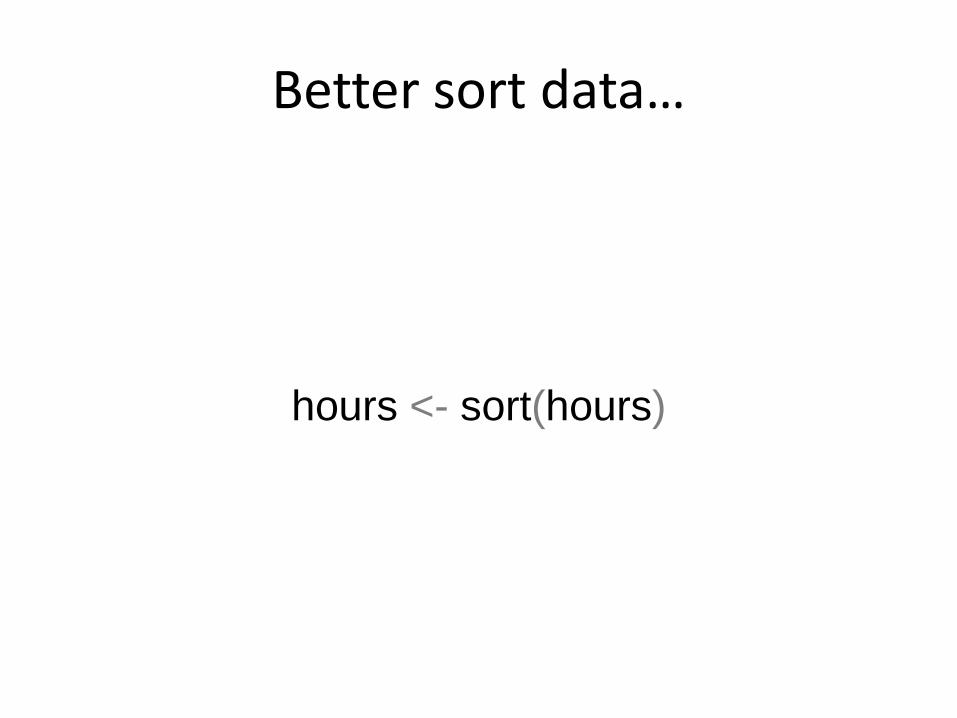
Better sort data…
hours <- sort(hours)
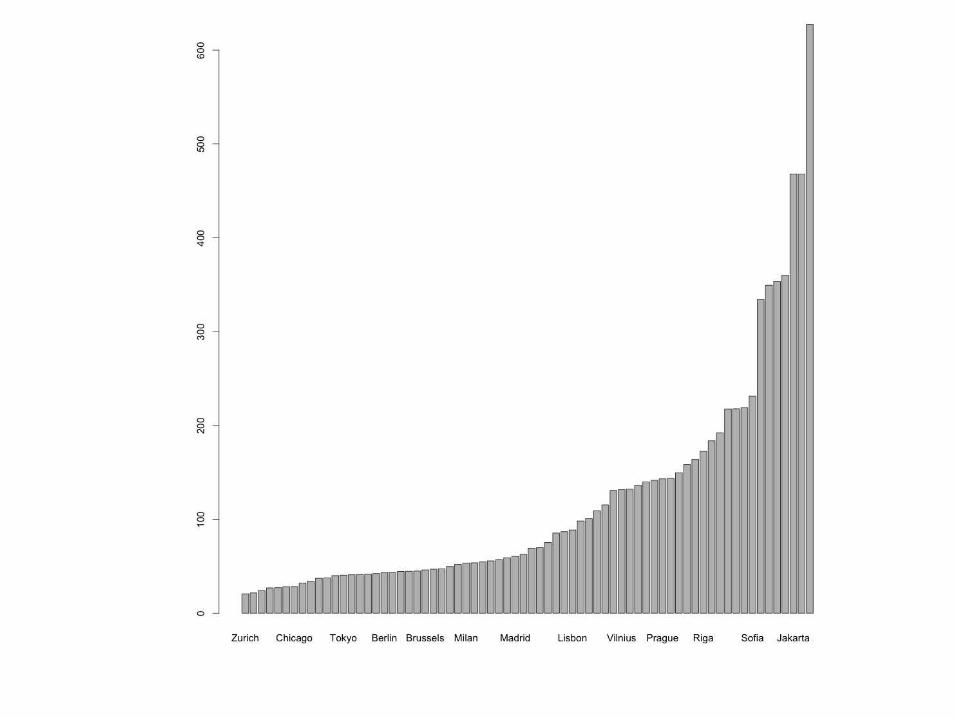
…and plot it again…
barplot(hours)
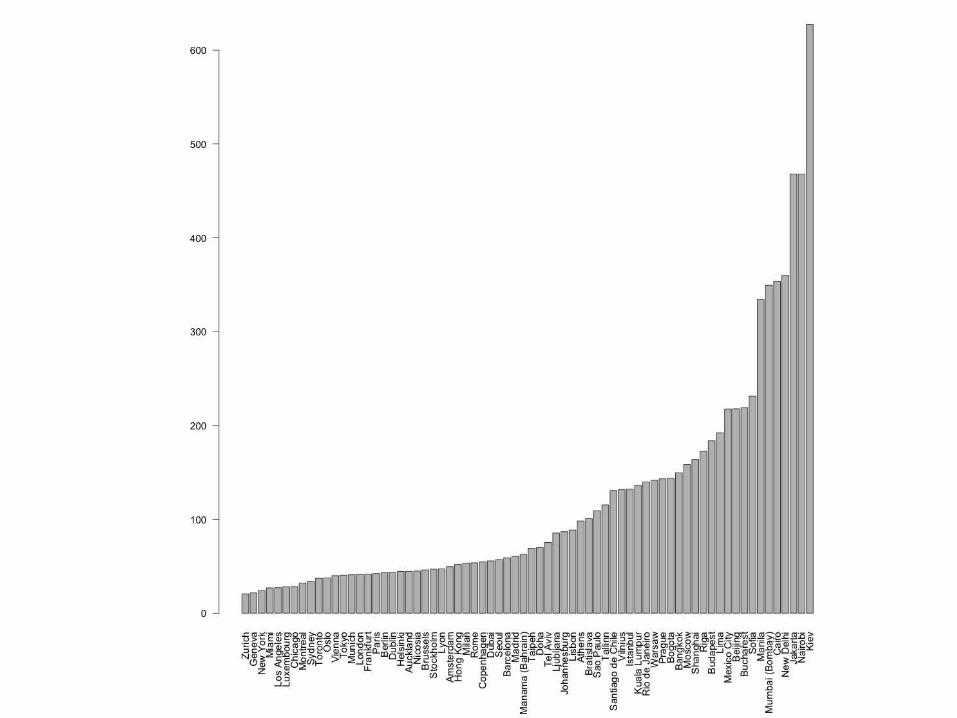
…with better x-axis labels…
barplot(
hours,
las = 2)
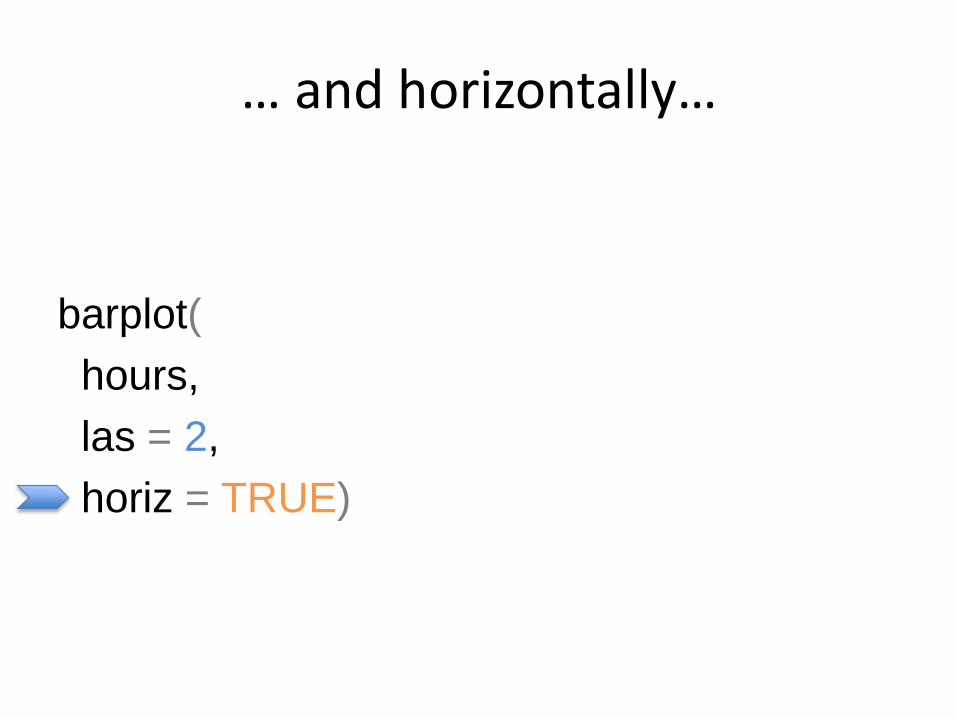
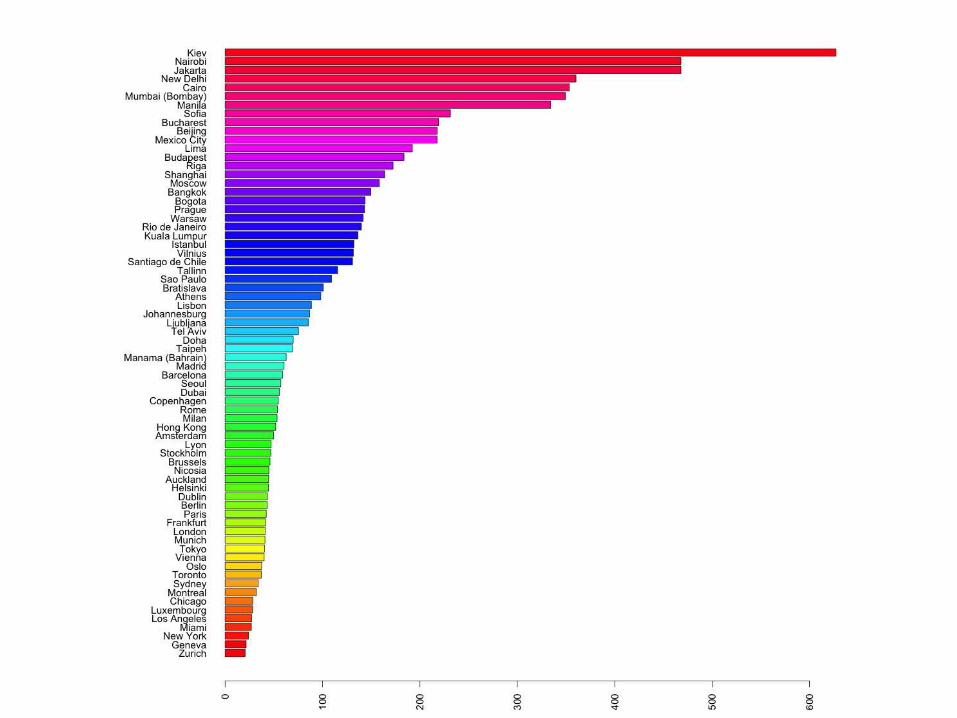
… and horizontally…
barplot(
hours,
las = 2,
horiz = TRUE)


…plus with colors…
barplot(
hours,
las = 2,
horiz = TRUE,
col = rainbow(length(hours)))
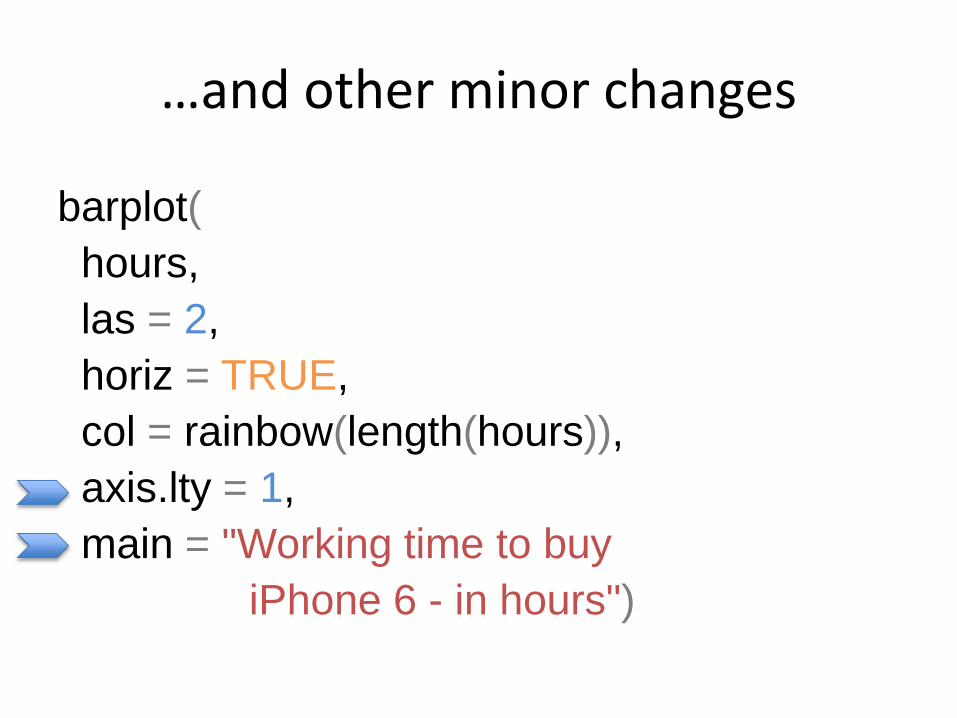
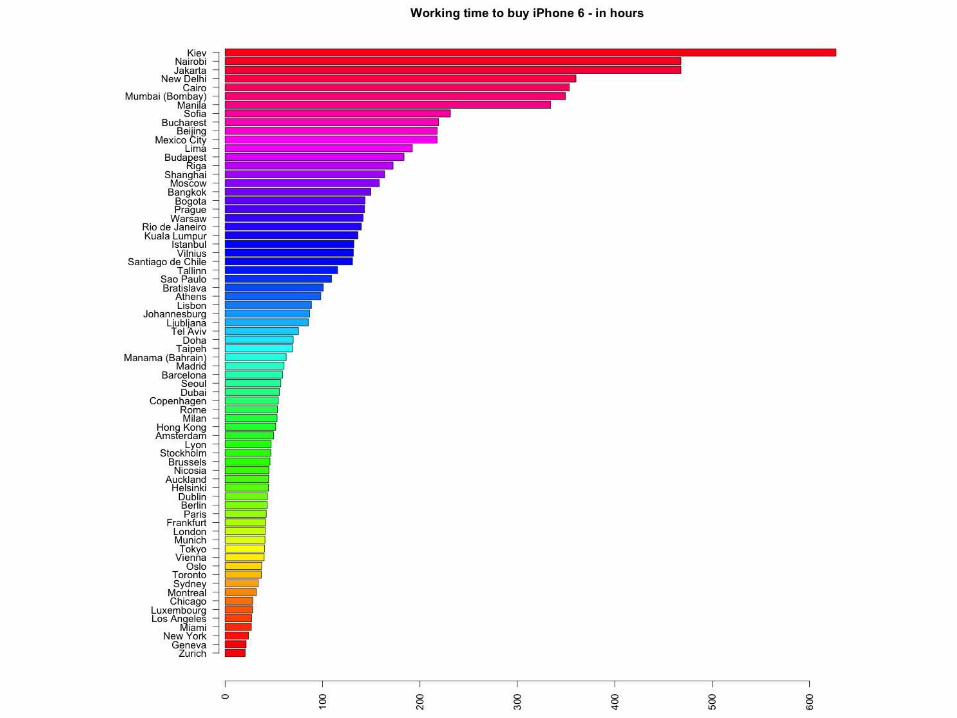
…and other minor changes
barplot(
hours,
las = 2,
horiz = TRUE,
col = rainbow(length(hours)),
axis.lty = 1,
main = "Working time to buy
iPhone 6 - in hours")
Visualize median
abline(
v = median(hours),
lwd = 3)

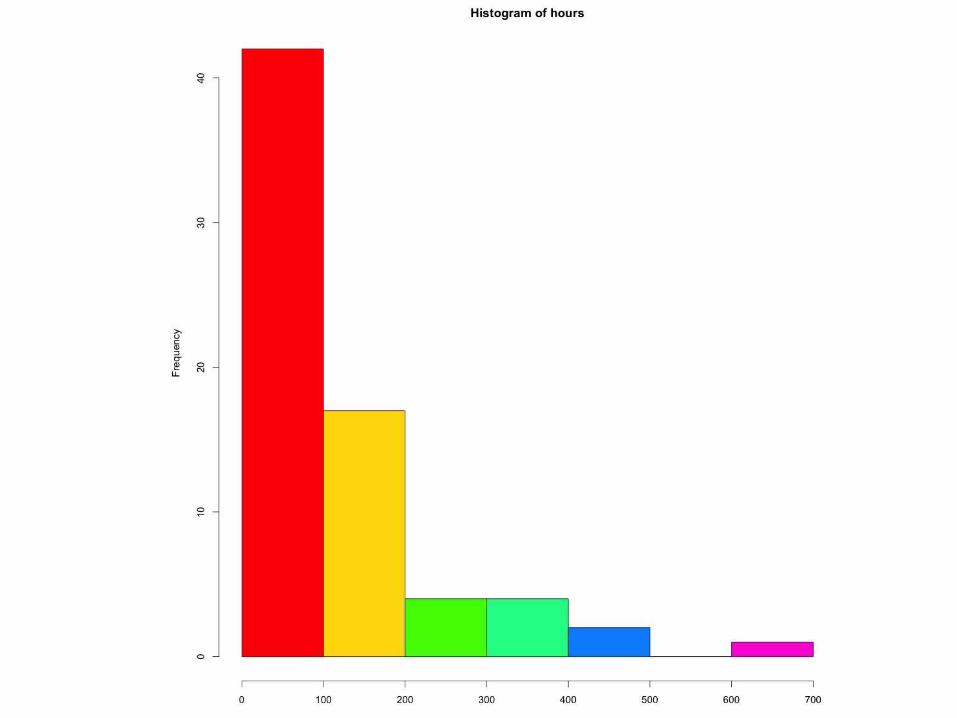
Another chart type
hist(
hours,
col = rainbow(7))
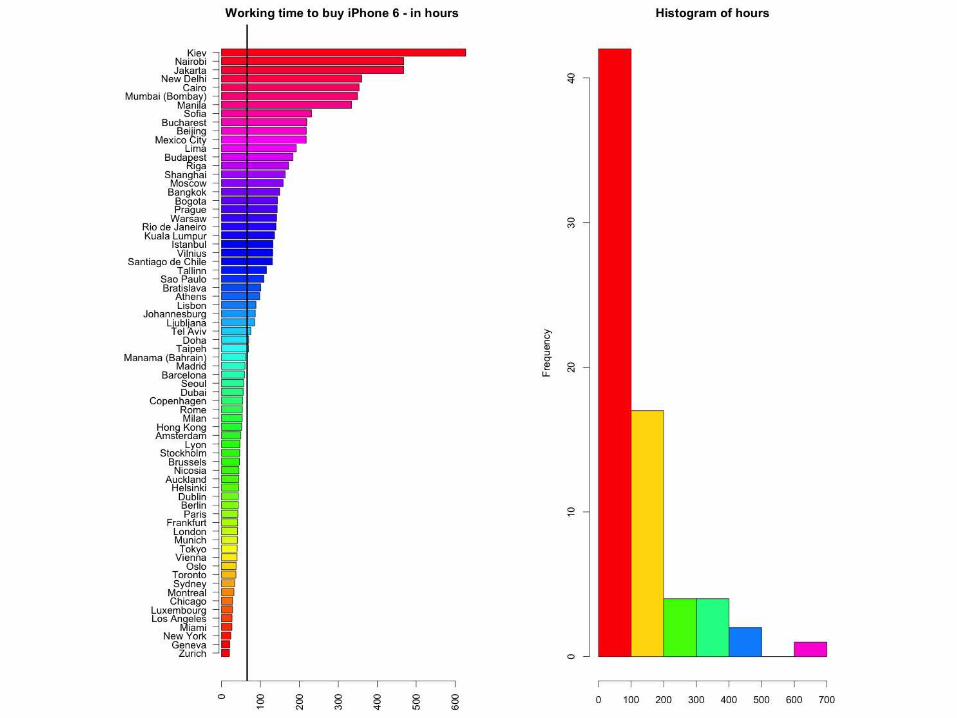
Or both together?
par(mfrow = c(1,2))
Then draw both graphs again and you get…
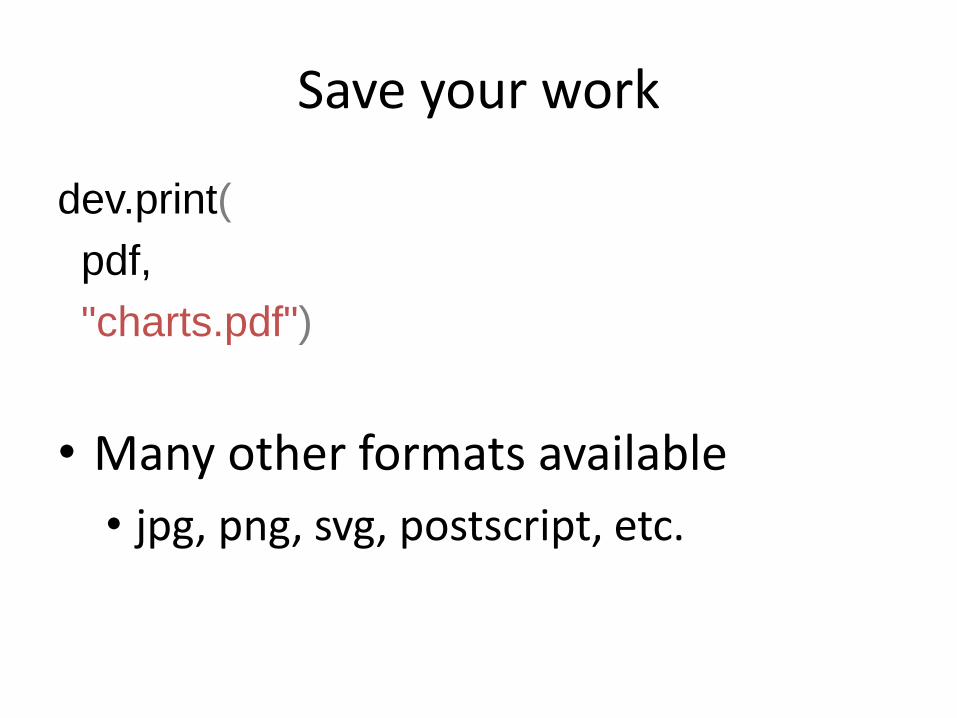
Save your work
dev.print(
pdf,
"charts.pdf")
• Many other formats available
• jpg, png, svg, postscript, etc.
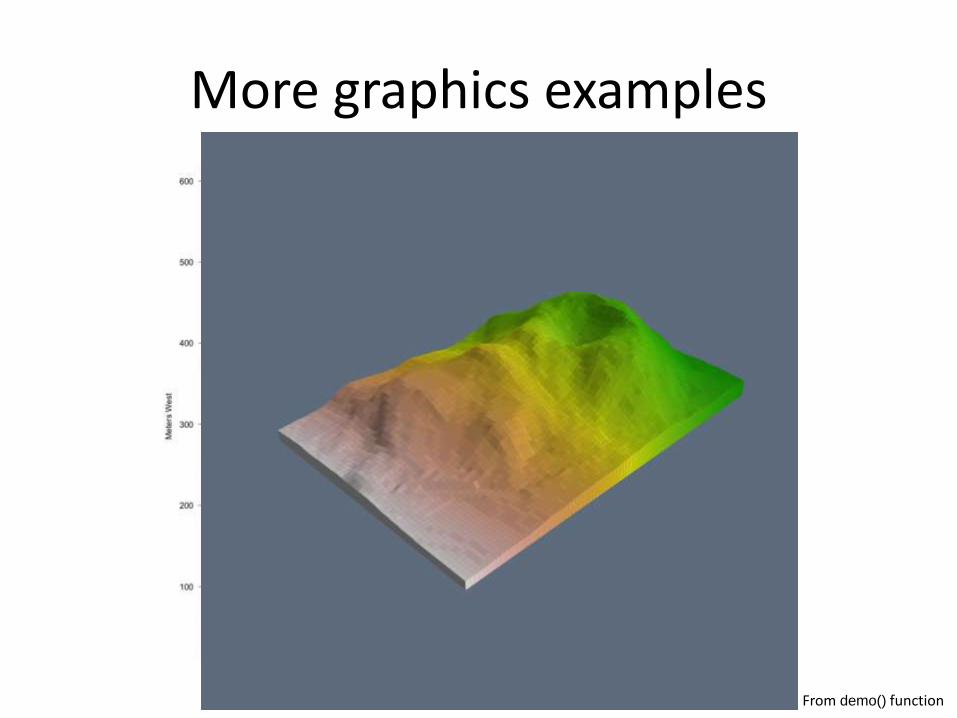
More graphics examples
From demo() function
This is only tip of the iceberg
• Of R graphics
• Quickly create publication ready graphs
• Only base package shown today
• Many others available, e.g.: lattice, ggplot2
• Of other vast R capabilities
• Statistics, analytics, machine learning etc.
• Extensible by over 7000 packages
• https://cran.r-project.org/web/packages

Try it!
• R - https://cran.r-project.org
• IDE for R - https://www.rstudio.com
• MOOC, e.g.
• R Programming on Coursera
• Interactive tutorial about R on R
• http://swirlstats.com
• Without installing anything – in your browser
• https://www.datacamp.com/swirl-r-tutorial

Questions?
Thank you!