expro petrotech analysis services
TRANSCRIPT

FLUIDS
Expro Petrotech • Kvalamarka 26, N-5514 Haugesund, Norway • Tel: +47 52 700 700 Fax: +47 52 700 710 A3001 - SmartLab V0614
Expro Petrotech® Analysis Services
SmartLab® service for validity and analysis of wireline formation samples
A common problem to wireline formation testing and sampling tools has
been the degree of contamination in the samples, pressure losses in
chambers, limited success in sample transfer, limited PVT background
with the sampling personnel, etc. These problems have, more and more,
become a challenge to overcome. As WFS has become an important
tool in reservoir description and an important tool for planning well tests,
extended well tests or early production, Expro Petrotech® has packaged
its current technical competence into a new integrated service.
SmartLab®
In order to obtain the highest quality of wellsite data from these tools,
Expro Petrotech® has designed and constructed a mobile offshore
laboratory called “SmartLab”. The aim of the SmartLab is to determine
the quality of samples retrieved and also measure as many parameters
as possible with regard to hydrocarbons, water and trace elements.
As Expro Petrotech® is not operating the WFS-tools, we will offer our
technical knowledge and experience on site to assist the tool operator
in securing the best possible fluid sample.
The current trend of obtaining reservoir information by the use of WFS,
and thereby reducing the need for full production testing, is likely to
increase. With this in mind, we have worked towards being able to offer
our clients a full package of services based upon the accurate analysis
of the oil, water and gas retrieved via the use of WFS.
The services
The services offered by Expro Petrotech® will be tailored to meet the
requirements of the oil companies in each instance. This means a range
of services from basic validity checks, sample transfer and measure-
ment of trace elements in gas, through to a complete and comprehen-
sive package of services covering detailed gas, oil and water analysis
together with PVT parameters such as, GOR, GWR, Bo, density and
viscosity under pressure.
BACKGROUND
Requirements
Accurate description of hydrocarbon fluids is critical to field develop-
ment planning, including facilities design and recovery efficiencies.
FLUIDS
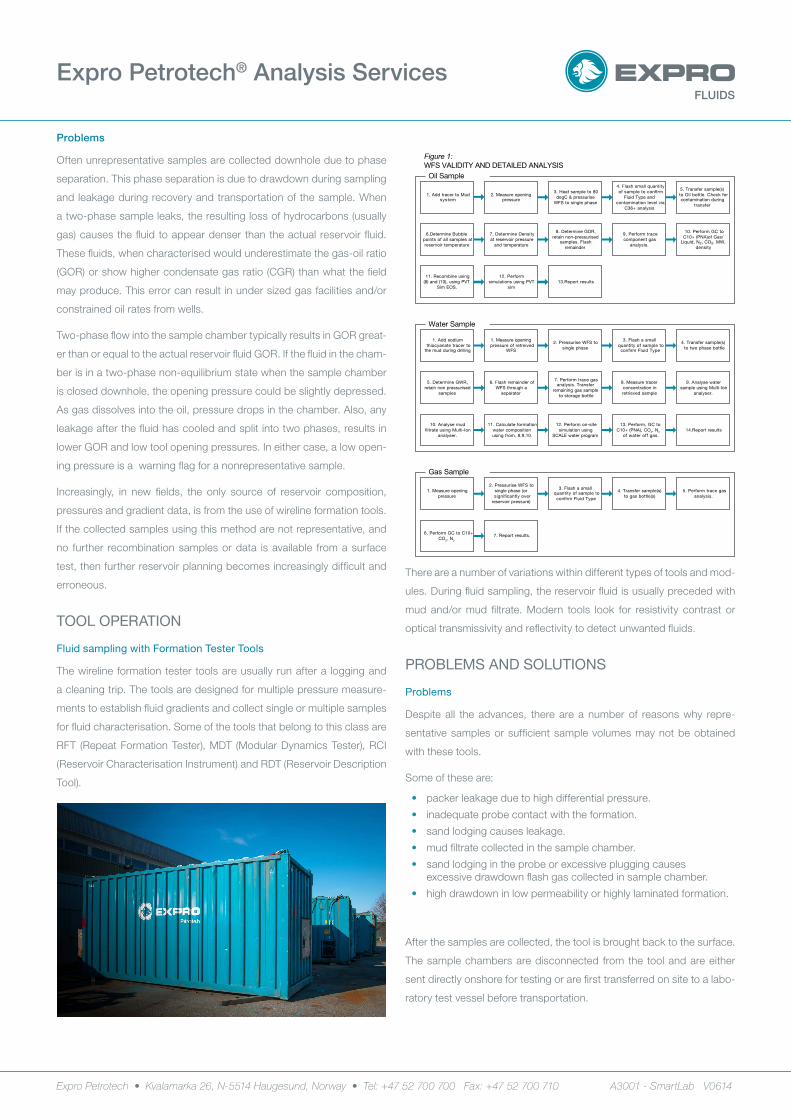
6.Determine Bubblepoints of all samples atreservoir temperature
5. Transfer sample(s)to Oil bottle. Check forcontamination during
transfer
4. Flash small quantityof sample to con�rm
Fluid Type andcontamination level via
C36+ analysis
3. Heat sample to 80degC & pressurise
WFS to single phase
2. Measure openingpressure
1. Add tracer to Mudsystem
13.Report results12. Perform
simulations using PVTsim
11. Recombine using(8) and (10), using PVT
Sim EOS.
10. Perform GC toC10+ (PNA)of Gas/
Liquid, N2, CO2. MW,density
9. Perform tracecomponent gas
analysis.
8. Determine GOR,retain non-pressurised
samples. Flashremainder
7. Determine Densityat reservoir pressure
and temperature
Oil Sample
Figure 1:WFS VALIDITY AND DETAILED ANALYSIS
1. Measure openingpressure
2. Pressurise WFS tosingle phase (orsigni�cantly over
reservoir pressure)
3. Flash a smallquantity of sample tocon�rm Fluid Type
7. Report results.6. Perform GC to C10+CO2, N2
5. Perform trace gasanalysis.
4. Transfer sample(s)to gas bottle(s)
Gas Sample
1. Add sodiumthiocyanate tracer to
the mud during drilling
14.Report results13. Perform, GC to
C10+ (PNA), CO2, N2
of water off gas.
12. Perform on-sitesimulation using
SCALE water program
11. Calculate formationwater compositionusing from, 8,9,10.
10. Analyse mud�ltrate using Multi-Ion
analyser.
9. Analyse watersample using Multi-Ion
analyser.
8. Measure tracerconcentration inretrieved sample
7. Perform trace gasanalysis. Transfer
remaining gas sampleto storage bottle
6. Flash remainder ofWFS through a
separator
5. Determine GWR,retain non pressurised
samples
4. Transfer sample(s)to two phase bottle
3. Flash a smallquantity of sample tocon�rm Fluid Type
2. Pressurise WFS tosingle phase
1. Measure openingpressure of retreived
WFS
Water Sample
Expro Petrotech • Kvalamarka 26, N-5514 Haugesund, Norway • Tel: +47 52 700 700 Fax: +47 52 700 710 A3001 - SmartLab V0614
Expro Petrotech® Analysis Services
Problems
Often unrepresentative samples are collected downhole due to phase
separation. This phase separation is due to drawdown during sampling
and leakage during recovery and transportation of the sample. When
a two-phase sample leaks, the resulting loss of hydrocarbons (usually
gas) causes the fluid to appear denser than the actual reservoir fluid.
These fluids, when characterised would underestimate the gas-oil ratio
(GOR) or show higher condensate gas ratio (CGR) than what the field
may produce. This error can result in under sized gas facilities and/or
constrained oil rates from wells.
Two-phase flow into the sample chamber typically results in GOR great-
er than or equal to the actual reservoir fluid GOR. If the fluid in the cham-
ber is in a two-phase non-equilibrium state when the sample chamber
is closed downhole, the opening pressure could be slightly depressed.
As gas dissolves into the oil, pressure drops in the chamber. Also, any
leakage after the fluid has cooled and split into two phases, results in
lower GOR and low tool opening pressures. In either case, a low open-
ing pressure is a warning flag for a nonrepresentative sample.
Increasingly, in new fields, the only source of reservoir composition,
pressures and gradient data, is from the use of wireline formation tools.
If the collected samples using this method are not representative, and
no further recombination samples or data is available from a surface
test, then further reservoir planning becomes increasingly difficult and
erroneous.
TOOL OPERATION
Fluid sampling with Formation Tester Tools
The wireline formation tester tools are usually run after a logging and
a cleaning trip. The tools are designed for multiple pressure measure-
ments to establish fluid gradients and collect single or multiple samples
for fluid characterisation. Some of the tools that belong to this class are
RFT (Repeat Formation Tester), MDT (Modular Dynamics Tester), RCI
(Reservoir Characterisation Instrument) and RDT (Reservoir Description
Tool).
There are a number of variations within different types of tools and mod-
ules. During fluid sampling, the reservoir fluid is usually preceded with
mud and/or mud filtrate. Modern tools look for resistivity contrast or
optical transmissivity and reflectivity to detect unwanted fluids.
PROBLEMS AND SOLUTIONS
Problems
Despite all the advances, there are a number of reasons why repre-
sentative samples or sufficient sample volumes may not be obtained
with these tools.
Some of these are:
• packer leakage due to high differential pressure.
• inadequate probe contact with the formation.
• sand lodging causes leakage.
• mud filtrate collected in the sample chamber.
• sand lodging in the probe or excessive plugging causes excessive drawdown flash gas collected in sample chamber.
• high drawdown in low permeability or highly laminated formation.
After the samples are collected, the tool is brought back to the surface.
The sample chambers are disconnected from the tool and are either
sent directly onshore for testing or are first transferred on site to a labo-
ratory test vessel before transportation.

FLUIDS
Expro Petrotech • Kvalamarka 26, N-5514 Haugesund, Norway • Tel: +47 52 700 700 Fax: +47 52 700 710 A3001 - SmartLab V0614
Expro Petrotech® Analysis Services
Consistency checksOften multiple samples are not available from a single reservoir rock to
check consistency and provide back up. In such cases, consistency
between the numerous sets of data from each individual sample must
be checked.
This should include:
• estimated in-situ fluid density
• sample composition
• opening pressure
• saturation pressure
• proximity of the gas-oil contact
• viscosity measurements
The viscosity technology for live fluid is based on a reliable electromag-
netic concept to measure absolute viscosity. The system measures vis-
cosity, temperature and temperature compensated viscosity. Viscosity
at ambient pressure and specified temperature can also be measured
with Cannon-Fenske viscosity tubes. All these pieces of information
should fit together to form a consistent fluid description.
Solution
The objective of Expro Petrotech’s WFS service is to provide sample
validity information accurately and rapidly, thereby enabling an immedi-
ate on-site decision whether to re-run the tool to obtain further samples.
TRACER TECHNIQUES
Tracers
For samples retrieved via the use of WFS, the use of tracers introduced
into the oil or water based mud must also be considered. The degree
of contamination from the drilling fluid has to be determined in order to
enable corrections to be made and accurate fluid compositions deter-
mined. For example in a water based mud system, sodium thiocyanate
can be used as a tracer. The tracer is added to the mud approximately
100 meters above the zone of interest. The concentration of tracer in the
mud is kept stable at about 400 mg/l when drilling through the target
zone. By analysing the mud filtrate and the retrieved sample, and by
determining the concentration of thiocyanate in the retrieved sample,
the composition of the formation water can be calculated. For oil based
mud, contamination is found by C36+ analysis of mud filtrate and WFS,
and calculation based on skimming or ratio of known components.
ON-SITE PROCEDURE
Individual samples
After retrieval of the WFS, the physical properties of the fluid are deter-
mined to give an indication of the quality of the retrieved sample. Tracer
concentrations are determined, the degree of contamination calculated
and a recommendation made as to whether the sample is acceptable
or a new sample should be taken.
Multiple samples
When multiple samples have been retrieved from different intervals, Ex-
pro Petrotech will also look at the overall picture of the samples. If one
set is not consistent with the others, although individually it looks OK,
then this will be flagged to the operator and a resample can be consid-
ered to correct or verify the sample data.
Reservoir pressures
The WFS tools will provide reservoir pressures from the formation.
These are interpreted to provide information on fluid contacts, reservoir
discontinuities, etc.
Densities are also determined at each fluid sample point. The fluid den-
sity provides a very accurate fluid gradient at this specific point of the
reservoir. These density measurements combined with the obtained
reservoir pressures will provide a much more accurate basis for drawing
the fluid gradients through the reservoir.
The definition of fluid gradients and reservoir pressure discontinuities
can be found with a very high degree of accuracy. This can also be an
important tool to establish a basis for describing compositional gradi-
ents in the reservoir at an early stage.
ADVANTAGES FOR THE COMPANIESThe value to users (oil companies) lies in the areas of:
• Rapid confirmation of retrieved sample quality.
• Rapid compositional analyses of sampled gas, water and oil.
• Decreased decision time for any reruns or rigdown.
• Decreased rig time.
• Elimination of DST for water and oil tests.
• Economic savings due to reduced need for onshore analysis.
• Reduced risk of sample deterioration due to time and
• transportation.

FLUIDS
Reservoir Pressure
Reservoir Temperature
BubblePoint @ Res Temp
Density @ Res P&T BoFactor
Depth(mMDRKB) (psi) (degC) (psi) (Kg/m3) (m3/Sm3)
1996.5 2915 82 2770 710.0 1.341
2048.5 2988 84 2872 711.2 1.341
2305.0 3350 92 3210 696.0 1.387
2679.5 3931 104 3900 628.3 1.732
Retrieved WFS Sample Data
Bubble Point Plot of Retrieved Sample at Reservoir
250 260 270 280 290 300 310 320 330 340 350
0 1 2 3 4 5 6 7 8 Volume drained (cc)
bar
Bubble point 263 bar
Recombination of Wireline Fluid Sample
Sample No WFS-chamber # 144
Components Stock tank gas (mole%)
Stock tank liq.(mole%)
Res. Fluid mole%
MW g/mol* Dsty kg/m3**
N2 0.706 0.000 0.436
CO2 5.158 0.000 3.183
C1 75.258 0.046 46.458
C2 7.807 0.130 4.868
C3 5.353 0.513 3.500
iC4 0.782 0.211 0.564
nC4 2.174 1.008 1.728
iC5 0.560 0.753 0.634
nC5 0.702 1.356 0.953
C6 total 0.531 6.702 2.894 86.1
P 0.524 6.410 2.778 663.8
N 0.007 0.292 0.116
C7 total 0.614 7.952 3.424 89.9
P 0.162 2.774 1.162 749.2
N 0.334 3.940 1.715
A 0.118 1.239 0.547
C8 total 0.279 10.911 4.350 103.0
P 0.065 2.813 1.117 774.4
N 0.141 5.100 2.040
A 0.073 2.999 1.193
C9 total 0.047 8.017 3.098 118.1
P 0.022 3.743 1.447 781.8
N 0.006 0.897 0.347
A 0.019 3.376 1.305
C10+ 0.028 62.399 23.911 340.6
Sum 100.000 100.000 100.000 879.5
Total
MW g/mole 23.3 248.8 109.6 *recomb. MW
Density kg/m3 0.984 855.3 714.2 **stabil. dsty
Gas gravity 0.803 - -
Measurements
Single �ash GOR to STC 131 Sm³/Sm³
Formation volume factor (Bo) *** 1.378 m³/Sm³
Sample density at res. Conditions 708.1 kg/Sm3
Sample bubble point at res. temp. 263 bara
213 bara
*** calculated from gas gravity, GOR and liquid density at STC and res. conditions
268.47 bara
97 degC
Simulations based on reservoir �uid composition (PVTsim)
GOR 129.4 Sm³/Sm³
Formation volume factor (Bo) 1.388 m³/Sm³
Density at res. Conditions 712 kg/m3
Bubble point at res. temp. 260 bara
Reservoir conditions
Sample bubble point at amb. temp.
Expro Petrotech • Kvalamarka 26, N-5514 Haugesund, Norway • Tel: +47 52 700 700 Fax: +47 52 700 710 A3001 - SmartLab V0614
Expro Petrotech® Analysis Services
SUMMARY
Many of the component parts of the analytical services are already on the
market. However, the ability to provide a comprehensive analysis of all pro-
duced fluids to a standard, comparable to those available onshore, has sig-
nificant benefits for the oil companies.
The service should not be seen as a “quick check” type validity and analy-
sis, but as a comprehensive PVT and analysis package designed to elimi-
nate or reduce the need for repeat onshore analysis.
WFS can offer significant savings for the oil companies if the information
provided from the tool is representative of the formation fluid. Currently this
cannot usually be confirmed until days or weeks after the samples are ob-
tained.
For the oil companies the Smart Lab® in combination with WFS offers rapid
validity control and compositional data of all sampled fluids. This will enable
the oil companies to quickly decide whether any sample retrieved was sat-
isfactory or whether further samples should be obtained before proceeding
to the next zone or rigging down any equipment. Information provided by
WFS is also used to confirm zones of interest and the intervals for eventual
production tests.
References
Consistency check and reconciliation of PVT data from:
• Samples Obtained with Formation Testers Using EOS Models. SPE 36743
• Jitendra Kikani, John Ratulowski, Shell E&P Technology Company

FLUIDS
Expro Petrotech • Kvalamarka 26, N-5514 Haugesund, Norway • Tel: +47 52 700 700 Fax: +47 52 700 710 A3001 - SmartLab V0614
Expro Petrotech® Analysis Services
Detailed hydrocarbon analysis:• Density at reservoir pressure and temperature
• GOR (gas-oil-ration) measurement
• Detailed gas analysis
» Chromatography up to C10+ (with PNA) and N2, CO2 for gas
• Detailed oil analysis
» Chromatography up to C10+ (with PNA)
» C36+ fingerprint for OBM contamination
» Molecular Weight
» Density
• Recombined Reservoir PVT composition
• Saturation point (bubble point) at reservoir temperature
• Calculation of Bo (oil formation factor)
• Simulations on reservoir fluid behaviour – PVT-sim
• Laboratory reportv
SmartLab®
Expro Petrotech’s mobile on-site laboratory. Easy to customise for analytical services during drilling and logging operations and production well testing.
• GWR (gas-water-ratio) measurement
• Chromatography up to C10+ (with PNA) and
N2, CO2 for gas flashed off the water
• Expro Petrotech’s Multi-ion analyser, based on the ion
chromatography principle covers the following ions:
» Lithium, Li+
» Sodium, Na+
» Potassium, K+
» Calcium, Ca2+
» Magnesium, Mg2+
» Strontium, Sr2+
» Barium, Ba2+
» Chloride, Cl-
» Bromide, Br-
» Sulphate, SO42-
» Acetate, CH3COO-
» Formiate, COO-
• Iron (Fe2+/3+) by Chemets kit, Sulphide ion (S2-) by Kittagawa
• pH, conductivity, density, alkalinity
• Contamination of mud filtrate (WBM) and
correction of formation water
• Optional: pH at reservoir conditions
• Preservation for further on-shore analysis
• Laboratory water report
Detailed water analysis

“When we search for answers, we have to know what we’re looking for”