exposure to carbon monoxide in an underground …
TRANSCRIPT

Page 1
EXPOSURE TO CARBON MONOXIDE IN AN UNDERGROUND
TRACKLESS MINE DURING THE PERIOD MAY 2012 –
DECEMBER 2012
JJ van Staden
Student No. 0110691F
Date: 20 April 2015
A study report submitted to the Faculty of Health Sciences, University of the Witwatersrand,
Johannesburg, in partial accomplishment of the requirements for the degree of Master of Public
Health (Occupational Hygiene).

Exposure to carbon monoxide in an underground trackless mine during the period May 2012 – December 2012
Page 2
DECLARATION
I, Jacobus Johannes van Staden, declare that this report is based upon my own research studies. The
work is being submitted for the degree of Master of Public Health in the field of Occupational
Hygiene at the University of the Witwatersrand, Johannesburg. The work submitted according to my
information, has not been submitted before for any qualification or examination at this or any other
university.
............................................................................
JJ van Staden
20 April 2015

Page 3
ABSTRACT
Objectives: This study identified the risk to CO exposure from unburnt hydrocarbons and explosives
used daily underground at a mechanized platinum mine. Existing CO personal measurements over a
six month period were utilised to develop a framework or management tool that will assist mine
managers and occupational medical practitioners to evaluate and prioritise occupational risk to CO
when reference is made to national and international limits including biological indices.
Methods: This study employed a retrospective record review of secondary data emanating from
records of the compulsory wearing of gas detection devices underground. The widely used NIOSH
method 66904 was used to assess CO exposure which stipulates that a portable direct gas reading
instrument will be used.
Results: Exposure results to carbon monoxide ranged from 0 ppm to 40 ppm and confirmed a non-
risk occupational exposure index when compared to the time weighted OEL of 30 ppm (Median for
total group 0.05). The overall arithmetic mean of 1.6 ppm was higher than the overall mean personal
gas concentration of 0.05 ppm. Although the highest percentage of proportional measurements
were in the range of 35 and 50 ppm for the occupation, trackless stoper the median result was still
far below the OEL range at 0.19 ppm.
Conclusions: The results have shown that personal exposure levels over an eight hour equivalent
shift compared to two generally used OELs were exceeded. These levels of over-exposure were
however not as great as was expected and the majority of the results did not exceed all three
applicable OELs for CO exposure over an 8-hour equivalent. Measurements exceeding the South
African OEL of 30 PPM were 0.03 % in total. Of particular interest is that no measurement exceeded
the OHSA (USA) limit of 50 ppm. Additionally from the data contained in this report it is evident that
all of the data utilization scenarios (literature research, field observations, interviews and data

Page 4
information gathering) can be calculated, reported and utilised in a Carbon Monoxide Management
System.

Page 5
ACKNOWLEDGMENTS
I wish to express my gratitude to the following organisations and persons for their role in the
execution of this research and write up of this report:
My Supervisor, Dr Andrew Swanepoel, for his encouragement and support.
The General Manager & Ventilation department at Bathople Mine, Chief Ventilation
Engineer and staff, for their consent to participate in this study and for their assistance and
co-operation during, walkthroughs, information gathering and risk occupation
determination.
Prof. D Rees for his work in underground mines and over-exposure to gas.

Page 6
TABLE OF CONTENTS PAGE
ABSTRACT ........................................................................................................................................... 3
ACKNOWLEDGMENTS ......................................................................................................................... 5
TABLE OF CONTENTS ........................................................................................................................... 6
LIST OF TABLES .................................................................................................................................... 9
LIST OF FIGURES ................................................................................................................................ 10
ABBREVIATIONS ................................................................................................................................ 11
CHAPTER 1 ........................................................................................................................................ 13
1. INTRODUCTION ............................................................................................................................ 13
2. LITERATURE REVIEW .................................................................................................................... 14
2.1 CARBON MONOXIDE (CO) AND ITS HEALTH EFFECTS ............................................................... 15
3. CARDIOVASCULAR EFFECTS ......................................................................................................... 18
4. PREGNANCY ................................................................................................................................. 19
5. OCCUPATIONAL EXPOSURE LIMITS AND BEIs .............................................................................. 19
6. THE MHSA OELs AND APPROXIMATE COHb LEVELS .................................................................... 20
CHAPTER 2: MATERIALS AND METHODS ......................................................................................... 23
2.1 STUDY AIM .................................................................................................................................. 23
2.2 STUDY OBJECTIVES ...................................................................................................................... 24

Page 7
2.3 STUDY RATIONALE ...................................................................................................................... 24
2.3.1 STUDY DESIGN.......................................................................................................................... 25
2.3.2 STUDY POPULATION AND SAMPLING ...................................................................................... 25
2.3.3 MEASUREMENTS INSTRUMENTS ............................................................................................. 26
2.3.4 PERSONAL GAS DETECTION DEVICES ....................................................................................... 27
2.3.5 Methods ………………………………………………………………………………………………………………………………28
2.3.6 RISK RANKING METHODOLOGY ............................................................................................... 28
2.4 INFORMATION GATHERING AND HAZARD CHARACTERIZATION................................................ 29
2.5 DATA ANALYSIS ........................................................................................................................... 32
2.6 ETHICAL ISSUES ........................................................................................................................... 33
2.7 FUNDING ..................................................................................................................................... 33
CHAPTER 3: RESULTS ........................................................................................................................ 34
3.1 RESULTS....................................................................................................................................... 34
CHAPTER 4: DISCUSSION, CONCLUSION AND RECOMMENDATIONS .............................................. 41
4.1 DISCUSSION ................................................................................................................................. 40
4.2 THE USE OF EXISTING OCCUPATIONAL EXPOSURE LIMITS AND BEIs ......................................... 41
4.3 LIMITED RESEARCH DATA ........................................................................................................... 42
4.4 CONCLUSION AND RECOMMENDATIONS ................................................................................... 43
REFERENCES ...................................................................................................................................... 51

Page 8
Appendix A – Summary calculations and results for a random selection of 20 samples ................. 54
Appendix B – Summary of exposure indicators for a random selection of 20 samples ................... 55
Appendix C – Example of results for the establishment of a Carbon Monoxide Management
Assistance Tool .................................................................................................................................. 57
Appendix D – Ethical approval .......................................................................................................... 59
Appendix E – Permission letter from employer…………………………………………………………………………….60

Page 9
LIST OF TABLES PAGE
Table 1 Selected occupational exposure limits & Biological exposure indices by country . 17
Table 2 Job Categories & Staff Compliment ........................................................................ 25
Table 3 Risk Ranking Methodology ...................................................................................... 28
Table 4 Gas Download Parameters ...................................................................................... 30
Table 5 Eight-hour TWA personal gas exposure (parts per million) .................................... 36
Table 6 Instantaneous personal (CO%) of risk occupation in an underground mine .......... 39
Table 7 CO Concentration time exposure ............................................................................ 45

Page 10
LIST OF FIGURES PAGE
Figure 1 Personal Gas Download Sequence .......................................................................... 27
Figure 2 Personal CO Concentration Values ......................................................................... 31
Figure 3 Ceiling values ........................................................................................................... 31
Figure 4 STEL and Ceiling CO Values as a TWA Fraction ....................................................... 32
Figure 5 Box and Whisker plot evaluating personal exposures for risk occupations ........... 35
Figure 6 Personal gas exposure measurement comparisons with OELs ............................... 38

Page 11
ABBREVIATIONS
ACGIH American Conference of Governmental Industrial Hygienists
BAT Biologische Arbeitsstoff-Toleranzwerte
BEI Biological Exposure Index
BMVG Biological Monitoring Value Guidance
CAD Coronary Artery Disease
CFK Coburn Foster Kane
CO Carbon Monoxide
COHb Carboxyhaemoglobin
COP Code of Practise
DMR Department of Minerals and Resources
DOL Department of Labour
EPA Environmental Protection Agency
FEV1 Forced Expiratory Volume in one second
GDI Gas Detection Device
Hb Haemoglobin
HSE Health Safety & Environmental
IARC International Agency for Research on Cancer
IDLH Immediately Dangerous to Life and Health
ILO International Labour Organisation
IQR Inter Quartile Range
LOAEL Lowest Observed Adverse Effect Level
MHSA Mine Health & Safety Act
MIN Minutes
NH3 Ammonia
NIOH National Institute for Occupational Health

Page 12
NIOSH National Institute for Occupational Safety and Health (USA)
NO Nitrogen Oxide
NO2 Nitrogen Dioxide
OEL CL Occupational Exposure Limit – Control Limit
OEL Occupational Exposure Limit
OEL-TWA Occupational Exposure Limit - Time Weighted Average
OHS Occupational Health and Safety
OSHA Occupational Safety and Health Administration
PEL Permissible Exposure Limits
ppm parts per million
RSA Republic of South Africa
SABS South African Bureau of Standards
SANAS South African National Accreditation System
SANS South African National Standards
SD Standard Deviation
STEL Short Term Exposure Limit
STEL Short Term Exposure Limit
TLV Threshold Limit Value
TLV Threshold Limit Value
TM3 Trackless Mechanised Mining
TWA Time Weighted Average
TWA Time Weighted Average
USA United States of America
WHO World Health Organisation
WMC Western Mining Company

Page 13
CHAPTER 1:
1. INTRODUCTION
In South Africa, mines are obligated to compile with the requirements of the guideline for the
compilation of a Mandatory Codes of Practices (COPs) for flammable gasses under the current Mine
Health and Safety Act (MHSA) (South Africa, Department of Minerals and Resources, 1997). These
codes of practice are prepared in accordance with the Department of Minerals and Resources (DMR)
guideline ref. DME 16/3/2/1-A2, South Africa. The Department of Minerals and Resources (2002)
provided the Standard for the establishment of a mandatory code of practice for the prevention of
flammable explosions in mines other than coal mines, which further refers to flammable gas as
methane gas, hydrogen gas, carbon monoxide (CO) and/or any other natural flammable gas that
may be liberated in the underground workings. The purpose of the code is to document the
practices and procedures to be applied to address occupational risks due to exposure to flammable
gas. Exposure to flammable gas is a health and safety concern and typically has to be dealt with
through strategies which embrace engineering controls, elimination, substitution, administrative
controls and personal protection.
Personal monitoring of a flammable gas involves an instrument which, when switched on at the
point of issue, will remain operating for the duration of the working shift. It is designed to
determine the concentration of flammable gas present in the atmosphere in parts per hundred by
volume and the instrument is equipped with visual and/or audible alarms or both and must comply
with Standards South Africa, 1990; Combustible-gas sensing and measuring instruments principally
for use in mines part 1: battery-operated hand held and transportable instruments in adherence to
Standards of South Africa. (SANS 1515-1-1990).
Over exposure to gasses especially the inhalation of it remains scant as no conclusive occupational
exposure data is available for fugitive gas exposure emissions (Mainiero, 2000). Despite the

Page 14
monitoring requirement for flammable gasses, very little personal occupational exposure data to CO
exist for subjects working in an underground platinum mine. This is a major limitation currently in
South African mines and the focal point of this project. Daily personal CO measurements are mainly
compared to acute safety limits which are based on explosive ranges and not toxic levels over a
prolonged period. This scenario finds application in most South African mines and surface operations
even though measurements are logged over most shifts.
The purpose of this study is to identify and prioritize occupations exposed to CO. In addition, the
study seeks to compare these CO exposures to international and national occupational exposure
limits. The study examined personal sampling measurements at a mechanized mine resulting in a
management tool addressing over exposure to CO. The modern day mining environment has an
increasing trend of removing subjects from the working face and introducing mechanized mining
methods. The introduction of this method however increases the additional load of diesel
equipment, which in turn contributes to the overall CO burden due to the poor efficiency of diesel
engines and the ability to burn cleaner tail pipe gasses.
2. Literature review
Workers involved with underground activities are regularly exposed to substances such as tail pipe
exhaust emissions, gas generation form explosives, rock drill mist and other gas constituents on a
daily basis, while performing their daily work. Occupational exposure to these airborne
contaminants may increase the worker’s risk to obstructive pulmonary disorders and blasting fumes
exposure (Bakke et al., 2004) in particular increasing workers risk to develop respiratory illnesses
and lung obstructions. In a study investigating the effect of blasting gasses on tunnel workers the
researchers reported that over several days of exposure, the workers showed a marked downward
trend in lung capacity function and FEV1 (forced expiratory volume in one second) indicating a
negative impact when employees come in contact with gasses liberated from explosive usage with a
resultant symptomatic impact on the respiratory system (Bakke et al., 2004).
Page 15
The main route exposure to gasses mainly exist via inhalation, a minimal alternative way is through
skin contact. The removal of these toxic substances from the body typically transpires by a degree of
excretion (De Souza & Katsabanis, 2004). The configuration of the gasses, dose and length of
interval of exposure, and the detail that mine workers exposure to contaminant mixtures as
opposed to single substances, can cause diverse effects on the miners health. Effects can vary from
nausea, skin irritation, difficulty in breathing to cancer. According to De Souza & Katsabnis (2004),
blasting fumes result in decrease work capacity of the cardiovascular, respiratory system and other
various organ functions. The ignition gasses (Nitrogen Oxide (NO), Nitrogen Dioxide (NO2), Ammonia
(NH3) and Carbon Monoxide (CO)) released during the blast process can have a detrimental bearing
on the miner’s wellbeing. It is therefore significant to designate the occupational exposure levels of
CO measured on a daily basis, as in this study.
2.1 Carbon Monoxide (CO) and its health effects
The lethal risk to carbon monoxide exposure results from the fact that it has no colour, taste or
odour which emanates from unburnt hydrocarbons and as a residue from blasting operations. CO is
the combined effect of incomplete oxidation of carbon post explosives detonation. The National
Institute of Occupational Safety and Health (NIOSH) has referenced CO levels at 1368 mg/m3 as
Immediately Dangerous to Life and Health (IDLH) with a 40 mg/m3 deemed to be a safe exposure
value over a working 8-hour shift (Pelham et al., 2002). Local legislation depicts values over a ceiling
and prolonged period, reference to Table 1, selected values and OELs per country indicates exposure
values against listed BEI and OEL limits.
Adverse effects to health from CO liberation are due to formation of carboxyhemoglobin (COHb)
when CO binds with hemoglobin inhibiting the uptake of oxygen in the blood. Hemoglobin (Hb)
possesses the likelihood to bind 240 times greater to CO as opposed to oxygen when entering the
body. Good evidence exists between CO expired air and adsorbed concentrations of CO before the

Page 16
onset of hypoxia which progresses when underground employees are exposed to elevated
concentrations of CO (Pelham et al., 2002).
Symptomatic signs of over exposure to CO reveal the following; indications of headaches,
disorientation, fatigue, nausea, acuity or perception degradation and confusion. Research by
Gulumian et al., (2007) advocate that exposure to elevated levels of CO will be lethal for
underground workers. Literature suggests that over exposure to high concentrations targets the
brain, cardio vascular system and training muscles which are more prone for sensitivity to CO
exposure (Pelham et al., 2002) especially considering the latent effects of the substance. Scientific
evaluations have presented a variety of indicators related with detailed concentrations of COHb.
Decreased levels of COHb alter visual acuity with dilation of arteries. Increased COHb levels revealed
symptoms of nausea, dizziness and headaches. Researchers have also revealed a positive
relationship to an increased metabolic work rate and higher CO uptake as opposed to a resting state
(Pelham et al., 2002). Therefore mine workers are at greater risk of developing hypoxia and other
adverse health effect due to their hard, physical work activities and inadequate ventilation methods
resulting in poor dilution of gasses emanating from explosives residue and diesel equipment being
used underground.
Studies conducted on oxygen conveyance in the blood with CO as an inhibitor during increased
metabolic work have indicated venous oxygen tightness degradation when exposed to CO, resulting
in an elevated heart rhythm with a resultant work efficiency decrease. Predisposed employees
suffering from coronary artery disease (CAD) are at risk with limited cardiovascular capability,
increasing their risk to angina. Acknowledging the risk on the cardio vascular system, employees
exposure to low levels of CO have been linked with diminished neuro-psychological output, resulting
in difficulties concomitant with concentration, remembrance, perceptive planning, and data
processing (Pelham et al., 2002)

Page 17
Table 1 Selected occupational exposure limits and biological exposure indices by country
Jurisdiction 8 hour TWA
ppm
Short-term limit
values (STEL)
Ceiling
value
COHb End-tidal breath
(end-exhaled air)
CO
OSHA, USA 50 ppm (PEL)
ACGIH, USA 25 ppm (TLV) 3.5% (BEI) 20 ppm
Germany 30 ppm 5% (BAT)
Sweden 35 ppm 100 ppm (15 mins)
HSE, UK 30 ppm 200 ppm (15 mins) Target is < 5% 30 ppm (BMGV)
MHSAct, RSA 30 ppm 100 ppm
OHSA, RSA 50 ppm 300 ppm (15 mins) <8% (BEI) 40 ppm
Notes:
1. HSE UK. Smoking complicates the interpretation of the Biological Monitoring Guidance Value (BMGV) in
individuals particularly if the smoking has occurred during shift time, biological screening on a cluster principle
will still be valuable in establishing the control effectiveness.
2. The Biologische Arbeitsstoff-Toleranzwerte (BAT) value is valid for non-smokers and is used as a biological
monitoring guidance value. The BAT value does not apply to pregnant workers (due to inadequate data to
evaluate risk). The BAT Value Documentation states that “In practice with the discovery of COHb concentrations
at or above 5% intensified monitoring of the air of the workplace with regard to CO....should be carried out.”
Medical enquiries (history-taking) should be done to clarify the cause and to find a remedy.
3. The ACGIH concludes in its documentation of the BEIs [2001] that CO reveals not to have significant and constant
properties on fit, young participants with a COHb less than 10%. Continued COHb levels of 5 – 10% might have a
detrimental metabolic work outcome of duties necessitating a certain level of attentiveness (e.g. operating an
aircraft). The capacity to perform strenuous physical exertion may be reduced at values around 5%. Decreased
exercise time to angina has been witnessed at concentrations in the region of 3% with elevated ventricular
arrhythmias hovering at 6%. Continual personal exposure to carbon monoxide throughout pregnancy can
contribute to diminished birth mass and low mental ability observed under offspring. The ACGIH, COHb level of
3.5% is set to protect against the above effects.

Page 18
4. The OSHA, USA, PEL of 50 ppm was reviewed and OHSA intended to establish a permissible exposure limit 8 -
hour TWA of 35 ppm and a upper limit of 200 ppm but this has not been enforced due to a remand by the USA
Circuit Court of Appeals (www.CDC.gov.niosh/pel88/630-08.html).
The ILO Encyclopaedia [1998] lists particularly susceptible workers as those with reduced oxygen
transport capacity because of anaemia or haemoglobin abnormalities; those with increased oxygen
needs (e.g. fever, hyperthyroidism or pregnancy); workers with systemic hypoxia due to respiratory
or cardiac disease; and workers with coronary artery disease (CAD). Individuals with generalised or
cerebral atherosclerosis may also be susceptible.
The World Health Organisation (WHO) adds to this list – foetuses and persons using curative or
leisure substances having effects on the brain are two, but notes that little empirical evidence exists
on which to specify health effects in relation to environmental exposure levels (WHO, 1999).
This list contains many diseases, some of which are common in the general population, but there are
insufficient data to use them for the determination of workplace standards. Two conditions deserve
particular attention, however: cardiovascular effects; and pregnancy.
3. Cardiovascular effects
At levels of about 4-5% COHb small decrements in work capacity have been shown under maximal
exercise conditions (WHO EHC 213, 1999; ACGIH, 2001; Leikauf & Prows, 2001). Coronary artery
disease (CAD) is of greater clinical concern and the group of individuals with CAD is viewed as the
most sensitive risk group by the WHO (EHC 213, 1999).
COHb levels in the range of 2.9 - 6% have been associated with shortened exercise duration before
onset of angina, and at 6% the number and complexity of exercise-induced arrhythmias increased in
people with CAD (WHO EHC 213, 1999; ACGIH, 2001; Leikauf & Prows, 2001). It should be noted that
the consequence of these outcomes on populations at work is not clear (ACGIH, 2001).
Page 19
4. Pregnancy
There are two considerations: the pregnant worker; and the foetus. Theoretically, pregnant workers
are considered a susceptible group for adverse effects of CO exposure. However data on maternal
health effects are scant and less focused on than possible foetal effects. Adverse outcomes of CO on
the foetus are well established in animal studies, which revealed negative signs mainly occurring at
maternal COHb concentrations above 15% (Leikauf & Prows, 2001), but extrapolating from animal
studies the lowest observable adverse effect level (LOAEL) could be as low as 10 ppm (or COHb of
1.82%) for continuous exposure to CO.
5. Occupational exposure limits and BEIs
When reference is made to Table 1 (Selected Occupational Exposures Limits & Biological Exposure
Indices by country) occupational exposure limits and biological limit values from a number of
developed countries and South Africa can be compared. The Appendix to Patty’s Toxicology Volume
8 (Leikauf & Prows, 2001) contains many more country-specific standards but they are similar to the
ones shown in Table 1, comparisons to the various eight hour TWAs range from 25 ppm to 50 ppm,
with statutory limits between 30 – 50 ppm; and COHB from 3.5% to 8%. The ACGIH is the most
stringent and it aims to avert adversarial neurobehavioral variations, uphold cardiovascular workout
volume and deliver a superior degree of protection for persons predominantly vulnerable to the
effects and over exposure conditions of CO, comprising of expecting female employees (i.e. the
foetus) including employees diagnosed with respiratory anomalies and chronic cardiovascular
ailments. Most jurisdictions have a BEI for COHb of 5% and so the OHS Act level of < 8% is on the
high side. A target BEI of 5% would seem reasonable, but should be interpreted in consideration of
the factors below.
The BEIs are usually end of shift values used to identify worksites where over-exposure may have
occurred and to protect susceptible groups. Exceedance of these values should not be taken to
Page 20
mean that clinical effects - “gassing” in a medical sense - have occurred due to workplace exposure
because smokers have an average COHb level of 4% and can reach 8% (WHO EHC 213, 1999); some
urban commuters have CO exposure in excess of 35ppm (WHO EHC 213, 1999); and that COHb levels
and clinical effects have great individual variability at the same CO exposure levels (WHO EHC 213,
1999; ACGIH, 2001). Consequently, exceedences should primarily be used to identify worksites and
practices that lead to possible over-exposure to CO rather than to define workers affected by CO.
6. The MHSA OELs and approximate COHb levels
The Coburn–Foster-Kane (CFK) equation is widely accepted when interpretations are made to
comparisons between exhaled air and blood CO levels. Patty’s Toxicology states that “The equation
is valid over a wide range of conditions, including large differences in CO levels, durations of
exposure, and exercise conditions.” (Leikauf & Prows, 2001, p.112) There are, however, a number
of competing modified – and usually simplified - equations with advantages and disadvantages
(Leikauf & Prows, 2001; Lloyd & Rowe, 1999). The modified NIOSH equation can be used to calculate
approximate COHb levels to derive an equivalent BEI under exposure conditions of 30 ppm and 100
ppm as stipulated in the Mine Health and Safety Act, bearing mind that individual factors, workload
and duration of exposure influence the COHb level.
As can be seen in Table 1, the MHSA ceiling value of 100 ppm is particularly stringent (100 ppm is
usually a short-term limit value, STEL over 15 minutes). Exceedance of the 100 ppm ceiling and even
STEL does not indicate that “gassing” has occurred or that medical monitoring is required; it is set so
that potentially high exposure settings can be identified in order to reduce exposure or to
temporarily remove workers from exposure or both. Assessment of COHb and symptoms is a more
useful measure of uptake of CO and need for medical monitoring than exceedance of the STEL.
Biological monitoring is well established in the determination of recent exposure to carbon
monoxide (CO) by individuals (EPA, 2000). Two methods are commonly used: measurement of

Page 21
blood carboxyhemoglobin (COHb); and CO in end-tidal exhaled breath after standardised breath
hold manoeuvre. The COHb in blood is utilised as the validated biomarker of exposed individuals to
carbon monoxide (ACGIH, 2001), especially in clinical settings and hospital environments. Blood
COHb levels are exact and meticulously related to the devices of toxicity (WHO, 2000). The COHb
level is largely a function of endogenous production (a minor contributor) and the exposure level of
the carbon monoxide (CO) gas by inhalation, extent of exposure level and alveolar aeration. Carbon
monoxide is expired unaffected via the lungs, as a gas through exhaled air, and has therefore been
used in practice as an indirect measure of COHb levels. Carbon monoxide in expired breath offers a
quick precise non-invasive, feasible, cheap, quick screening method that can be used in practice in
various occupational and emergency settings (Jarvis et al., 1980; Jarvis et al., 1986; WHO, 2000).
Exhaled air has been used successfully as a screening method to determine carbon monoxide
exposure in emergency medical settings (Kurt et al., 1990), and various occupational settings. This
method has also been used as a test of tobacco smoke intake in clinical settings and smoking
cessation programs (Wald et al., 1981; Corradi & Mutti, 2005). It has also been used for immediate
determination of CO exposure in individual patients as well as a triage tool when large groups of
patients are suspected of carbon monoxide exposure (Kurt et al., 1990).
CO measurement in exhaled air is particularly recommended in settings where rapid collection of
blood and determination of COHb levels is not feasible. Rapid collection of blood is necessary as the
elimination half-life of carbon monoxide in blood is 3-5 hours, thus a delay in collecting blood results
in underestimates of exposure; and a delay in determination of COHb levels means that prompt
assessment of exposure and institution of remedial actions are not possible.
CO in exhaled air can be used in occupational settings to overcome the limitations associated with
COHb. Carbon monoxide in end-tidal breath is used in a Biological Monitoring Guidance Value of the
United Kingdom’s Health and Safety Executive (HSE, 2011) and is thus an accepted instrument for

Page 22
biological screening of exposure to carbon monoxide. The ACGIH (2001) has also published a BEI for
end-exhaled air (the BEI is 20 ppm at end of shift).

Page 23
CHAPTER 2: MATERIALS AND METHODS
2.1 Study Aim
The main objective of this study was to identify and prioritize mining occupations exposed to CO and
to compare these exposure levels to international and national occupational exposure limits. It is
further expected that this study could contribute to better interpretation of the results with
intervention levels and control strategies that will provide a bracket of safety for particularly
susceptible workers. These include: pregnant workers and those with respiratory diseases, smokers
and subjects diagnosed with coronary artery diseases who work underground on a daily basis.
The study also aims to mitigate personal CO exposure through a framework or management tool
that will assist mine managers and occupational medical practitioners to evaluate and prioritise
occupational risk to CO when reference is made to national and international limits including
biological indices. The study objectives are listed below:

Page 24
2.2 Study Objectives
1. To deduce a profile of the top 10 risk occupations from daily CO exceedences over a six
month period above the OEL for exposure to CO;
2. To describe personal CO exposures in the top ten high risk occupations during the period
May 2012 – December 2012 in a mechanised mine over a three shift period.
3. To compare personal CO exposures at an underground platinum mechanised mine during
the period May 2012 – December 2012 to national and international OELs (Occupational
Exposure Limits)
2.3 Study Rationale
Occupational exposure of workers, and particularly women, to CO in the work environment remains
problematic in terms of the probable adverse effects on their reproductive health (Alfred, et al.,
1991:546-559). It is important that the extent to which these subjects are exposed will be assessed
especially referring to the acute toxicity of CO. Work done by Apte et al., (1999) suggested further
exposure mitigation by careful investigation to various alarm limits as an early warning indicator.
Current CO exposure monitoring is very safety oriented by nature and fails to address prolonged
toxicity and acknowledgement to literature when dose concentrations and short term excursions are
brought into consideration. The study will also contribute to improve control strategies and
procedures aimed at reducing occupational exposure to CO in this work environment especially
looking at the latent effect of CO over a prolonged period. It is envisaged that this study will
contribute to sensitising, awareness raising and improving control strategies and procedures aimed
at reducing personal gas concentration levels to CO. The intention and study deliverables are also
envisaged to alert management when subjects are exposed to CO with reference to OEL settings and
at what levels an over exposure requires a clinical observation.

Page 25
2.3.1 Study design
This study employed a retrospective record review of data already collected, emanating from the
compulsory wearing of gas detection devices underground with automatic download when the
subjects exit from the workings underground.
2.3.2 Study population and sampling
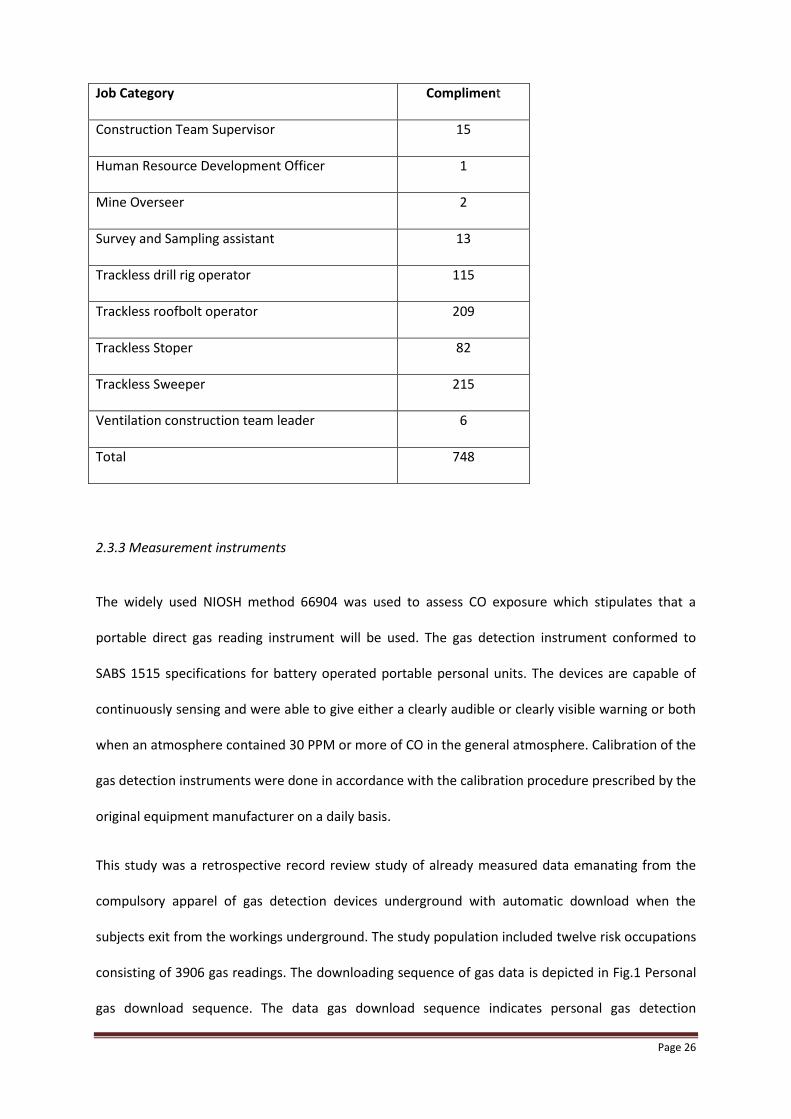
The study population included a total number of seven hundred and forty eight (748) subjects
working over a three shift system (day, afternoon and night shift) which were identified to
participate in this study as reflected in Table 2, Job categories and staff compliment. Reflecting upon
the study population of 748 subjects identified a 50% prevalence was assumed amongst exposed
occupations due to the scant literature existing for underground worker exposure to gasses. It is
therefore important and fit for this study to have determined the occupational exposure levels of CO
from unburnt hydrocarbons to which mineworkers are exposed to during their eight to nine hour
working shift.
For the overall aim of this study, workers issued with a personal gas detection device as per the
mine’s Mandatory Code of Practice (DMR, Guideline for the compilation of a mandatory code of
practise for the prevention of flammable gas explosions in mines other than coal mines, 16/3/2/1 -
A2) were selected. The results of the study were associated to current OEL’s of the Mine Health and
Safety Act, 1996 (Act No. 29 of 1996) and Occupational Health and Safety Act, 1993 (act No. 85 of
1993).
Table 2 Job Categories and Staff Complements
Job Category Compliment
Boilermaker Plater 28
Construction 90
Page 26
Job Category Compliment
Construction Team Supervisor 15
Human Resource Development Officer 1
Mine Overseer 2
Survey and Sampling assistant 13
Trackless drill rig operator 115
Trackless roofbolt operator 209
Trackless Stoper 82
Trackless Sweeper 215
Ventilation construction team leader 6
Total 748
2.3.3 Measurement instruments
The widely used NIOSH method 66904 was used to assess CO exposure which stipulates that a
portable direct gas reading instrument will be used. The gas detection instrument conformed to
SABS 1515 specifications for battery operated portable personal units. The devices are capable of
continuously sensing and were able to give either a clearly audible or clearly visible warning or both
when an atmosphere contained 30 PPM or more of CO in the general atmosphere. Calibration of the
gas detection instruments were done in accordance with the calibration procedure prescribed by the
original equipment manufacturer on a daily basis.
This study was a retrospective record review study of already measured data emanating from the
compulsory apparel of gas detection devices underground with automatic download when the
subjects exit from the workings underground. The study population included twelve risk occupations
consisting of 3906 gas readings. The downloading sequence of gas data is depicted in Fig.1 Personal
gas download sequence. The data gas download sequence indicates personal gas detection

Page 27
instruments within the lamp room of the mine. Instruments are calibrated to a known concentration
span gas and downloadable on a central server once the instruments return from underground.
These results are logged against each occupation on a daily basis over a 6 month period and were
scrutinized as part of the project scope.
Figure 1 Personal gas downloads sequence
2.3.4 Personal gas detection devices
The actual instrument is a portable hand-held spot or continuous instrument which allows the
employee to measure the presence and gas concentration over an entire shift period. For gas
concentrations exceeding occupational exposure limits, a full scale meter or an over-range indication
will be shown. Clearly audible and visible alarms will also be activated should these instruments be
placed in an environment comprising of a concentration level of flammable/noxious gas which
equals or exceeds the alarm set point.

Page 28
2.3.5 Measurements for this study
The platinum mining sector consists of a large work force underground with a significant amount of
subjects issued with a personal gas sampling device on a daily basis. A total amount of 6633 personal
measurements to CO is taken daily within the working environments underground as compelled by
current legislation within a large mining operation. The use of early warning devices are currently
prescribed by the Mine Health and Safety Act (MHSA) 29 of 1996, Section 11, will be used to assess
exposure to CO on a daily basis with reference to OEL’s.
This study analyzed 9798 records of personal measurements to CO and will contribute to improve
control strategies and procedures aimed at reducing occupational exposure to CO in this work
environment especially looking at the latent effect of CO over a prolonged period.
2.3.6 Risk Ranking Methodology
To prioritise occupations with the biggest risk of over exposure to CO, the risk ranking in Table 3
were used indicating the classification band against the category of occupation. Sample retrieval was
done over three underground shifts of the mine, results were randomly retrieved from the working
shift (7-9 hours) on a daily basis and categorized as per the following risk ranking methodology:
Table 3 Risk Ranking Methodology
Category (of
occupation)
Classification band
A – Red Exposure ≥ than the OEL
B – Orange Exposure ≥ than 50 % the OEL
C – Green Exposure ≥ than 10% the OEL and < 50% of the OEL

Page 29
2.4 Information Gathering and Hazard Characterization
The first step in identifying occupational exposure to CO underground was a thorough identification
of the various occupations with a personal CO monitor allocated as per mandatory code of practice
for flammable gasses. Personal exposure results obtained from an electronic database were
scrutinized against substantial scientific evidence, constituting detrimental health outcomes to CO.
Exposure utilization mainly consisted of comparisons made to OELs and BEI’s for CO. An exposure
assessment tool (Annexure A - Summary calculations and results for a random collection of 20
samples) were utilised to assess the top 10 risk occupations or exposure to CO over a time weighted
average of 8 hours.
The collation of data from the exposure assessment tool were assessed and compared to existing
scientific literature, regulatory OELs, particularly reviewing articles, published books and established
databases listing exposure risk rankings to CO, including long term and short excursions to CO. An
example of the exposure hazard capturing tool is displayed in Table 4, Gas download parameters in a
tabular format as obtained from the gas instrument downloads.

Page 30
Table 4 Gas downloads parameters
In addition to the time weighted average (TWA) sampling conducted utilization of personal data (for
an individual) to determine the individuals daily Time Weighted Average (TWA) to personal CO
exposure concentration were carefully conducted.
In order to predict concentrations, TWA values were determined by obtaining the sum of the
exposure throughout a work shift to CO in relation to parts-per-million and dividing by an eight-hour
period, fig.2 Personal concentration values illustrates the exposure concentrations to a dotted
reference OEL value. The term “8-hour reference period” relates to the procedure whereby the
occupational exposures in any 24-hour period are treated as equivalent to a single exposure for 8
hours (the 8-hour time-weighted average (TWA) exposure).
The 8-hour TWA may be represented mathematically by: C1XT1 + C2XT2 +……Cn x Tn/8 (where C1 is
the occupational exposure and T1 is the associated exposure in any 24 hour period. An example
used from Table 4. Gas download parameters would be calculated as follow; the employee works for
5h22min underground in which the employee is exposed to CO. The average exposure during that
period was measured 5 ppm. The 8-hour TWA therefore would be: 5.22h x 5ppm /8 = 3.2ppm
Personal information
omitted as part of –
privileged
confidentiality
Page 31
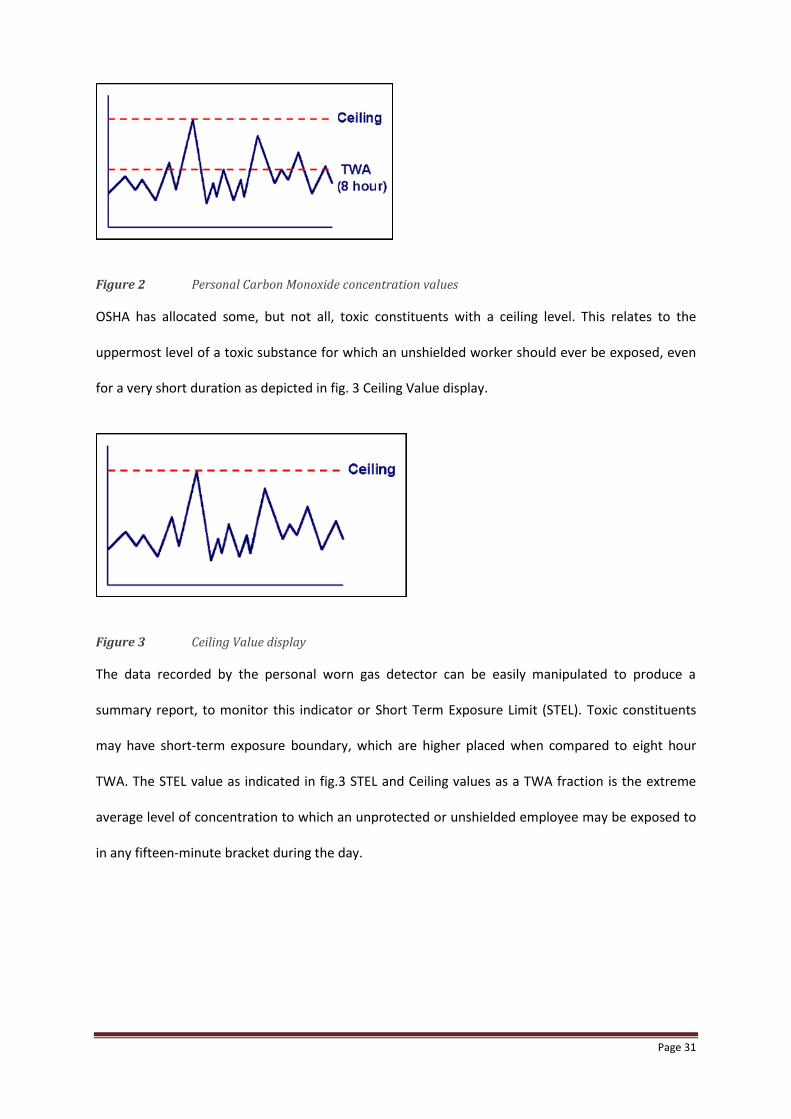
Figure 2 Personal Carbon Monoxide concentration values
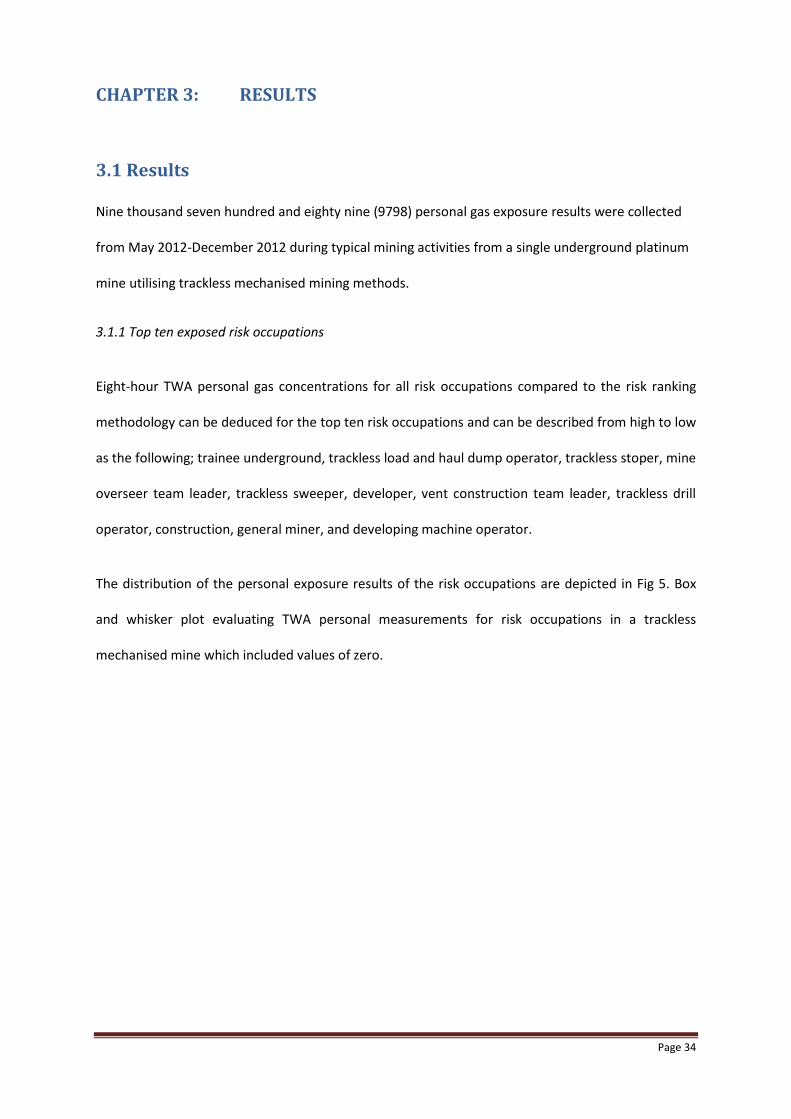
OSHA has allocated some, but not all, toxic constituents with a ceiling level. This relates to the
uppermost level of a toxic substance for which an unshielded worker should ever be exposed, even
for a very short duration as depicted in fig. 3 Ceiling Value display.
Figure 3 Ceiling Value display
The data recorded by the personal worn gas detector can be easily manipulated to produce a
summary report, to monitor this indicator or Short Term Exposure Limit (STEL). Toxic constituents
may have short-term exposure boundary, which are higher placed when compared to eight hour
TWA. The STEL value as indicated in fig.3 STEL and Ceiling values as a TWA fraction is the extreme
average level of concentration to which an unprotected or unshielded employee may be exposed to
in any fifteen-minute bracket during the day.

Page 32
Figure 4 STEL and Ceiling Carbon Monoxide values as a TWA fraction
Any occurrence in which the average STEL level is over the permissible level within a fifteen minute
portion and isolated from each other by at least sixty minutes the OEL-TWA 8 hour is no longer valid
and should not be used.
2. 5 Data Analysis
Descriptive analyses were utilised, deploying the S-PLUS (version 8.1) and SAS System Software
package (version 9.1). To define methods of central tendency and distribution of the measurements,
medians and arithmetic means (AM) were used. Carbon monoxide measurements were assessed
against three reference values: 25 ppm (American Conference of Governmental Industrial Hygienists
Threshold Limit Value); 30 ppm (South African Department of Mineral Resources OEL) 50 ppm (OHSA
RSA).
Exposure levels of CO concentrations can best be defined utilising distributions lognormally. In
addition, box and whisker plots will be used to visually illustrate the spread of the CO concentrations
as well as to compare CO exposures to national and international standards. The broad horizontal
mark is the median, the box end units are the 25 and 75% quartiles and the end of the mark from
the boxes are the minimum and maximum measurements, excluding outliers which are shown as
circles.

Page 33
2.6 Ethical Issues
Permission to use routinely collected mine data was obtained from the mine management. (See
Appendix E). Ethical approval to conduct these analyses was acquired directly at the HREC (Human
Research Ethics Committee-M10105) through the University of the Witwatersrand (see Appendix D).
In the secondary data analysis, general ethical principles of anonymity were upheld by storing data
in the form of case identification, without names or other identifying information. In addition,
results are reported as group results, in order to protect any identifying information.
2.7 Funding
No specific funding was required as all data and collection formed part of an internal programme.
Where necessary the researcher self-funded the costs associated with printing and binding the
document as well as transport-related costs associated with meeting the supervisor.
Page 34
CHAPTER 3: RESULTS
3.1 Results
Nine thousand seven hundred and eighty nine (9798) personal gas exposure results were collected
from May 2012-December 2012 during typical mining activities from a single underground platinum
mine utilising trackless mechanised mining methods.
3.1.1 Top ten exposed risk occupations
Eight-hour TWA personal gas concentrations for all risk occupations compared to the risk ranking
methodology can be deduced for the top ten risk occupations and can be described from high to low
as the following; trainee underground, trackless load and haul dump operator, trackless stoper, mine
overseer team leader, trackless sweeper, developer, vent construction team leader, trackless drill
operator, construction, general miner, and developing machine operator.
The distribution of the personal exposure results of the risk occupations are depicted in Fig 5. Box
and whisker plot evaluating TWA personal measurements for risk occupations in a trackless
mechanised mine which included values of zero.

Page 35
Tra
inee
UG
TM
3L&
H D
Op
TM
3 S
tope
r
Min
e O
ver
TL
TM
3 S
wee
per
Dev
elop
er
Ven
t Con
TL
TM
3 D
rill R
Op
Con
stru
ctio
n
Gen
rl M
iner
D M
achi
ne O
p
Tot
al
010
2030
40
Personal CO exposures (ppm) for 10 highest risk occupationsC
O E
xpos
ures
in p
pm (
TW
A -
8 H
r)
Fig.5. Box and whisker plot evaluating TWA personal concentrations for risk occupations in a
trackless mechanised mine.
The data is displayed in Table 5. Eight-hour TWA personal gas exposures (parts per million) shows
higher exposure for the occupation trainee underground based upon the arithmetic mean of 2.15
ppm compared to 1.26 ppm to that of the least exposed of the ten risk occupation namely the
developing machine operator. The overall arithmetic mean time weighted average (TWA) carbon
monoxide concentration were 1.36 ppm with the median at 0.05 ppm and 95th percentile at 4.33
ppm respectively.

Page 36
Table 5. Eight-hour TWA personal gas exposures (parts per million)
High to
low
position
Occupation Number of
measurements
Minimum Maximum Inter
quartile
range
(IQR)
Arithmetic
mean
Median 95th
percentile
1 Trainee
Underground
341 0 18.90 2.97 2.15 0.56 6.74
2 TM3 Load
Haulage
Dumper
Operator
246 0 12.75 3.36 1.94 0.19 5.41
3 TM3 Stoper 4868 0 102.11 3.22 1.82 0.19 5.26
4 Mine
Overseers
Team Leader
340 0 16.59 2.19 1.66 0.69 3.88
5 TM3
Sweeper
211 0 9.57 2.53 1.54 1.07 4.08
6 Developer 76 0 15.97 1.77 1.50 0.00 4.25
7 Ventilation
Construction
Team Leader
948 0 180.78 3.22 1.36 0.37 3.22
8 TM3 Drill Rig
Operator
301 0 19.46 0.46 1.31 0.00 4.59
9 Construction 205 0 12.81 3.25 1.29 0.86 3.25
10 General
Miner
380 0 15.97 3.50 1.26 0.31 3.50
11 Developing
Machine
1873 0 13.68 1.97 1.26 0.31 3.75

Page 37
Operator
Total 43670 0 409.98 1.88 1.36 0.05 4.33
TWA personal exposure concentrations for all ten occupations are shown in Table 5. Eight-hour TWA
personal gas exposures (parts per million). Imputed data were utilised to determine means and SDs
and TWA measurements for assessment with the exposure values. The risk occupation trainee
underground was measured with the highest concentration exposure over a six month period (0.56
ppm). The eight hour TWA values in Fig.5 indicates a box and whisker plot, the broad horizontal
border is the median, the box borders are the 25 and 75% quartiles and the end of the outlines from
the boxes are the minimum and maximum values, excluding that outliers are shown as narrow
horizontal lines. Personal TWA gas exposures for all risk occupations are shown in Table 5, Eight-
hour TWA personal gas exposures (parts per million). Imputed data were used to calculate
arithmetic means, 95th percentiles and TWA concentrations to compare with the OELs. The
distribution of instantaneous maximum results was higher for the occupation ventilation
construction (180.78 ppm), compared to the highest risk occupation, ventilation trainee (18.90
ppm). For all risk occupations the measured TWA concentrations in Fig. 6 Personal gas exposure
measurement comparisons with OELs displays the median expressed as 0% due to no readings
exceeding the Mine Health and Safety Act’s OELs of 30 ppm. There were also no TWA exceedences
recorded against the Department of Labour (DOL) OEL of 50 ppm and also none of the quantities
surpassed the well-known and often used value of the American Conference of Governmental
Industrial Hygienists (ACGIH) TLV-TWA of 25 ppm.
Substantial portions of the measurement data exceeded the ceiling limit in place of 100 ppm.
Instantaneous personal CO exposures in Table 6 (TWA personal CO exposure as (%) of risk
occupations in an underground mine May 2012-December 2012) identified were moderately low:
only 7% of the measurements exceeded the 25 ppm range for the occupation TM3 stoper with the

Page 38
highest concentrations measured at 4% exceeding 50 ppm for the collective sampling set of
measurements. The occupation ventilation construction team leader ranked 7th highest risk based
with 1% measurements exceeding the 50 ppm bracket.
Tra
ine
e U
G
TM
3L
&H
DO
p
TM
3 S
top
er
Min
e O
ve
r T
L
TM
3 S
we
epe
r
De
ve
lop
er
Ve
nt C
on
TL
TM
3 D
rill R
Op
Co
nstr
uctio
n
Ge
nrl M
ine
r
D M
ach
ine
Op
To
tal
010
20
30
40
50
60
Personal CO exposures (ppm) for 10 highest risk occupations
CO
Exp
osu
res in
pp
m (
TW
A -
8 H
r)
25 ppm30 ppm50 ppm
Fig. 6 Personal gas exposure measurement comparisons with OELs

Page 39
Table 6. TWA personal CO exposure as (%) of risk occupations in an underground mine May 2012-December
2012
High to
low
position
Occupation n Number and
Proportion of
measurements
(%) exceeding 25
ppm
Number and
Proportion of
measurements
(%) exceeding
30 ppm
Number and
Proportion of
measurements
(%) exceeding
50 ppm
Number and
Proportion of
measurements
between 25
and 30 ppm
Number and
Proportion of
measurements
between 35
and 50 ppm
1 Trainee
Underground
341 0 0 0 0 0
2 TM3 Load
Haulage
Dumper
Operator
246 0 0 0 0 0
3 TM3 Stoper 13641 7 (0.05) 5 (0.04) 4 (0.03) 2 (0.02) 1 (0.01)
4 Mine
Overseers
Team Leader
340 0 0 0 0 0
5 TM3 Sweeper 211 0 0 0 0 0
6 Developer 76 0 0 0 0 0
7 Ventilation
Construction
Team Leader
948 1 (0.11) 1 (0.11) 1 (0.11) 0 0
8 TM3 Drill Rig
Operator
701 0 0 0 0 0
9 Construction 205 0 0 0 0 0
10 General Miner 380 0 0 0 0 0
11 Developing
Machine
Operator
1873 0 0 0 0 0
Total 43670 16 (0.04) 12 (0.03) 8 (0.02) 4 (0.01) 4 (0.01)

Page 40
CHAPTER 4: DISCUSSION, CONCLUSION AND RECOMMENDATIONS
4.1 Discussion
The project describes personal underground CO exposure concentrations of ten risk occupations
over a six month period in a South African mechanised mine, and determined whether subjects are
at risk of over-exposure when comparisons are made to various OEL’s. The results have shown that
personal exposure levels over an eight hour equivalent shift compared to two generally used OELs
were exceeded. These levels of over-exposure were however not as great as was expected. The
majority of the time weighted exposure results did not exceed all three applicable OELs for CO
exposure over an hour equivalent.
Measurements exceeding the South African OEL of 30 PPM; 0.03 % total. Additionally from the data
contained in this report it is evident that all of the data utilization scenarios (literature research, field
observations, interviews and data information gathering) can be calculated, reported and utilised in
a Carbon Monoxide Management System. The literature with regards to personal exposure
monitoring is limited but does provide suggestive indications that CO will always be present in
underground mechanized mine emanating from unburnt hydrocarbons. Personal carbon monoxide
exposure ranges from 0 ppm to 40 ppm and confirms a non-risk occupational exposure index when
compared to the time weighted OEL of 30 ppm (Median for total group 0.05). The overall arithmetic
mean of 1.6 ppm was higher than the overall mean personal gas concentration of 0.05 ppm.
Although the highest percentage of proportional measurements were in the brackets between 35
and 50 ppm for the occupation TM3 stoper with the median result that was still far below the OEL
range at 0.19 ppm.
Although the mechanisms for sensible monitoring platforms must take both short and long-term
exposure threats into consideration, it equally remains important to have three independent
exposure measurements and alarm types that must be taken into account for an effective Carbon

Page 41
Monoxide Management Program, i.e.: Ceiling Level (CL), Time Weighted Average (TWA) and Short
Term Exposure Limit (STEL).
It remains imperative to establish the residual quantity of any toxic substance possibly present in the
work environment and also to assess any mixed exposures levels on individuals. The concentrations
and levels of toxic substances present will establish controls to mitigate the risk, procedures and
personal protective equipment, which must be utilised. The best plan of action is to eradicate or
perpetually control exposures through engineering, workplace mitigating controls, ventilation
engineering, or other safety related measures. Employees not protected may not receive exposure
levels of toxic substances, which exceed Permissible Exposure Limit (PEL) concentrations. On-going
observing is necessary to ensure that exposure concentrations have not altered in a way that
necessitates the use of altered or more demanding procedures or equipment.
4.2 The use of existing occupational exposure limits and BEI’Ss
A limitation related particularly to gas exposure assessments within the mining industry is the
reliance on existing occupational exposure limits as a benchmark for acceptable or over-exposure
assessments. The BEIs are usually end of shift values used to identify worksites where over-exposure
may have occurred and to protect susceptible groups. Exceedance of these values should not be
taken to mean that clinical effects - “gassing” in a medical sense - have occurred due to workplace
exposure. Smokers have an average COHb level of 4% and can reach 8% (WHO EHC 213, 1999);
some urban commuters have CO exposure in excess of 35ppm (WHO EHC 213, 1999]; and that COHB
levels and clinical effects have great individual variability at the same CO exposure levels (WHO EHC
213, 1999; ACGIH, 2001). Consequently, exceedance should primarily be used to identify worksites
and practices that lead to possible over-exposure to CO rather than to define workers affected by
CO. This point is made in a number of the background documents to occupational standards.
Clinical observation should not routinely follow exposures above the OEL - TWA or ceiling values as
discussed above. In particular, exceedance of a ceiling value of 100 ppm should not be taken to

Page 42
mean that over exposure to CO has occurred. The ceiling value is a workplace control value to
indicate that potentially dangerous exposure is present so that interventions to reduce exposure can
be implemented or to monitor air levels more closely to ascertain whether they remain high.
As discussed above OELs are not suitable for benchmarks for clinical observation. This is particularly
true for STELs and ceiling values. The uptake of CO and the levels of CO and COHb in blood are a
function of many factors but importantly of physical activity and duration of exposure. Short periods
of exposure at or moderately above the ceiling level of 100 ppm, even with heavy physical activity,
will not result in adverse effects or clinical indications for observation in the majority of workers.
According to Figure 47.1 in Patty’s Toxicology it could take up to 100 minutes at 100 ppm CO
exposure for the average person to reach a COHb level of 5%; and up to 50 minutes at 200ppm
(Leikauf & Prows., 2001).
4.3 Limited research data
The existing research data on underground personal gas exposures is generally scant, particularly as
far as dose-effect relationship studies are concerned. Gas exposure data for underground workers
are often conducted using a data set which is based upon ceiling and acute levels as opposed to a
weighted average with good comparison to existing OELs. The majority of these studies are
retrospective and their accuracy might be affected by recall bias and often does not allow validation
of crucial details regarding the extent and nature of workers’ exposure to various airborne pollutants
which sometimes acts on a cumulative or synergistic basis. This study overcame this limitation by the
use of calibrated sensors to CO and applying correction factors for any cross sensitivities in order to
obtain accurate results to deduce health exposures.
Due to the limited time and resources available for this study only one mine of a possible two
trackless mines in the region were sampled, located in the North West Province and Limpopo
respectively. This could have introduced an element of bias, and although the main working

Page 43
activities are believed to be similar in all, some of the mines utilises different explosives and lower
sulphur diesel which would require additional and unique analyses. Also, the specific shaft layout,
personnel compliments, work volumes and control measures implemented (such as ventilation
systems) are varied and this might impact on the exposure. Some of the limitations related
specifically to the assessment of over exposures to CO were:
Firstly, it is important to note that due to the limited resources available for this study only
preliminary measurements could be conducted as part of this initial appraisal. A large number of
samples, taken over many days and different scenarios, would have been necessary to cater for the
large temporal and spatial variability in chemical concentrations and obtain a more accurate
reflection of the true exposures in this work environment. The assessment conducted during this
study may be regarded as a basic survey with screening level measurements performed in order to
obtain crude quantitative information with the aim of assessing and controlling exposures that
deemed to be unacceptable. In addition, the number of airborne gasses that could be sampled for
was limited, therefore it was decided to focus the attention on those that, following the information
gathering and underground surveys, appeared to present the most obvious risk to reproductive
health and coronary artery disease, namely CO. It is however possible that other toxic gasses, which
were not sampled or analysed for, might be present in this particular work environment (Oxides of
Nitrogen). The underground mining environment currently liberates various different gasses (some
in minute quantities) which could potentially affect upper respiratory problems.
4.4 Conclusion and Recommendations
A potential medical surveillance program can be implemented to monitor exposed subjects
carboxyhemoglobin (COHb) levels, should they be exposed to Carbon Monoxide concentrations as
indicated in the discussion session. The implementation of such a Carbon Monoxide Management
Assistance Tool will require:
Page 44
Additional alarm levels being established and programmed for the Gas Detection
Device (GDI) instrument
Subjects being re-educated on the meaning of the different alarm levels and training
in terms of the correct action to be taken after a specific alarm; and
Near real-time download of the GDI instrument after completion of the working
shift for:
Data calculation and corrective action management purposes, and
Employee submission for medical surveillance purposes.
When linking the subjects exposure history to the employee’s “Medical Records”, care should be
taken not to only record the TWA OEL concentrations but also the following exposure indicators:
Number of times that the STEL (100 ppm for 15 minutes) was exceeded during the day, week,
month, quarter, year or duration of employment history;
Number of times that the STEL value (100 ppm for 15 minutes) exceeded 4 or more times
during the working shift for the last week, month, quarter, year or duration of employment
history;
Number of times that a Carbon Monoxide exposure of > 400 ppm was experienced during the
day, week, month, quarter, year or duration of employment history;
Number of times that a Carbon Monoxide exposure of > 200 ppm was experienced for more
than 15 minutes during the day, week, month, quarter, year or duration of employment history;
Number of times that a Carbon Monoxide exposure of > 100 ppm was experienced for more
than 30 minutes during the day, week, month, quarter, year or duration of employment history;
and
Number of times that a Carbon Monoxide exposure of > 60 ppm was experienced for more than
60 minutes during the day, week, month, quarter, year or duration of employment history.

Page 45
The WMC Environment, Health & Safety Management System make some recommendations to this
regard in their document entitled “Underground Ventilation Major Hazard Standards (MHS-18,
DocsOpen Ref: 57159, 20/06/2001)”. The recommendations included:
a) Employees are not allowed to receive over exposure to the STEL limit constantly for greater
than 15 minutes, or exceeding more than four such stages per work day (page 9 of 18);
b) A short duration of an hour must remain amongst consecutive exposures at the STEL reading
(page 9 of 18);
c) Over exposure greater than the eight-hour TWA of 30 ppm should be sensibly evaluated if a
5% COHb are set as a safe limit (page 10 of 18);
d) The following guidelines reflected in table 7, CO Concentration time exposure, and
evaluation mechanism of short-term duration exposure for Carbon Monoxide is offered as
being (page 10 of 18):
Table 7. CO Concentration time exposure
Concentration value(i)
(ppm)
Exposure duration (ii)
(Minutes)
200
100
60
15
30
60
(i) Short-term durations must never exceed 400 ppm.
(ii) This extent indicates the amount of exposure concentration averaged over the eight-hour
shift, considering no additional source of exposure to carbon monoxide.

Page 46
In addition, data can also be manipulated to assist in the formulation of the following Carbon
Monoxide Management Assistance Tool (see Appendix C, for an example of calculated results) e.g.:
Step 1: Employee shift representative to investigate and rectify conditions should a CO
concentration of 30 PPM (at any one time) be recorded.
Step 2: Employee shift representative to immediately withdraw from the working place (should
the OEL-C (100 PPM) be recorded) for at least 60 minutes, before returning to the working
place to rectify conditions.
Step 3: Employee shift representative to completely withdraw from the working place (for the
remainder of the working shift), should the following Carbon Monoxide concentrations be
experienced:
STEL value (100 ppm for 15 minutes) exceeded 4 or more times during the working shift;
> 400 ppm during any one time during the working shift;
> 200 ppm being experienced for more than 15 minutes during the working shift;
> 100 ppm being experienced for more than 30 minutes during the working shift;
> 60 ppm being experienced for more than 60 minutes during the working shift.
Step 4: A Management investigation will be required, should any of the parameters as indicated in
step 3 be present.
Step 5: A Management investigation will be required should the TWA OEL (30 PPM) be exceeded at
the end of the shift.
The main aim of this study was to classify and evaluate the risk to CO exposure from unburnt
hydrocarbons and explosives used daily underground at a mechanized mine. The intention of
exposure evaluation was also intended to develop a framework (Annexure A and B) that will assist
mine managers to evaluate and prioritise occupational risk to CO when reference is made to national

Page 47
and international limits including biological indices. From the data contained in this report it is
evident that all of the data utilization scenarios (as indicated in the objective) can be calculated,
reported and utilized in a Carbon Monoxide Management System.
Additionally, it should not be assumed that significant occupational exposure has necessarily
occurred as non-occupational exposures may result in COHb values at this level; hence gassing in an
occupational hygiene sense may not have occurred either. As discussed above OELs are not suitable
for benchmarks for clinical observation. This is particularly true for STELs and Ceiling values. The
uptake of CO and the levels of CO and COHb in blood are a function of many factors but importantly
of physical activity and duration of exposure. Short periods of exposure at or moderately above the
Ceiling level of 100 ppm, even with heavy physical activity, will not result in adverse effects or clinical
indications for observation in the majority of workers.
Biological monitoring is well established in the determination of recent exposure to carbon
monoxide (CO) by individuals (EPA, 2000). Two methods are commonly used: measurement of
blood carboxyhemoglobin (COHb); and CO in end-tidal exhaled breath after standardised breath
hold manoeuvre.
COHb in blood is utilised most commonly as biomarker of worker exposure to carbon monoxide
(ACGIH, 2001), especially in clinical settings and hospital environments. Blood COHb levels are exact
and meticulously connected to the devices of toxicity (WHO, 2000). Carbon monoxide is excreted
unaffected through the lungs, as a gas through exhaled air, and has therefore been used in practice
as an indirect measure of COHb. Carbon monoxide in exhalation air offers a swift precise non-
invasive, practicable, inexpensive, screening method that can be used in practice in various
occupational and emergency settings (Jarvis et al., 1980; Jarvis et al., 1986; WHO, 2000) and is
recommended for the use of underground employee over exposure assessments.

Page 48
CO measurement in exhaled air is particularly recommended in settings where rapid collection of
blood and determination of COHb levels is not feasible ideally for use in a mining environment.
Rapid collection of blood is necessary as the elimination half-life of carbon monoxide in blood is 3-5
hours, thus a delay in collecting blood results in underestimates of exposure; and a delay in
determination of COHb levels means that prompt assessment of exposure and institution of
remedial actions are not possible.
CO in exhaled air can be used in occupational settings to overcome the limitations associated with
COHb. Carbon monoxide in end-tidal breath is used in a Biological Monitoring Guidance Value of the
UK’s Health and Safety Executive (HSE, 2011) and is thus an accepted method for biological
screening of carbon monoxide especially in an occupational health setting. The ACGIH (2001) has
also published a BEI for end-exhaled air (the BEI is 20 ppm at end of shift).
The use of CO in end-exhaled air for biological monitoring has a strong scientific basis, has logistical
advantages over COHb and is supported by credible occupational health agencies. Consequently the
researcher is of the opinion that it is suitable for monitoring of exposure to CO provided the issues
that affect reliability are taken care of. Some examples are listed below, but this list is not
exhaustive.
Using this screening test requires caution in interpretation of results as several factors affect validity
of the results namely:
End- tidal-exhaled- air carbon monoxide concentration needs to be measured (i.e. alveolar
concentration). The procedure requires 15-20 seconds of breath holding. Breath needs to be
collected soon after cessation of exposure. The sample should be collected in an environment
removed from external sources of CO.
Admittance for clinical observation when COHb values are around 7% is not recommended. There
are three reasons for this recommendation:
Page 49
(1) Non-occupationally exposed smokers may have COHb levels up to 8% [WHO EHC 213, 1999]
(2) The majority of workers with COHb levels around 7% and even higher will not have clinical
features that require medical intervention
(3) In the absence of poisoning (i.e. significant clinical features) the clinical course following CO
exposure is one of steady improvement and not clinical deterioration making hospital clinical
observation unnecessary in asymptomatic workers or those with mild symptoms e.g. headache with
normal mental status.
As was shown in Table 1, COHb standards less than 7% are common, but these are set to protect
susceptible groups, not to identify individuals for medical intervention. This is because CO does not
poses huge and constant ill health symptoms amongst voluntary subjects with a COHb level below
10% (ACGIH, 2001). Many publications have tables of health effects relative to COHb levels (ILO
Encyclopaedia, 1998; Leikauf & Prows, 2001; ATSDR, 2009; WHO EHC 213, 1999) and all show that
for otherwise healthy non-pregnant subjects levels of COHb between 10 – 20% are associated with
mild symptoms and clinically insignificant neurobehavioral features which do not require hospital-
based medical observation over time.
There are some provisos to this recommendation. The first is where exposure to a mixture of gasses
has occurred. CO exposure may occur with exposure to simple asphyxiants and nitrogen compounds.
In these settings the COHb will underestimate the effects of exposure and clinical deterioration can
occur many hours after exposure to some nitrogen compounds. The second is when the exposed
individual has CAD or is pregnant. Even at COHb levels as low as 3%, workers with CAD may
experience angina on exertion and at around 6% have increased ventricular arrhythmias. Workers
with CAD and an elevated COHb level should be screened by a physician to determine whether
admittance for observation is indicated. Pregnant women with elevated CO levels should also be

Page 50
screened by a doctor to elicit symptoms as symptomatic pregnant workers should be considered for
oxygen therapy

Page 51
REFERENCES
ACGIH Worldwide (2001) Documentation of Biological Exposure indices. 7th Ed. Cincinnati, Ohio
U.S. DEPARTMENT OF HEALTH AND HUMAN SERVICES, PUBLIC HEALTH SERVICES. (2009) Draft:
Toxicological Profile for Carbon Monoxide. Atlanta City
AMERICAN CONFERENCE OF GOVERNMENTAL INDUSTRIAL HYGIENISTS. (2000) TLVS and BEI’s:
Based on the Documentation of the Threshold Limit Values for Chemical Substances and Physical
Agents and Biological Exposure Indices
APTE, M.G., COX, D.D. & HAMMOND, K. (1999) A new carbon monoxide occupational dosimeter:
results from a worker exposure assessment survey. Journal of exposure analysis and Environmental
Epidemiology. 9.p.546-559
BAKKE, B., ULVESTAD, B. & STEWART, P. (2004) Cumulative exposure to dust and gasses as
determinants of lung function decline in tunnel construction workers. Occupational and
Environmental Medicine. (61). p.262-269
BOLT, H.M. (2012) The MAK Collection for Occupational Health and Safety.
CORRADI, M. & MUTTI, A. (2005) Exhaled Breath Analysis: Occupational to Respiratory Medicine.
Acta Bio-medica. 76(2). p.20-29.
ELIZABETH, N., ALLRED, B., BLEECKER, R., CHAITMAN, R. & DAHMS, T. (1991) Effects of Carbon
Monoxide on Myocardial Ischemia. Environmental health perspective. 91. p.89-132
De SOUZA, M.E. & KATSABANIS, P.D. (1991) On the prediction of blasting fumes and dilution
ventilation. Mining Science and Technology. 91(2).p.223-225
EXPLOSIVES AND ROCK BLASTING (1988) Field Technical Operations. Atlas Powder Company,
International Journal of Mining and Geological Engineering, 1990, 8 87-89

Page 52
GULUMAIN, M., MASOKA, X., & SCHUTTE, P.C. (2007) Exposure to and effects of carbon monoxide in
deep underground mines Mine Health and Safety Council. SIM 05 06 01. 2007
HEALTH AND SAFETY EXECUTIVE. (2011) Workplace exposure limits. 2nd Ed. London, United Kingdom.
HOFFMAN, R.S. et al. (2007) Goldfrank’s Manual of Toxicological Emergencies. New York: McGraw
Hill.
THE HEALTH AND SAEFTY LABORATORY Guidance sheet for: Method for Monitoring Carbon
Monoxide Breath Carbon Monoxide. [Online] Available from
http://www.hsl.gov.uk/media/66149/carbon%20monoxide_layout%201
INDUSTRIAL ACCIDENT PREVENTION ASSOCIATION. (1998) Carbon Monoxide in the Workplace.
Industrial Accident Prevention Association 2008.
JARVIS, M., BELCHER, M., VESEY, C. & HUTCHISON, D.C.S. (1986) Low cost carbon monoxide
monitors in smoking assessment. Thorax. 41.p.886-887
JARVIS, M., RUSSELL, M.A.H. & SALOOJEE, Y. (1980) Expired air carbon monoxide: a simple breath
test of tobacco smoke intake. British Medical Journal. 281.p.484-485
KURT, T.L., ANDERSON, R.J. & REED, W.G. (1990) Rapid Estimation of carboxyhaemoglobin by breath
sampling in an emergency setting. Veterinary and human toxicology. 32.p.227-229
LEIKAUF, G.D. & PROWS, D.R. (2001) Inorganic Compounds of Carbon, Nitrogen and Oxygen. New
York: John Wiley & Sons
LLOYD, W.G. & ROWE, D.R. (1999) Estimation of carboxyheamoglobin. Environmental Science &
Technology. 33.p.782-785
PELHAM, T.W, HOLT, L.E. & MOSS, M.A. (2002) Exposure to Carbon Monoxide and Nitrogen Dioxide
in enclosed ice arenas. Occupational and Environmental Medicine. 59(4).p.224-233
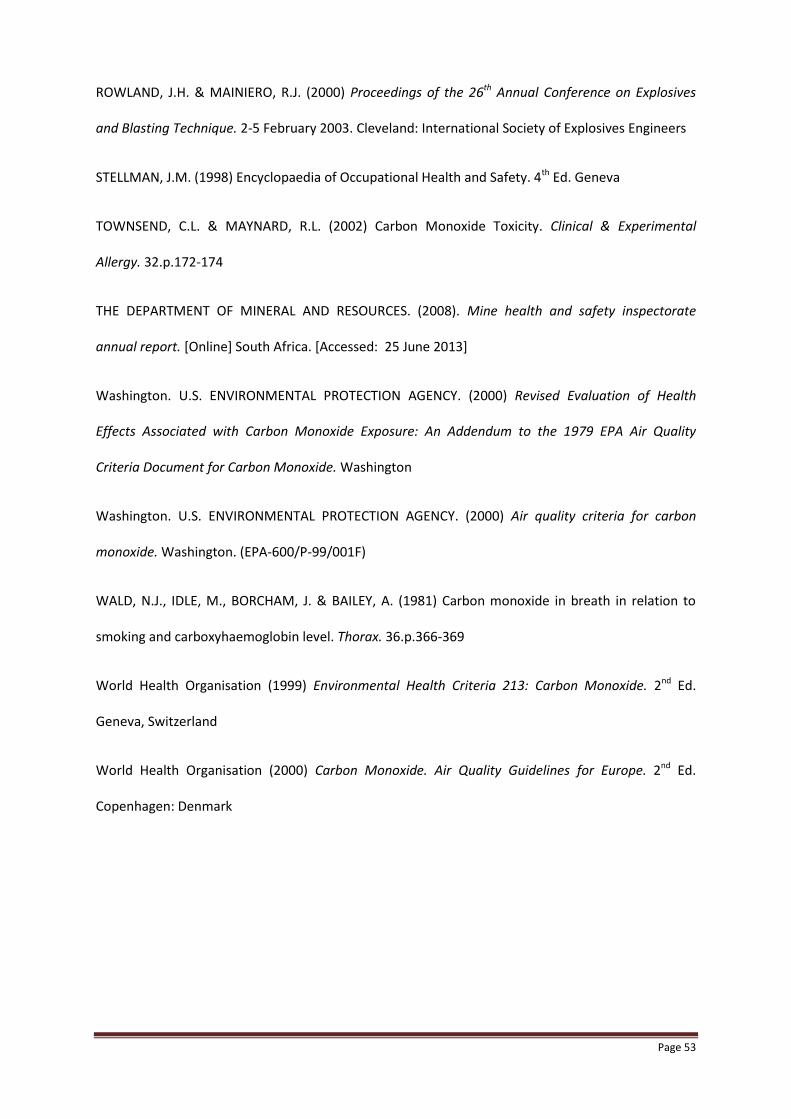
Page 53
ROWLAND, J.H. & MAINIERO, R.J. (2000) Proceedings of the 26th Annual Conference on Explosives
and Blasting Technique. 2-5 February 2003. Cleveland: International Society of Explosives Engineers
STELLMAN, J.M. (1998) Encyclopaedia of Occupational Health and Safety. 4th Ed. Geneva
TOWNSEND, C.L. & MAYNARD, R.L. (2002) Carbon Monoxide Toxicity. Clinical & Experimental
Allergy. 32.p.172-174
THE DEPARTMENT OF MINERAL AND RESOURCES. (2008). Mine health and safety inspectorate
annual report. [Online] South Africa. [Accessed: 25 June 2013]
Washington. U.S. ENVIRONMENTAL PROTECTION AGENCY. (2000) Revised Evaluation of Health
Effects Associated with Carbon Monoxide Exposure: An Addendum to the 1979 EPA Air Quality
Criteria Document for Carbon Monoxide. Washington
Washington. U.S. ENVIRONMENTAL PROTECTION AGENCY. (2000) Air quality criteria for carbon
monoxide. Washington. (EPA-600/P-99/001F)
WALD, N.J., IDLE, M., BORCHAM, J. & BAILEY, A. (1981) Carbon monoxide in breath in relation to
smoking and carboxyhaemoglobin level. Thorax. 36.p.366-369
World Health Organisation (1999) Environmental Health Criteria 213: Carbon Monoxide. 2nd Ed.
Geneva, Switzerland
World Health Organisation (2000) Carbon Monoxide. Air Quality Guidelines for Europe. 2nd Ed.
Copenhagen: Denmark

Page 54
Appendix A – Summary calculations and results for a random selection of 20 samples.
Sample Number 11 12 13 14 15 16 17 18 19 20
Instrument Serial Number 17723 10350 10350 10350 10350 10350 10350 17010 17010 17010
Date of sampling 2012/01/26 2012/01/12 2012/01/13 2012/01/18 2012/01/19 2012/01/20 2012/01/21 2012/02/03 2012/02/04 2012/02/05
CO TWA (ppm) for shift 14.53 52.69 0.20 #VALUE! 9.13 9.75 2.38 3.49 7.29 1.95
CO OEL (30 ppm) 30 30 30 30 30 30 30 30 30 30
% of TWA OEL (30 ppm) per shift 48.44% 175.65% 0.66% #VALUE! 30.44% 32.51% 7.92% 11.63% 24.31% 6.51%
No. of times the OEL-C Has been exceeded. 0 18 0 0 0 0 0 0 1 0
Sample Number 1 2 3 4 5 6 7 8 9 10
Instrument Serial Number 10340 10350 10350 10350 10350 17723 17723 17723 17723 17723
Date of sampling 2012/01/04 2012/01/06 2012/01/07 2012/01/08 2012/01/10 2012/01/19 2012/01/21 2012/01/22 2012/01/24 2012/01/25
CO TWA (ppm) for shift 3.37 12.61 2.12 3.80 5.95 113.65 24.87 9.00 12.62 19.76
CO OEL (30 ppm) 30 30 30 30 30 30 30 30 30 30
% of TWA OEL (30 ppm) per shift 11.2% 42.0% 7.07% 12.68% 19.85% 378.82% 82.90% 30.01% 42.06% 65.88%
No. of times the OEL-C Has been exceeded. 0 0 0 0 0 75 5 0 0 0

Page 55
Appendix B – Summary of exposure indicators for a random selection of 20 samples.
Haemoglobin Test (Number of results): 1 2 3 4 5 6 7 8 9 10
Instrument Serial Number 10340 10350 10350 10350 10350 17723 17723 17723 17723 17723
Date of sampling 2012/01/04 2012/01/06 2012/01/07 2012/01/08 2012/01/10 2012/01/19 2012/01/21 2012/01/22 2012/01/24 2012/01/25
Concentration > 30 ppm exceeded "n" times 0 0 0 0 1 154 111 6 18 32
TWA OEL (30 ppm) exceeded 0 0 0 0 0 1 0 0 0 0
OEL-C (100 ppm) Exceeded "n" times 0 0 0 0 0 75 5 0 0 0
STEL (100 ppm for 15 Minutes) exceeded "n" times 0 0 0 0 0 26 0 0 0 0
Concentration > 400 ppm exceeded "n" times 0 0 0 0 0 51 0 0 0 0
Concentration > 200 ppm for 15 minutes exceeded "n" times 0 0 0 0 0 26 0 0 0 0
Concentrations > 100 ppm for 30 minutes exceeded "n" times 0 0 0 0 0 3 0 0 0 0
Concentrations > 60 ppm for 60 minutes exceeded "n" times 0 0 0 0 0 0 0 0 0 0
Haemoglobin Test (Number of results): 11 12 13 14 15 16 17 18 19 20
TWA OEL (30 ppm) exceeded 17723 10350 10350 10350 10350 10350 10350 17010 17010 17010
OEL-C (100 ppm) Exceeded "n" times 2012/01/26 2012/01/12 2012/01/13 2012/01/18 2012/01/19 2012/01/20 2012/01/21 2012/02/03 2012/02/04 2012/02/05
Concentration > 30 ppm exceeded "n" times 0 504 0 0 0 0 8 20 5 0

Page 56
TWA OEL (30 ppm) exceeded 0 1 0 #VALUE! 0 0 0 0 0 0
OEL-C (100 ppm) Exceeded "n" times 0 18 0 0 0 0 0 0 1 0
STEL (100 ppm for 15 Minutes) exceeded "n" times 0 0 0 0 0 0 0 0 0 0
Concentration > 400 ppm exceeded "n" times 0 0 0 0 0 0 0 0 1 0
Concentration > 200 ppm for 15 minutes exceeded "n" times 0 0 0 0 0 0 0 0 0 0
Concentrations > 100 ppm for 30 minutes exceeded "n" times 0 0 0 0 0 0 0 0 0 0
Concentrations > 60 ppm for 60 minutes exceeded "n" times 0 0 0 0 0 0 0 0 0 0
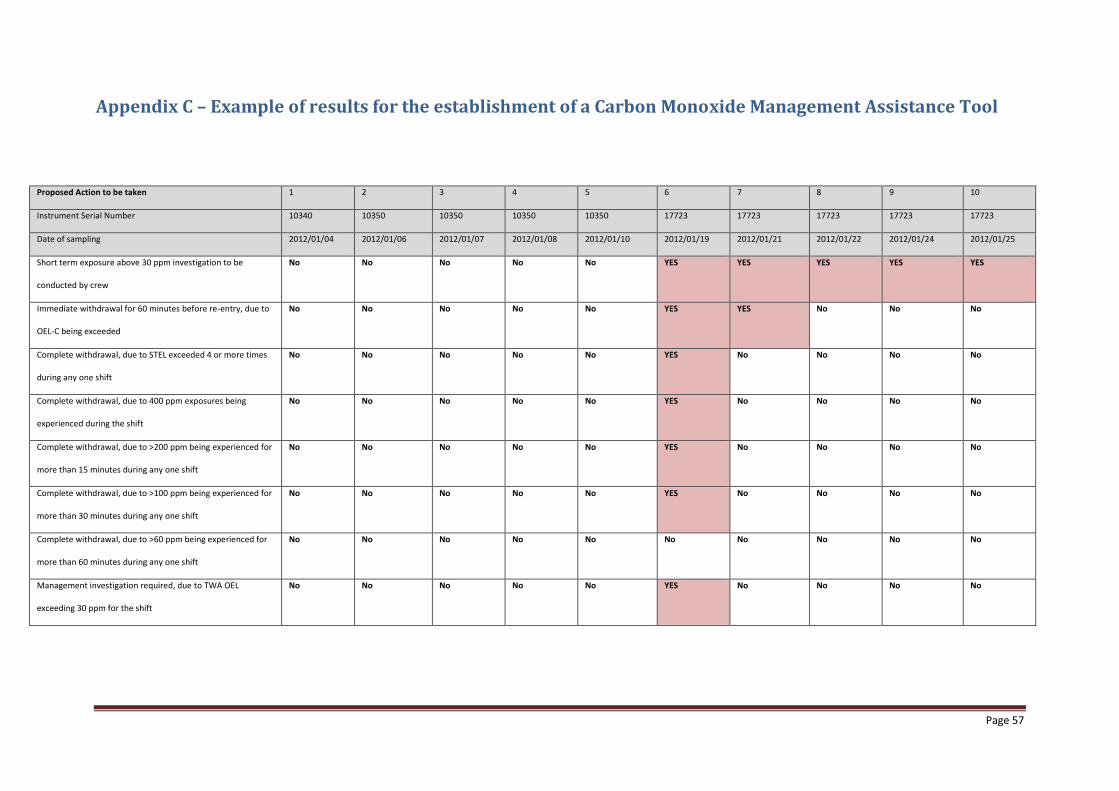
Page 57
Appendix C – Example of results for the establishment of a Carbon Monoxide Management Assistance Tool
Proposed Action to be taken 1 2 3 4 5 6 7 8 9 10
Instrument Serial Number 10340 10350 10350 10350 10350 17723 17723 17723 17723 17723
Date of sampling 2012/01/04 2012/01/06 2012/01/07 2012/01/08 2012/01/10 2012/01/19 2012/01/21 2012/01/22 2012/01/24 2012/01/25
Short term exposure above 30 ppm investigation to be
conducted by crew
No No No No No YES YES YES YES YES
Immediate withdrawal for 60 minutes before re-entry, due to
OEL-C being exceeded
No No No No No YES YES No No No
Complete withdrawal, due to STEL exceeded 4 or more times
during any one shift
No No No No No YES No No No No
Complete withdrawal, due to 400 ppm exposures being
experienced during the shift
No No No No No YES No No No No
Complete withdrawal, due to >200 ppm being experienced for
more than 15 minutes during any one shift
No No No No No YES No No No No
Complete withdrawal, due to >100 ppm being experienced for
more than 30 minutes during any one shift
No No No No No YES No No No No
Complete withdrawal, due to >60 ppm being experienced for
more than 60 minutes during any one shift
No No No No No No No No No No
Management investigation required, due to TWA OEL
exceeding 30 ppm for the shift
No No No No No YES No No No No
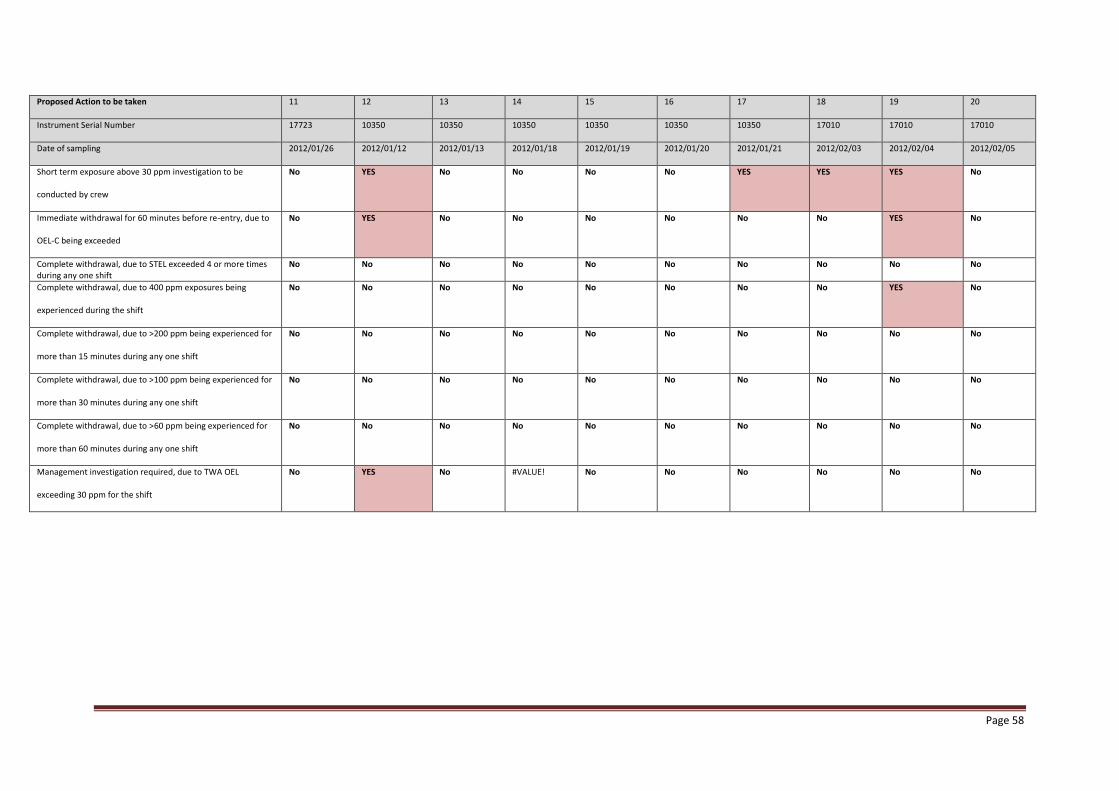
Page 58
Proposed Action to be taken 11 12 13 14 15 16 17 18 19 20
Instrument Serial Number 17723 10350 10350 10350 10350 10350 10350 17010 17010 17010
Date of sampling 2012/01/26 2012/01/12 2012/01/13 2012/01/18 2012/01/19 2012/01/20 2012/01/21 2012/02/03 2012/02/04 2012/02/05
Short term exposure above 30 ppm investigation to be
conducted by crew
No YES No No No No YES YES YES No
Immediate withdrawal for 60 minutes before re-entry, due to
OEL-C being exceeded
No YES No No No No No No YES No
Complete withdrawal, due to STEL exceeded 4 or more times during any one shift
No No No No No No No No No No
Complete withdrawal, due to 400 ppm exposures being
experienced during the shift
No No No No No No No No YES No
Complete withdrawal, due to >200 ppm being experienced for
more than 15 minutes during any one shift
No No No No No No No No No No
Complete withdrawal, due to >100 ppm being experienced for
more than 30 minutes during any one shift
No No No No No No No No No No
Complete withdrawal, due to >60 ppm being experienced for
more than 60 minutes during any one shift
No No No No No No No No No No
Management investigation required, due to TWA OEL
exceeding 30 ppm for the shift
No YES No #VALUE! No No No No No No
Page 59
Appendix D – Ethical Approval

Page 60
Appendix E – Permission Letter from Employer