exploring the uk freelance workforce in 2015 · the size of the uk freelance workforce freelance...
TRANSCRIPT
Exploring the UK Freelance Workforce in 2015 John Kitching April 2016
Contents
Executive Summary
Introduction
Defining Freelance Status
The Size of the UK Freelance Workforce
Freelance Entry and Exit
Occupational Profile
Industry Profile
Freelancing and Gender
Freelance Mothers
Older and Younger Freelancers
Self-Employment Duration
Educational Qualifications
Training
Descriptions of Self-Employed Status
Region of Usual Residence
Working From Home and Travel to Work Time
Contribution to Business Turnover
Conclusion
Appendix 1: Methodological Approach
Appendix 2: Data Tables
References
i
1
1
3
5
6
10
11
15
16
17
18
19
20
22
23
25
26
27
30
33
i
Executive Summary
IntroductionFreelance workers are an important, but hidden, part of the small business population. United Kingdom’s (UK) official statistics do not classify workers explicitly as freelancers, but their numbers can be estimated using Labour Force Survey (LFS) categories. This report presents quantitative data on freelancer numbers and their personal and work characteristics as at Q2, 2015.
No official, or widely accepted, definition of freelance status exists in the UK. The term ‘freelance’ is not a legal concept but, rather, a customary one used to describe particular kinds of worker or work relationship in particular occupational or industry settings. We define freelancers as genuine business owners without employees working in a range of creative, managerial, professional, scientific and technical occupations.
UK Freelance Workforce SizeLFS data suggest there are an estimated 1.91 million freelance workers in the UK. This figure comprises 1.65m working freelance in main jobs and a further 255,000 working freelance in second jobs; 13 per cent of all freelancers work freelance in a second job. Freelance workers constitute 6 per cent of all UK workers in employment.
Since 2008, freelancer numbers have increased from 1.40m to 1.91m, a rise of 36 per cent. This was a period of prolonged economic uncertainty precipitated by the global financial crisis of 2008-9. During the period, unemployment increased by almost 50 per cent before then falling by a third. Similarly, employment decreased sharply before turning upward. Freelance working has continued to rise throughout the period, suggesting that macroeconomic circumstances exert an influence on the demand for, and supply of, freelance workers. The benefits to end-users of hiring freelancers continue to be evident with the economic upturn.
Flows into, and out of, freelance working are an enduring feature of labour market activity in the UK. Individuals enter, and exit, freelancing as work opportunities enable or constrain job choices, and/or as individuals’ preferences change. Freelance working is a ‘high-churn’ activity, with high levels of entry and exit. LFS data suggest that 72 per cent of those working freelance in main jobs in April-June 2015 were also freelancing a year previously, while 28 per cent were newcomers. Turning to those working freelance in 2014, 73 per cent remained freelancing in main jobs a year later. Overall, therefore, the freelance workforce is one of considerable churn with sizeable flows into, and out of, this way of working.
Occupational Profile Freelancers have a widespread, though uneven, presence across major occupational groups. This is partly for historical reasons – where occupations have traditionally been organised on a freelance basis – and partly because, more recently, employers have externalised jobs to achieve greater flexibility and cost savings, and to manage risk better in fast-changing market environments. Associate professional and technical occupations include 784,000 freelance workers, (41 per cent of the freelance workforce). This diverse group includes writers, artists and musicians, science and engineering technicians, sports and fitness occupations, and protective service occupations. There are 686,000 freelance workers (36 per cent) in professional occupations and a further 437,000 (23 per cent) work in managerial occupations.
Freelance workers are present in all 43 minor occupation groups covered by the LFS. The largest freelance groups are artistic, literary and media occupations with 328,000 freelancers (17 per cent), managers and proprietors in other services with 222,000 freelancers (12 per cent), and teaching and education professionals with 139,000 freelancers (7 per cent). These three occupational groups continue to be the most important numerically; they now constitute more than a third of all freelance workers.
Occupations vary in the proportion of workers working freelance. Among LFS minor occupational groups with more than 30,000 freelancers, artistic, literary and media occupations are, by far, the most likely to be undertaken freelance; two thirds of workers in this group do so. Four in ten of all people working in sports and fitness occupations also work freelance. At the other end of the scale, fewer than one in ten teaching and educational professionals, public services and other associate professionals, and sales, marketing and related associate professionals work on a freelance basis.
Trends in the occupational profile of freelance workers are highly variable. Some occupational groups have expanded substantially while others have decreased, although changes in classification mean that assessments of occupational change should be conducted carefully. Freelancer numbers more than doubled in artistic, literary and media occupations and in sports and fitness occupations over the 2008-15 period, while therapy professionals declined by almost half.
ii
Industry ProfileFreelance workers are present in all major industry groups covered by the LFS. Freelance workers are strongly represented in the professional, scientific and technical activities industry (20 per cent), with 384,000 people. High numbers are also found in the education, and health and social work (21 per cent), arts, entertainment and recreation (12 per cent) and in information and communication (10 per cent) industries. Almost two thirds of all freelancers work in these four industry groups.
Industries with high proportions of freelancers tend to rely heavily on occupations that are commonly organised on a freelance basis, for example, artistic, literary and media occupations. Particular industries and sectors have historically drawn upon freelance labour more than others.
Freelance Working and GenderSix in ten freelancers are male, a higher proportion than among employees in comparable occupations (in SOC major groups 1 to 3). It would be interesting to explore whether this is because men have better access to the resources required to enter, and sustain, both freelance and senior employment positions and/or stronger preferences for freelance working.
Freelancers’ occupational profiles vary by gender. Women are more highly represented in associate professional and technical occupations, where 44 per cent are women; in managerial and professional occupations, the figures are 36 and 38 per cent respectively. This is consistent with research concerning the sex-typing of specific occupations and the barriers women experience in accessing jobs in management and the higher professions.
The number of mothers working as freelancers is 287,000, 15 per cent of all freelancers. This number has increased 70 per cent since 2008, approximately double the rate of increase in the freelance workforce as a whole. This continues the trend towards increased self-employment among women evident for the past two decades.
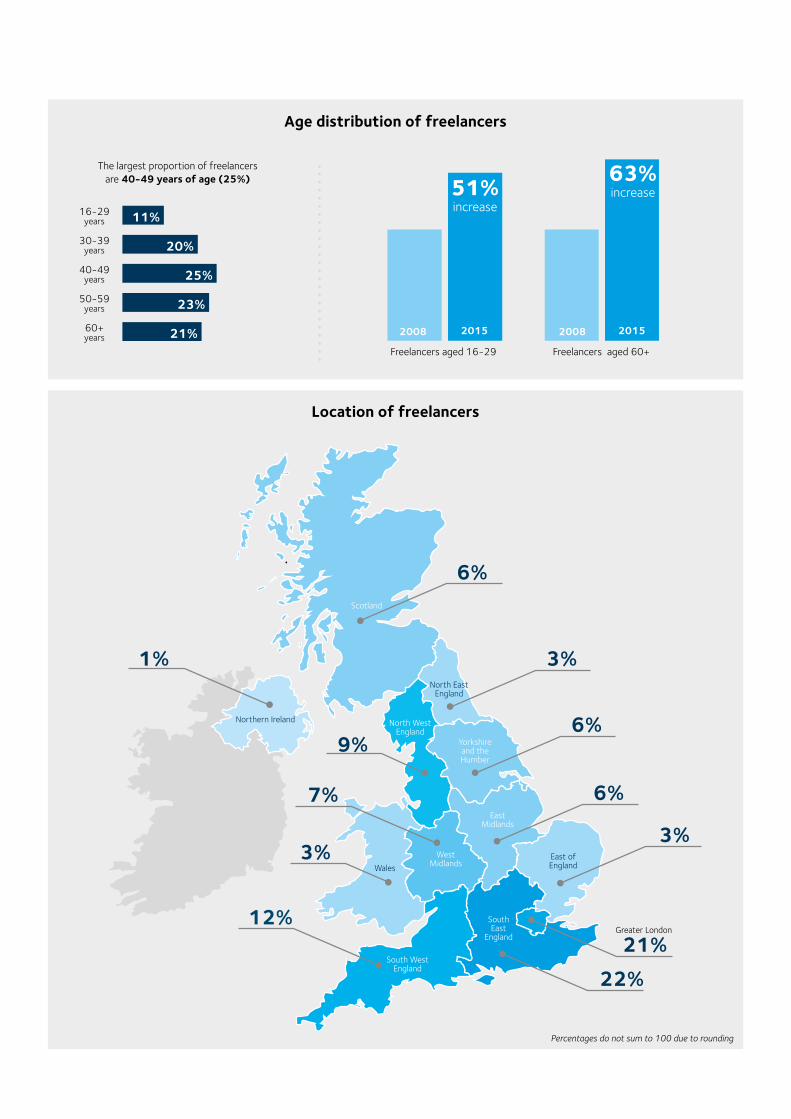
Older and Younger Freelancers Freelancers aged 60 and older comprise 21 per cent of the stock of freelance workers, a marginally higher proportion than in 2008. Men and women of retirement age who undertake paid work are more likely to do so as self-employed rather than as employees, in comparison with younger workers. Older individuals often choose self-employment for both economic and non-economic reasons and to avoid ageism in employment. In the context of rising life expectancy, the abolition of the Default Retirement Age, inadequate pension provision and planned increases in State Pensionable Age, the number of freelancers aged over 60 might be expected to increase in the coming years.
Younger freelancers aged 16-29 comprise just over one in ten of the freelance workforce. Younger freelancers are more likely to be over-represented among freelancers working in second jobs, among women and among those working in associate professional and technical occupations (SOC 3). Young freelancers are particularly concentrated in sports and fitness occupations where they constitute 33 per cent of this occupational group.
iii
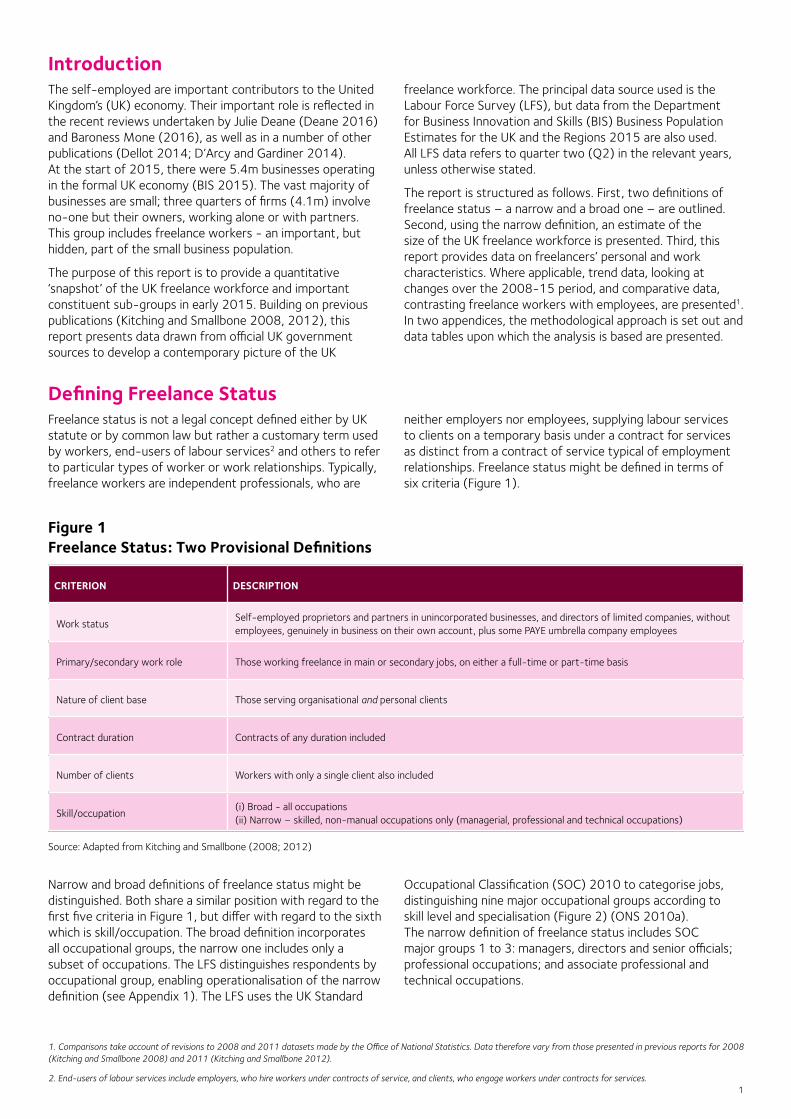
Descriptions of Self-Employed Status Freelance workers are much more likely to define themselves as ‘working for themselves’ than ‘doing freelance work’. More than two thirds self-report as ‘working for themselves’ in main jobs, while fewer than a quarter report ‘doing freelance work’. This is likely to reflect two influences: first, the high proportion of individuals working as sole proprietors without employees, or as sole directors of limited companies. More than three quarters of the UK business stock comprise businesses with no employees.
A second influence is the occupational/industrial norms influencing how the self-employed without employees are described in particular work settings. It is interesting to note that of those in main jobs, 53 per cent of media professionals, 43 per cent of those in design occupations and 41 per cent of those in artistic, literary and media occupations described themselves as ‘doing freelance work’. These are occupations where the term freelance is customarily used to refer to self-employed workers without employees.
Self-Employment DurationDespite being a population believed to be subject to high levels of churn, 16 per cent of freelance workers report first becoming self-employed more than 20 years ago and 35 per cent report becoming self-employed more than 10 years ago. This high level of stability among a large subset of the self-employed population suggests both a strong preference for self-employment and might indicate that churn is a feature of particular subsets of the self-employed rather than characteristic of the entire population.
Education and TrainingFreelance workers and comparable employees (in SOC major groups 1 to 3) are educated to an equivalent level. More than two thirds of both groups are qualified to NQF Level 4 (post-compulsory schooling qualifications).
Continuing training and development is important for freelancers in order to keep abreast of technological, economic, legal and other issues in their respective occupational fields. There were large differences in the number of freelance workers and comparable employees reporting job-related training or education (during the previous four week period and the previous three month period). Only about half the proportion of freelancers undertook such training: 18 per cent of freelancers compared to 33 per cent of employees reported training in the previous three months. The pattern of learning and training activity raises questions about whether freelancers engage in sufficient learning and training activity to support their skill development needs.
Freelance Workers’ Contribution to Business TurnoverIt is possible to provide a speculative estimate of the economic contribution freelance workers make to the UK economy. Businesses without employees (excluding financial intermediation) contributed an estimated £237 billion in sales in 2015, or approximately 6 per cent of private sector turnover.
Approximately 46 per cent of businesses without employees are freelancer-owned: 1.84m freelancers, of a wider group of 4.08m (excluding financial intermediation). If freelance workers contribute to turnover proportionate to their presence in the wider group of businesses without employees, their collective sales would be approximately £109bn.
Freelancer-owned businesses might be expected to generate greater revenues than other own-account businesses, owing to the more valuable knowledge and skills exercised, suggesting a slightly higher turnover figure, perhaps £120-125bn, approximately 3-4 per cent of business turnover.
ConclusionFreelance workers continue to be an important component of the UK labour force, enabling organisational clients in a wide variety of industries and occupational settings to adapt labour practices flexibly to meet operational requirements. The continued expansion of the freelance workforce indicates that access to a pool of suitably-skilled and motivated workers remains highly valued by organisational end-users. Growth in freelancer numbers has continued unabated during both the global financial crisis of 2008-9 and the subsequent economic upturn.
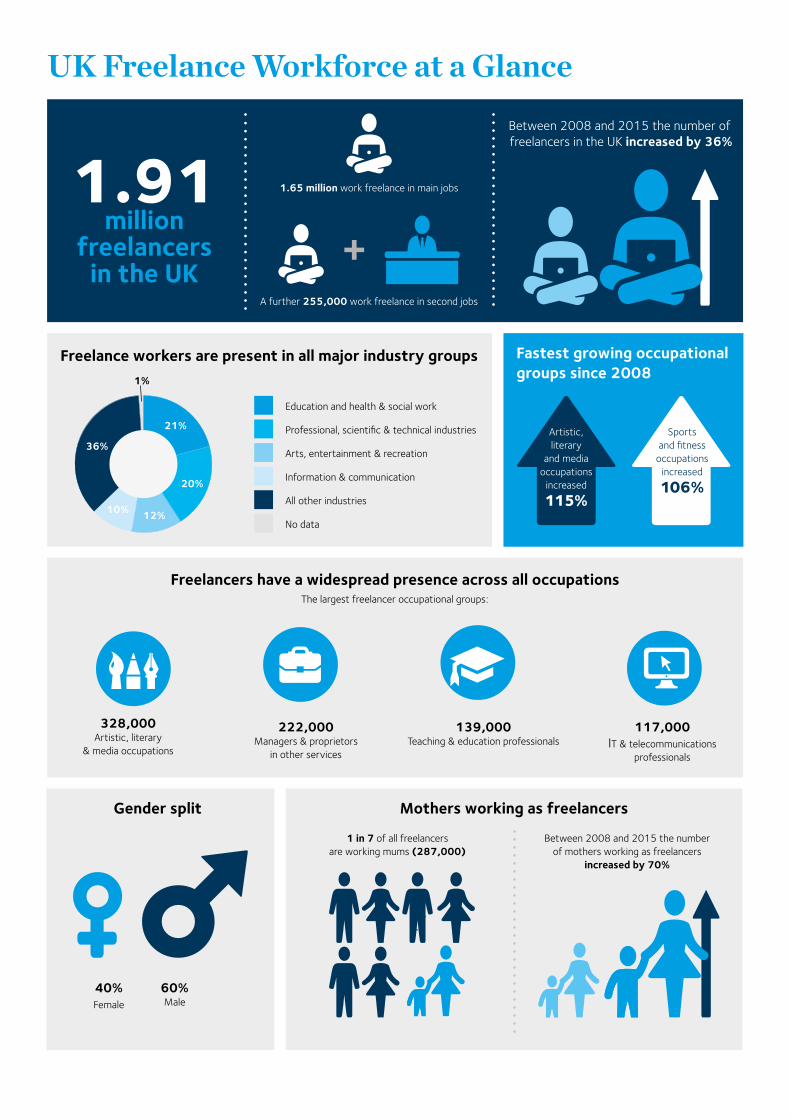
Freelancers have a widespread presence across all occupations
Gender split
UK Freelance Workforce at a Glance
Mothers working as freelancers
Freelance workers are present in all major industry groups
60% Male
40% Female
The largest freelancer occupational groups:
328,000 Artistic, literary
& media occupations
222,000 Managers & proprietors
in other services
139,000 Teaching & education professionals
117,000 IT & telecommunications
professionals
1.91
million freelancers
in the UK
1.65 million work freelance in main jobs
A further 255,000 work freelance in second jobs
Between 2008 and 2015 the number of freelancers in the UK increased by 36%
1 in 7 of all freelancers are working mums (287,000)
Between 2008 and 2015 the number of mothers working as freelancers
increased by 70%
Education and health & social work
Professional, scientific & technical industries
Arts, entertainment & recreation
Information & communication
All other industries
Artistic, literary
and media occupations
increased
115%
Fastest growing occupational groups since 2008
Sports and fitness
occupations increased
106%
No data
36%
21%
20%
12%10%
1%
12%
6%
3%
6%
7% 6%
21%
22%
3%
South West England
Scotland
North East England
North West England
Yorkshire and the Humber
Wales
West Midlands
East Midlands
Greater LondonSouth East
England
East of England
9%
3%
1%
Northern Ireland
Location of freelancers
Age distribution of freelancers
11%
20%
25%
23%
21%
16-29 years
30-39 years
40-49 years
50-59 years
60+ years
The largest proportion of freelancers are 40-49 years of age (25%)
Freelancers aged 16-29 Freelancers aged 60+
51% increase
63% increase
2008 2015 2008 2015
Percentages do not sum to 100 due to rounding
1
Introduction The self-employed are important contributors to the United Kingdom’s (UK) economy. Their important role is reflected in the recent reviews undertaken by Julie Deane (Deane 2016) and Baroness Mone (2016), as well as in a number of other publications (Dellot 2014; D’Arcy and Gardiner 2014). At the start of 2015, there were 5.4m businesses operating in the formal UK economy (BIS 2015). The vast majority of businesses are small; three quarters of firms (4.1m) involve no-one but their owners, working alone or with partners. This group includes freelance workers - an important, but hidden, part of the small business population.
The purpose of this report is to provide a quantitative ‘snapshot’ of the UK freelance workforce and important constituent sub-groups in early 2015. Building on previous publications (Kitching and Smallbone 2008, 2012), this report presents data drawn from official UK government sources to develop a contemporary picture of the UK
freelance workforce. The principal data source used is the Labour Force Survey (LFS), but data from the Department for Business Innovation and Skills (BIS) Business Population Estimates for the UK and the Regions 2015 are also used. All LFS data refers to quarter two (Q2) in the relevant years, unless otherwise stated.
The report is structured as follows. First, two definitions of freelance status – a narrow and a broad one – are outlined. Second, using the narrow definition, an estimate of the size of the UK freelance workforce is presented. Third, this report provides data on freelancers’ personal and work characteristics. Where applicable, trend data, looking at changes over the 2008-15 period, and comparative data, contrasting freelance workers with employees, are presented1. In two appendices, the methodological approach is set out and data tables upon which the analysis is based are presented.
Defining Freelance StatusFreelance status is not a legal concept defined either by UK statute or by common law but rather a customary term used by workers, end-users of labour services2 and others to refer to particular types of worker or work relationships. Typically, freelance workers are independent professionals, who are
neither employers nor employees, supplying labour services to clients on a temporary basis under a contract for services as distinct from a contract of service typical of employment relationships. Freelance status might be defined in terms of six criteria (Figure 1).
CRITERION DESCRIPTION
Work status Self-employed proprietors and partners in unincorporated businesses, and directors of limited companies, without employees, genuinely in business on their own account, plus some PAYE umbrella company employees
Primary/secondary work role Those working freelance in main or secondary jobs, on either a full-time or part-time basis
Nature of client base Those serving organisational and personal clients
Contract duration Contracts of any duration included
Number of clients Workers with only a single client also included
Skill/occupation(i) Broad - all occupations (ii) Narrow – skilled, non-manual occupations only (managerial, professional and technical occupations)
Figure 1 Freelance Status: Two Provisional Definitions
Source: Adapted from Kitching and Smallbone (2008; 2012)
Narrow and broad definitions of freelance status might be distinguished. Both share a similar position with regard to the first five criteria in Figure 1, but differ with regard to the sixth which is skill/occupation. The broad definition incorporates all occupational groups, the narrow one includes only a subset of occupations. The LFS distinguishes respondents by occupational group, enabling operationalisation of the narrow definition (see Appendix 1). The LFS uses the UK Standard
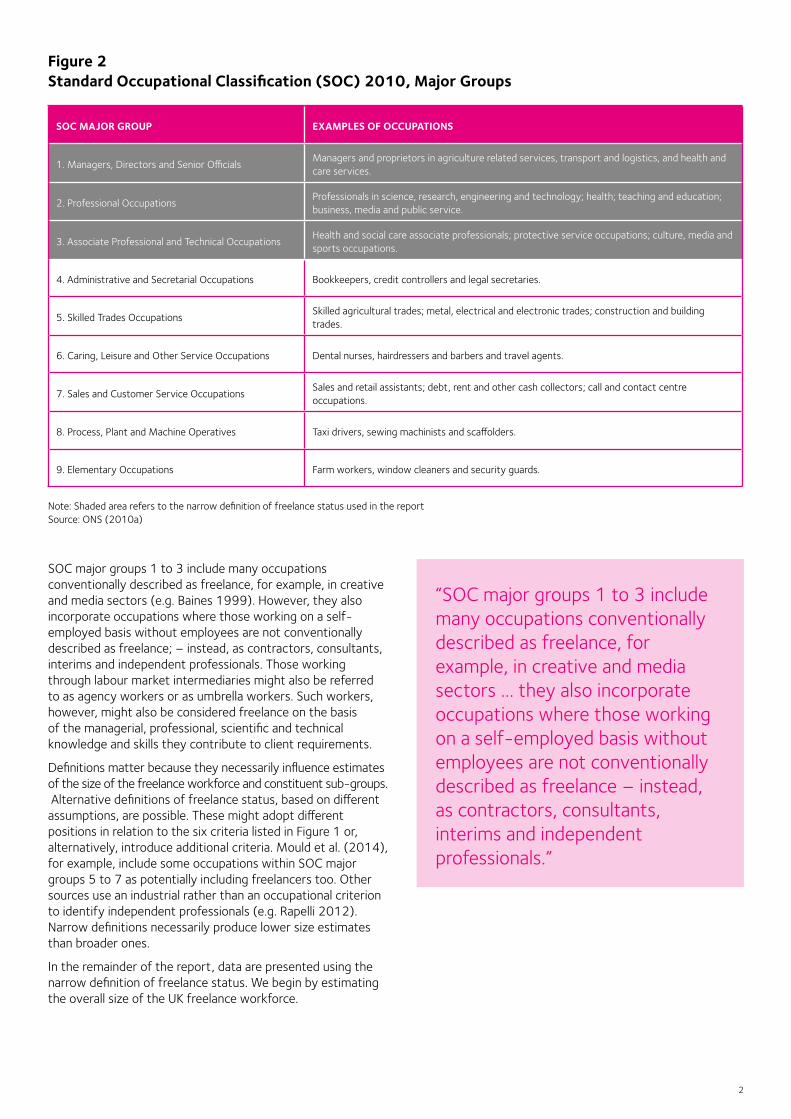
Occupational Classification (SOC) 2010 to categorise jobs, distinguishing nine major occupational groups according to skill level and specialisation (Figure 2) (ONS 2010a). The narrow definition of freelance status includes SOC major groups 1 to 3: managers, directors and senior officials; professional occupations; and associate professional and technical occupations.
1. Comparisons take account of revisions to 2008 and 2011 datasets made by the Office of National Statistics. Data therefore vary from those presented in previous reports for 2008 (Kitching and Smallbone 2008) and 2011 (Kitching and Smallbone 2012).
2. End-users of labour services include employers, who hire workers under contracts of service, and clients, who engage workers under contracts for services.
2
SOC MAJOR GROUP EXAMPLES OF OCCUPATIONS
1. Managers, Directors and Senior OfficialsManagers and proprietors in agriculture related services, transport and logistics, and health and care services.
2. Professional OccupationsProfessionals in science, research, engineering and technology; health; teaching and education; business, media and public service.
3. Associate Professional and Technical OccupationsHealth and social care associate professionals; protective service occupations; culture, media and sports occupations.
4. Administrative and Secretarial Occupations Bookkeepers, credit controllers and legal secretaries.
5. Skilled Trades OccupationsSkilled agricultural trades; metal, electrical and electronic trades; construction and building trades.
6. Caring, Leisure and Other Service Occupations Dental nurses, hairdressers and barbers and travel agents.
7. Sales and Customer Service OccupationsSales and retail assistants; debt, rent and other cash collectors; call and contact centre occupations.
8. Process, Plant and Machine Operatives Taxi drivers, sewing machinists and scaffolders.
9. Elementary Occupations Farm workers, window cleaners and security guards.
Figure 2 Standard Occupational Classification (SOC) 2010, Major Groups
Note: Shaded area refers to the narrow definition of freelance status used in the report Source: ONS (2010a)
SOC major groups 1 to 3 include many occupations conventionally described as freelance, for example, in creative and media sectors (e.g. Baines 1999). However, they also incorporate occupations where those working on a self-employed basis without employees are not conventionally described as freelance; – instead, as contractors, consultants, interims and independent professionals. Those working through labour market intermediaries might also be referred to as agency workers or as umbrella workers. Such workers, however, might also be considered freelance on the basis of the managerial, professional, scientific and technical knowledge and skills they contribute to client requirements.
Definitions matter because they necessarily influence estimates of the size of the freelance workforce and constituent sub-groups. Alternative definitions of freelance status, based on different assumptions, are possible. These might adopt different positions in relation to the six criteria listed in Figure 1 or, alternatively, introduce additional criteria. Mould et al. (2014), for example, include some occupations within SOC major groups 5 to 7 as potentially including freelancers too. Other sources use an industrial rather than an occupational criterion to identify independent professionals (e.g. Rapelli 2012). Narrow definitions necessarily produce lower size estimates than broader ones.
In the remainder of the report, data are presented using the narrow definition of freelance status. We begin by estimating the overall size of the UK freelance workforce.
“SOC major groups 1 to 3 include many occupations conventionally described as freelance, for example, in creative and media sectors … they also incorporate occupations where those working on a self-employed basis without employees are not conventionally described as freelance – instead, as contractors, consultants, interims and independent professionals.”
3
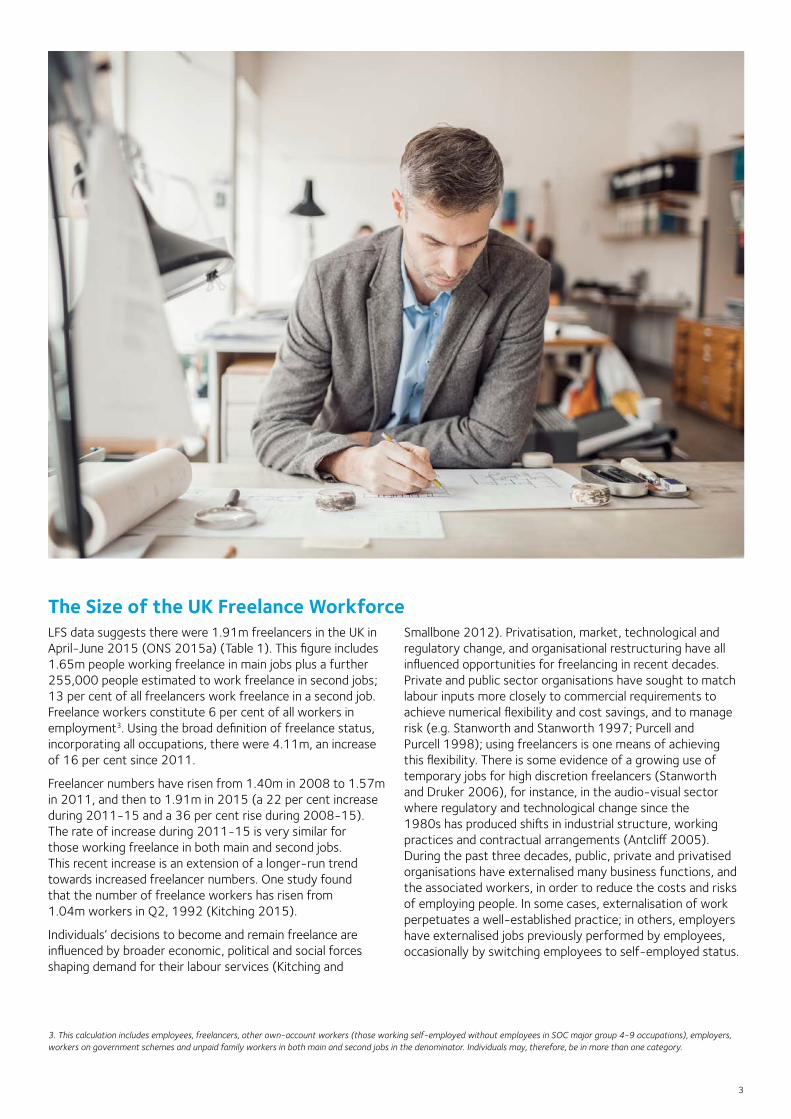
The Size of the UK Freelance Workforce LFS data suggests there were 1.91m freelancers in the UK in April-June 2015 (ONS 2015a) (Table 1). This figure includes 1.65m people working freelance in main jobs plus a further 255,000 people estimated to work freelance in second jobs; 13 per cent of all freelancers work freelance in a second job. Freelance workers constitute 6 per cent of all workers in employment3. Using the broad definition of freelance status, incorporating all occupations, there were 4.11m, an increase of 16 per cent since 2011.
Freelancer numbers have risen from 1.40m in 2008 to 1.57m in 2011, and then to 1.91m in 2015 (a 22 per cent increase during 2011-15 and a 36 per cent rise during 2008-15). The rate of increase during 2011-15 is very similar for those working freelance in both main and second jobs. This recent increase is an extension of a longer-run trend towards increased freelancer numbers. One study found that the number of freelance workers has risen from 1.04m workers in Q2, 1992 (Kitching 2015).
Individuals’ decisions to become and remain freelance are influenced by broader economic, political and social forces shaping demand for their labour services (Kitching and
Smallbone 2012). Privatisation, market, technological and regulatory change, and organisational restructuring have all influenced opportunities for freelancing in recent decades. Private and public sector organisations have sought to match labour inputs more closely to commercial requirements to achieve numerical flexibility and cost savings, and to manage risk (e.g. Stanworth and Stanworth 1997; Purcell and Purcell 1998); using freelancers is one means of achieving this flexibility. There is some evidence of a growing use of temporary jobs for high discretion freelancers (Stanworth and Druker 2006), for instance, in the audio-visual sector where regulatory and technological change since the 1980s has produced shifts in industrial structure, working practices and contractual arrangements (Antcliff 2005). During the past three decades, public, private and privatised organisations have externalised many business functions, and the associated workers, in order to reduce the costs and risks of employing people. In some cases, externalisation of work perpetuates a well-established practice; in others, employers have externalised jobs previously performed by employees, occasionally by switching employees to self-employed status.
3. This calculation includes employees, freelancers, other own-account workers (those working self-employed without employees in SOC major group 4-9 occupations), employers, workers on government schemes and unpaid family workers in both main and second jobs in the denominator. Individuals may, therefore, be in more than one category.
4
Labour Market AnalysisThe marked increase in freelance working since 2011 has occurred at a time of improving labour market conditions. As employment opportunities have increased, jobseekers have turned to freelance working. This suggests either that more people are making a positive choice for freelancing, even though employment opportunities are available, or that organisational end-users of freelancer services are choosing to supply more jobs on a freelance basis, rather than increasing employment. During 2011-15, employment levels increased
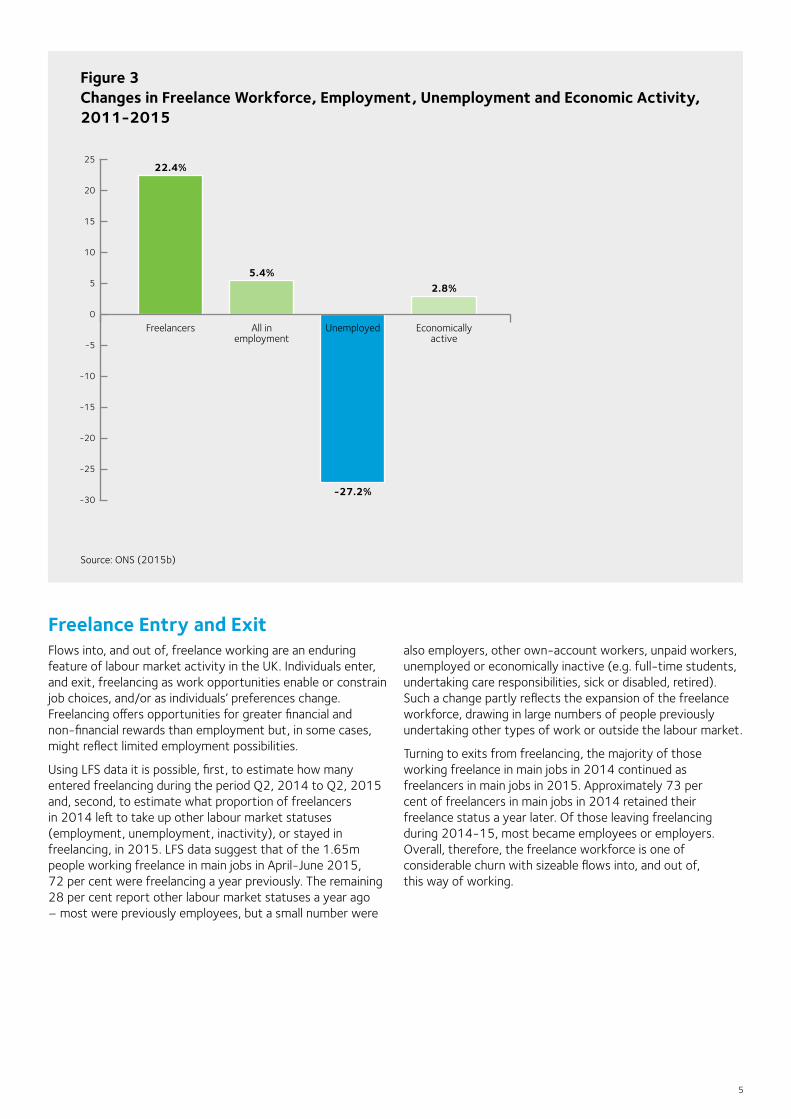
5.4 per cent, from 29.5m to 31.0m, while unemployment decreased 27 per cent from 2.5m to 1.9m (ONS 2015b: AO1 Table 1). The number of economically active people rose from 32.0m to 32.9m. Freelance working expanded faster than employment and labour market activity in general over the four year period. Trends in freelance working, employment, unemployment and labour market activity are shown in Figure 3.
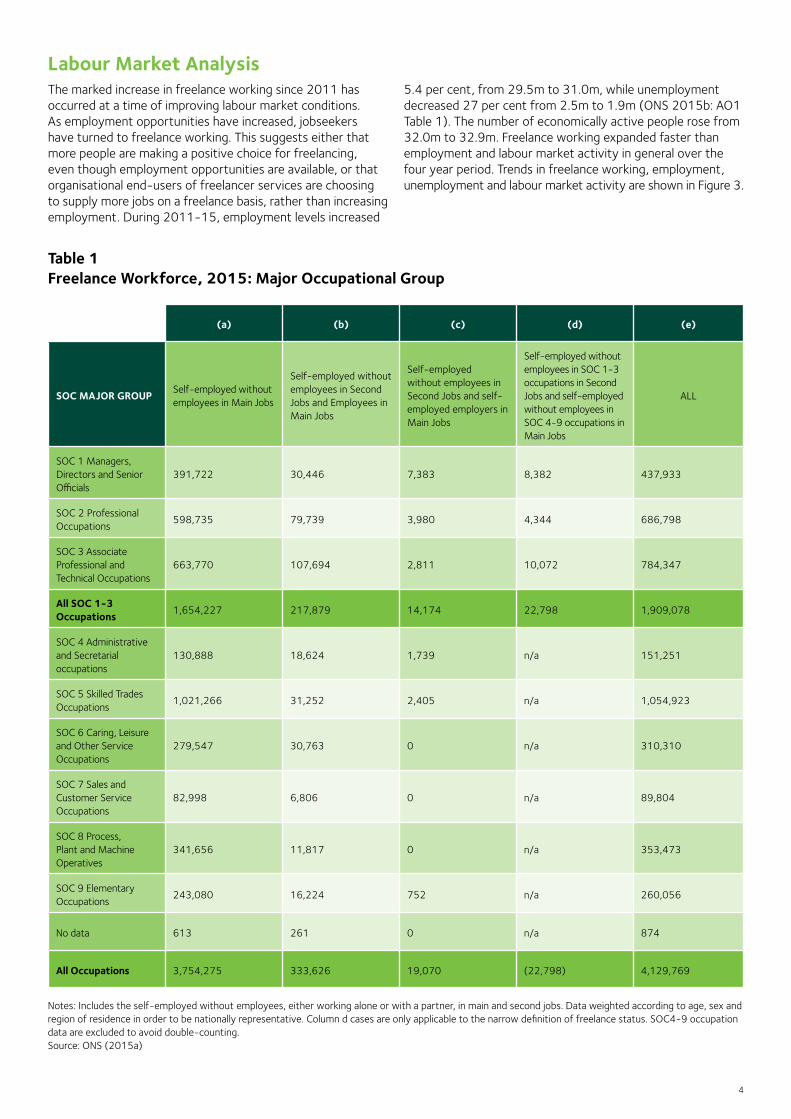
Table 1 Freelance Workforce, 2015: Major Occupational Group
(a) (b) (c) (d) (e)
SOC MAJOR GROUP Self-employed without employees in Main Jobs
Self-employed without employees in Second Jobs and Employees in Main Jobs
Self-employed without employees in Second Jobs and self-employed employers in Main Jobs
Self-employed without employees in SOC 1-3 occupations in Second Jobs and self-employed without employees in SOC 4-9 occupations in Main Jobs
ALL
SOC 1 Managers, Directors and Senior Officials
391,722 30,446 7,383 8,382 437,933
SOC 2 Professional Occupations
598,735 79,739 3,980 4,344 686,798
SOC 3 Associate Professional and Technical Occupations
663,770 107,694 2,811 10,072 784,347
All SOC 1-3 Occupations
1,654,227 217,879 14,174 22,798 1,909,078
SOC 4 Administrative and Secretarial occupations
130,888 18,624 1,739 n/a 151,251
SOC 5 Skilled Trades Occupations
1,021,266 31,252 2,405 n/a 1,054,923
SOC 6 Caring, Leisure and Other Service Occupations
279,547 30,763 0 n/a 310,310
SOC 7 Sales and Customer Service Occupations
82,998 6,806 0 n/a 89,804
SOC 8 Process, Plant and Machine Operatives
341,656 11,817 0 n/a 353,473
SOC 9 Elementary Occupations
243,080 16,224 752 n/a 260,056
No data 613 261 0 n/a 874
All Occupations 3,754,275 333,626 19,070 (22,798) 4,129,769
Notes: Includes the self-employed without employees, either working alone or with a partner, in main and second jobs. Data weighted according to age, sex and region of residence in order to be nationally representative. Column d cases are only applicable to the narrow definition of freelance status. SOC4-9 occupation data are excluded to avoid double-counting. Source: ONS (2015a)
5
Figure 3 Changes in Freelance Workforce, Employment, Unemployment and Economic Activity, 2011-2015
-30
-25
-20
-15
-10
-5
0
5
10
15
20
25
Freelancers All in employment
Unemployed Economically active
22.4%
5.4%
-27.2%
2.8%
Freelance Entry and Exit Flows into, and out of, freelance working are an enduring feature of labour market activity in the UK. Individuals enter, and exit, freelancing as work opportunities enable or constrain job choices, and/or as individuals’ preferences change. Freelancing offers opportunities for greater financial and non-financial rewards than employment but, in some cases, might reflect limited employment possibilities.
Using LFS data it is possible, first, to estimate how many entered freelancing during the period Q2, 2014 to Q2, 2015 and, second, to estimate what proportion of freelancers in 2014 left to take up other labour market statuses (employment, unemployment, inactivity), or stayed in freelancing, in 2015. LFS data suggest that of the 1.65m people working freelance in main jobs in April-June 2015, 72 per cent were freelancing a year previously. The remaining 28 per cent report other labour market statuses a year ago – most were previously employees, but a small number were
also employers, other own-account workers, unpaid workers, unemployed or economically inactive (e.g. full-time students, undertaking care responsibilities, sick or disabled, retired). Such a change partly reflects the expansion of the freelance workforce, drawing in large numbers of people previously undertaking other types of work or outside the labour market.
Turning to exits from freelancing, the majority of those working freelance in main jobs in 2014 continued as freelancers in main jobs in 2015. Approximately 73 per cent of freelancers in main jobs in 2014 retained their freelance status a year later. Of those leaving freelancing during 2014-15, most became employees or employers. Overall, therefore, the freelance workforce is one of considerable churn with sizeable flows into, and out of, this way of working.
Source: ONS (2015b)
6
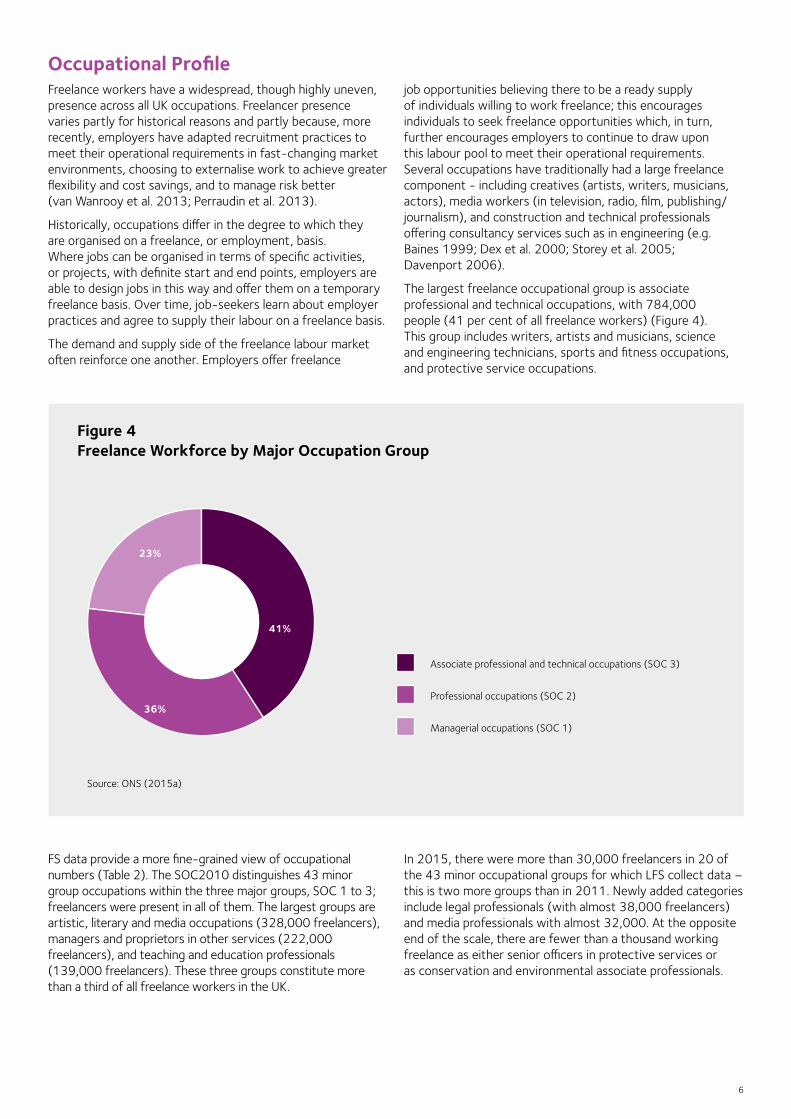
Occupational Profile Freelance workers have a widespread, though highly uneven, presence across all UK occupations. Freelancer presence varies partly for historical reasons and partly because, more recently, employers have adapted recruitment practices to meet their operational requirements in fast-changing market environments, choosing to externalise work to achieve greater flexibility and cost savings, and to manage risk better (van Wanrooy et al. 2013; Perraudin et al. 2013).
Historically, occupations differ in the degree to which they are organised on a freelance, or employment, basis. Where jobs can be organised in terms of specific activities, or projects, with definite start and end points, employers are able to design jobs in this way and offer them on a temporary freelance basis. Over time, job-seekers learn about employer practices and agree to supply their labour on a freelance basis.
The demand and supply side of the freelance labour market often reinforce one another. Employers offer freelance
job opportunities believing there to be a ready supply of individuals willing to work freelance; this encourages individuals to seek freelance opportunities which, in turn, further encourages employers to continue to draw upon this labour pool to meet their operational requirements. Several occupations have traditionally had a large freelance component - including creatives (artists, writers, musicians, actors), media workers (in television, radio, film, publishing/journalism), and construction and technical professionals offering consultancy services such as in engineering (e.g. Baines 1999; Dex et al. 2000; Storey et al. 2005; Davenport 2006).
The largest freelance occupational group is associate professional and technical occupations, with 784,000 people (41 per cent of all freelance workers) (Figure 4). This group includes writers, artists and musicians, science and engineering technicians, sports and fitness occupations, and protective service occupations.
Figure 4 Freelance Workforce by Major Occupation Group
23%
36%
41%
Source: ONS (2015a)
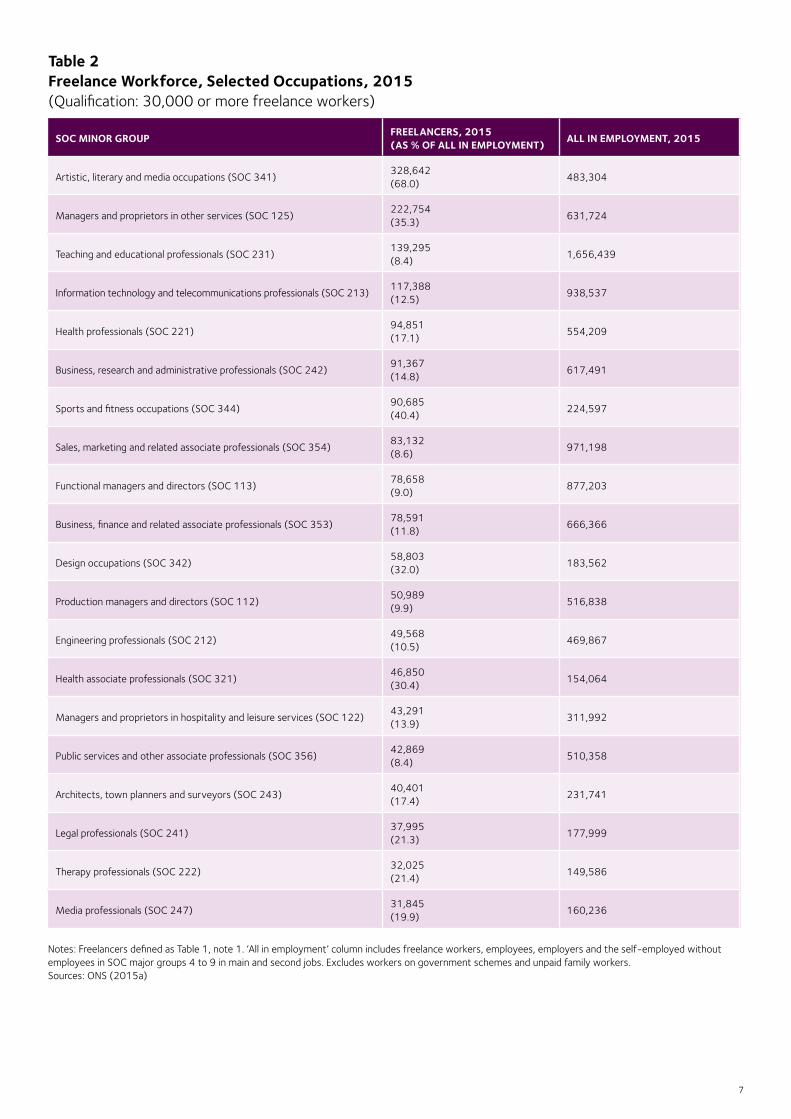
FS data provide a more fine-grained view of occupational numbers (Table 2). The SOC2010 distinguishes 43 minor group occupations within the three major groups, SOC 1 to 3; freelancers were present in all of them. The largest groups are artistic, literary and media occupations (328,000 freelancers), managers and proprietors in other services (222,000 freelancers), and teaching and education professionals (139,000 freelancers). These three groups constitute more than a third of all freelance workers in the UK.
In 2015, there were more than 30,000 freelancers in 20 of the 43 minor occupational groups for which LFS collect data – this is two more groups than in 2011. Newly added categories include legal professionals (with almost 38,000 freelancers) and media professionals with almost 32,000. At the opposite end of the scale, there are fewer than a thousand working freelance as either senior officers in protective services or as conservation and environmental associate professionals.
Managerial occupations (SOC 1)
Associate professional and technical occupations (SOC 3)
Professional occupations (SOC 2)
7
SOC MINOR GROUP FREELANCERS, 2015 (AS % OF ALL IN EMPLOYMENT) ALL IN EMPLOYMENT, 2015
Artistic, literary and media occupations (SOC 341)328,642 (68.0)
483,304
Managers and proprietors in other services (SOC 125)222,754 (35.3)
631,724
Teaching and educational professionals (SOC 231)139,295 (8.4)
1,656,439
Information technology and telecommunications professionals (SOC 213)117,388 (12.5)
938,537
Health professionals (SOC 221) 94,851 (17.1)
554,209
Business, research and administrative professionals (SOC 242)91,367 (14.8)
617,491
Sports and fitness occupations (SOC 344)90,685 (40.4)
224,597
Sales, marketing and related associate professionals (SOC 354)83,132 (8.6)
971,198
Functional managers and directors (SOC 113)78,658 (9.0)
877,203
Business, finance and related associate professionals (SOC 353)78,591 (11.8)
666,366
Design occupations (SOC 342)58,803 (32.0)
183,562
Production managers and directors (SOC 112)50,989 (9.9)
516,838
Engineering professionals (SOC 212)49,568 (10.5)
469,867
Health associate professionals (SOC 321)46,850 (30.4)
154,064
Managers and proprietors in hospitality and leisure services (SOC 122)43,291 (13.9)
311,992
Public services and other associate professionals (SOC 356)42,869 (8.4)
510,358
Architects, town planners and surveyors (SOC 243)40,401 (17.4)
231,741
Legal professionals (SOC 241)37,995 (21.3)
177,999
Therapy professionals (SOC 222)32,025 (21.4)
149,586
Media professionals (SOC 247)31,845 (19.9)
160,236
Notes: Freelancers defined as Table 1, note 1. ‘All in employment’ column includes freelance workers, employees, employers and the self-employed without employees in SOC major groups 4 to 9 in main and second jobs. Excludes workers on government schemes and unpaid family workers. Sources: ONS (2015a)
Table 2 Freelance Workforce, Selected Occupations, 2015 (Qualification: 30,000 or more freelance workers)
8
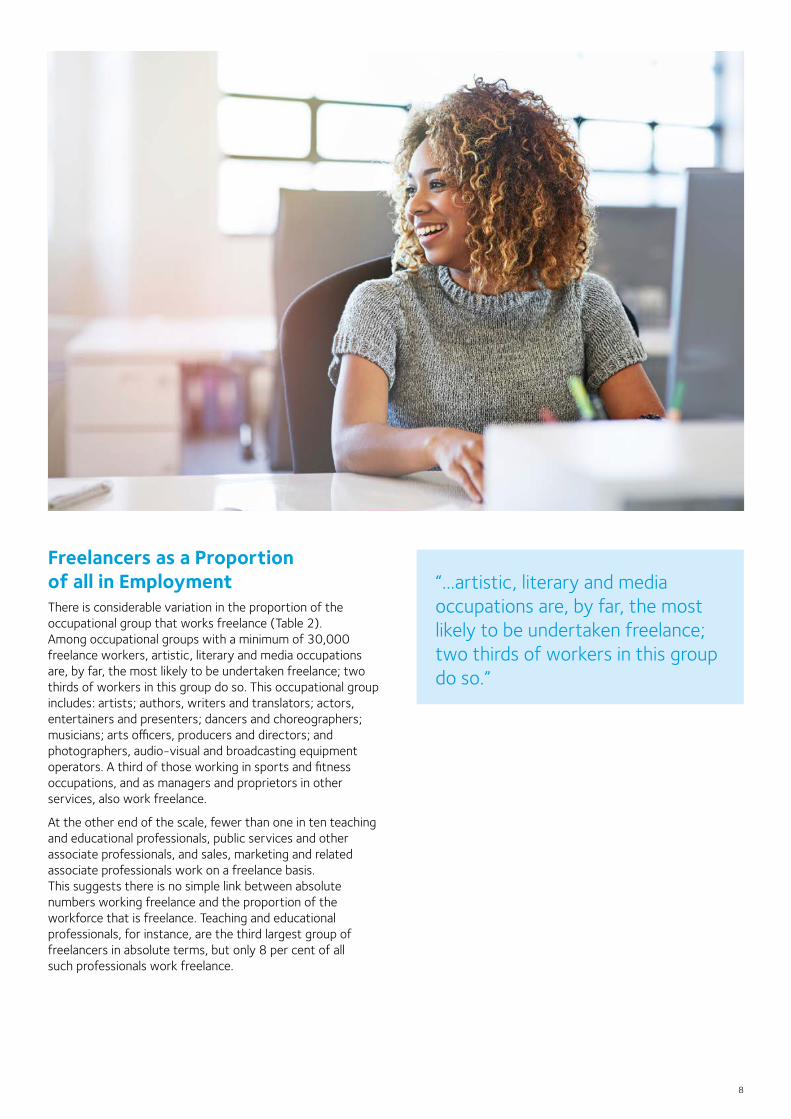
Freelancers as a Proportion of all in EmploymentThere is considerable variation in the proportion of the occupational group that works freelance (Table 2). Among occupational groups with a minimum of 30,000 freelance workers, artistic, literary and media occupations are, by far, the most likely to be undertaken freelance; two thirds of workers in this group do so. This occupational group includes: artists; authors, writers and translators; actors, entertainers and presenters; dancers and choreographers; musicians; arts officers, producers and directors; and photographers, audio-visual and broadcasting equipment operators. A third of those working in sports and fitness occupations, and as managers and proprietors in other services, also work freelance.
At the other end of the scale, fewer than one in ten teaching and educational professionals, public services and other associate professionals, and sales, marketing and related associate professionals work on a freelance basis. This suggests there is no simple link between absolute numbers working freelance and the proportion of the workforce that is freelance. Teaching and educational professionals, for instance, are the third largest group of freelancers in absolute terms, but only 8 per cent of all such professionals work freelance.
“...artistic, literary and media occupations are, by far, the most likely to be undertaken freelance; two thirds of workers in this group do so.”
9
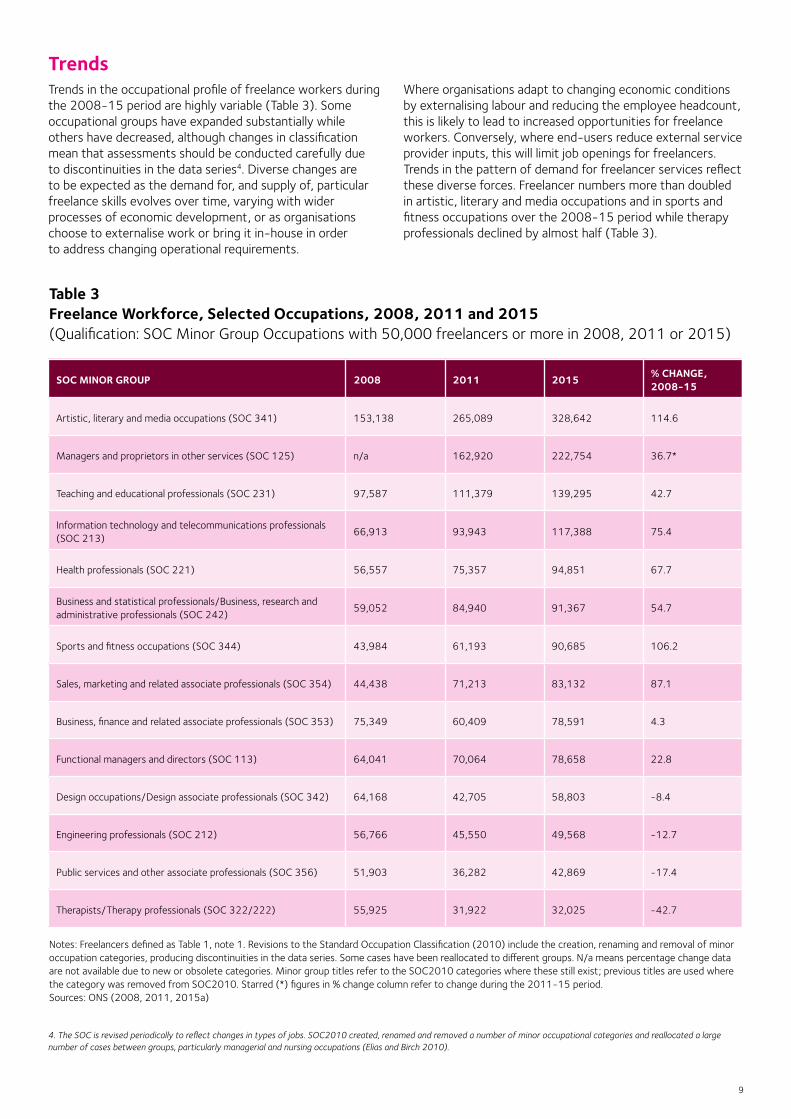
TrendsTrends in the occupational profile of freelance workers during the 2008-15 period are highly variable (Table 3). Some occupational groups have expanded substantially while others have decreased, although changes in classification mean that assessments should be conducted carefully due to discontinuities in the data series4. Diverse changes are to be expected as the demand for, and supply of, particular freelance skills evolves over time, varying with wider processes of economic development, or as organisations choose to externalise work or bring it in-house in order to address changing operational requirements.
Where organisations adapt to changing economic conditions by externalising labour and reducing the employee headcount, this is likely to lead to increased opportunities for freelance workers. Conversely, where end-users reduce external service provider inputs, this will limit job openings for freelancers. Trends in the pattern of demand for freelancer services reflect these diverse forces. Freelancer numbers more than doubled in artistic, literary and media occupations and in sports and fitness occupations over the 2008-15 period while therapy professionals declined by almost half (Table 3).
SOC MINOR GROUP 2008 2011 2015 % CHANGE, 2008-15
Artistic, literary and media occupations (SOC 341) 153,138 265,089 328,642 114.6
Managers and proprietors in other services (SOC 125) n/a 162,920 222,754 36.7*
Teaching and educational professionals (SOC 231) 97,587 111,379 139,295 42.7
Information technology and telecommunications professionals (SOC 213)
66,913 93,943 117,388 75.4
Health professionals (SOC 221) 56,557 75,357 94,851 67.7
Business and statistical professionals/Business, research and administrative professionals (SOC 242)
59,052 84,940 91,367 54.7
Sports and fitness occupations (SOC 344) 43,984 61,193 90,685 106.2
Sales, marketing and related associate professionals (SOC 354) 44,438 71,213 83,132 87.1
Business, finance and related associate professionals (SOC 353) 75,349 60,409 78,591 4.3
Functional managers and directors (SOC 113) 64,041 70,064 78,658 22.8
Design occupations/Design associate professionals (SOC 342) 64,168 42,705 58,803 -8.4
Engineering professionals (SOC 212) 56,766 45,550 49,568 -12.7
Public services and other associate professionals (SOC 356) 51,903 36,282 42,869 -17.4
Therapists/Therapy professionals (SOC 322/222) 55,925 31,922 32,025 -42.7
Table 3 Freelance Workforce, Selected Occupations, 2008, 2011 and 2015 (Qualification: SOC Minor Group Occupations with 50,000 freelancers or more in 2008, 2011 or 2015)
Notes: Freelancers defined as Table 1, note 1. Revisions to the Standard Occupation Classification (2010) include the creation, renaming and removal of minor occupation categories, producing discontinuities in the data series. Some cases have been reallocated to different groups. N/a means percentage change data are not available due to new or obsolete categories. Minor group titles refer to the SOC2010 categories where these still exist; previous titles are used where the category was removed from SOC2010. Starred (*) figures in % change column refer to change during the 2011-15 period. Sources: ONS (2008, 2011, 2015a)
4. The SOC is revised periodically to reflect changes in types of jobs. SOC2010 created, renamed and removed a number of minor occupational categories and reallocated a large number of cases between groups, particularly managerial and nursing occupations (Elias and Birch 2010).
10
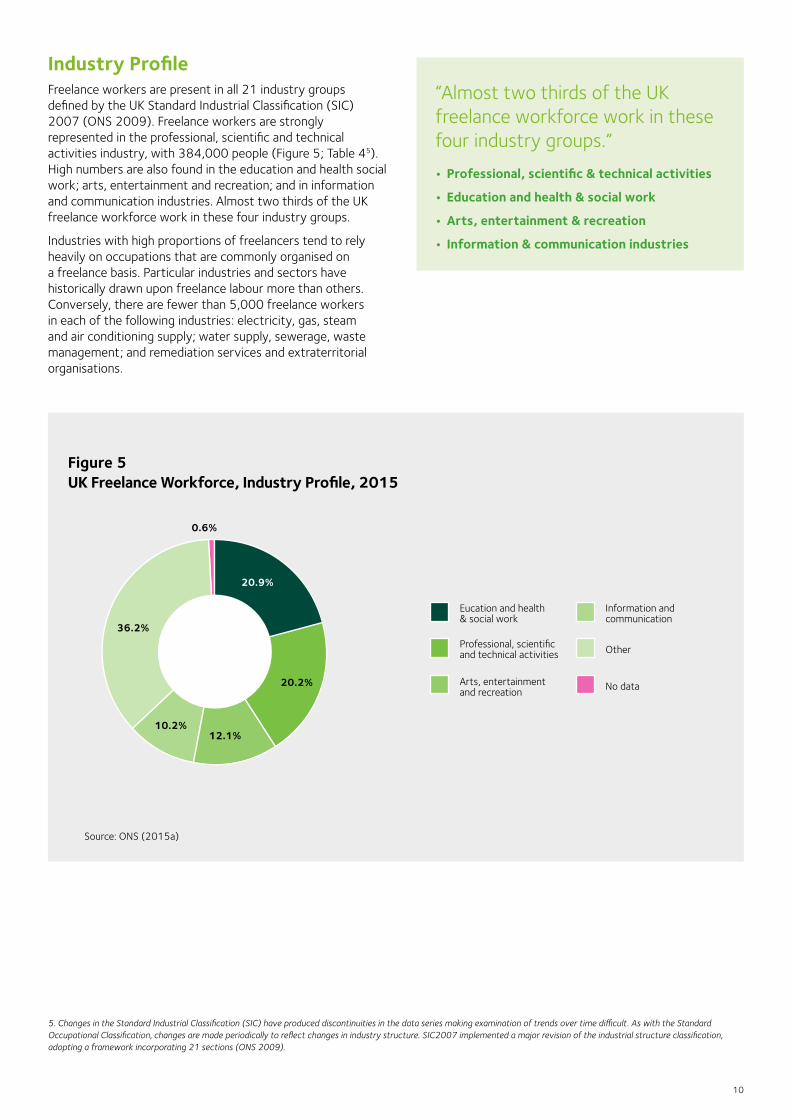
Industry ProfileFreelance workers are present in all 21 industry groups defined by the UK Standard Industrial Classification (SIC) 2007 (ONS 2009). Freelance workers are strongly represented in the professional, scientific and technical activities industry, with 384,000 people (Figure 5; Table 45). High numbers are also found in the education and health social work; arts, entertainment and recreation; and in information and communication industries. Almost two thirds of the UK freelance workforce work in these four industry groups.
Industries with high proportions of freelancers tend to rely heavily on occupations that are commonly organised on a freelance basis. Particular industries and sectors have historically drawn upon freelance labour more than others. Conversely, there are fewer than 5,000 freelance workers in each of the following industries: electricity, gas, steam and air conditioning supply; water supply, sewerage, waste management; and remediation services and extraterritorial organisations.
Figure 5 UK Freelance Workforce, Industry Profile, 2015
20.9%
20.2%
36.2%
0.6%
12.1%10.2%
Source: ONS (2015a)
Arts, entertainment and recreation
Eucation and health & social work
Professional, scientific and technical activities
Information and communication
Other
No data
5. Changes in the Standard Industrial Classification (SIC) have produced discontinuities in the data series making examination of trends over time difficult. As with the Standard Occupational Classification, changes are made periodically to reflect changes in industry structure. SIC2007 implemented a major revision of the industrial structure classification, adopting a framework incorporating 21 sections (ONS 2009).
“Almost two thirds of the UK freelance workforce work in these four industry groups.”
• Professional, scientific & technical activities
• Education and health & social work
• Arts, entertainment & recreation
• Information & communication industries
11
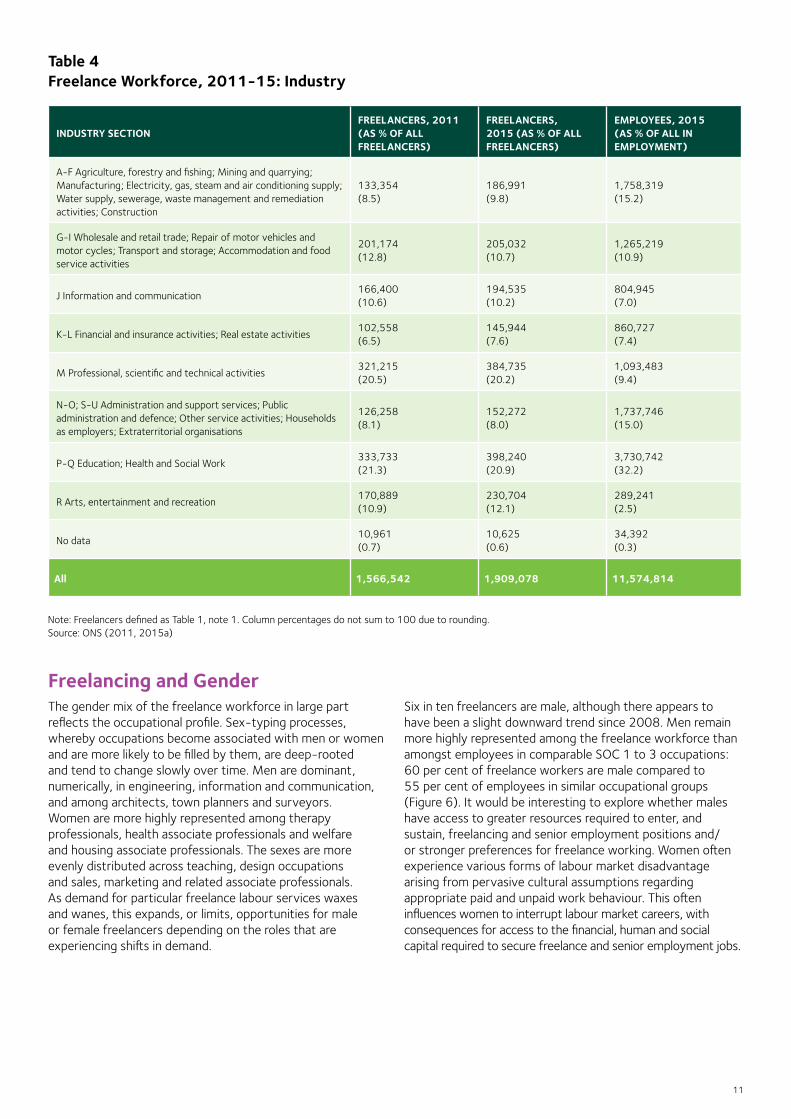
Table 4 Freelance Workforce, 2011-15: Industry
INDUSTRY SECTIONFREELANCERS, 2011 (AS % OF ALL FREELANCERS)
FREELANCERS, 2015 (AS % OF ALL FREELANCERS)
EMPLOYEES, 2015 (AS % OF ALL IN EMPLOYMENT)
A-F Agriculture, forestry and fishing; Mining and quarrying; Manufacturing; Electricity, gas, steam and air conditioning supply; Water supply, sewerage, waste management and remediation activities; Construction
133,354 (8.5)
186,991 (9.8)
1,758,319 (15.2)
G-I Wholesale and retail trade; Repair of motor vehicles and motor cycles; Transport and storage; Accommodation and food service activities
201,174 (12.8)
205,032 (10.7)
1,265,219 (10.9)
J Information and communication166,400 (10.6)
194,535 (10.2)
804,945 (7.0)
K-L Financial and insurance activities; Real estate activities102,558 (6.5)
145,944 (7.6)
860,727 (7.4)
M Professional, scientific and technical activities321,215 (20.5)
384,735 (20.2)
1,093,483 (9.4)
N-O; S-U Administration and support services; Public administration and defence; Other service activities; Households as employers; Extraterritorial organisations
126,258 (8.1)
152,272 (8.0)
1,737,746 (15.0)
P-Q Education; Health and Social Work333,733 (21.3)
398,240 (20.9)
3,730,742 (32.2)
R Arts, entertainment and recreation170,889 (10.9)
230,704 (12.1)
289,241 (2.5)
No data10,961 (0.7)
10,625 (0.6)
34,392 (0.3)
All 1,566,542 1,909,078 11,574,814
Note: Freelancers defined as Table 1, note 1. Column percentages do not sum to 100 due to rounding. Source: ONS (2011, 2015a)
Freelancing and GenderThe gender mix of the freelance workforce in large part reflects the occupational profile. Sex-typing processes, whereby occupations become associated with men or women and are more likely to be filled by them, are deep-rooted and tend to change slowly over time. Men are dominant, numerically, in engineering, information and communication, and among architects, town planners and surveyors. Women are more highly represented among therapy professionals, health associate professionals and welfare and housing associate professionals. The sexes are more evenly distributed across teaching, design occupations and sales, marketing and related associate professionals. As demand for particular freelance labour services waxes and wanes, this expands, or limits, opportunities for male or female freelancers depending on the roles that are experiencing shifts in demand.
Six in ten freelancers are male, although there appears to have been a slight downward trend since 2008. Men remain more highly represented among the freelance workforce than amongst employees in comparable SOC 1 to 3 occupations: 60 per cent of freelance workers are male compared to 55 per cent of employees in similar occupational groups (Figure 6). It would be interesting to explore whether males have access to greater resources required to enter, and sustain, freelancing and senior employment positions and/or stronger preferences for freelance working. Women often experience various forms of labour market disadvantage arising from pervasive cultural assumptions regarding appropriate paid and unpaid work behaviour. This often influences women to interrupt labour market careers, with consequences for access to the financial, human and social capital required to secure freelance and senior employment jobs.
12
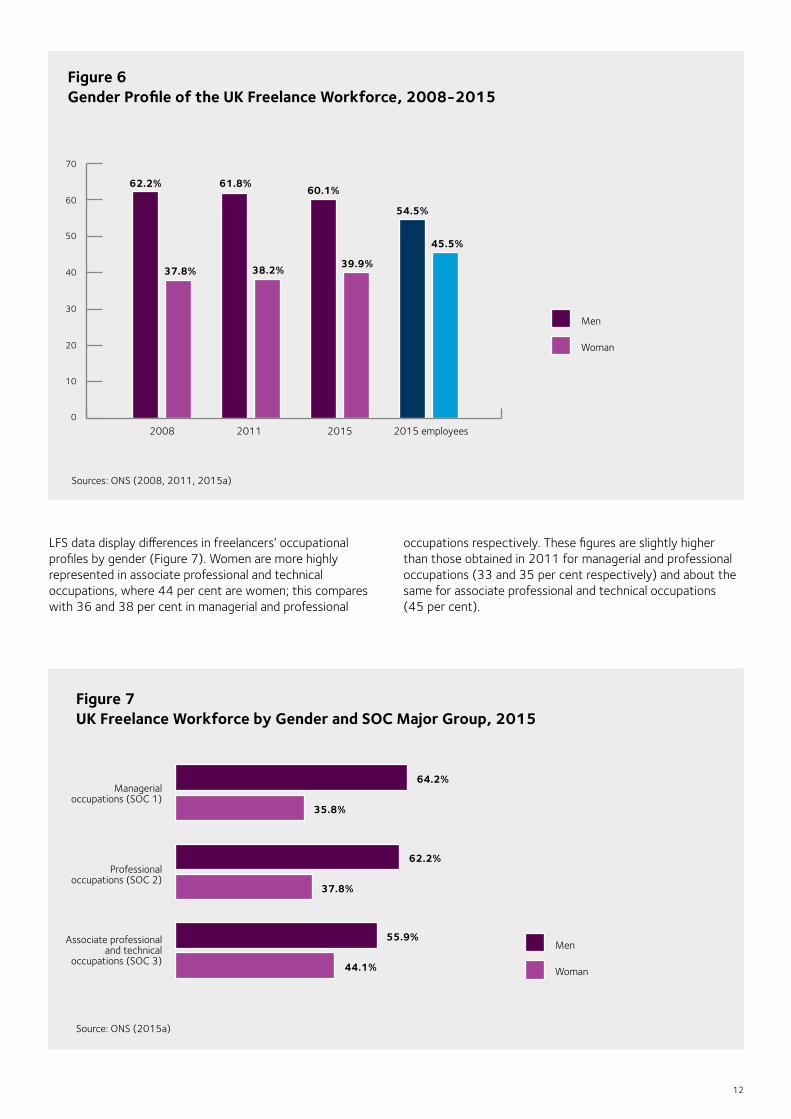
Figure 6 Gender Profile of the UK Freelance Workforce, 2008-2015
0
10
20
30
40
50
60
70
Sources: ONS (2008, 2011, 2015a)
LFS data display differences in freelancers’ occupational profiles by gender (Figure 7). Women are more highly represented in associate professional and technical occupations, where 44 per cent are women; this compares with 36 and 38 per cent in managerial and professional
occupations respectively. These figures are slightly higher than those obtained in 2011 for managerial and professional occupations (33 and 35 per cent respectively) and about the same for associate professional and technical occupations (45 per cent).
Men
Woman
62.2%
37.8%
61.8%60.1%
39.9%
54.5%
45.5%
2008 2011 2015 2015 employees
38.2%
Figure 7 UK Freelance Workforce by Gender and SOC Major Group, 2015
Source: ONS (2015a)
Managerial occupations (SOC 1)
Professional occupations (SOC 2)
Associate professional and technical
occupations (SOC 3)
64.2%
35.8%
62.2%
37.8%
55.9%
44.1%
Men
Woman
13
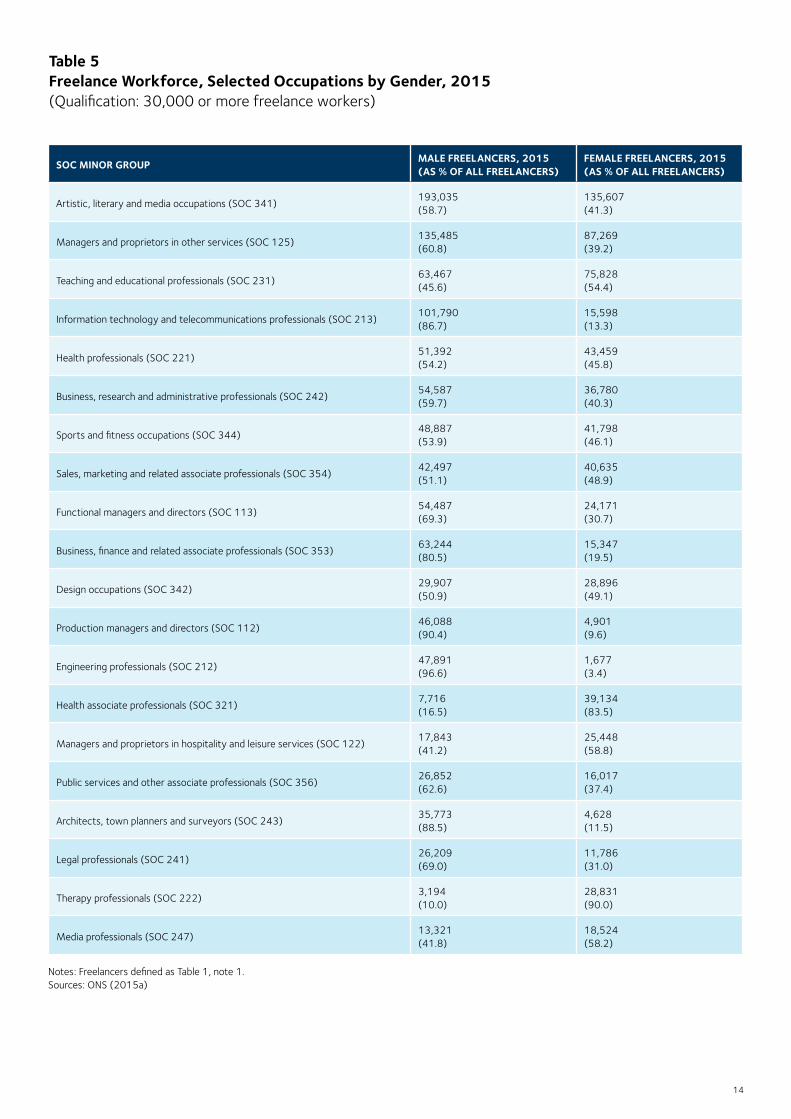
Freelance Occupations and GenderThere is considerable variety in freelancer job distribution by gender distribution at minor occupational level (Table 5). Male-dominated occupations include engineering (97 per cent of freelance jobs occupied by males), production managers and directors, and architects, town planners and surveyors. Female-dominated occupations are fewer in number – as only 40 per cent of freelancers in total are women – including therapy professionals (90 per cent are female), health associate professionals and, to a lesser degree, managers and proprietors in hospitality and leisure services.
There appears to be no particular relationship between absolute numbers in particular occupations and evidence of any skew towards men or women. The most populous occupational categories – artistic, literary and media occupations; and managers and proprietors in other services – mirror almost exactly the 60/40 gender split in the freelance
workforce as a whole. The third largest occupational category by absolute size is female-dominated: teaching and education professionals (54 per cent female). The fourth largest group, IT professionals, is heavily male-dominated with 87 per cent of freelancers being male.
Nor does there appear to be any straightforward relationship between growth in freelancer numbers in particular occupations and their gender composition. The fastest growing occupations since 2008 (artistic, literary and media occupations; sports and fitness occupations; sales, marketing and related associate professionals) are skewed towards women, while the group experiencing the largest decline (therapy professionals) is also female dominated. With regards to male-dominated groups, IT professionals have undergone a significant increase in numbers since 2008, while engineering professionals have witnessed a fall.
14
Table 5 Freelance Workforce, Selected Occupations by Gender, 2015 (Qualification: 30,000 or more freelance workers)
SOC MINOR GROUP MALE FREELANCERS, 2015 (AS % OF ALL FREELANCERS)
FEMALE FREELANCERS, 2015 (AS % OF ALL FREELANCERS)
Artistic, literary and media occupations (SOC 341)193,035 (58.7)
135,607 (41.3)
Managers and proprietors in other services (SOC 125)135,485 (60.8)
87,269 (39.2)
Teaching and educational professionals (SOC 231)63,467 (45.6)
75,828 (54.4)
Information technology and telecommunications professionals (SOC 213)101,790 (86.7)
15,598 (13.3)
Health professionals (SOC 221) 51,392 (54.2)
43,459 (45.8)
Business, research and administrative professionals (SOC 242)54,587 (59.7)
36,780 (40.3)
Sports and fitness occupations (SOC 344)48,887 (53.9)
41,798 (46.1)
Sales, marketing and related associate professionals (SOC 354)42,497 (51.1)
40,635 (48.9)
Functional managers and directors (SOC 113)54,487 (69.3)
24,171 (30.7)
Business, finance and related associate professionals (SOC 353)63,244 (80.5)
15,347 (19.5)
Design occupations (SOC 342)29,907 (50.9)
28,896 (49.1)
Production managers and directors (SOC 112)46,088 (90.4)
4,901 (9.6)
Engineering professionals (SOC 212)47,891 (96.6)
1,677 (3.4)
Health associate professionals (SOC 321)7,716 (16.5)
39,134(83.5)
Managers and proprietors in hospitality and leisure services (SOC 122)17,843 (41.2)
25,448 (58.8)
Public services and other associate professionals (SOC 356)26,852 (62.6)
16,017 (37.4)
Architects, town planners and surveyors (SOC 243)35,773 (88.5)
4,628 (11.5)
Legal professionals (SOC 241)26,209 (69.0)
11,786 (31.0)
Therapy professionals (SOC 222)3,194 (10.0)
28,831 (90.0)
Media professionals (SOC 247)13,321 (41.8)
18,524 (58.2)
Notes: Freelancers defined as Table 1, note 1. Sources: ONS (2015a)
15
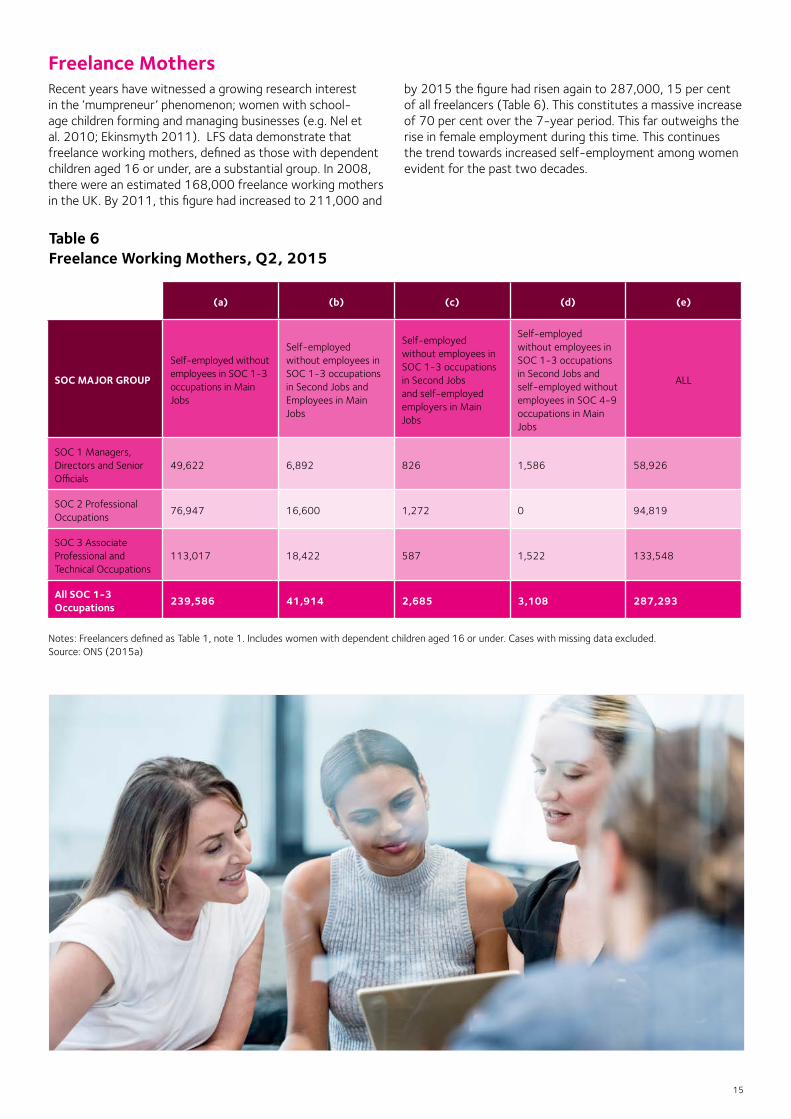
Freelance MothersRecent years have witnessed a growing research interest in the ‘mumpreneur’ phenomenon; women with school-age children forming and managing businesses (e.g. Nel et al. 2010; Ekinsmyth 2011). LFS data demonstrate that freelance working mothers, defined as those with dependent children aged 16 or under, are a substantial group. In 2008, there were an estimated 168,000 freelance working mothers in the UK. By 2011, this figure had increased to 211,000 and
by 2015 the figure had risen again to 287,000, 15 per cent of all freelancers (Table 6). This constitutes a massive increase of 70 per cent over the 7-year period. This far outweighs the rise in female employment during this time. This continues the trend towards increased self-employment among women evident for the past two decades.
Table 6 Freelance Working Mothers, Q2, 2015
(a) (b) (c) (d) (e)
SOC MAJOR GROUP
Self-employed without employees in SOC 1-3 occupations in Main Jobs
Self-employed without employees in SOC 1-3 occupations in Second Jobs and Employees in Main Jobs
Self-employed without employees in SOC 1-3 occupations in Second Jobs and self-employed employers in Main Jobs
Self-employed without employees in SOC 1-3 occupations in Second Jobs and self-employed without employees in SOC 4-9 occupations in Main Jobs
ALL
SOC 1 Managers, Directors and Senior Officials
49,622 6,892 826 1,586 58,926
SOC 2 Professional Occupations
76,947 16,600 1,272 0 94,819
SOC 3 Associate Professional and Technical Occupations
113,017 18,422 587 1,522 133,548
All SOC 1-3 Occupations 239,586 41,914 2,685 3,108 287,293
Notes: Freelancers defined as Table 1, note 1. Includes women with dependent children aged 16 or under. Cases with missing data excluded. Source: ONS (2015a)
16
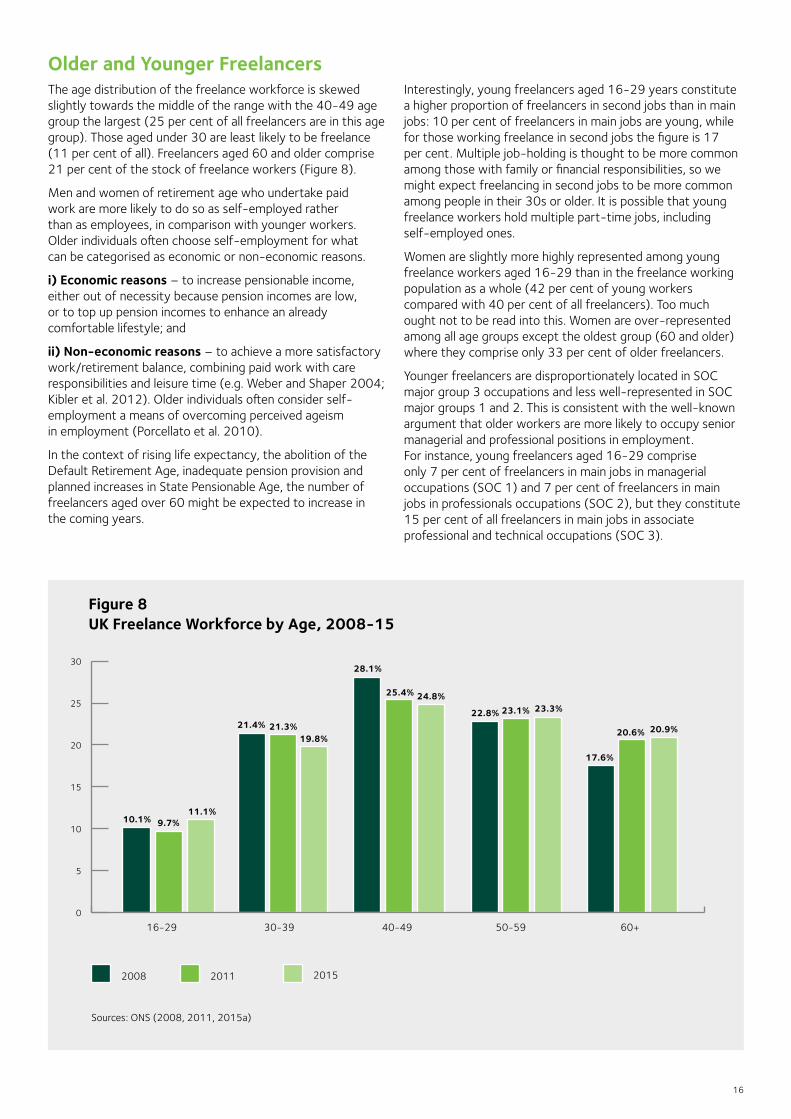
Older and Younger Freelancers The age distribution of the freelance workforce is skewed slightly towards the middle of the range with the 40-49 age group the largest (25 per cent of all freelancers are in this age group). Those aged under 30 are least likely to be freelance (11 per cent of all). Freelancers aged 60 and older comprise 21 per cent of the stock of freelance workers (Figure 8).
Men and women of retirement age who undertake paid work are more likely to do so as self-employed rather than as employees, in comparison with younger workers. Older individuals often choose self-employment for what can be categorised as economic or non-economic reasons.
i) Economic reasons – to increase pensionable income, either out of necessity because pension incomes are low, or to top up pension incomes to enhance an already comfortable lifestyle; and
ii) Non-economic reasons – to achieve a more satisfactory work/retirement balance, combining paid work with care responsibilities and leisure time (e.g. Weber and Shaper 2004; Kibler et al. 2012). Older individuals often consider self-employment a means of overcoming perceived ageism in employment (Porcellato et al. 2010).
In the context of rising life expectancy, the abolition of the Default Retirement Age, inadequate pension provision and planned increases in State Pensionable Age, the number of freelancers aged over 60 might be expected to increase in the coming years.
Interestingly, young freelancers aged 16-29 years constitute a higher proportion of freelancers in second jobs than in main jobs: 10 per cent of freelancers in main jobs are young, while for those working freelance in second jobs the figure is 17 per cent. Multiple job-holding is thought to be more common among those with family or financial responsibilities, so we might expect freelancing in second jobs to be more common among people in their 30s or older. It is possible that young freelance workers hold multiple part-time jobs, including self-employed ones.
Women are slightly more highly represented among young freelance workers aged 16-29 than in the freelance working population as a whole (42 per cent of young workers compared with 40 per cent of all freelancers). Too much ought not to be read into this. Women are over-represented among all age groups except the oldest group (60 and older) where they comprise only 33 per cent of older freelancers.
Younger freelancers are disproportionately located in SOC major group 3 occupations and less well-represented in SOC major groups 1 and 2. This is consistent with the well-known argument that older workers are more likely to occupy senior managerial and professional positions in employment. For instance, young freelancers aged 16-29 comprise only 7 per cent of freelancers in main jobs in managerial occupations (SOC 1) and 7 per cent of freelancers in main jobs in professionals occupations (SOC 2), but they constitute 15 per cent of all freelancers in main jobs in associate professional and technical occupations (SOC 3).
Figure 8 UK Freelance Workforce by Age, 2008-15
0
5
10
15
20
25
30
Sources: ONS (2008, 2011, 2015a)
16-29 30-39 40-49 50-59 60+
2011 20152008
10.1%
21.4%
28.1%
22.8%
9.7%
17.6%
21.3%
25.4%
23.1%
20.6%
11.1%
19.8%
24.8%
20.9%
23.3%
17
Contrasting with their overall presence of 10 per cent of the freelance workforce in main jobs, young freelancers are especially concentrated in particular jobs. These include: sports and fitness occupations (SOC 344), where 33 per cent of all freelancers in main jobs are in the 16-29 age group. High proportions of young freelancers are also found among information technology technicians (SOC 313) (28 per cent of all freelancers in main jobs), welfare and housing associate professionals (SOC 323) (22 per cent) and managers and directors in transport and logistics (SOC116) (21 per cent). In contrast, young freelancers have no presence at all in 15 of the 43 minor occupation groups suggesting there are powerful barriers to entry for younger workers in these jobs.
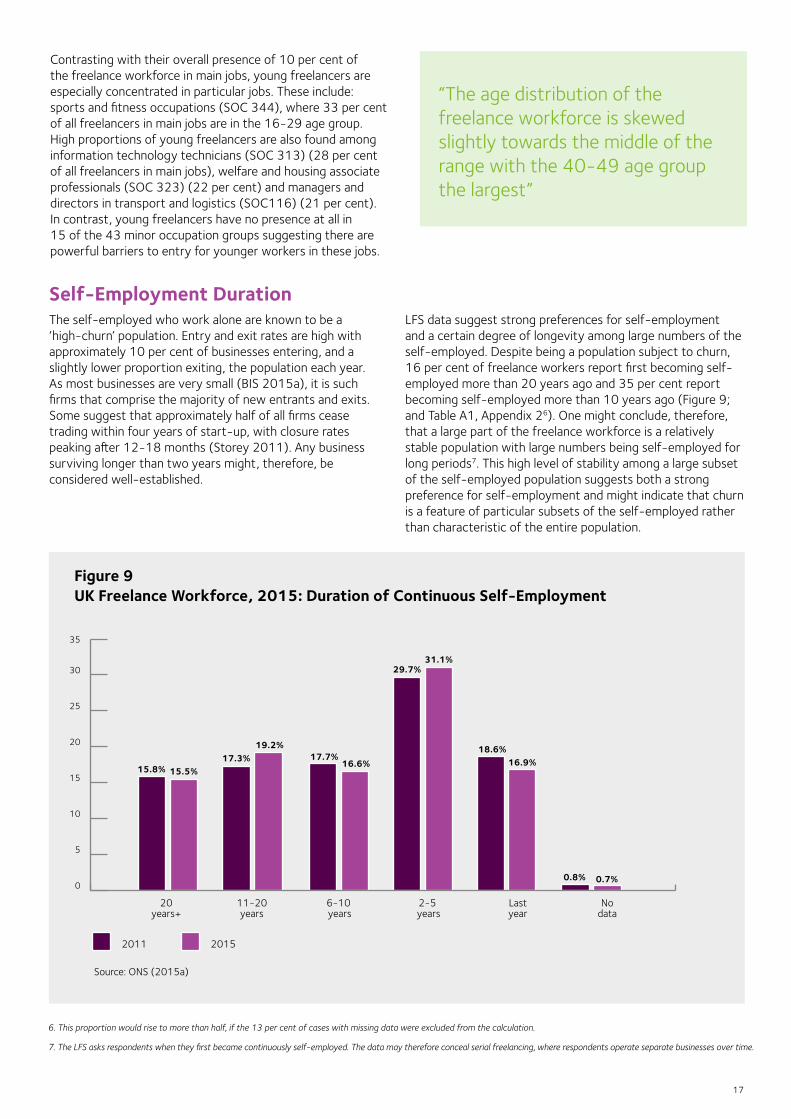
Self-Employment DurationThe self-employed who work alone are known to be a ‘high-churn’ population. Entry and exit rates are high with approximately 10 per cent of businesses entering, and a slightly lower proportion exiting, the population each year. As most businesses are very small (BIS 2015a), it is such firms that comprise the majority of new entrants and exits. Some suggest that approximately half of all firms cease trading within four years of start-up, with closure rates peaking after 12-18 months (Storey 2011). Any business surviving longer than two years might, therefore, be considered well-established.
LFS data suggest strong preferences for self-employment and a certain degree of longevity among large numbers of the self-employed. Despite being a population subject to churn, 16 per cent of freelance workers report first becoming self-employed more than 20 years ago and 35 per cent report becoming self-employed more than 10 years ago (Figure 9; and Table A1, Appendix 26). One might conclude, therefore, that a large part of the freelance workforce is a relatively stable population with large numbers being self-employed for long periods7. This high level of stability among a large subset of the self-employed population suggests both a strong preference for self-employment and might indicate that churn is a feature of particular subsets of the self-employed rather than characteristic of the entire population.
0
5
10
15
20
25
30
35
Figure 9 UK Freelance Workforce, 2015: Duration of Continuous Self-Employment
Source: ONS (2015a)
20 years+
11-20 years
6-10 years
2-5 years
Last year
No data
20152011
15.8% 15.5%17.3%
19.2%17.7%
16.6%
29.7%31.1%
18.6%16.9%
0.8% 0.7%
“The age distribution of the freelance workforce is skewed slightly towards the middle of the range with the 40-49 age group the largest”
6. This proportion would rise to more than half, if the 13 per cent of cases with missing data were excluded from the calculation.
7. The LFS asks respondents when they first became continuously self-employed. The data may therefore conceal serial freelancing, where respondents operate separate businesses over time.
18
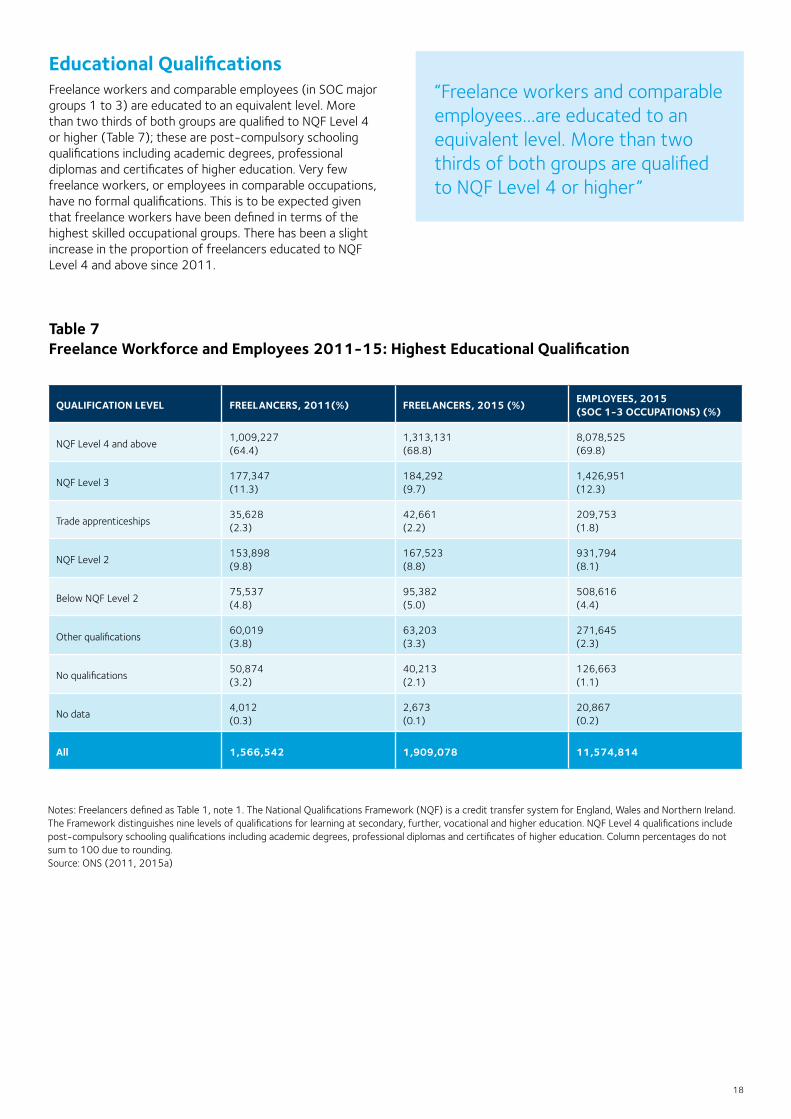
Educational Qualifications Freelance workers and comparable employees (in SOC major groups 1 to 3) are educated to an equivalent level. More than two thirds of both groups are qualified to NQF Level 4 or higher (Table 7); these are post-compulsory schooling qualifications including academic degrees, professional diplomas and certificates of higher education. Very few freelance workers, or employees in comparable occupations, have no formal qualifications. This is to be expected given that freelance workers have been defined in terms of the highest skilled occupational groups. There has been a slight increase in the proportion of freelancers educated to NQF Level 4 and above since 2011.
Table 7 Freelance Workforce and Employees 2011-15: Highest Educational Qualification
QUALIFICATION LEVEL FREELANCERS, 2011(%) FREELANCERS, 2015 (%) EMPLOYEES, 2015 (SOC 1-3 OCCUPATIONS) (%)
NQF Level 4 and above1,009,227 (64.4)
1,313,131 (68.8)
8,078,525 (69.8)
NQF Level 3177,347 (11.3)
184,292 (9.7)
1,426,951 (12.3)
Trade apprenticeships35,628 (2.3)
42,661 (2.2)
209,753 (1.8)
NQF Level 2153,898 (9.8)
167,523 (8.8)
931,794 (8.1)
Below NQF Level 275,537 (4.8)
95,382 (5.0)
508,616 (4.4)
Other qualifications60,019 (3.8)
63,203 (3.3)
271,645 (2.3)
No qualifications50,874 (3.2)
40,213 (2.1)
126,663 (1.1)
No data4,012 (0.3)
2,673 (0.1)
20,867 (0.2)
All 1,566,542 1,909,078 11,574,814
Notes: Freelancers defined as Table 1, note 1. The National Qualifications Framework (NQF) is a credit transfer system for England, Wales and Northern Ireland. The Framework distinguishes nine levels of qualifications for learning at secondary, further, vocational and higher education. NQF Level 4 qualifications include post-compulsory schooling qualifications including academic degrees, professional diplomas and certificates of higher education. Column percentages do not sum to 100 due to rounding. Source: ONS (2011, 2015a)
“Freelance workers and comparable employees...are educated to an equivalent level. More than two thirds of both groups are qualified to NQF Level 4 or higher”
19
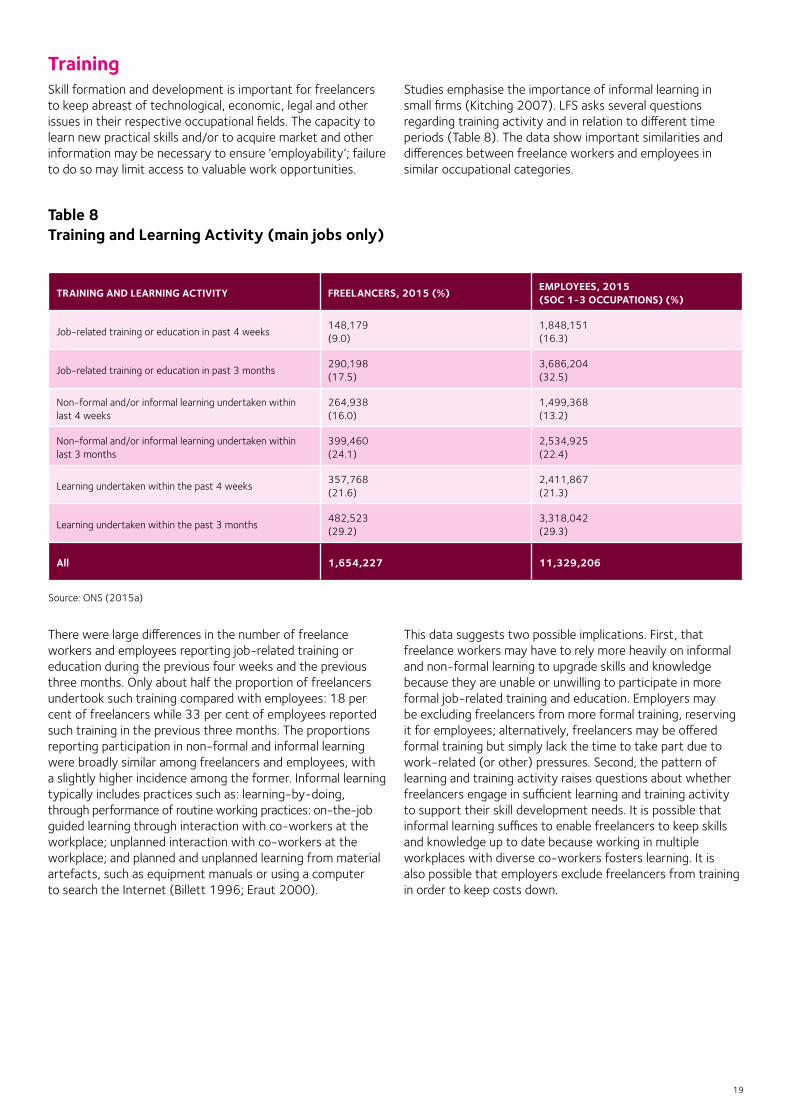
TrainingSkill formation and development is important for freelancers to keep abreast of technological, economic, legal and other issues in their respective occupational fields. The capacity to learn new practical skills and/or to acquire market and other information may be necessary to ensure ‘employability’; failure to do so may limit access to valuable work opportunities.
Studies emphasise the importance of informal learning in small firms (Kitching 2007). LFS asks several questions regarding training activity and in relation to different time periods (Table 8). The data show important similarities and differences between freelance workers and employees in similar occupational categories.
Table 8 Training and Learning Activity (main jobs only)
TRAINING AND LEARNING ACTIVITY FREELANCERS, 2015 (%) EMPLOYEES, 2015 (SOC 1-3 OCCUPATIONS) (%)
Job-related training or education in past 4 weeks148,179 (9.0)
1,848,151 (16.3)
Job-related training or education in past 3 months290,198 (17.5)
3,686,204 (32.5)
Non-formal and/or informal learning undertaken within last 4 weeks
264,938 (16.0)
1,499,368 (13.2)
Non-formal and/or informal learning undertaken within last 3 months
399,460 (24.1)
2,534,925 (22.4)
Learning undertaken within the past 4 weeks357,768 (21.6)
2,411,867 (21.3)
Learning undertaken within the past 3 months482,523 (29.2)
3,318,042 (29.3)
All 1,654,227 11,329,206
Source: ONS (2015a)
There were large differences in the number of freelance workers and employees reporting job-related training or education during the previous four weeks and the previous three months. Only about half the proportion of freelancers undertook such training compared with employees: 18 per cent of freelancers while 33 per cent of employees reported such training in the previous three months. The proportions reporting participation in non-formal and informal learning were broadly similar among freelancers and employees, with a slightly higher incidence among the former. Informal learning typically includes practices such as: learning-by-doing, through performance of routine working practices: on-the-job guided learning through interaction with co-workers at the workplace; unplanned interaction with co-workers at the workplace; and planned and unplanned learning from material artefacts, such as equipment manuals or using a computer to search the Internet (Billett 1996; Eraut 2000).
This data suggests two possible implications. First, that freelance workers may have to rely more heavily on informal and non-formal learning to upgrade skills and knowledge because they are unable or unwilling to participate in more formal job-related training and education. Employers may be excluding freelancers from more formal training, reserving it for employees; alternatively, freelancers may be offered formal training but simply lack the time to take part due to work-related (or other) pressures. Second, the pattern of learning and training activity raises questions about whether freelancers engage in sufficient learning and training activity to support their skill development needs. It is possible that informal learning suffices to enable freelancers to keep skills and knowledge up to date because working in multiple workplaces with diverse co-workers fosters learning. It is also possible that employers exclude freelancers from training in order to keep costs down.
20
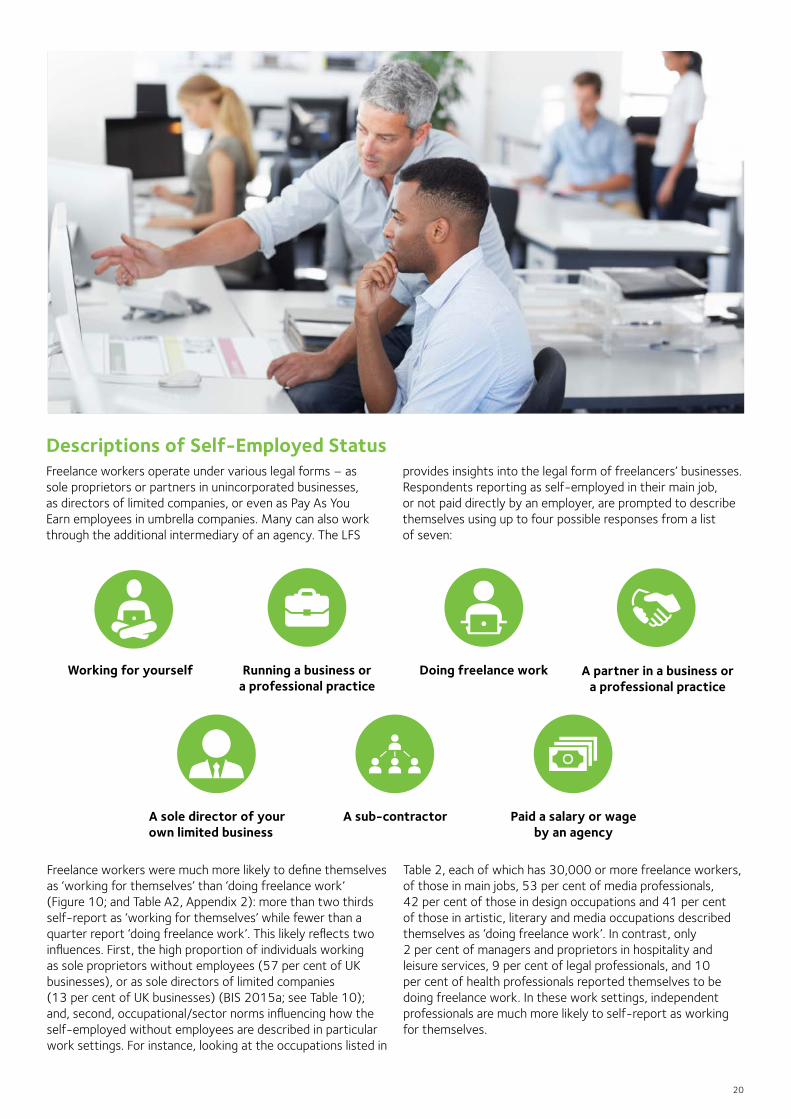
Working for yourself
Running a business or a professional practice
Doing freelance work
A sole director of your own limited businessss
A sub-contractor Paid a salary or wage by an agency
A partner in a business or a professional practice
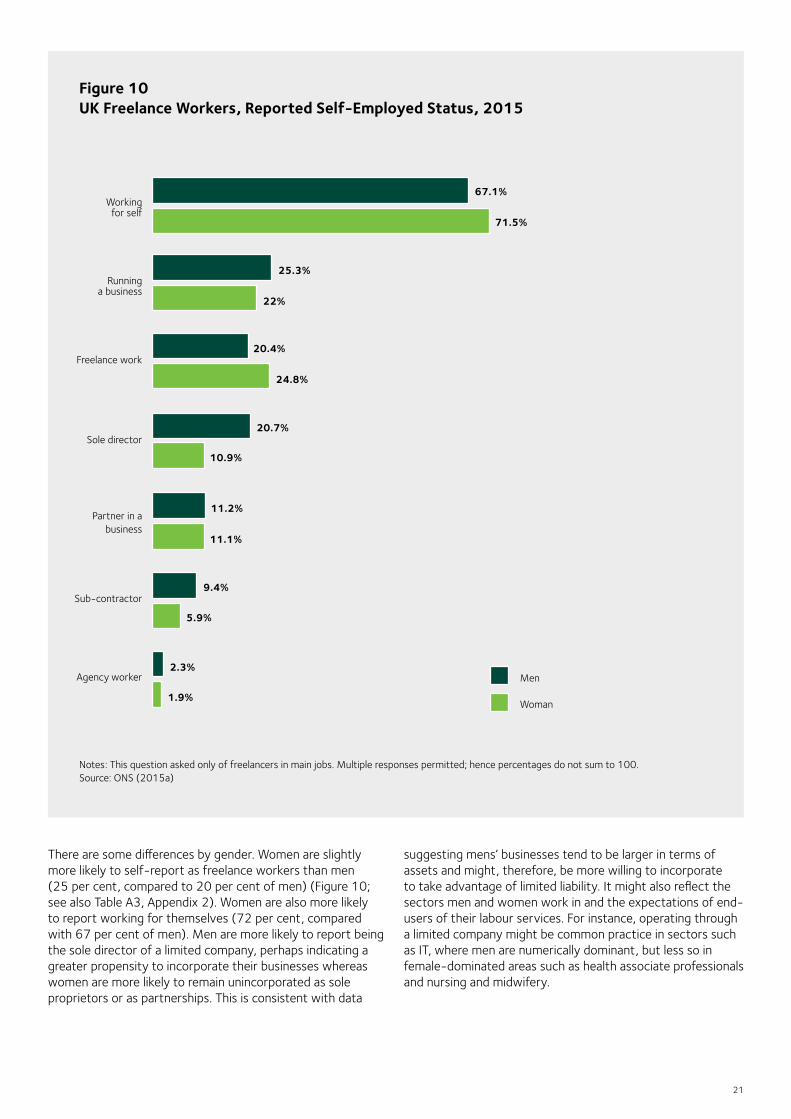
Freelance workers were much more likely to define themselves as ‘working for themselves’ than ‘doing freelance work’ (Figure 10; and Table A2, Appendix 2): more than two thirds self-report as ‘working for themselves’ while fewer than a quarter report ‘doing freelance work’. This likely reflects two influences. First, the high proportion of individuals working as sole proprietors without employees (57 per cent of UK businesses), or as sole directors of limited companies (13 per cent of UK businesses) (BIS 2015a; see Table 10); and, second, occupational/sector norms influencing how the self-employed without employees are described in particular work settings. For instance, looking at the occupations listed in
Table 2, each of which has 30,000 or more freelance workers, of those in main jobs, 53 per cent of media professionals, 42 per cent of those in design occupations and 41 per cent of those in artistic, literary and media occupations described themselves as ‘doing freelance work’. In contrast, only 2 per cent of managers and proprietors in hospitality and leisure services, 9 per cent of legal professionals, and 10 per cent of health professionals reported themselves to be doing freelance work. In these work settings, independent professionals are much more likely to self-report as working for themselves.
Descriptions of Self-Employed Status Freelance workers operate under various legal forms – as sole proprietors or partners in unincorporated businesses, as directors of limited companies, or even as Pay As You Earn employees in umbrella companies. Many can also work through the additional intermediary of an agency. The LFS
provides insights into the legal form of freelancers’ businesses. Respondents reporting as self-employed in their main job, or not paid directly by an employer, are prompted to describe themselves using up to four possible responses from a list of seven:
21
Figure 10 UK Freelance Workers, Reported Self-Employed Status, 2015
Notes: This question asked only of freelancers in main jobs. Multiple responses permitted; hence percentages do not sum to 100. Source: ONS (2015a)
There are some differences by gender. Women are slightly more likely to self-report as freelance workers than men (25 per cent, compared to 20 per cent of men) (Figure 10; see also Table A3, Appendix 2). Women are also more likely to report working for themselves (72 per cent, compared with 67 per cent of men). Men are more likely to report being the sole director of a limited company, perhaps indicating a greater propensity to incorporate their businesses whereas women are more likely to remain unincorporated as sole proprietors or as partnerships. This is consistent with data
suggesting mens’ businesses tend to be larger in terms of assets and might, therefore, be more willing to incorporate to take advantage of limited liability. It might also reflect the sectors men and women work in and the expectations of end-users of their labour services. For instance, operating through a limited company might be common practice in sectors such as IT, where men are numerically dominant, but less so in female-dominated areas such as health associate professionals and nursing and midwifery.
71.5%
67.1%
25.3%
22%
20.4%
24.8%
20.7%
10.9%
11.2%
11.1%
9.4%
5.9%
2.3%
1.9%
Working for self
Running a business
Freelance work
Sole director
Partner in a business
Sub-contractor
Agency worker Men
Woman
22
Source: ONS (2015a)
REGION FREELANCERS (%) EMPLOYEES (%)
Rest of South East423,773 (22.2)
5,293,128 (19.6)
South West219,421 (11.5)
2,282,352 (8.5)
Inner London199,172 (10.4)
1,483,759 (5.5)
Outer London192,180 (10.1)
2,099,547 (7.8)
East Midlands109,860 (5.8)
1,987,913 (7.4)
Rest of West Midlands84,491 (4.4)
1,236,909 (4.6)
Greater Manchester82,444 (4.3)
1,128,173 (4.2)
Rest of Scotland76,439 (4.0)
1,400,464 (5.2)
East Anglia63,654 (3.3)
1,076,323 (4.0)
Wales61,148 (3.2)
1,255,064 (4.7)
Rest of North West58,807 (3.1)
1,038,069 (3.9)
West Midlands (met county)57,394 (3.0)
1,023,473 (3.8)
West Yorkshire52,335 (2.7)
922,531 (3.4)
Strathclyde 43,237 (2.3)
955,976 (3.5)
Rest of Yorks & Humberside40,180 (2.1)
706,898 (2.6)
Rest of Northern region39,163 (2.1)
782,356 (2.9)
Merseyside31,959 (1.7)
556,475 (2.1)
South Yorkshire30,124 (1.6)
561,198 (2.1)
Northern Ireland25,659 (1.3)
712,078 (2.6)
Tyne & Wear17,638 (0.9)
460,039 (1.7)
All 1,909,078 26,962,725
Table 9 Region of Usual Residence, 2015
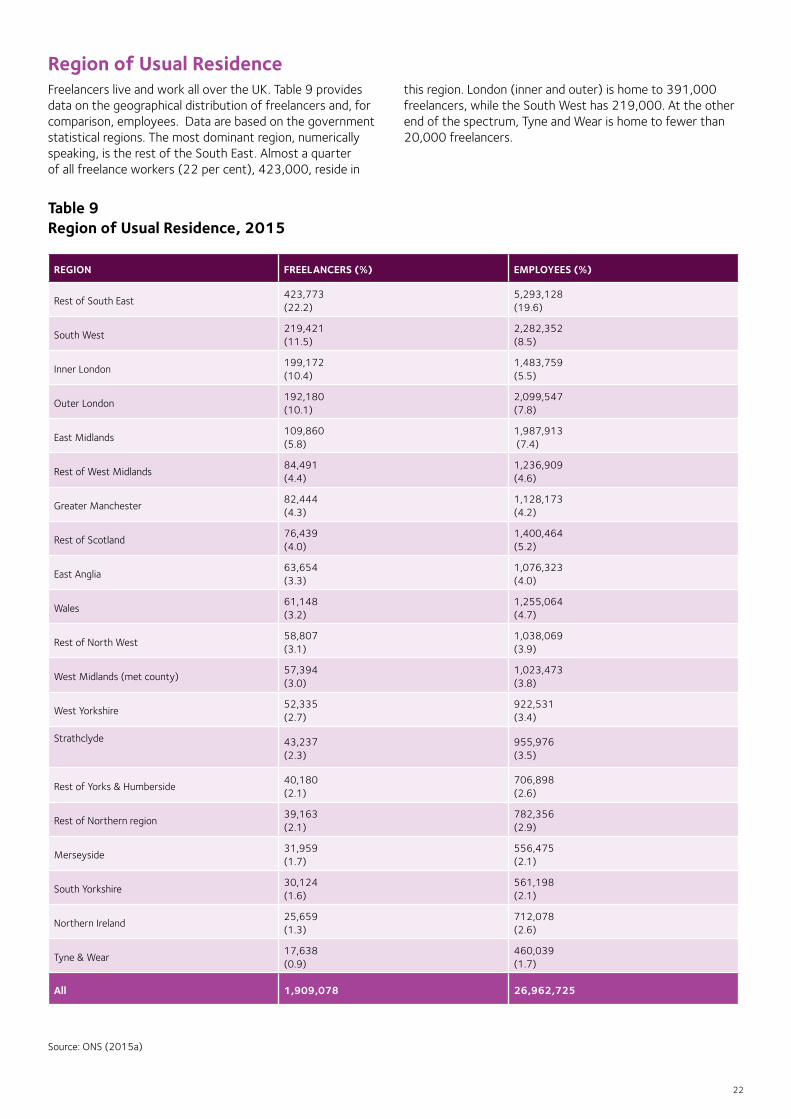
Region of Usual ResidenceFreelancers live and work all over the UK. Table 9 provides data on the geographical distribution of freelancers and, for comparison, employees. Data are based on the government statistical regions. The most dominant region, numerically speaking, is the rest of the South East. Almost a quarter of all freelance workers (22 per cent), 423,000, reside in
this region. London (inner and outer) is home to 391,000 freelancers, while the South West has 219,000. At the other end of the spectrum, Tyne and Wear is home to fewer than 20,000 freelancers.
23
Working From Home and Travel to Work TimeControl over the time and place of work is one of the reasons cited for choosing self-employment (Osnowitz 2005). Homeworking is a common practice among the self-employed (ONS 2014). Freelancers may choose to work at or from home, because it is more convenient to operate a business in this way, less expensive, or in order to combine paid work with caring, leisure or other activities. Although many employees also work at or from home for at least some of the time, the self-employed might be in a better position to make such a choice.
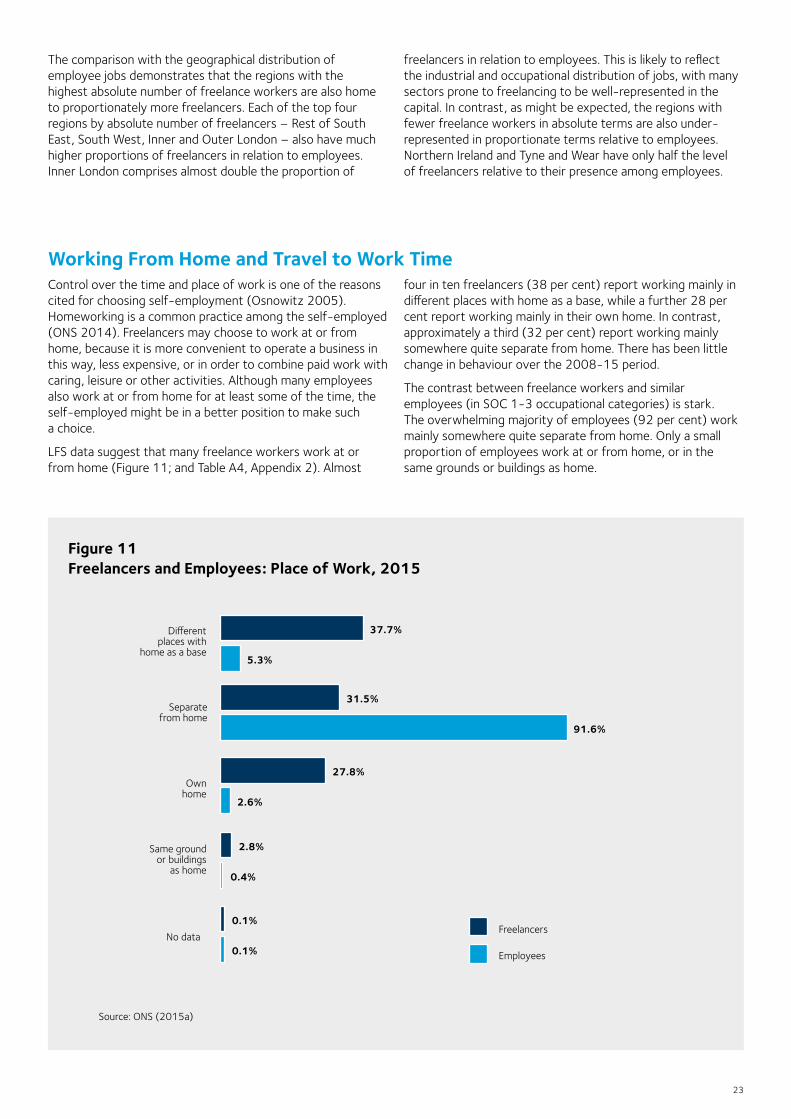
LFS data suggest that many freelance workers work at or from home (Figure 11; and Table A4, Appendix 2). Almost
four in ten freelancers (38 per cent) report working mainly in different places with home as a base, while a further 28 per cent report working mainly in their own home. In contrast, approximately a third (32 per cent) report working mainly somewhere quite separate from home. There has been little change in behaviour over the 2008-15 period.
The contrast between freelance workers and similar employees (in SOC 1-3 occupational categories) is stark. The overwhelming majority of employees (92 per cent) work mainly somewhere quite separate from home. Only a small proportion of employees work at or from home, or in the same grounds or buildings as home.
Figure 11 Freelancers and Employees: Place of Work, 2015
Source: ONS (2015a)
The comparison with the geographical distribution of employee jobs demonstrates that the regions with the highest absolute number of freelance workers are also home to proportionately more freelancers. Each of the top four regions by absolute number of freelancers – Rest of South East, South West, Inner and Outer London – also have much higher proportions of freelancers in relation to employees. Inner London comprises almost double the proportion of
freelancers in relation to employees. This is likely to reflect the industrial and occupational distribution of jobs, with many sectors prone to freelancing to be well-represented in the capital. In contrast, as might be expected, the regions with fewer freelance workers in absolute terms are also under-represented in proportionate terms relative to employees. Northern Ireland and Tyne and Wear have only half the level of freelancers relative to their presence among employees.
37.7%
5.3%
31.5%
91.6%
27.8%
2.6%
2.8%
0.4%
0.1%
0.1%
Different places with
home as a base
Separate from home
Own home
Same ground or buildings
as home
No dataFreelancers
Employees
24
Figure 12 Freelancers and Employees: Travel to Work Time(main jobs only), 2014
0
10
20
30
40
50
Notes: Data available only for workers in main jobs in Q4 each year; cases with missing data excluded. This question was asked only of those who work at a location separate from home. Source: ONS (2014a)t
There are marked gender differences in main place of work. Women are more likely to work at home (33 per cent, compared to 24 per cent of men), while men are more likely to work in different places using home as a base (41 per cent, compared to 36 per cent of women). These differences are likely to reflect, in part, women’s greater responsibility for unpaid household and care-work. Women wishing to combine paid work with looking after children and/or elderly relatives might find that working freelance at home provides them with the required flexibility.
Before coming to travel to work times, it is worth bearing in mind that the number of freelancers working at home has risen in both absolute and proportionate terms since 2008. Freelancer numbers working from home have increased from 358,000 to 531,000 between 2008-15 (Table A4),
a proportionate rise from 26 to 28 per cent of all freelancers. There are therefore fewer freelancers, in proportionate terms, who have to travel to work at all.
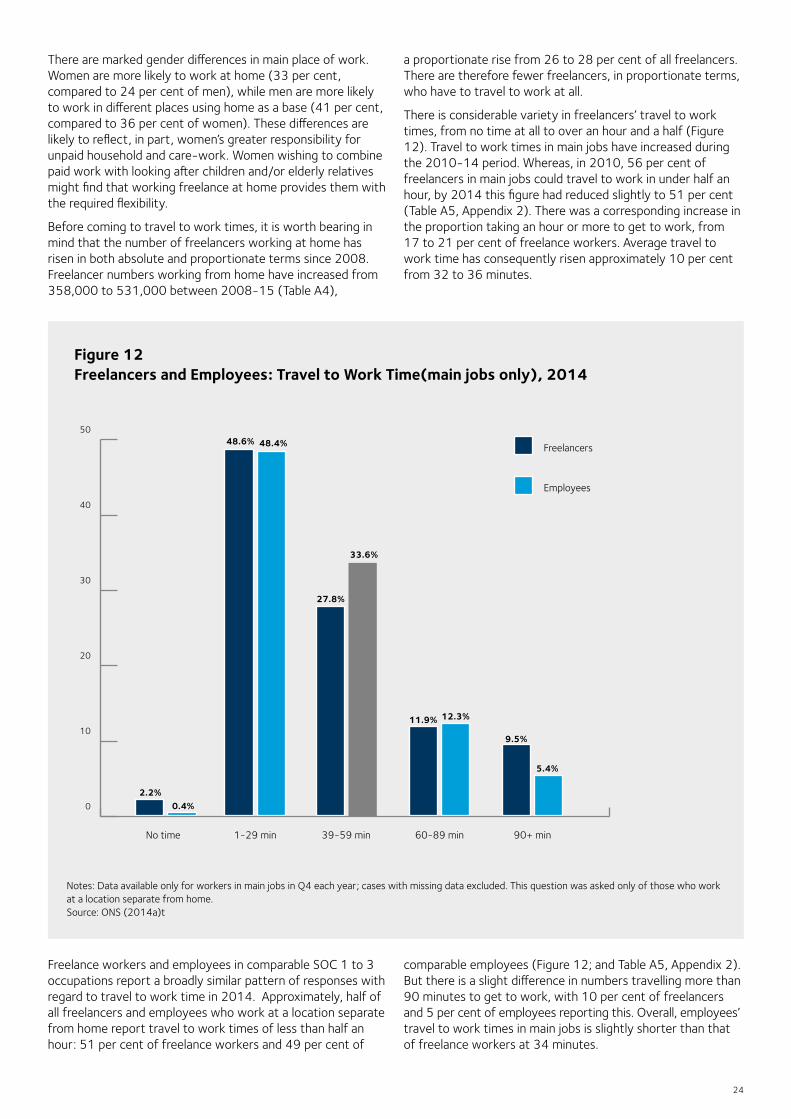
There is considerable variety in freelancers’ travel to work times, from no time at all to over an hour and a half (Figure 12). Travel to work times in main jobs have increased during the 2010-14 period. Whereas, in 2010, 56 per cent of freelancers in main jobs could travel to work in under half an hour, by 2014 this figure had reduced slightly to 51 per cent (Table A5, Appendix 2). There was a corresponding increase in the proportion taking an hour or more to get to work, from 17 to 21 per cent of freelance workers. Average travel to work time has consequently risen approximately 10 per cent from 32 to 36 minutes.
Freelance workers and employees in comparable SOC 1 to 3 occupations report a broadly similar pattern of responses with regard to travel to work time in 2014. Approximately, half of all freelancers and employees who work at a location separate from home report travel to work times of less than half an hour: 51 per cent of freelance workers and 49 per cent of
comparable employees (Figure 12; and Table A5, Appendix 2). But there is a slight difference in numbers travelling more than 90 minutes to get to work, with 10 per cent of freelancers and 5 per cent of employees reporting this. Overall, employees’ travel to work times in main jobs is slightly shorter than that of freelance workers at 34 minutes.
2.2%0.4%
48.6% 48.4%
27.8%
33.6%
11.9% 12.3%
9.5%
5.4%
Freelancers
No time 1-29 min 39-59 min 60-89 min 90+ min
Employees
25
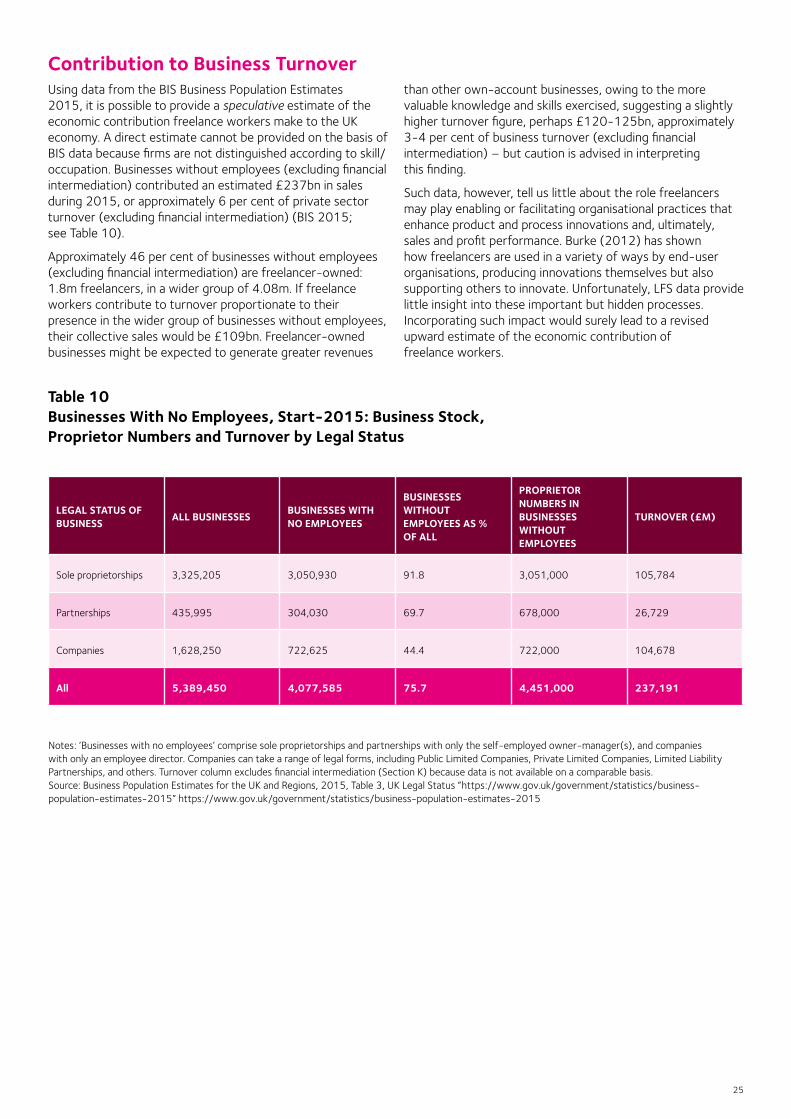
Contribution to Business Turnover Using data from the BIS Business Population Estimates 2015, it is possible to provide a speculative estimate of the economic contribution freelance workers make to the UK economy. A direct estimate cannot be provided on the basis of BIS data because firms are not distinguished according to skill/occupation. Businesses without employees (excluding financial intermediation) contributed an estimated £237bn in sales during 2015, or approximately 6 per cent of private sector turnover (excluding financial intermediation) (BIS 2015; see Table 10).
Approximately 46 per cent of businesses without employees (excluding financial intermediation) are freelancer-owned: 1.8m freelancers, in a wider group of 4.08m. If freelance workers contribute to turnover proportionate to their presence in the wider group of businesses without employees, their collective sales would be £109bn. Freelancer-owned businesses might be expected to generate greater revenues
than other own-account businesses, owing to the more valuable knowledge and skills exercised, suggesting a slightly higher turnover figure, perhaps £120-125bn, approximately 3-4 per cent of business turnover (excluding financial intermediation) – but caution is advised in interpreting this finding.
Such data, however, tell us little about the role freelancers may play enabling or facilitating organisational practices that enhance product and process innovations and, ultimately, sales and profit performance. Burke (2012) has shown how freelancers are used in a variety of ways by end-user organisations, producing innovations themselves but also supporting others to innovate. Unfortunately, LFS data provide little insight into these important but hidden processes. Incorporating such impact would surely lead to a revised upward estimate of the economic contribution of freelance workers.
Table 10 Businesses With No Employees, Start-2015: Business Stock, Proprietor Numbers and Turnover by Legal Status
LEGAL STATUS OF BUSINESS ALL BUSINESSES BUSINESSES WITH
NO EMPLOYEES
BUSINESSES WITHOUT EMPLOYEES AS % OF ALL
PROPRIETOR NUMBERS IN BUSINESSES WITHOUT EMPLOYEES
TURNOVER (£M)
Sole proprietorships 3,325,205 3,050,930 91.8 3,051,000 105,784
Partnerships 435,995 304,030 69.7 678,000 26,729
Companies 1,628,250 722,625 44.4 722,000 104,678
All 5,389,450 4,077,585 75.7 4,451,000 237,191
Notes: ‘Businesses with no employees’ comprise sole proprietorships and partnerships with only the self-employed owner-manager(s), and companies with only an employee director. Companies can take a range of legal forms, including Public Limited Companies, Private Limited Companies, Limited Liability Partnerships, and others. Turnover column excludes financial intermediation (Section K) because data is not available on a comparable basis. Source: Business Population Estimates for the UK and Regions, 2015, Table 3, UK Legal Status “https://www.gov.uk/government/statistics/business-population-estimates-2015” https://www.gov.uk/government/statistics/business-population-estimates-2015
26
Conclusion This report has provided a portrait of the UK freelance workforce using official statistics. Defining freelance workers as self-employed workers, working alone or with partners, but without employees in SOC 1-3 occupations, it is estimated that there are 1.91m freelance workers in the UK. This figure includes 1.65m in main jobs and a further 255,000 in second jobs. Freelance workers constitute 6 per cent of all in employment.
Freelancer numbers have increased 22 per cent in the 2011-15 period, and 36 per cent over the 2008-15 period. Although the research covers only a relatively short period of seven years, the data are suggestive of a substantial shift in labour market processes. That the increase in freelancing in these seven years occurred during both periods of economic crisis and during a period of growth, albeit modest, suggest that a return to previous patterns of economic growth may not bring with it a return to prior employment patterns. Freelancing looks likely to remain very important.
Freelance workers remain important contributors to the UK economy. One tentative estimate might suggest that freelance workers contribute approximately 3-4 per cent
of private sector output, as well as facilitating wealth creation by the organisations that engage them. Freelancers enable organisational clients in a wide variety of industries and occupational settings to adapt labour practices flexibly to meet operational requirements in order to increase efficiency and manage risk better.
The evidence base on the demand-side of the freelancer labour market is, however, limited and fragmented. We still have only a partial picture of the reasons end-users of freelancer services, both organisational and personal, hire freelance labour, and of the nature and extent of use. Exploring the demand side of the freelance labour market in more depth would enlarge our understanding of the use and value of freelance working in the UK - its drivers, processes and consequences. This would contribute to an assessment of the value of freelance working to individuals, organisations and the wider UK economy. Such knowledge would be of value to freelance workers and their representative associations, organisational users of freelance workers, and policy-makers interested in facilitating freelance working in the UK.
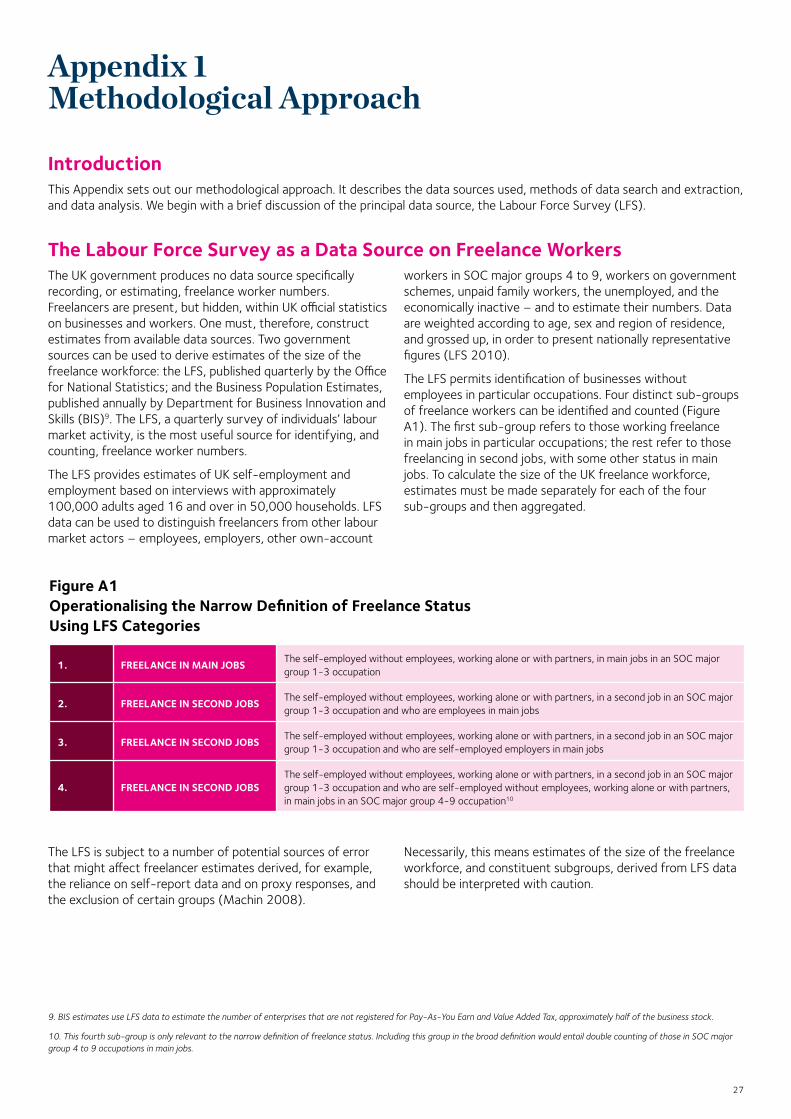
27
Appendix 1 Methodological Approach
IntroductionThis Appendix sets out our methodological approach. It describes the data sources used, methods of data search and extraction, and data analysis. We begin with a brief discussion of the principal data source, the Labour Force Survey (LFS).
The Labour Force Survey as a Data Source on Freelance WorkersThe UK government produces no data source specifically recording, or estimating, freelance worker numbers. Freelancers are present, but hidden, within UK official statistics on businesses and workers. One must, therefore, construct estimates from available data sources. Two government sources can be used to derive estimates of the size of the freelance workforce: the LFS, published quarterly by the Office for National Statistics; and the Business Population Estimates, published annually by Department for Business Innovation and Skills (BIS)9. The LFS, a quarterly survey of individuals’ labour market activity, is the most useful source for identifying, and counting, freelance worker numbers.
The LFS provides estimates of UK self-employment and employment based on interviews with approximately 100,000 adults aged 16 and over in 50,000 households. LFS data can be used to distinguish freelancers from other labour market actors – employees, employers, other own-account
workers in SOC major groups 4 to 9, workers on government schemes, unpaid family workers, the unemployed, and the economically inactive – and to estimate their numbers. Data are weighted according to age, sex and region of residence, and grossed up, in order to present nationally representative figures (LFS 2010).
The LFS permits identification of businesses without employees in particular occupations. Four distinct sub-groups of freelance workers can be identified and counted (Figure A1). The first sub-group refers to those working freelance in main jobs in particular occupations; the rest refer to those freelancing in second jobs, with some other status in main jobs. To calculate the size of the UK freelance workforce, estimates must be made separately for each of the four sub-groups and then aggregated.
Figure A1 Operationalising the Narrow Definition of Freelance Status Using LFS Categories
1. FREELANCE IN MAIN JOBS The self-employed without employees, working alone or with partners, in main jobs in an SOC major group 1-3 occupation
2. FREELANCE IN SECOND JOBS The self-employed without employees, working alone or with partners, in a second job in an SOC major group 1-3 occupation and who are employees in main jobs
3. FREELANCE IN SECOND JOBS The self-employed without employees, working alone or with partners, in a second job in an SOC major group 1-3 occupation and who are self-employed employers in main jobs
4. FREELANCE IN SECOND JOBSThe self-employed without employees, working alone or with partners, in a second job in an SOC major group 1-3 occupation and who are self-employed without employees, working alone or with partners, in main jobs in an SOC major group 4-9 occupation10
The LFS is subject to a number of potential sources of error that might affect freelancer estimates derived, for example, the reliance on self-report data and on proxy responses, and the exclusion of certain groups (Machin 2008).
Necessarily, this means estimates of the size of the freelance workforce, and constituent subgroups, derived from LFS data should be interpreted with caution.
9. BIS estimates use LFS data to estimate the number of enterprises that are not registered for Pay-As-You Earn and Value Added Tax, approximately half of the business stock.
10. This fourth sub-group is only relevant to the narrow definition of freelance status. Including this group in the broad definition would entail double counting of those in SOC major group 4 to 9 occupations in main jobs.
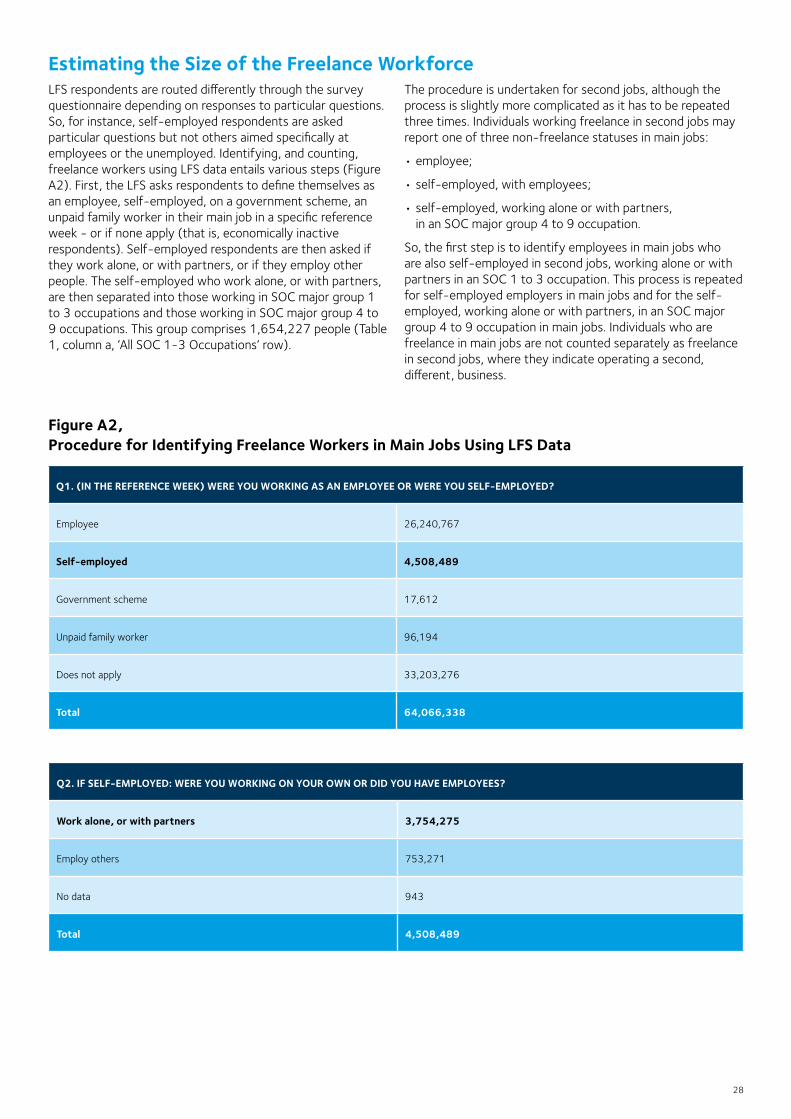
28
Estimating the Size of the Freelance WorkforceLFS respondents are routed differently through the survey questionnaire depending on responses to particular questions. So, for instance, self-employed respondents are asked particular questions but not others aimed specifically at employees or the unemployed. Identifying, and counting, freelance workers using LFS data entails various steps (Figure A2). First, the LFS asks respondents to define themselves as an employee, self-employed, on a government scheme, an unpaid family worker in their main job in a specific reference week - or if none apply (that is, economically inactive respondents). Self-employed respondents are then asked if they work alone, or with partners, or if they employ other people. The self-employed who work alone, or with partners, are then separated into those working in SOC major group 1 to 3 occupations and those working in SOC major group 4 to 9 occupations. This group comprises 1,654,227 people (Table 1, column a, ‘All SOC 1-3 Occupations’ row).
The procedure is undertaken for second jobs, although the process is slightly more complicated as it has to be repeated three times. Individuals working freelance in second jobs may report one of three non-freelance statuses in main jobs:
• employee;
• self-employed, with employees;
• self-employed, working alone or with partners, in an SOC major group 4 to 9 occupation.
So, the first step is to identify employees in main jobs who are also self-employed in second jobs, working alone or with partners in an SOC 1 to 3 occupation. This process is repeated for self-employed employers in main jobs and for the self-employed, working alone or with partners, in an SOC major group 4 to 9 occupation in main jobs. Individuals who are freelance in main jobs are not counted separately as freelance in second jobs, where they indicate operating a second, different, business.
Figure A2, Procedure for Identifying Freelance Workers in Main Jobs Using LFS Data
Q1. (IN THE REFERENCE WEEK) WERE YOU WORKING AS AN EMPLOYEE OR WERE YOU SELF-EMPLOYED?
Employee 26,240,767
Self-employed 4,508,489
Government scheme 17,612
Unpaid family worker 96,194
Does not apply 33,203,276
Total 64,066,338
Q2. IF SELF-EMPLOYED: WERE YOU WORKING ON YOUR OWN OR DID YOU HAVE EMPLOYEES?
Work alone, or with partners 3,754,275
Employ others 753,271
No data 943
Total 4,508,489
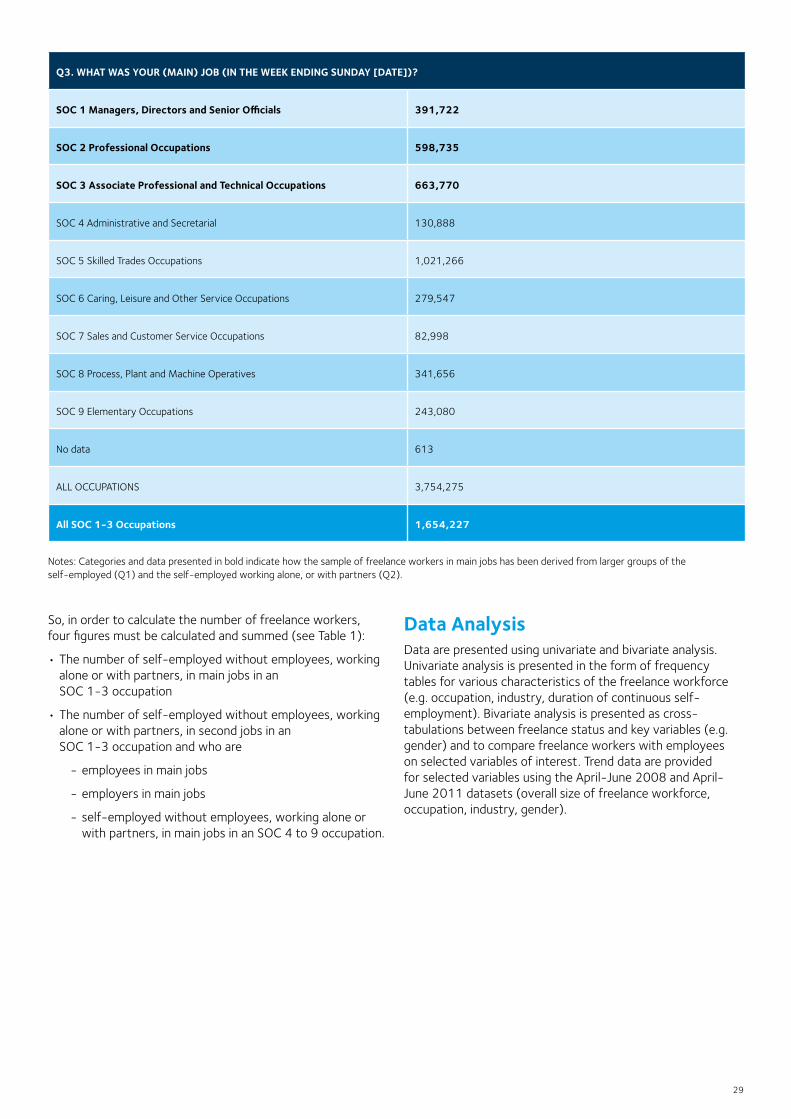
29
Q3. WHAT WAS YOUR (MAIN) JOB (IN THE WEEK ENDING SUNDAY [DATE])?
SOC 1 Managers, Directors and Senior Officials 391,722
SOC 2 Professional Occupations 598,735
SOC 3 Associate Professional and Technical Occupations 663,770
SOC 4 Administrative and Secretarial 130,888
SOC 5 Skilled Trades Occupations 1,021,266
SOC 6 Caring, Leisure and Other Service Occupations 279,547
SOC 7 Sales and Customer Service Occupations 82,998
SOC 8 Process, Plant and Machine Operatives 341,656
SOC 9 Elementary Occupations 243,080
No data 613
ALL OCCUPATIONS 3,754,275
All SOC 1-3 Occupations 1,654,227
Notes: Categories and data presented in bold indicate how the sample of freelance workers in main jobs has been derived from larger groups of the self-employed (Q1) and the self-employed working alone, or with partners (Q2).
So, in order to calculate the number of freelance workers, four figures must be calculated and summed (see Table 1):
• The number of self-employed without employees, working alone or with partners, in main jobs in an SOC 1-3 occupation
• The number of self-employed without employees, working alone or with partners, in second jobs in an SOC 1-3 occupation and who are
- employees in main jobs
- employers in main jobs
- self-employed without employees, working alone or with partners, in main jobs in an SOC 4 to 9 occupation.
Data Analysis Data are presented using univariate and bivariate analysis. Univariate analysis is presented in the form of frequency tables for various characteristics of the freelance workforce (e.g. occupation, industry, duration of continuous self-employment). Bivariate analysis is presented as cross-tabulations between freelance status and key variables (e.g. gender) and to compare freelance workers with employees on selected variables of interest. Trend data are provided for selected variables using the April-June 2008 and April-June 2011 datasets (overall size of freelance workforce, occupation, industry, gender).
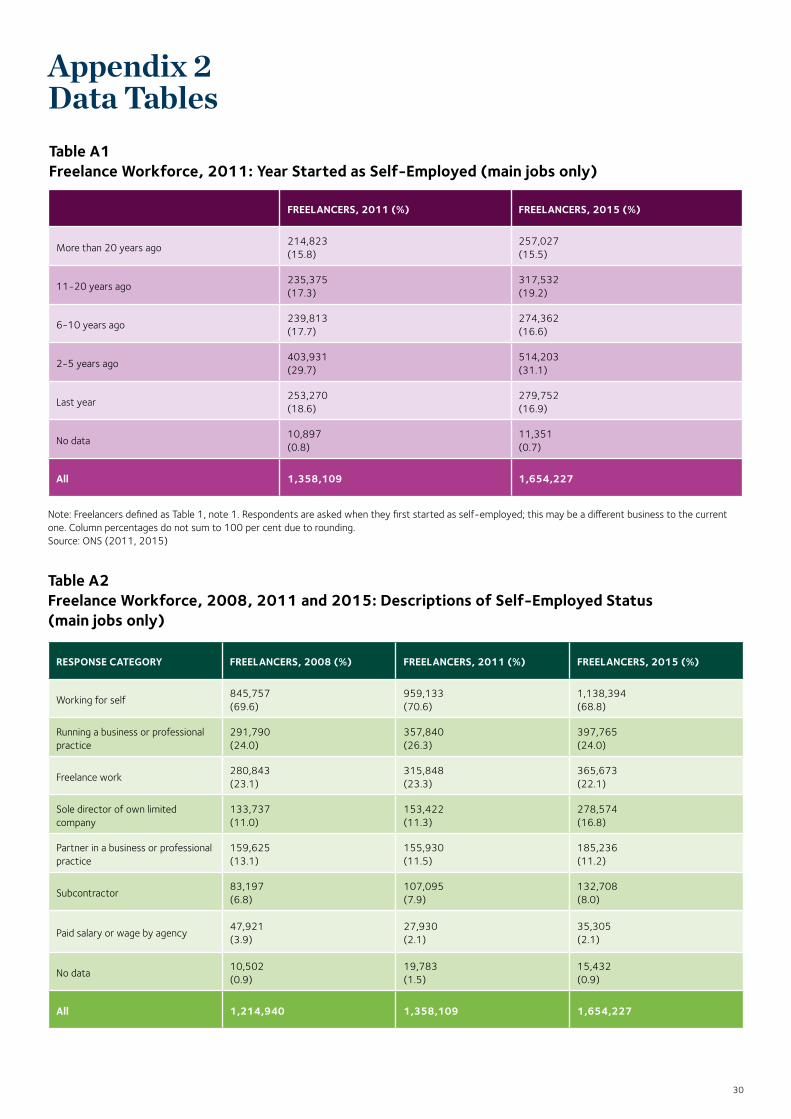
30
Appendix 2 Data TablesTable A1 Freelance Workforce, 2011: Year Started as Self-Employed (main jobs only)
FREELANCERS, 2011 (%) FREELANCERS, 2015 (%)
More than 20 years ago214,823 (15.8)
257,027 (15.5)
11-20 years ago235,375 (17.3)
317,532 (19.2)
6-10 years ago239,813 (17.7)
274,362 (16.6)
2-5 years ago403,931 (29.7)
514,203 (31.1)
Last year253,270 (18.6)
279,752 (16.9)
No data10,897 (0.8)
11,351 (0.7)
All 1,358,109 1,654,227
Note: Freelancers defined as Table 1, note 1. Respondents are asked when they first started as self-employed; this may be a different business to the current one. Column percentages do not sum to 100 per cent due to rounding. Source: ONS (2011, 2015)
Table A2 Freelance Workforce, 2008, 2011 and 2015: Descriptions of Self-Employed Status (main jobs only)
RESPONSE CATEGORY FREELANCERS, 2008 (%) FREELANCERS, 2011 (%) FREELANCERS, 2015 (%)
Working for self845,757 (69.6)
959,133 (70.6)
1,138,394 (68.8)
Running a business or professional practice
291,790 (24.0)
357,840 (26.3)
397,765 (24.0)
Freelance work280,843 (23.1)
315,848 (23.3)
365,673 (22.1)
Sole director of own limited company
133,737 (11.0)
153,422 (11.3)
278,574 (16.8)
Partner in a business or professional practice
159,625 (13.1)
155,930 (11.5)
185,236 (11.2)
Subcontractor83,197 (6.8)
107,095 (7.9)
132,708 (8.0)
Paid salary or wage by agency47,921 (3.9)
27,930 (2.1)
35,305 (2.1)
No data10,502 (0.9)
19,783 (1.5)
15,432 (0.9)
All 1,214,940 1,358,109 1,654,227
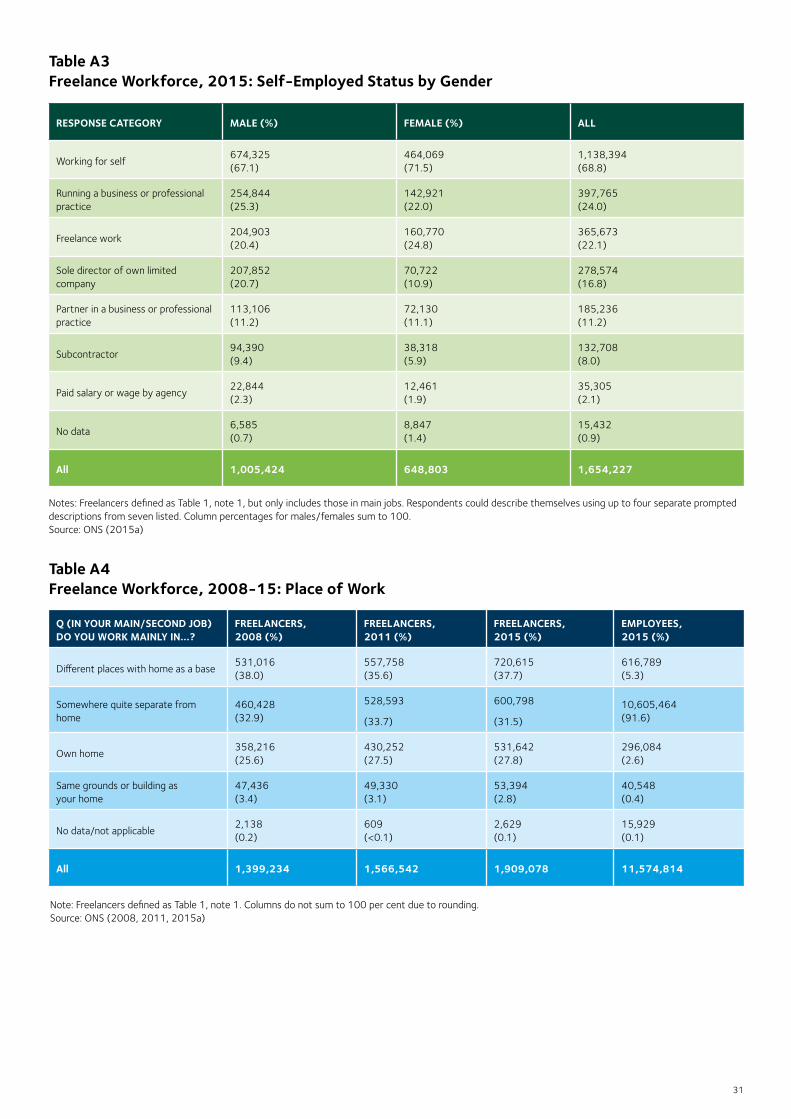
31
Table A4 Freelance Workforce, 2008-15: Place of Work
Q (IN YOUR MAIN/SECOND JOB) DO YOU WORK MAINLY IN...?
FREELANCERS, 2008 (%)
FREELANCERS, 2011 (%)
FREELANCERS, 2015 (%)
EMPLOYEES, 2015 (%)
Different places with home as a base531,016 (38.0)
557,758 (35.6)
720,615 (37.7)
616,789 (5.3)
Somewhere quite separate from home
460,428 (32.9)
528,593
(33.7)
600,798
(31.5)
10,605,464 (91.6)
Own home358,216 (25.6)
430,252 (27.5)
531,642 (27.8)
296,084 (2.6)
Same grounds or building as your home
47,436 (3.4)
49,330 (3.1)
53,394 (2.8)
40,548 (0.4)
No data/not applicable2,138 (0.2)
609 (<0.1)
2,629 (0.1)
15,929 (0.1)
All 1,399,234 1,566,542 1,909,078 11,574,814
Note: Freelancers defined as Table 1, note 1. Columns do not sum to 100 per cent due to rounding. Source: ONS (2008, 2011, 2015a)
Table A3 Freelance Workforce, 2015: Self-Employed Status by Gender
RESPONSE CATEGORY MALE (%) FEMALE (%) ALL
Working for self674,325 (67.1)
464,069 (71.5)
1,138,394 (68.8)
Running a business or professional practice
254,844 (25.3)
142,921 (22.0)
397,765 (24.0)
Freelance work204,903 (20.4)
160,770 (24.8)
365,673 (22.1)
Sole director of own limited company
207,852 (20.7)
70,722 (10.9)
278,574 (16.8)
Partner in a business or professional practice
113,106 (11.2)
72,130 (11.1)
185,236 (11.2)
Subcontractor94,390 (9.4)
38,318 (5.9)
132,708 (8.0)
Paid salary or wage by agency22,844 (2.3)
12,461 (1.9)
35,305 (2.1)
No data6,585 (0.7)
8,847 (1.4)
15,432 (0.9)
All 1,005,424 648,803 1,654,227
Notes: Freelancers defined as Table 1, note 1, but only includes those in main jobs. Respondents could describe themselves using up to four separate prompted descriptions from seven listed. Column percentages for males/females sum to 100. Source: ONS (2015a)
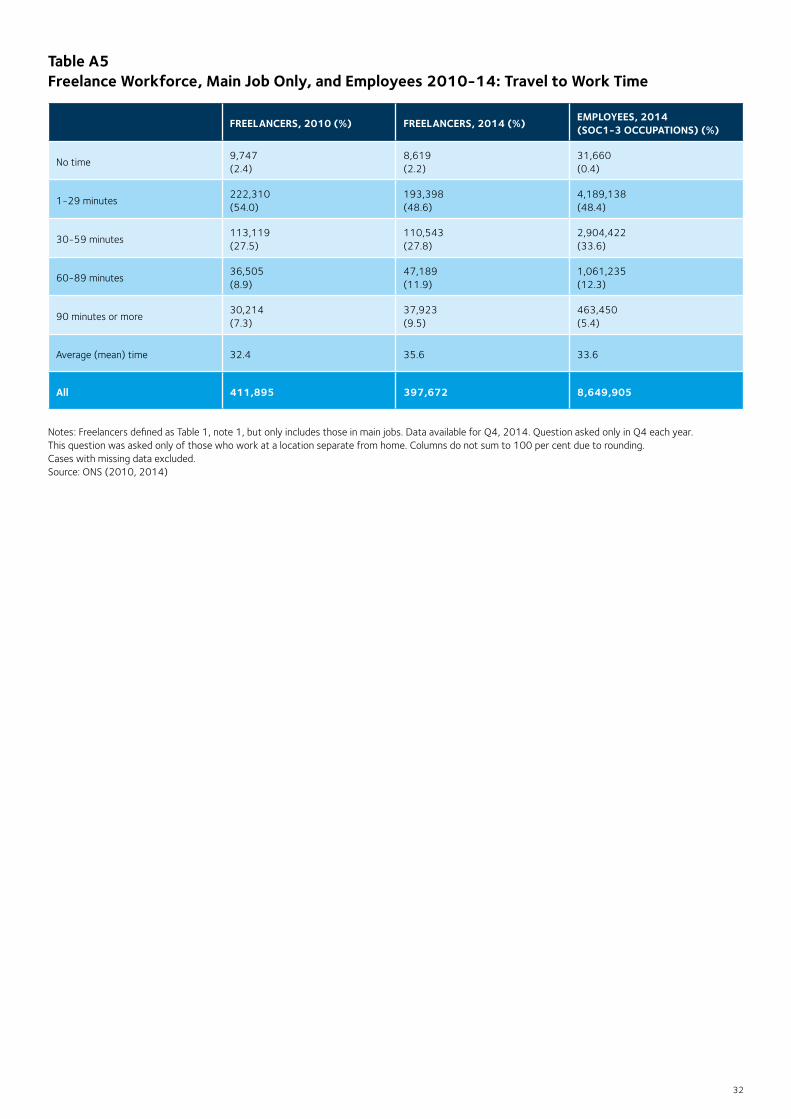
32
Table A5 Freelance Workforce, Main Job Only, and Employees 2010-14: Travel to Work Time
FREELANCERS, 2010 (%) FREELANCERS, 2014 (%) EMPLOYEES, 2014 (SOC1-3 OCCUPATIONS) (%)
No time9,747 (2.4)
8,619 (2.2)
31,660 (0.4)
1-29 minutes222,310 (54.0)
193,398 (48.6)
4,189,138 (48.4)
30-59 minutes113,119 (27.5)
110,543 (27.8)
2,904,422 (33.6)
60-89 minutes36,505 (8.9)
47,189 (11.9)
1,061,235 (12.3)
90 minutes or more30,214 (7.3)
37,923 (9.5)
463,450 (5.4)
Average (mean) time 32.4 35.6 33.6
All 411,895 397,672 8,649,905
Notes: Freelancers defined as Table 1, note 1, but only includes those in main jobs. Data available for Q4, 2014. Question asked only in Q4 each year. This question was asked only of those who work at a location separate from home. Columns do not sum to 100 per cent due to rounding. Cases with missing data excluded. Source: ONS (2010, 2014)
33
References
Antcliff, V. (2005) ‘Broadcasting in the 1990s: Competition, Choice and Inequality?’ Media, Culture and Society, 27 (6) 841-859.
Baines, S. and Wheelock, J. (1998) ‘Reinventing traditional solutions: job creation, gender and the micro-business household’. Work, Employment and Society, 12 (4) 579-601.
Baines, S. (1999) ‘Servicing the media: freelancing, teleworking and “enterprising’ careers’. New Technology, Work and Employment, 14 (1) 18-31.
Baroness Mone OBE (2016) Boosting Enterprise in More Deprived Communities. Online at: https://www.gov.uk/government/publications/boosting-enterprise-in-more-deprived-communities
Burke, A. (2012) ‘The Role of Freelancers in the 21st Century British Economy’. Online at: https://www.ipse.co.uk/sites/default/files/documents/research/Andrew-Burke-Reportv1.pdfpcg_andrew_burke_report_web.pdf
Carter, S. and Bennett, D. (2006) ‘Gender and entrepreneurship’, in S. Carter and D. Jones-Evans (eds) Enterprise and Small Business (2nd ed), Pearson, Harlow.
D’Arcy, C. and Gardiner, L. (2014) ‘Just the job – or a working compromise? The changing nature of self-employment in the UK’, Resolution Foundation. Online at: http://www.resolutionfoundation.org/publications/just-the-job-or-a-working-compromise-the-changing-nature-of-self-employment/
Davenport, J. (2006) ‘UK film companies: project-based organizations lacking entrepreneurship and innovativeness?’ Creativity and Innovation Management, 15 (3) pp.250-257.
Deane, J. (2016) ‘Self-Employment Review: An independent report’. Online at: https://www.gov.uk/government/publications/self-employment-review
Dellot, B. (2014a) ‘Salvation in a Start-up? The origins and nature of the self-employment boom’. RSA report. Online at: https://www.thersa.org/globalassets/pdfs/blogs/salvation-in-a-start-up-report-180714.pdf
Department for Business Innovation and Skills (BIS) (2015) ‘Business Population Estimates for the UK and Regions 2015’. Online at: http://www.bis.gov.uk/analysis/statistics/business-population-estimates
Department for Business Innovation and Skills (BIS) (2016) ‘The Income of the Self-employed’. Online at: https://www.gov.uk/government/publications/income-of-the-self-employed
Dex, S., Willis, J., Paterson, R. and Sheppard, E. (2000) ‘Freelance workers and contract uncertainty: the effects of contractual changes in the television industry’. Work, Employment and Society, 14 (2) 283-305.
Ekinsmyth, C. (2011) ‘Challenging the boundaries of entrepreneurship: the spatialities and practices of UK “mumpreneurs”’. Geoforum, 42 (1) 104-114.
Elias, P. and Birch, M. (2010) ‘SOC2010: Revision of the Standard Occupational Classification’. Economic & Labour Market Review, 4 (7) 48-55.
Eraut, M. (2000) ‘Non-formal learning, implicit learning and tacit knowledge in professional work’, in F. Coffield (ed.). The Necessity of Informal Learning, Bristol: Policy Press.
Fenwick, T. (2006) ‘Contradictions in portfolio careers: work design and client relations’. Career Development International, Vol. 11, No. 1, pp.66-79.
Fraser, J. and Gold, M. (2001) ‘“Portfolio workers”: autonomy and control amongst freelance translators’. Work, Employment and Society, 15 (4) 679-697.
Gardiner, L. (2014) ‘All accounted for: The case for an ‘all worker’ earnings measure’. Online at: http://www.resolutionfoundation.org/wp-content/uploads/2014/08/All-accounted-for-the-case-for-an-all-worker-earnings-measure.pdf
Granger, B., Stanworth, J. and Stanworth, C. (1995) ‘Self-employment career dynamics: the case of “unemployment push” in UK book publishing’. Work, Employment and Society, 9 (3) 499-516.
34
Kibler, E., Wainwright, T., Kautonen, T. and Blackburn, R. (2012) ‘(Work)life After Work?: Older Entrepreneurship in London – Motivations and Barriers’, Small Business Research Centre, Kingston University, project report.
Kitching, J. (2007) ‘Regulating employment relations through workplace learning: a study of small employers’. Human Resource Management Journal, 17 (1) 42-57.
Kitching, J. (2015) ‘Tracking UK freelance workforce trends 1992-2015’, in A. Burke (ed) The Handbook of Research on Freelancing and Self-Employment, Senate Hall, Dublin, pp.15-28.
Kitching, J. and Smallbone, D. (2008) ‘Defining and Estimating the Size of the UK Freelance Workforce’, a report for the Professional Contractors Group.
Kitching, J. and Smallbone, D. (2012a) ‘Exploring the UK Freelance Workforce, 2011’. Online at: https://www.ipse.co.uk/sites/default/files/documents/research/Kingston-Report-v1.pdf
Kitching, J. and Smallbone, D. (2012b) ‘Are freelancers a neglected form of small business?’. Journal of Small Business and Enterprise Development, 19 (1) 74-91.
Kunda, G., Barley, S. and Evans, J. (2002) ‘Why do contractors contract? The experience of highly skilled technical professionals in a contingent labor market’. Industrial and Labor Relations Review, 55 (2) 234–61.
Labour Force Survey (2010) Labour Force Survey: 2010 Questionnaire. Online at: http://www.esds.ac.uk/doc/6715/mrdoc/pdf/lfs_user_guide_vol2_questionnaire2010.pdf
Machin, A. (2008) ‘Comparison of statistics on jobs: September 2007’. Economic & Labour Market Review, 2 (3) 18-23.
Mallon, M. (1998) ‘The portfolio career: pulled or pushed to it?’. Personnel Review, 27 (5) 361-377.
Mould, O., Vorley, T.and Liu, K. (2014) ‘Invisible Creativity? Highlighting the Hidden Impact of Freelancing in London’s Creative Industries’. European Planning Studies, 22 (12) 2436-2455.
Nel, P., Maritz, A. and Thongprovati, O. (2010) ‘Motherhood and entrepreneurship: the mumpreneur phenomenon’. International Journal of Organizational Innovation, 3 (1) 6-34.
Office for National Statistics (ONS) (2000) Standard Occupational Classification 2000: Volume 1, Structure and Descriptions of Unit Groups. Available at: http://www.ons.gov.uk/ons/guide-method/classifications/archived-standard-classifications/standard-occupational-classification-2000/dissemination-media-and-availability/index.html
Office for National Statistics (ONS) (2009) UK Standard Industrial Classification of Economic Activities 2007 (SIC 2007): Structure and Explanatory Notes. Online at: http://www.ons.gov.uk/ons/guide-method/classifications/current-standard-classifications/standard-industrial-classification/index.html
Office for National Statistics (ONS) (2010a) Standard Occupational Classification 2010: Volume 1, Structure and Descriptions of Unit Groups. Online at: http://www.ons.gov.uk/ons/guide-method/classifications/current-standard-classifications/soc2010/soc2010-volume-1-structure-and-descriptions-of-unit-groups/index.html#1
Office for National Statistics (ONS) (2010b) Quarterly Labour Force Survey, October - December, 2010. 2nd Edition. Colchester, Essex: UK Data Archive, November 2014.
Office for National Statistics (ONS) (2014a) Quarterly Labour Force Survey, October - December, 2014. Colchester, Essex: UK Data Archive, February 2015.
Office for National Statistics (2014b), Characteristics of Home Workers, 2014. Online at: http://www.ons.gov.uk/ons/dcp171776_365592.pdf
Office for National Statistics (ONS) (2015a) Quarterly Labour Force Survey, April - June, 2011. Colchester, Essex: UK Data Archive, August 2011.
Office for National Statistics (ONS) (2015b) Labour Force Survey Summary. Online at: http://www.ons.gov.uk/ons/publications/re-reference-tables.html?edition=tcm%3A77-381603
Osnowitz, D. (2005) ‘Managing time in domestic space: home-based contractors and household work’. Gender & Society, 19 (1) 83-103.
35
Osnowitz, D. (2006) ‘Occupational networking as normative control: collegial exchange among contract professionals’. Work and Occupations, 33 (1) 12-41.
Perraudin, C., Thèvenot, N. and Valentin, J. (2013) ‘Avoiding the employment relationship: outsourcing and labour substitution in French manufacturing firms 1984-2003’. International Labour Review, 152 (3-4) 525-547.
Porcellato, L., Carmichael, F., Hulme, C., Ingham, B. and Prashar, A. (2010) ‘Giving older workers a voice: constraints on the employment of older people in the north west of England’. Work, Employment and Society, 24 (1) 85-103.
Purcell, K. and Purcell, J. (1998) ‘In-sourcing, outsourcing, and the growth of contingent labour as evidence of flexible employment strategies’. European Journal of Work and Organizational Psychology, 7 (1) 39-59.
Rappelli, S. (2012) ‘European I-Pros: A Study’. Online at: https://www.ipse.co.uk/sites/default/files/documents/research/efip_report_english-v1.pdf
Stanworth, C. and Druker, J. (2006) ‘Human resource solutions? Dimensions of employers’ use of temporary agency labour in the UK’. Personnel Review 35 (2) 175-190.
Stanworth, C. and Stanworth, J. (1997a) ‘Managing and externalised workforce: freelance labour-use in the UK book publishing industry’. Industrial Relations Journal, 28 (1) 43-55.
Stanworth, C. and Stanworth, J. (1997a) ‘Reluctant entrepreneurs and their clients – the case of self-employed freelance workers in the British book publishing industry’. International Small Business Journal, 16 (1) 58-73.
Storey, D. (2011) ‘Optimism and chance: the elephants in the entrepreneurship room’. International Small Business Journal, 29 (4) 303-321.
Storey, J., Salaman, G. and Platman, K. (2005) ‘Living with enterprise in an enterprise economy: freelance and contract workers in the media’. Human Relations, 58 (8) 1033-1054.
Van Wanrooy, B., Bewley, H., Bryson, A., Forth, J., Freeth, S., Stokes, L. and Wood, S. (2013) ‘Employment Relations in the Shadow of Recession: Findings from the 2011 Workplace Employment Relations Study’. Basingstoke: Palgrave Macmillan.
Weber, P. and Shaper, M. (2004) ‘Understanding the grey entrepreneur’. Journal of Enterprising Culture, 12 (2) 147-164.
36
About IPSEIPSE is the largest association of independent professionals in the EU, representing over 67,000 freelancers, contractors and consultants from every sector of the economy. It’s a not-for-profit organisation owned and run by its members.
We believe that flexibility in the labour market is crucial to Britain’s economic success, and dedicate our work to improving the landscape for the freelance way of working through our active and influential voice in government and industry.
With highly professional staff working for you, IPSE has the unique ability to demonstrate the economic value of freelancing to those in power and ensure freelancing is both considered and supported in all areas of regulation and policy. As well as being a campaigning body, IPSE provides a wide range of support services to help its members succeed in business, including tax and legal helplines, IR35 support, and compensation for illness/injury.
Founded in 1999 by a community of freelance contractors, IPSE has become the leading authority on freelancing in the UK. The association is governed by its members and any member is eligible to stand for election to the Consultative Council, and from there, for election to the Board of Directors.
IPSE Heron House, 10 Dean Farrar St, London SW1H 0DX
T +44 (0) 20 8897 9970 W www.ipse.co.uk
Small Business Research Centre Kingston University, Kingston Hill, Kingston upon Thames, Surrey KT2 7LB
T +44 (0) 20 8417 5355 E [email protected]
Copyright IPSE 2016
No part of this publication including any article, table or graphic, in whole or in part may be reproduced without IPSE’s express permission. IPSE does not endorse or indemnify any product, organisation or service mentioned within this document unless specifically stated. Whilst reasonable efforts have been made to ensure accuracy, the author is responsible for any remaining errors and omissions.