exploring nature-based solutions
TRANSCRIPT

Exploring nature-based solutionsThe role of green infrastructure in mitigating the impacts of
weather- and climate change-related natural hazards
EEA Technical report No 12/2015
ISSN 1725-2237


Exploring nature-based solutionsThe role of green infrastructure in mitigating the impacts of
weather- and climate change-related natural hazards
EEA Technical report No 12/2015

European Environment AgencyKongens Nytorv 61050 Copenhagen KDenmark
Tel.: +45 33 36 71 00Web: eea.europa.euEnquiries: eea.europa.eu/enquiries
Cover design: EEACover photo: © Elzélina Van Melle and EVM LandskabLayout: EEA/Pia Schmidt
Legal noticeThe contents of this publication do not necessarily reflect the official opinions of the European Commission or other institutions of the European Union. Neither the European Environment Agency nor any person or company acting on behalf of the Agency is responsible for the use that may be made of the information contained in this report.
Copyright notice© European Environment Agency, 2015Reproduction is authorised provided the source is acknowledged.
More information on the European Union is available on the Internet (http://europa.eu).
Luxembourg: Publications Office of the European Union, 2015
ISBN 978-92-9213-693-2ISSN 1725-2237doi:10.2800/946387

3
Contents
Exploring nature-based solutions
Contents
Acknowledgements .................................................................................................................... 4
Glossary ........................................................................................................................................ 5
Definition of terms ..................................................................................................................... 6
Executive summary .................................................................................................................... 8
1 Introduction and objectives ............................................................................................... 12
2 How to read this report ...................................................................................................... 14
3 Methodology ........................................................................................................................ 153.1 The underlying logic ..............................................................................................................153.2 Selection of ecosystem services ..........................................................................................153.3 Methodological approach ....................................................................................................16
4 Results .................................................................................................................................. 204.1 Mass stabilisation — landslides ...........................................................................................204.2 Mass stabilisation — avalanches .........................................................................................274.3 Flood protection ....................................................................................................................334.4 Storm surge protection ........................................................................................................424.5 Carbon stabilisation by ecosystems ....................................................................................48
References ................................................................................................................................. 55

Exploring nature-based solutions4
Acknowledgements
Acknowledgements
This report has been managed and prepared by the European Environment Agency (EEA) (Gorm Dige) and the European Topic Centre on Urban, Land and Soil systems (ETC/ULS) (Stefan Kleeschulte, Christopher Philipsen, Stefan Schindler and Gabriele Sonderegger). Comments and input were also provided by the European Topic Centre on Climate Change Impacts, Vulnerability and Adaptation (ETC/CCA) (Jaroslav Mysiak).
The EEA would like to acknowledge and thank the following persons for having reviewed and provided input on the draft report:
• Marco Fritz (Directorate-General for the Environment (DG Environment))
• Alfonso Gutierrez-Teira (DG Climate Action)
• Juan Perez-Lorenzo (DG Climate Action)
• Sandro Nieto-Silleras (DG Climate Action)
• Jelena Milos (DG Climate Action)
• Joachim Maes (Joint Research Centre (JRC))
• Camino Liquete (JRC)
• Marie Cugny-Seguin (EEA)
• Blaz Kurnik (EEA)
• Hans-Martin Füssel (EEA)
• Andre Jol (EEA)
• Markus Erhard (EEA)
• Andrus Meiner (EEA)
• Ronan Uhel (EEA).

5
Glossary
Exploring nature-based solutions
BGR Federal Institute for Geosciences and Natural Resources
CHF Swiss franc
CICES Common International Classification of Ecosystem Services
CIF Common Implementation Framework
CLC Corine Land Cover
DEM digital elevation model
DG Directorate-General
DLR German Aerospace Center
DRR Disaster risk reduction
EAD Expected annual damage
EAP Environment Action Programme
ECU European currency unit
EEA European Environment Agency
ELSUS European landslide susceptibility map
EM-DAT The International Disaster Database
EPA Environmental Protection Agency
ERDF European Regional Development Fund
ES Ecosystem service(s)
ESPON European Spatial Planning Observation Network
EU European Union
EUR euro
Glossary
GI Green infrastructure
GIO GMES/Copernicus initial operations
GIS Geographic Information System
GISCO Geographical Information System at the Commission
GLS Global Land Survey
GTOPO30 Global 30 Arc-Second Elevation
HIRHAM Regional atmospheric climate model based on a subset of the HIRLAM (High Resolution Limited Area Model) and ECHAM models (acronym combined from European Centre for Medium-Range Weather Forecasts & Hamburg)
IPCC Intergovernmental Panel on Climate Change
JRC Joint Research Centre
LUCAS Land use/cover area frame survey
MAES Mapping and assessment of ecosystems and their services
NGO Non-governmental organisation
NUTS Nomenclature of Territorial Units for Statistics
SPA Special Protected Area
UNISDR United Nations Office for Disaster Risk Reduction
USD US dollar
USGS US Geological Survey

Exploring nature-based solutions6
Definition of terms
Green infrastructure (GI)
The 2013 European Commission Communication Green Infrastructure (GI) — Enhancing Europe's Natural Capital (EC, 2013a) defines GI as a 'strategically planned network of natural and semi-natural areas with other environmental features designed and managed to deliver a wide range of ecosystem services'. Emphasis is placed on the ecosystem services provided and on purposeful land designation and management, with the scope of delivering a range of environmental benefits, including maintaining and improving ecological functions. 'Smart' conservation addresses impacts of urban sprawl and fragmentation, builds connectivity in ecological networks and promotes green spaces in the urban environment (including through adaptation and retrofitting).
Mitigation and adaptation
The term 'mitigation' (of disaster risk and disasters) means 'lessening of the potential adverse impacts of physical hazards (including those that are human induced) through actions that reduce hazard, exposure, and vulnerability' (IPCC, 2012). Risk mitigation in this context equates to disaster risk reduction (DRR), and the terms are used interchangeably. In the climate change context, risk mitigation is one of the 'adaptation measures'.
Definition of terms
Hazard, vulnerability and risk
In this report, the terms vulnerability and risk are used in the same way as in the IPCC's Managing the Risks of Extreme Events and Disasters to Advance Climate Change Adaptation (IPCC, 2012) and the EEA's Climate change, impacts and vulnerability in Europe (EEA, 2012a).
The disaster risk community distinguishes between the following two factors that determine risk.
1. Hazard, meaning 'potential occurrence of a natural or human-induced physical event that may cause loss of life, injury or other health impacts, as well as damage and loss to property, infrastructure, livelihoods, service provision, and environmental resources' (IPCC, 2012). Hazard is characterised by location, intensity, frequency and probability.
2. Vulnerability refers to the 'characteristics and circumstances of a community, system or asset that make it susceptible to the damaging effects of a hazard' (UNISDR, 2009), or 'the propensity or predisposition to be adversely affected' (IPCC, 2012). In this report, vulnerability encompasses the capacity to anticipate, cope with, resist and recover from the adverse effects of physical events (see Figure 0.1).
In the current study, 'hazard' is estimated by the likelihood or propensity of occurrence of a natural
Figure 0.1 Concepts of hazard, ecosystem capacity and risk in developing a GI network
Hazard potential
Vulnerability
GI elements
Demand(exposed elements)
Risk
Susceptibility
Ecosystem(coping) capacity

Definition of terms
7Exploring nature-based solutions
hazard, while 'vulnerability' of a region is determined by the level of susceptibility (level of exposure to one or more stressors) and the capacity of the ecosystem to deliver services that can mitigate (cope with) the hazard. Potential GI elements are identified by the combination of an existing hazard in a given region and the presence of ecosystems supplying ecosystem services that mitigate the impact of the hazard. Risk is then defined as the presence of a specific natural hazard, exacerbated by the lack of ecosystem services to mitigate the hazard (these two aspects are combined
into 'GI elements'), and the demand for such a service caused by the presence of exposed elements (e.g. population and infrastructure). In other words, the same hazard and ecosystem service capacity will be judged differently, depending on whether they are located in a densely populated or a remote area. Risk is a dangerous phenomenon, substance, human activity or condition that may cause loss of life, injury or other health impacts, property damage, loss of livelihoods and services, social and economic disruption or environmental damage.

Exploring nature-based solutions8
Executive summary
Executive summary
Natural resource scarcity, climate change impacts, continued employment crises, public budget debts and economic recovery plans are some of the challenges that governments in Europe currently face. Moreover, Member States in the European Union (EU) need to continue building or rebuilding roads, sewage systems, levees, etc. (also known as grey infrastructure). Despite being essential for economic growth, these infrastructure investments are significant and put heavy burdens on governments. But as governments debate the future of economic growth and sustainable development, there is one infrastructure solution that can provide a good return on investment: nature.
In the past, governments and other investors automatically looked to expensive traditional grey infrastructure solutions in order to solve problems. Now, new and in many cases cheaper approaches are emerging that use natural processes or GI rather than concrete and steel. Forests, wetlands and other natural ecosystems are not commonly considered forms of infrastructure. But they are. Forests, for example, can prevent pollutants from entering streams that supply fresh water to cities and businesses downstream. Upstream landscape conservation and restoration
measures can act as natural water filtration plants, as an alternative to more conventional water treatment technologies. As such, they are a form of GI that can serve similar functions to grey infrastructure.
For example, pre-existing development of concrete pipes, sewers and particularly of paved surfaces in cities is making it difficult for storm water to be absorbed where it falls. It is becoming increasingly evident that our concrete systems are not always able to accommodate all the storm water that comes their way. This can result in flooding, with tremendous economic and social consequences. Recent work on GI has highlighted the important role ecosystems play in providing benefits to conventional infrastructure solutions. Green areas in cities, for instance, can function as storm-water retention areas and mitigate the load on conventional sewage systems (see Photo ES.1 and ES.2).
Research also shows that in many cases, GI solutions are less expensive than grey infrastructure, and provide a wide array of co-benefits for local economies, the social fabric and the broader environment. This should be of particular interest to decision-makers, as GI
Box ES.1 What is green infrastructure?
The 2013 European Commission Communication Green Infrastructure (EC, 2013a) defines GI as a strategically planned network of natural and semi-natural areas with other environmental features designed and managed so as to deliver a wide range of ecosystem services. It incorporates green spaces (or blue if aquatic ecosystems are involved) and other physical features in terrestrial (including coastal) and marine areas. On land, GI is present in rural and urban settings.
Photo ES.1 Water catchment
© Jenny Levine

Executive summary
9Exploring nature-based solutions
can achieve significant cost savings. If GI can provide comparable benefits to grey infrastructure at reduced costs in the long term, then it makes financial sense to invest in the conservation, sustainable management, and/or restoration of natural ecosystems in order to meet development goals.
However, making the financial case for GI is complicated: it can be difficult to make a valid comparison between GI and grey infrastructure with a focus on incurred expenses and benefits. We know that GI solutions often provide multiple benefits (noise reduction, increased carbon sequestration, recreation opportunities, clean water, etc.) that are often cheaper and more robust, not to mention more sustainable, both economically and socially (EEA, 2014). These multiple benefits should be captured in the equation as having positive spin-off effects, while grey infrastructure solutions typically only fulfil single functions such as drainage or transport.
For instance, instead of automatically defaulting to grey solutions like dikes and pipes for flooding, we first should look at restoring floodplains or wetlands. Rather than building sea walls, we need to think about conserving sand banks. And before building more water filtration systems, we might first consider rehabilitating upstream watersheds. Planners should compare green to grey and identify new opportunities for investing in nature, including a combination of green and grey approaches when nature-based solutions alone are insufficient. As planners explore how to accommodate infrastructure demands in the future, the lesson is clear: think about green before investing in grey.
Many countries in the EU have already taken this on board and have prepared national guidance
Photo ES.2 Example of urban green space functioning as water retention areas
© Elzélina Van Melle and EVM Landskab
documents and/or strategies to actively encourage investments in GI as an essential part of sustainable spatial planning. GI is increasingly considered a 'life support system' able to deliver multiple environmental functions, with a key role in adapting to and mitigating climate change.
The importance of GI is also recognised in the EU policy domain, as the examples below show.
• The Seventh Environment Action Programme (7EAP) (Decision No 1386/2013/EU) measures to enhance ecological and climate resilience, such as ecosystem restoration and GI, can have important socioeconomic benefits, including for public health.
• The EU Biodiversity Strategy (COM(2011) 244 final) calls for a restoration of at least 15% of degraded ecosystems in the EU and aims to expand the use of GI. In addition, the European Commission will continue mapping and assessment work of GI in the context of the Biodiversity Strategy.
• The 2013 European Commission Strategy on Green Infrastructure (COM/2013/0249 final) (EC, 2013a) underlines that GI can make a significant contribution to the effective implementation of all policies where some or all of the desired objectives can be achieved in whole or in part through nature-based solutions.
• The Regional Policy 2014–2020 continues to support nature and GI through financial instruments such as the European Regional Development Fund and the Cohesion Fund, which contribute to several policy objectives and deliver multiple benefits, in particular socio-economic development (IEEP and Milieu, 2013).
• The Water Framework Directive (2000/60/EC), Nitrates Directive (91/676/EEC) and the Floods Directive (COM(2006)15) offer GI-related opportunities (for instance, by supporting actions to put in place GI to improve soil retention, act as buffer strips between agricultural production and water sources, and provide water storage during flood events) (EEA, 2015).
• The EU Strategy on Adaptation to Climate Change (EC, 2013b) aims to make Europe more climate resilient by ensuring the full mobilisation of GI- or ecosystem-based approaches to adaptation.
GI solutions that boost disaster resilience are also an integral part of EU policy on disaster risk management. Climate change and infrastructure development make disaster-prone areas more vulnerable to extreme

Executive summary
10 Exploring nature-based solutions
weather events and natural disasters such as floods, landslides, avalanches, forest fires, storms and wave surges that cause loss of life and result in billions of euros of damage and insurance costs each year in the EU.
The impacts of such events on human society and the environment can often be reduced using GI solutions, as mentioned above. Functional flood plains, riparian woodland and protection forests in mountainous areas, barrier beaches and coastal wetlands can be set up in combination with disaster reduction infrastructure such as river protection works. Investment in ecosystem-based DRR and GI can thus provide many benefits for innovative risk management approaches, adapting to climate change-related risks, maintaining sustainable livelihoods and fostering green growth. Cities and local authorities are the first to deal with the immediate consequences of such disasters. They therefore play a critical role in implementing prevention measures like GI.
To address some of these challenges and information gaps, the current report tries to demonstrate the role of GI for mitigating vulnerability to weather and climate variability-related natural hazards at European level. It proposes a simple, practical methodology for screening (rather than assessing) ecosystem services in areas where GI may contribute to reducing current (or future) weather- and climate-related natural hazards. The report addresses landslides, avalanches, floods, soil erosion, storm surges and carbon stabilisation by ecosystems.
As mentioned in Box ES.1, GI is a strategically planned network of high-quality green spaces, which can be approached and defined from different perspectives. In this study, GI is defined by its capacity to provide a relevant number of ecosystem services. The maps presented in this study provide an overview of where specific weather- and climate-related natural hazards are likely to occur, where well-functioning ecosystem services exist which can support DRR and climate adaptation so as to lessen the impacts of natural hazards (e.g. floods and landslides), and where the provision of ecosystem services may be improved.
Regions with well-functioning ecosystem services (depicted in green in the maps) are considered to be part of a GI network that has the main role of mitigating the impacts of climate change natural hazards and/or supporting adaptation to climate change impacts. Those regions exhibiting a lack of mitigating ecosystem services should be considered priority areas for investment in or restoration of the required services, as there is a demand for them expressed by the presence of a natural hazard and assets at risk.
The study identifies two different levels of lack of GI:
• areas with no or a very low capacity of relevant ecosystem services for the mitigation of a given natural hazard (mapped in red);
• areas with existing ecosystem services that are not able to function at full capacity (mapped in orange).
For each of the natural hazards assessed in this study, an individual European-scale map of potential GI elements and restoration areas has been produced. For potential restoration areas, stakeholders are requested to take a decision on which areas are to take priority, i.e. whether to restore the partially functioning ones or the non-functioning ones. For example, restoring areas with no relevant ecosystem services for the mitigation of a given natural hazard (mapped in red) might reduce hazard considerably if they are located in an area where the hazard is present.
These decisions might be further supported by considering the demands of population and infrastructure for protection by GI, and an additional series of maps has been produced for that purpose at the Nomenclature of Territorial Units for Statistics (NUTS) 2 level. These maps define 'high-risk areas' at locations where high demand matches with low/medium-quality GI networks, and where medium demand matches with low-quality GI networks. Such areas are potential priority areas for GI restoration. The resulting 'medium risk area', however, might imply three possible situations: (i) high demand matching high-quality GI implies priority areas for conservation of ecosystems; (ii) medium demand matching medium-quality GI implies conserving existing GI and at the same time restoring missing GI, and (iii) low demand matching low-quality GI implies that in specific areas, hazard is relevant and GI protection is low, but the overall risk is only medium, due to the current comparably low level of demand.
If risk and demand are high, and ecosystem service capacity for risk mitigation is low, then ecosystem restoration clearly presents a significant and cost-efficient improvement for disaster risk mitigation. However, it should be noted that besides anthropogenic reasons, there are often also natural reasons explaining why a specific area cannot supply relevant ecosystem services.
The ecosystem services (according to the Common International Classification of Ecosystem Services, (CICES, 2015)) classification) were selected based on their potential ability to offer protection against extreme climate-related events:

Executive summary
11Exploring nature-based solutions
• mass stabilisation — landslides
• mass stabilisation — avalanches
• flood protection
• storm surge protection
• global climate regulation.
The results of the assessment show that it is possible:
• to use ecosystem services to assess GI;
• to identify potential areas for conservation and restoration;
• to identify GI elements as an output of the modelling.
As is to be expected, multifunctional forest ecosystems provide several services addressing the mitigation of most natural hazards. Restoration areas, on the other hand, are often more hazard specific. A central aspect of the study is the coupling of ecosystem services with their demand side in order to identify areas where these services are needed most.
The emerging pattern shows that high-risk areas for landslides mainly occur in hilly to mountainous areas of the Mediterranean and the British Islands. For avalanches, fine-scale high-risk areas could be defined for the Alpine region. Flood risk at NUTS 2 level was greatest in a central European region between western Germany and the Danube Delta, in eastern England, and in parts of central Spain, while storm surge risk was highest at the Northern Sea coasts. The potential GI network for contributions to global climate regulation is mainly defined by a belt of forest spanning northern Iberia to southern France, the southern Alps and parts of the forests on the Carpathians and the Rhodope Mountains.
For future research, it is proposed that the outlook of GI be expanded: from being based on ecosystem services alone, to include other topics such as protected lands, sensitive areas or natural assets as a cornerstone of GI networks to be developed. This obviously depends on the underlying data that have been used to define the GI network. While this study uses ecosystem services, others have used Natura 2000 areas and their connectivity, for instance. Moreover, the selection of ecosystem services influences the outcome of the GI network. Individual GI networks may be developed to support flood protection, water and air quality, biodiversity and migration of species, climate adaptation, etc. All of these GI networks could be 'calculated individually' with the best available
data. The results of the different networks (with different purposes) could be combined into a real multifunctional GI network, i.e. a combination of different GI networks can serve a variety of environmental functions.
There are both general and specific limitations inherent in the current work, as described below.
(1) General limitations
(a) The quality of the input data, although generally sufficient, might be regionally different for some of the presented assessments. This can cause biases in the pattern of the result maps.
(b) The selection of climate change-related impacts (natural hazards) that can be moderated by the presence of specific ecosystems and their services. The analysis worked with selected natural hazards which themselves can be moderated by ecosystem services, i.e. if there were no ecosystem services to moderate the hazard, then it was not selected (e.g. forest fire).
(c) The capacity of ecosystems to deliver (good-quality) services is estimated by the condition of the ecosystems.
(d) Some climate change-related impacts are local phenomena which are addressed at European/landscape scale.
(e) The coarse resolution of three categories for the levels of hazard, vulnerability, GI elements and demand might cause rather different areas to fall under the same category, while close to the categories threshold, small differences might cause a jump to the next category.
(f) Sometimes, the mitigating effect of ecosystem services might be a local phenomenon for which no data are available, e.g. the presence of hedges and tree rows in agricultural areas to combat (wind) erosion.
(2) Specific limitations
(a) Avalanches are particularly local phenomena, and are scarcely assessable at European scale (not in terms of their risk nor their impact). Due to the coarse resolution of the underlying digital terrain model, the threshold for avalanche-endangered slopes needed to be changed with respect to standard literature values (15° instead of 30°), in order to generate relevant risk zones (otherwise, only a few, scattered pixels are defined as endangered).
Exploring nature-based solutions12
Introduction and objectives
1 Introduction and objectives
As a follow-up to earlier European Environment Agency (EEA) research into the role of GI networks and the multiple ecosystem services provided (EEA, 2011a and 2014), the objective of this study is to explore and demonstrate how GI contributes to mitigating adverse effects of extreme weather- and climate-related events. Weather- and climate-related hazards including extreme precipitation, floods, wet mass movement and storm surges are among the costliest and deadliest natural hazards in Europe and globally (EEA, 2011b; UNISDR, 2015). Human-induced climate change, in combination with other anthropogenic pressures such as land use conversion, has altered the functions of ecological systems, and has consequently modified the flow of ecosystem services in terms of their scale, timing and location (Nelson et al., 2013). Future climate change will very likely further exacerbate these effects (IPCC, 2014).
This report focuses on certain types of extreme events and natural hazards at European scale that will be very likely amplified by ongoing climate change, i.e. landslides, avalanches, floods and storm surges. In addition, the report also touches upon the GI and ecosystem services contributing to global climate regulation. The analysis is carried out using spatially
explicit data centred on the physical capacity of ecosystems to deliver services that can mitigate natural hazard risks. Places prone to selected natural hazards have been identified and prioritised according to the 'demand' for risk mitigation services.
The report only considers aspects of GI relevant for protection against extreme climate- and weather-related events; individual GI elements provide other services to society (recreation, timber production or filtration of pollutants, etc.), which are not considered in this study.
The report concentrates on present-day exposure to natural hazards, and does not assess impacts of future climate change on the frequency and intensity of such hazards. The role of GI in mitigating climate change impacts is further illustrated by literature reviews of local case studies which describe examples of using GI to mitigate climate change-related natural hazards. The ecosystem services reviewed in the study are those that reduce the impact of climate variability (now and in future). As a result of climate change, the variability may become more pronounced and the likelihood of extremes may increase. This can be partially offset by ecosystem services.
Box 1.1 The multifunctionality of GI
One of the key attractions of GI is its multifunctionality, i.e. the fact it can perform a number of functions and provide several benefits for the same spatial area. These functions could be environmental (such as conserving biodiversity or adapting to climate change), social (e.g. providing water drainage or green space) or economic (supplying jobs and raising property prices, for instance). A good example of this multifunctionality is provided by the urban GI of a green roof, which reduces storm water run-off and the pollutant load of the water, while also decreasing the urban heat effect, improving the insulation of the building and providing a habitat for a variety of species.
It is the multifunctionality of GI that sets it apart from the majority of its grey counterparts, which tend to be designed to perform one function alone (such as transport or drainage) without contributing to the broader environmental, social and economic context (Naumann et al., 2010). As such, GI has the potential to offer win-win, or 'no regrets' solutions by tackling several problems and unlocking the greatest number of benefits, within a financially viable framework. GI can therefore serve as a highly valuable policy tool for promoting sustainable development and smart growth, by meeting multiple objectives and addressing various demands and pressures (EEA, 2011a).
Source: EC, 2012, 'The Multifunctionality of Green Infrastructure', Science for Environment Policy, Indepth Reports, March 2012, DG Environment (http://ec.europa.eu/environment/nature/ecosystems/docs/Green_Infrastructure.pdf) accessed 13 July 2015.

Introduction and objectives
13Exploring nature-based solutions
The present report forms part of the efforts exploring how to develop a GI network at European level, using existing European-level data. Most of the input data for the Geographic Information System (GIS) processing
have been taken from published sources and reclassified for the purpose of the analysis. The choices made throughout the data processing and analysis are based on expert opinions and are open to public scrutiny.

Exploring nature-based solutions14
How to read this report
A methodological section describes the specific structure of the study and provides a descriptive summary of the procedures used. It is broken down into three subsections: one explaining the underlying logic of the analysis, including the background assumptions; a second part focusing on the selection of ecosystem services and the related data sets; and a final subsection discussing the methodological approach used for this study (based on a previous assessment carried out by the EEA (EEA, 2014)).
The core part of the report (Chapter 3) has been organised so as to allow miscellaneous readers to pick and choose their reading material. A guiding principle in arranging the material has been to focus on the need of the main target audience, i.e. policymakers, non-governmental organisations (NGOs) and the research community. It covers five similarly structured topic sections designed to communicate the findings uniformly. This format allows the report to be read at different levels; each section may also be read independently of the other topic sections.
2 How to read this report
Each topic section is divided into three subsections, as follows.
• Background — literature review. This subsection presents a brief yet informative state-of-the-art literature review. It highlights past studies related to the issue and provides additional information on the topic.
• Assessment and results. This subsection presents the assessment of the topic and the results; much of the information is in the form of maps for each topic or ecosystem service. The points illustrated throughout the sections are based on the processing of different input data sets, to allow readers to obtain information on the topic in a spatially explicit manner.
• Input data sets. This subsection outlines and describes the data sets used, including their specifications. As mentioned in the Executive summary, the quality of the input data is adequate overall but might differ across Member States for some of the presented assessments. This can cause biases in the pattern of the result maps.

15
Methodology
Exploring nature-based solutions
3.1 The underlying logic
The 2014 EEA Technical Report Spatial analysis of green infrastructure in Europe (EEA, 2014) proposed a simple, replicable methodology for GI elements at pan-European level. It illustrated a spatially explicit methodology for defining priority GI areas and for distinguishing potential conservation and restoration areas. GI is evaluated as an ecological and spatial concept that aims to promote ecosystem health and resilience, contribute to biodiversity conservation, and at the same time, provide benefits to humans, promoting the multiple delivery of ecosystem services (EC, 2013a). The multifunctionality of GI is addressed by considering multiple ecosystem services.
The underlying logic of the present study is based on several assumptions and findings from the above-mentioned report, as follows:
• the analysis of GI promotes integrated spatial planning by identifying multifunctional zones;
• GI analyses are closely related to the implementation of the European Biodiversity Strategy 2020 (and its Target 2) and the EAP;
• the identification of GI elements is pursued at landscape scale with a focus on rural environments;
• the assessment considers ecosystem services (in particular regulation and maintenance services (1)) as starting points for GI mapping —the condition of the ecosystems is usually used as a surrogate for their capacity to deliver ecosystem services;
• the ecosystem services have been selected from the CICES classification for their relationship with climate and climate change impacts, and their potential mitigation;
• the resulting GI network is based on the best available information at European scale at the
3 Methodology
(1) Provisioning or cultural services have minimal or no link to mitigation of the impact of natural hazards.
time; any improvements on the input data side will doubtless contribute to a refinement of the resulting network of GI elements;
• topics such as sustainable flow of ecosystem services (e.g. the maximum level of delivery at which ecosystems are not degraded), trends or future scenarios, and human-made structures (protection works) are not taken into account in this study.
3.2 Selection of ecosystem services
The identification and mapping of relevant GI elements is based on an integrated analysis of multiple ecosystem services. From this perspective, and following the conceptual framework of the MAES (EC, 2014) Working Group, three aspects were considered: the natural capacity to deliver services, the flow of services and the demand for these services.
The adaptation of this scheme for the task implies the following.
(1) Capacity: mapping ecosystem potential to provide services that protect against climate change impacts. The most protective habitats in most cases are those:
(a) containing fixed biotic structures that interfere in the mass/liquid/air flow (usually dense and tall vegetation cover);
(b) functioning as retention areas by providing space for the natural processes of the hydrological cycle;
(c) containing zones with large or growing biomass acting as important carbon pools or carbon sinks.
(2) Ecosystem services flow: mapping the physical exposure to extreme events, by assessing the probability or frequency of such events (that subsequently are mitigated by the relevant ecosystem services), based on the results of the

Methodology
16 Exploring nature-based solutions
European Spatial Planning Observation Network (ESPON, 2012) or similar projects on natural hazards.
(3) Demand: mapping the potential beneficiaries of the selected ecosystem services, for example, integrating:
(a) population
(b) infrastructures (e.g. roads, power plants and railways)
(c) visitors/tourists
(d) points of special sociocultural interest
(e) vulnerable economic sectors/areas (e.g. agriculture).
(4) Risk: mapping the areas at risk of a specific natural hazard, given the presence of assets (i.e. demand) and lack of mitigating ecosystem services (i.e. protective GI).
Table 3.1 matches each ecosystem service (selected from the CICES classification for their relationship with climate and climate change impacts and their potential mitigation) with potential data sets which describe:
(a) which ecosystem provides the service and its capacity/condition;
(b) where the service is needed (which areas are vulnerable due to being exposed to the natural hazard);
(c) who or what would benefit from the presence of a functional ecosystem service.
Table 3.1 List of selected ecosystem services and related data sets
In order to use existing information as far as possible, the data sets for estimation of the ecosystem capacity were taken from existing sources where possible (e.g. Joint Research Centre (JRC) Forest website) or literature, e.g. Maes et al., 2011.
3.3 Methodological approach
The general approach for assessing the capacity of GI to mitigate the impact of climate change-related natural hazards follows the assessment described in Chapter 2 of the 2014 EEA Technical report Spatial analysis of green infrastructure in Europe (EEA, 2014).
• The assessment takes ecosystem services as starting point for identifying potential GI elements, i.e. GI is a result of the analysis.
• The condition of the ecosystems is used as a surrogate for their capacity to deliver ecosystem services.
• For analysis and interpretation of the capacity of the ecosystem services, the original (often) continuous value data were classified. Three classes (high, medium and low) are used for better visual differentiation of the results.
• The hazard potential is also classified in three classes (high, medium and low).
• Combining the three classes of the ecosystem capacity map and the hazard potential maps results in a 3 × 3 matrix.
• The matrix can be used to identify areas with any combination of high/medium/low ecosystem capacity with high/medium/low hazard potential,
ES service class Ecosystem capacity Areas exposed to potential hazard
Demand
Mass stabilisation JRC forest cover map (JRC, 2015)
JRC landslide susceptibility map (ELSUS1000 v1)
Settlements and transport infrastructure
JRC forest cover map ESPON avalanche Settlements and transport infrastructure
Flood protection MAES — annually summed soil infiltration
JRC Flood return rate projections: 2-year/100-year return rates for 2000/2025/2035/2085 (EDENext, 2015b)
Population
Storm surge protection Coastal protection (Liquete et al., 2013a)
ESPON storm surge Population
Global climate regulation MAES Storage and sequestration of CO2
Biomass changes in forests (harvest vs growth)
Methodology
17Exploring nature-based solutions
i.e. the elements of the GI network. The advantage of the 3 x 3 matrix is the rationed amount of possible combinations which is still quite straightforward to interpret.
• The GI network is proposed as the intersection of high and medium capacity with high and medium hazard potential (i.e. areas with protective ecosystems that play the role of protection against climate effects).
The initial classification of hazard potential and ecosystem capacity includes three categories, and hazard maps are presented with these three categories. For the further analysis, only two categories were used: 'medium-high', i.e. appropriate for further analyses and consideration due to relevant hazard, and 'low' for areas not relevant for further analyses and consideration because of a too low or non-existent hazard.
Map 3.1 illustrates the general concept of the approach used in the current study.
The environmental risk is finally determined by combining the demand (based on the exposed elements) for a service, with the presence/lack and quality of the GI network, i.e. the level of the hazard potential AND the ecosystem services capacity to moderate it. To address the level of risk, the GI network above (i.e. capacity AND hazard potential) has been crossed with a demand/beneficiaries layer.
The following chapters of the report summarise the results of:
(1) the literature review and background for each topic;
(2) the assessment of each topic:
(a) processing the different input data sets to obtain information on ecosystem capacity and the potential of different climate change-related hazards in a spatially explicit manner;
(b) identification of potential GI elements (based on the combination of capacity AND hazard potential maps) for mitigating the impact of climate change-related natural hazards;
(c) comparing the GI network with the actual demand for ecosystem services to identify the associated level of risk;
(3) the input data used for each assessment;
(4) the related references.
These results are presented in the form of maps for each ecosystem service (and related natural hazard). The first set of maps shows the reclassified base data, i.e. the ecosystem capacity map and the natural hazard potential map. The second map identifies the network of potential GI elements based on the areas affected by a climate change-related natural hazard, and the capacity of an ecosystem service to mitigate this hazard/exposure. Here, the areas in green show well-functioning ecosystem services with a high adaptive capacity to relevant levels of natural hazards. Areas in orange indicate regions with a medium capacity to cope with the natural hazard, i.e. areas where the relevant level of the hazard is present, but the ecosystem does not deliver optimum services. Finally, the red areas are those where a natural hazard is present, but where no mitigating ecosystem services are provided.
The third map describes the risk level of the respective natural hazard and the related ecosystem services. This is approximated by comparing the quality of the potential GI network (based on hazard potential and capacity) to a demand for such a service. The demand is defined in the context of the hazard, i.e. presence of technical assets or population at risk.
The 'risk' maps follow the same logic as described above.
• Class 1 (green): at low risk to the natural hazard under review. Natural hazard is present (at medium or high level) and there is well-functioning GI for mitigating the risk.
• Class 2 (orange): low, medium and high levels of GI quality match the low-medium and high levels of demand.
• Class 3 (red): at high risk to the natural hazard under review. Presence of relevant hazard levels (high or medium) and low mitigation function of GI, combined with high or medium demand.
• Class 4 (grey): no risk, because no hazard is present, regardless of the level of demand. No need for ecosystem services addressing weather and climate-related hazards.
Despite the classification into only three risk levels, each of the combinations of the matrix entries has a specific background and calls for specific interpretation.

Methodology
18 Exploring nature-based solutions
Map 3.1 Approach for deriving a potential GI network
70°60°50°
40°
40°
30°
30°
20°
20°
10°
10°
0°
0°-10°-20°-30°
60°
50°
50°
40°
40°
0 500 1000 1500 km
GI and demand=risk70°60°50°
40°
40°
30°
30°
20°
20°
10°
10°
0°
0°-10°-20°-30°
60°
50°
50°
40°
40°
0 500 1000 1500 km
Capacity and hazardpotential=GI
70°60°50°
40°
40°
30°
30°
20°
20°
10°
10°
0°
0°-10°-20°-30°
60°
50°
50°
40°
40°
0 500 1000 1500 km
Hazard potential70°60°50°
40°
40°
30°
30°
20°
20°
10°
10°
0°
0°-10°-20°-30°
60°
50°
50°
40°
40°
0 500 1000 1500 km
Ecosystem capacity
1–High capacity Outside coverage
No data2–Medium capacity
3–Low capacity
1–High hazard potential
2–Medium hazard potential
3–Low hazard potential
No data
Outside coverage
1–Best acting GI network
2–Restorable GI network
3–Inexistent but need natural3–protections
4–No risk zone under normal3–conditions
No data
Outside coverage 1–Low risk
2–Medium risk
3–High risk
4–No risk
No data
Outside coverage

Methodology
19Exploring nature-based solutions
Table 3.2 Matrix for identifying elements of the GI network
Notes: 1 = best acting GI network for risk mitigation.
2 = restorable GI network for risk mitigation.
3 = no or very low natural protection despite relevant hazard.
4 = no hazard zone under normal conditions (despite increasing extreme events under climate change).
Capacity
Hazard potentialHigh Medium Low
High 1 2 3
Medium 1 2 3
Low 4 4 4
Table 3.3 Matrix for identifying risk level
Demand
GI network(quality of GI services)
High Medium Low
High Medium Low Low
Medium High Medium Low
Low High High Medium
No hazard zone No risk No risk No risk
For the example of the three 'medium' categories of the risk level table (Table 3.3), the following combinations exist:
• High/high: high priority for conservation of ecosystems, to avoid reduction of quality of GI networks and increase of risk;
• Medium/medium: it is strongly recommended to conserve existing GI and to restore missing GI — these are priority areas for conservation AND restoration;
• Low/low: specific areas where hazard is relevant and GI protection is low, but due to the comparably low level of demand, the overall risk is medium rather than high.

Exploring nature-based solutions20
Results
4.1 Mass stabilisation — landslides
4.1.1 Background — literature review
There is a strong evidence basis for increased landslide activity as a result of expected climate change, despite high levels of uncertainty resulting from the margins of error inherent in global climate predictions and the lack of sufficient spatial resolution of downscaled projections (Crozier, 2010; Huggel et al., 2011). GI, particularly forests but also other vegetation, can sizeably reduce occurrence of shallow landslides (Stolton et al., 2008; Crozier, 2010; Stokes et al., 2014). Their global increase is caused mainly by overexploitation of natural resources and deforestation, as well as by growing urbanisation and uncontrolled land use (Stolton et al., 2008; Stokes et al., 2014).
4 Results
(2) It should be noted that EM-DAT does not capture all hazards, and that the data have proved to be flawed in some cases. The low coverage of landslides may be partly explained by the application of thresholds for events to be included. However, EM-DAT is one of the most frequently used sources for disasters, as at least it provides some spatial context.
More specifically, destruction of forest cover for clear-cut areas and logging roads are seen as particularly important driving factors (Abramowitz, 2001). Global landslide hotspots are located in tropical mountainous regions with high precipitation and frequent earthquakes; in mainland Europe, only Italy was recognised as landslide hotspot (EC, 2006; Stolton et al., 2008; Smith, 2013). For the 12 EU-25 cases of major landslides in the International Disaster Database (EM-DAT) (2) of the Université Catholique de Louvain alone, the toll was 1 387 casualties in Italy (plus 196 in the Austria, Sweden and United Kingdom together) and the cost was EUR 1.2 billion (EC, 2006).
In a recent review, Stokes et al. (2014) acknowledge the importance of vegetation for mitigating landslides; they
Photo 4.1 Landslide
© https://www.flickr.com/photos/jessicadally

Results
21Exploring nature-based solutions
provide examples of different tree species and stand ages. They also compare inert engineering structures (i.e. grey infrastructure) and live plant material (i.e. GI) in terms of efficacy and longevity. Unfortunately, this comparison does not consider existing vegetation cover, but is limited to new constructions such as brush layers or fascines with wood or live plant cuttings. These soft structures have the disadvantage of taking longer to fully stabilise soils, and hence are only suitable where slope instability is anticipated. Their longevity varies greatly, depending on species used and local conditions; less than 10% decay over 10 years was reported for external structural elements in crib-walls in Tuscany, Italy (Stokes et al., 2014).
Although a great deal of European literature covers the relation between vegetation cover and slope stability (Stokes et al., 2013), the capacity of GI for landslide mitigation is scarcely assessed at local scale. Potential methods to be applied include assessments of replacement costs or avoided costs (Gómez-Baggethun and Barton, 2013). The latter were used in one local example from the Special Protected Area (SPA) Pico da Vara/Ribeira do Guilherme (Azores Islands, Portugal) (de la Cruz, A. and Benedicto, J., 2009), where the benefits of preserving the SPA's ecosystems (i.e. GI) include prevention of disasters like the one in a neighbouring location in 1997, which resulted in 29 deaths and EUR 20 million in damages
(Cruz et al., 2011). This example is also the only one reported by Gantioler et al. (2010) in their assessment of the socio-economic benefits of investment in the Natura 2000 network.
4.1.2 Assessment
Landslides represent a major threat to human life, property, buildings, infrastructure and natural environments in most mountainous and hilly regions of the world (ESPON, 2012). The distribution of landslide hazards over Europe is strongly linked to the geological and relief conditions of the continent. Therefore, mountainous areas such as the Scandinavian Peninsula, the Alps and also the southern part of Europe are most prone to landslides.
Human-induced climate change is expected to increase the mean temperature and to alter precipitation patterns in Europe in future (EEA, 2010a), leading to an increase of landslides, i.e. debris flows triggered by heavy rainfalls or rockfalls due to the retreat of permafrost areas. Still, it is difficult to make a clear long-term forecast of the development of landslide hazards under a changing climate (EEA, 2010).
Map 4.1 and Map 4.2 show the classified base data for ecosystem capacity to mitigate landslide risk based
Map 4.1 Capacity to mitigate landslide risk — forest density
Map 4.2 Hazard potential for landslides
1–High capacity
2–Medium capacity
3–Low capacity
No data
Areas above treeline
Capacity to mitigate landslide risk Forest density - Hazard potential for landslides
Outside coverage
1–High hazard potential
2–Medium hazard potential
3–Low hazard potential
No data
Areas above treeline
Outside coverage
70°60°50°
40°
40°
30°
30°
20°
20°
10°
10°
0°
0°-10°-20°-30°
60°
50°
50°
40°
40°
70°60°50°
40°
40°
30°
30°
20°
20°
10°
10°
0°
0°-10°-20°-30°
60°
50°
50°
40°
40°
0 500 1000 1500 km0 500 1000 1500 km

Results
22 Exploring nature-based solutions
on the presence of protective forest and the hazard potential for landslides. The integration of both data sets (in Map 4.3) results in the delineation of a potential GI network for mitigating landslide vulnerability. As is to be expected, the hazard potential for landslides is higher in mountainous regions. On the other hand, existing forests are able to provide a protection function (green areas in Map 4.3). Class 3 identifies areas where landslide vulnerability is moderate to high, but where little or no protection forest (with a minimum density of 20%) is present, providing few or no mitigating ecosystem services. These areas are found mainly on the Apennine peninsula, the Central Alps, Scotland, Sicily, Wales and further mountainous areas in southern Europe. The western areas of the United Kingdom are particularly prominent: they are high-risk areas and lack any functional GI. This is due to a moderate-to-high landslide hazard potential in combination with an absence of dense forest cover to mitigate the hazard.
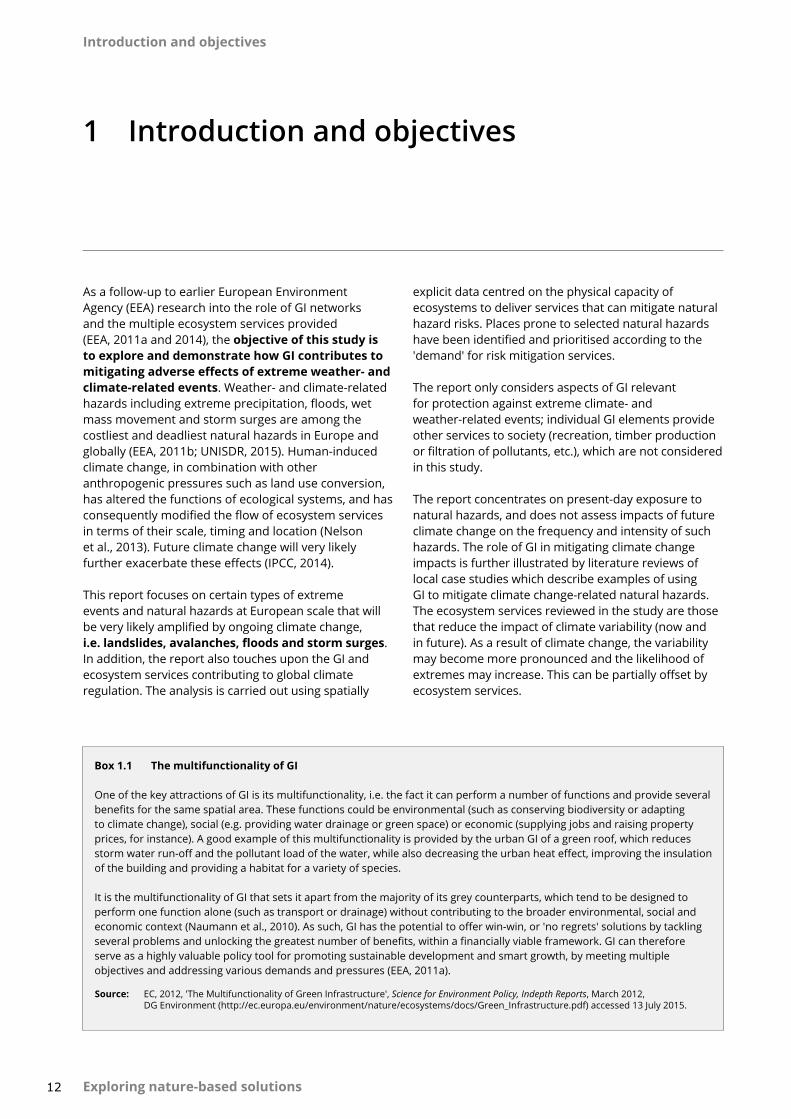
Aggregating (3) Map 4.3 to NUTS level 2 administrative regions (Map 4.4) highlights the regions most vulnerable to landslides in large parts of Italy and the British Isles. The aggregation is based on the sum of pixels in the different classes of GI elements (1: best acting; 2:
(3) The use of three categories and the aggregation to NUTS level 2 regions presents a rather broad spectrum of specific local characteristics; the category name might not always fully reflect these local characteristics.
Map 4.3 Potential GI network based on ecosystem capacity to mitigate exposure to landslides
Ecosystem service flow —Landslide vs. forestcapacity
1–Best acting GI1–network
2–Restorable GI2–network
3–Inexistent but needed3–natural protection
4–No risk zone under4–normal conditions
Outside coverage
No data
70°60°
40°
40°
30°20°
20°10°
0°
0°-20°-30°
60°
50°
50°
40°
10°0 500 1000 1500 km
30° 50°
40°
-10°
restorable; 3: inexistent, but needed), their weighted average score and standard deviation. Regions around the European average (average score +/− 1 standard deviations) are classified in orange (2: restorable), while regions beyond this class are classified either as red (3: inexistent, but needed) or green (1: best acting). Regions with a very good coverage of potential GI elements are shown in green (i.e. dense forest areas). Due to the aggregation from 1 km grid cells to NUTS level 2 regions, the fine-grained detail of Map 4.3 is lost.
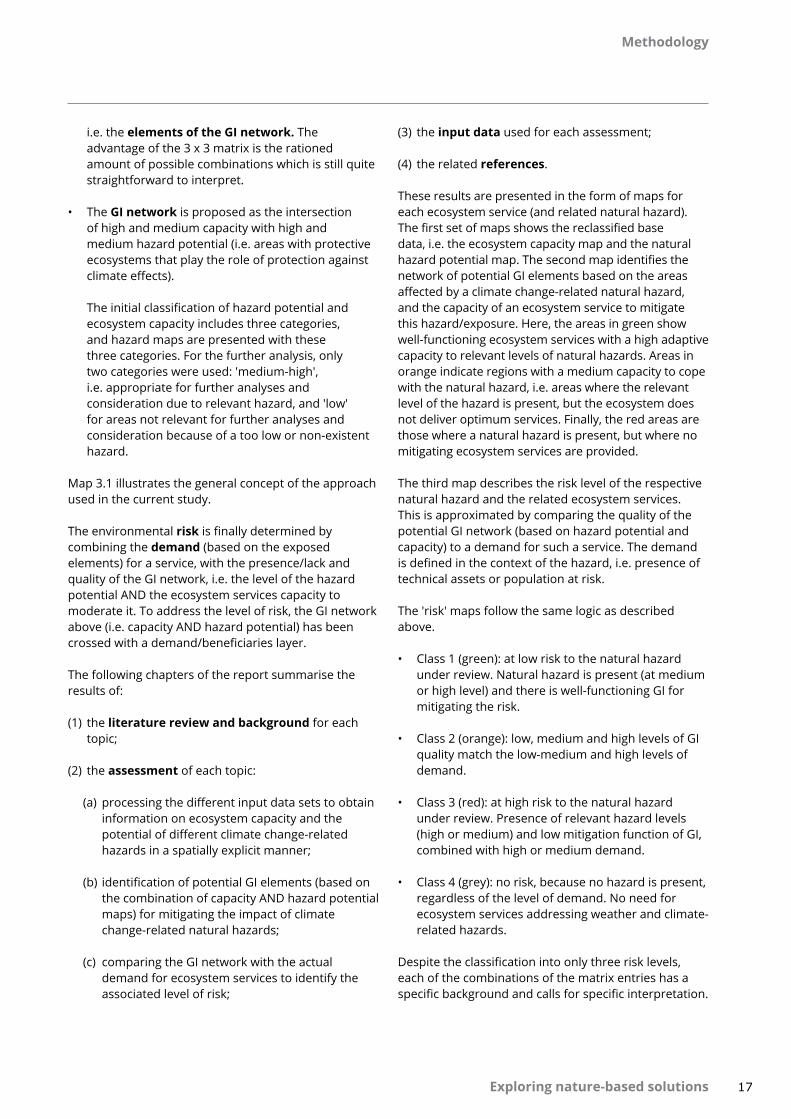
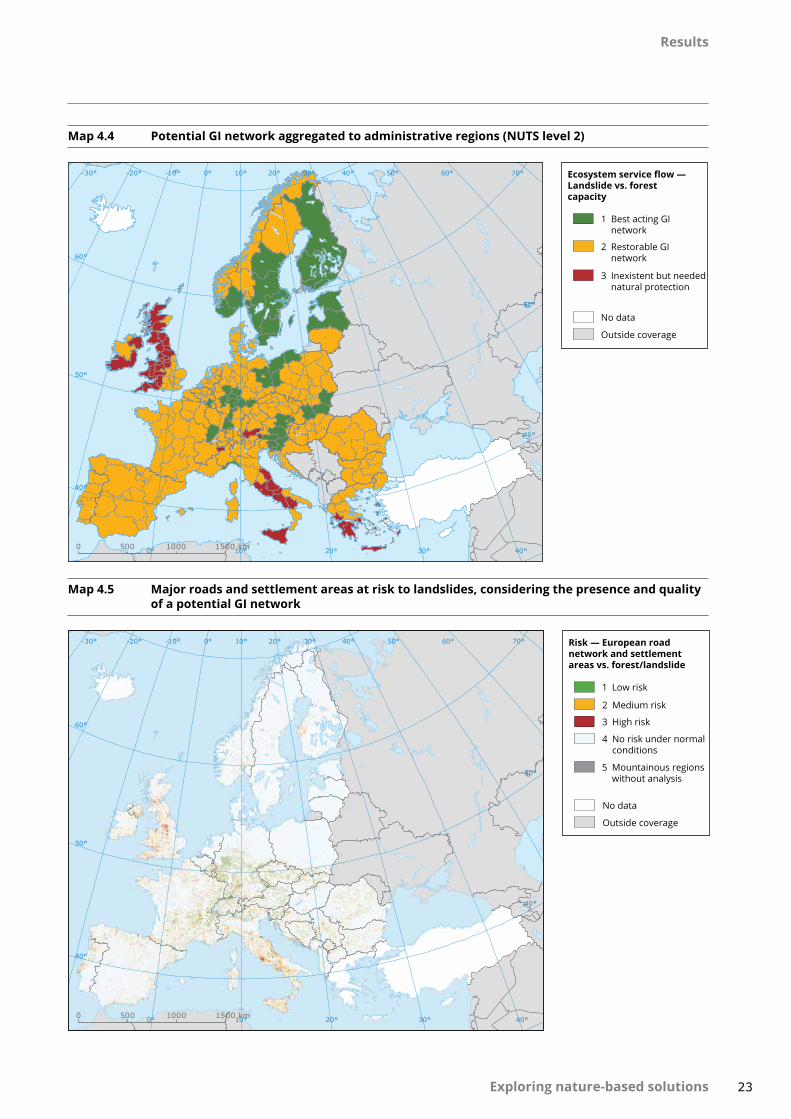
By overlaying the GI network of Map 4.3 with settlements and road infrastructure, one can recognise the demand for the protective function of GI. The result (Map 4.5) shows that most high mountain settlements and roads have effective protection from landslides, while the risk increases in moderately hilly areas having a significantly lower percentage of protective forests.
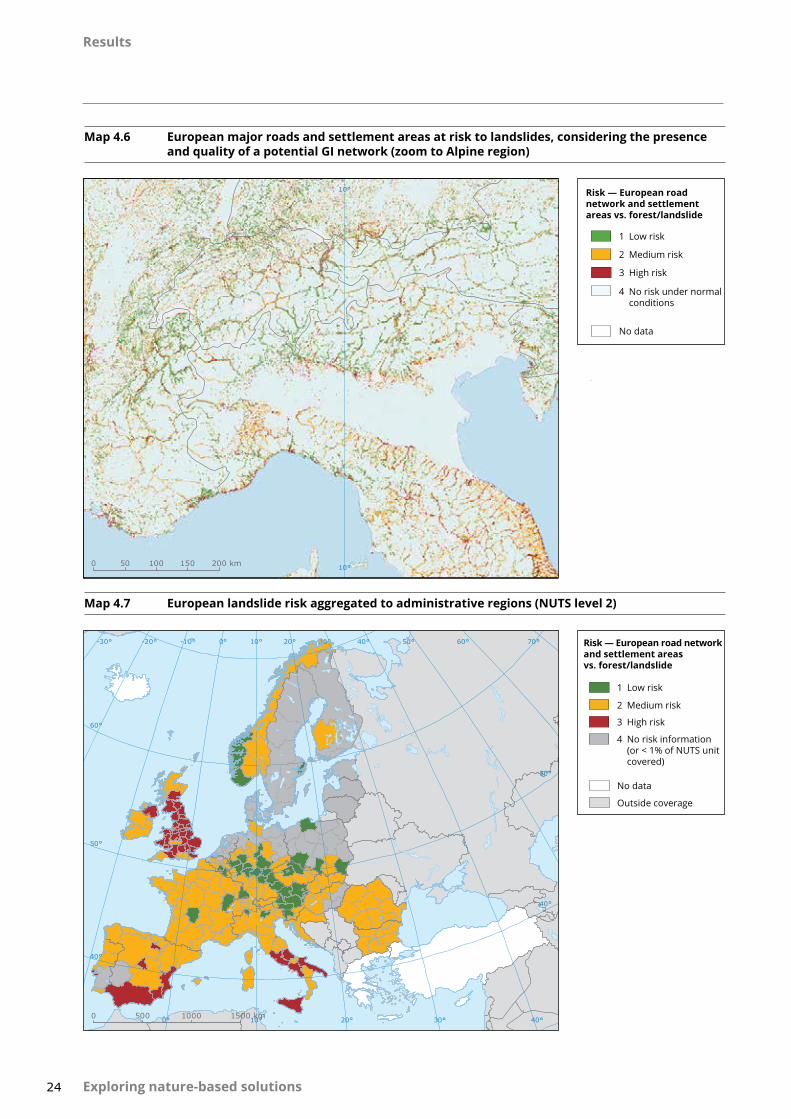
An aggregation of the European risk map to administrative regions (Map 4.7) highlights regions with a higher risk due to a high demand (also seen in regions with a moderate GI network), and conversely, regions with a well-functioning GI network, identified by regions changing from red to orange or from orange to green.
Results
23Exploring nature-based solutions
Map 4.4 Potential GI network aggregated to administrative regions (NUTS level 2)
70°60°
40°
40°
30°20°
20°10°0°-20°-30°
60°
50°
50°
40°
Ecosystem service flow — Landslide vs. forestcapacity
1–Best acting GI1–network
2–Restorable GI1–network
3–Inexistent but needed1–natural protection
Outside coverage
No data
10°0 500 1000 1500 km0°
50°30°-10°
40°
Map 4.5 Major roads and settlement areas at risk to landslides, considering the presence and quality of a potential GI network
70°60°
40°
40°
30°20°
20°10°
0°
0°-20°-30°
60°
50°
50°
40°
40°
Risk — European roadnetwork and settlementareas vs. forest/landslide
1–Low risk
2–Medium risk
3–High risk
4–No risk under normal4–conditions
5–Mountainous regions5–without analysis
Outside coverage
No data
10°0 500 1000 1500 km
50°-10° 30°
Results
24 Exploring nature-based solutions
Map 4.6 European major roads and settlement areas at risk to landslides, considering the presence and quality of a potential GI network (zoom to Alpine region)
Map 4.7 European landslide risk aggregated to administrative regions (NUTS level 2)
70°60°50°
40°
40°
30°
30°
20°
20°10°0°-10°-20°-30°
60°
50°
50°
40°
Risk — European road networkand settlement areas vs. forest/landslide
1–Low risk
2–Medium risk
3–High risk
4–No risk information4–(or < 1% of NUTS unit4–covered)
Outside coverage
No data
10°0 500 1000 1500 km
40°
0°
10°
10°
0 50 100 150 200 km
Risk — European roadnetwork and settlement areas vs. forest/landslide
1–Low risk
No data
2–Medium risk
3–High risk
4–No risk under normal4–conditions

Results
25Exploring nature-based solutions
4.1.3 Input data and analysis
Ecosystem capacity 'Forest'Forests were selected in order to assess the mitigation capacity for the potential occurrence of landslides. Due to possible increase in precipitation and other factors which could trigger landslides, the effect of forests to reduce the vulnerability for mass movements was assumed to be significant.
To evaluate the forest capacity, the JRC forest cover map was aggregated to a 1 km resolution representing the percentage of forest area in the particular raster cell. The mosaic generated from the single forest map tiles was aggregated based on the 25 m raster data set, and scaled to describe the forest cover percentage.
After correction of non-forest values (sea area is masked), the forest density was classified into three classes (Map 4.1), as shown in Table 4.2.
Additionally, mountainous areas above the treeline (e.g. the alpine region) have been masked. As forest cannot survive above the tree line, pixels representing those areas have been excluded from both the capacity analysis and the ecosystem services flow assessment subsequently carried out. To identify such areas, a mask has been applied based on the Corine Land Cover (CLC) 2006 data set including glaciers, bare rock and sparsely vegetated areas.
Table 4.1 Input data
Name Specification
JRC landslide susceptibility map (ELSUS1000 v1) Landslide risk map — raster at 1 km resolution
JRC Forest Cover Map, 2006 Forest cover mosaic raster data set — 25 m resolution
GISCO Transport v2 (2008) Road links at 1:1.000.000 Vector road network data set
GIO HRL Degree of imperviousness (2009) Raster data with 100 × 100 m (1 ha) resolution
Degrees of imperviousness from 0% to 100%
Table 4.2 Ecosystem capacity 'Forest cover'
Class Forest density
High (1) 50–100%
Medium (2) 20–50%
Low (3) < 20%
Hazard potential 'Landslides'The landslide hazard potential is based on the European landslide susceptibility map (ELSUS1000) from the JRC soil portal (EC, 2015). The map was produced (Günther et al., 2014) jointly by the Federal Institute for Geosciences and Natural Resources (BGR) (Hannover, Germany), the JRC (Ispra, Italy), the Institute of Physics of the Globe (CNRS-EOST, Strasbourg, France), and the Research Institute for Hydrogeological Protection (CNR-IRPI, Perugia, Italy), as part of the work of the European Landslide Expert Group, and includes contributions from other members of the group.
ELSUS1000 version 1 shows levels of spatial probability of generic landslide occurrence at continental scale. It covers most of the EU, and several neighbouring countries. Basically, the map has been produced by regionalising the study area based on elevation and climatic conditions, followed by spatial multicriteria evaluation modelling using pan-European slope gradient, soil parent material and land cover spatial data sets as the main landslide conditioning factors. In addition, the location of more than 100 000 landslides across Europe, provided by various national organisations or collected by the authors, has been used for model calibration and validation.
Table 4.3 Hazard potential 'Landslides'
Class Hazard potential
Low (3) Very low
Low
Medium (2) Moderate
High (1) High
Very high

Results
26 Exploring nature-based solutions
To adapt the initial five classes to the designated three classes in this work, the classes are reclassified as shown in Table 4.3.
Table 4.4 GI elements
Value New value
Definition
11 1 High capacity + high hazard exposure
12 1 High capacity + medium hazard exposure
13 4 High capacity + low hazard exposure
21 2 Medium capacity + high hazard exposure
22 2 Medium capacity + medium hazard exposure
23 4 Medium capacity + low hazard exposure
31 3 Low capacity + high hazard exposure
32 3 Low capacity + medium hazard exposure
33 4 Low capacity + low hazard exposure
Ecosystem service flowUnique new values were allocated to the four GI classes, in line with the ecosystem service flow matrix.
Beneficiaries 'Settlements and transport infrastructure'The demand for protection from landslides arises mainly from settlements and transport infrastructure in the affected regions (i.e. protection of infrastructure and people). The original Geographical Information System at the Commission (GISCO) road data set, containing all medium-sized and major European roads, was processed to hold all the major roads like highways and important national roads. Settlements were identified using the GIO High Resolution Layer on Imperviousness. Due to its resolution of 1 ha, it captures more (small) settlements, especially in mountainous areas, than CLC (25 ha minimum mapping unit). 1 ha grid cells of more than 30% imperviousness were used to create a 'built-up' layer. This built-up layer was subsequently aggregated to 1 km resolution. Finally, the road network and the settlements (both at 1 km resolution) were combined in a single layer, identifying areas requiring protection from landslides.
By overlaying the potential GI network (hazard potential × capacity) with the road and settlement layer, it is possible to obtain information on the demand side for GI, i.e. areas where assets (in this case, buildings, people and transport infrastructure) are susceptible to a natural hazard.

Results
27Exploring nature-based solutions
4.2 Mass stabilisation — avalanches
4.2.1 Background — literature review
Mountain regions are particularly vulnerable (McCain and Colwell, 2011) and heterogeneous (e.g. Gottfried et al., 2012) in their response to climate change. The impact of climate change on snowfall distribution is still under discussion (O'Gorman, 2014). For the Alps, however, it is generally expected that the protection forests provide against snow avalanches will decrease under climate change at intermediate elevations, and increase only at high elevations where forest biomass and number of stems are expected to rise (Elkin et al., 2013). Of course, forests in different places respond differently to the expected climate change, also depending on the magnitude of these changes (expected to be higher in higher altitudes).
The scientific literature on GI in terms of avalanche protection forests and their potential to mitigate the negative effects of climate change is dominated by a recent investigation at local scale in the Swiss Alps (Grêt-Regamey et al., 2008a and 2008b, 2013; Olschewski et al., 2012 ), particularly in the touristic region of Davos. In a first approach in a study area of 100 km², Grêt-Regamey et al. (2008a) compared the actual situation with a forest expansion scenario for 2050 where denser forest will be allowed to grow and the tree line will rise. The ecosystem service of avalanche protection was estimated to increase
considerably under forest expansion, because denser and larger forests (i.e. enhanced GI) result in fewer avalanche release and run-out areas. The prevented costs of fatalities due to the expanded forest were estimated at between CHF 8 million and CHF 16 million, at a maintenance cost of CHF 0.14 million. The alternative grey infrastructure of snow fences would cost at least CHF 1 million per hectare. Having one new skiing slope creates new snow release areas amounting to 2 ha, which have to be eliminated by snow fences costing CHF 2.3 million. In contrast, the assumed forest expansion hinders avalanches originating from release areas of up to 16 ha, which corresponds to CHF 16.2 million worth of snow fences.
Additionally, for the same study area, Grêt-Regamey et al. (2008b) estimated that new settlement areas (defined as 218 ha of holiday rentals at the most likely locations) would bring economic benefits of CHF 30.7 million for the subsequent 40 years, but only when excluding the negative impacts on selected ecosystem services that amount to CHF 23 million. The dominant ecosystem service impacted by the potential new infrastructure was protection against avalanches (CHF 14 million, i.e. 60% of all considered ecosystem services values), but the loss of avalanche protection value can be spatially allocated to specific buildings, and can thus easily be mitigated by planners.
Photo 4.2 Avalanche
© Joseph Reeves

Results
28 Exploring nature-based solutions
In a further investigation covering 250 km² in the same area, Grêt-Regamey et al. (2013a) estimated the total annual value for avalanche protection of the forests in the area (i.e. the GI). Applying different methods, including ones that integrate expert knowledge into the mapping of ecosystem services in an iterative cycle (Grêt-Regamey et al., 2013a and 2013b), this annual value amounts to between CHF 53 million and CHF 144 million. Grêt-Regamey et al. (2013a) additionally assess the average uncertainty of their estimations, which is based on differing assumptions for the number of damaged buildings, the number of persons per building and the lethality in affected buildings. The authors conclude that the total value of ecosystem services, but also the spatial pattern of the ecosystem service values, change substantially when considering parameter uncertainties, modelling uncertainties and uncertainties related to human-environment interactions. These uncertainties are common in ecosystem services research, and can provide key information for decision-makers seeking critical areas in the delivery of ecosystem services.
Olschewski et al. (2012) determined the willingness to pay for avalanche protection forests (i.e. GI) for the Swiss municipality Andermatt, in the canton of Uri, with about 1 250 inhabitants. They used a choice experiment combined with virtual reality visualisations, and conclude that the willingness to pay for this GI is in about the same range as the collective risk related to an avalanche event with a 300-year reoccurrence period, and within a range similar to the per household costs of alternative measures (i.e. grey infrastructure). The damage potential in the study region adds up to approximately USD 20.5 million for a 300-year avalanche event. This corresponds to an annual collective risk of approximately USD 68 500 for the municipality of Andermatt, which would increase by USD 30 000 under a scenario of a strong wind throw. Referring to a project duration of 80 years, the discounted risk sums up to USD 470 per household, and is thus in the same order of magnitude as grey infrastructure alternatives such as wooden logs, wooden grills, or steel bridges/nets that cost USD 60, USD 195, and USD 600 per household, respectively. However, the costs for the GI (silvicultural or 'forest management' measures to maintain protection forests) are significantly lower, and sum up to only USD 20 per household.
4.2.2 Assessment
According to the Group of European Avalanche Warning Services, an avalanche is defined as 'a snow mass with typically a volume greater than 100 m3 and a minimum length of 50 metres that slides rapidly downhill' (EAW). Avalanche formation is the result of a complex interaction between terrain, snow pack and meteorological conditions (i.e. slope steepness, depth of snow cover, volume of weak layers in the snow (ice) cover, water saturation, and other effects (wind, seismic activities, etc.).
Map 4.8 and Map 4.9 show the classified base data for ecosystem capacity to mitigate avalanche risk, based on the presence of protective forest and the hazard potential for avalanches. The integration of both data sets (Map 4.10) results in the delineation of a potential GI network for mitigating vulnerability to avalanches. As is to be expected, the hazard potential for avalanches is restricted to mountainous regions. On the other hand, existing forests up to a certain elevation are able to provide a protection function (green areas in Map 4.10 and Map 4.11 — zoom to the Alps).
Class 3 of the GI network identifies areas where avalanche vulnerability is moderate to high, but where no protection forest (with a minimum density of 50%) is present. Overlaying the GI network of Map 4.11 with the road infrastructure, one can recognise the demand, respectively its lack, for the protective function of GI. The result (Map 4.12) shows that many high mountain roads in the Alps have effective protection from avalanches, while the risk increases with elevation and decreases for protective forests.
The hazard for avalanches is obviously concentrated in the main European mountain ranges. Still, with respect to road networks, most of the mountain roads (shown for the Alps in Map 4.12) have a low to medium risk related to avalanches based on the available, rather coarse-scale input data. As avalanches are a particularly local phenomenon, some of the high-risk places should also be considered in their local context, taking into account possible hard protection means. On the other hand, the low risk areas clearly show that large parts of the Alps have an intact natural ecosystem providing valuable services. In a next step, it might be worthwhile extending the assessment to settlements and populated areas so as to complete the picture of assets at risk.

Results
29Exploring nature-based solutions
Map 4.8 Capacity to mitigate avalanche risk — Forest density
Map 4.9 Hazard potential for avalanches
1–Low hazard potential4–for avalanches
2–Medium hazard potential4–for avalanches
3–High hazard potential4–for avalanches
Mountain areas
No data
Outside coverage
Hazard potential for avalanches
70°60°50°
40°
40°
30°
30°
20°
20°
10°
10°
0°
0°-10°-20°-30°
60°
50°
50°
40°
40°
0 500 1000 1500 km
1–High capacity Outside coverage
No data2–Medium capacity
3–Low capacity
Capacity to mitigate avalanche risk — Forest density
70°60°50°
40°
40°
30°
30°
20°
20°
10°
10°
0°
0°-10°-20°-30°
60°
50°
50°
40°
40°
0 500 1000 1500 km
Map 4.10 Potential GI network based on ecosystem capacity to mitigate avalanche hazards
70°60°
40°
40°
30°20°
20°10°0°-20°-30°
60°
50°
50°
40°
40°
Ecosystem service flow —Avalanche vs. forest capacity
1–Best acting GI1–network
2–Restorable GI1–network
3–Inexistent but needed1–natural protection
4–No risk zone under1–normal conditions
Outside coverage
No data
Mountain areas
10°0 500 1000 1500 km0°
30° 50°-10°

Results
30 Exploring nature-based solutions
Map 4.11 Potential GI network based on ecosystem capacity to mitigate avalanche hazards (zoom to alpine area)
Map 4.12 European major roads at risk to avalanches, considering the presence and quality of a potential GI network
10°
10°
0 50 100 150 200 km
Ecosystem service flow — Avalanche vs. forestcapacity
1 – Best acting GI
2 – Restorable GI
3 – Inexistant but
4 – No risk zone under
Mountain areas
Outside coverage
network
network
needed naturaprotection
normal conditions
10°
10°
0 50 100 150 200 km
European road networkat risk to avalanches
1 – Low risk
2 – Medium risk
3 – High risk
4 – No risk under
Mountain areas
Outside coverage
normal conditions

Results
31Exploring nature-based solutions
4.2.3 Input data and analysis
Ecosystem capacity 'Forest'Apart from reducing vulnerability to landslides (see Section 3.1), forest cover can also decrease the occurrence of avalanches by stabilising the snow on the ground. The processing of forest data was carried out in a comparable manner to the creation of the forest density data set used as capacity in landslide adaptation. Based on the 25 m raster tiles, a mosaic with a resolution of 1 km was generated, and classified into three classes of forest density, as shown in Table 4.6.
Hazard potential 'Avalanches'The vulnerability for avalanches was calculated based on two data sets: first, a map of snow cover duration by the German Aerospace Center (DLR); and second, a digital elevation model (DEM), (Global 30 Arc-Second Elevation (GTOPO30) by the U.S. Geological Survey (USGS)). The snow cover was classified by the mean duration of snow cover for each raster cell. A snow cover of less than 10 days was assumed to be a no-risk zone: as the duration relates to the whole year, the
snow accumulation is not expected to become unstable and build up avalanches. Areas with less than 10 days of snow cover are found mostly outside mountainous areas and will therefore be less prone to avalanches. Areas with more than 10 days of snow cover were classified into three classes, as shown in Table 4.7.
The land relief was used as second indicator for avalanche vulnerability. Based on the GTOPO30 DEM by the USGS, the slope was calculated for the 1 km grid in the GIS. Values in literature define a slope of +/− 30° as threshold in starting zones of avalanches (Schweizer and Jamieson, 2000). Due to strong generalisation, especially in mountainous areas when using a 1 km raster, the threshold for the occurrence of avalanches was assigned at a lower slope value of 15°, to take into account the steeper slope on a smaller scale. A mask was calculated to exclude regions with slope values smaller than 15°. Cells with a slope > 15° were assumed to be in danger of avalanches. The output of the calculation is a raster indicating areas where avalanches could appear, based on snow cover duration and morphology.
Table 4.5 Data inputs
Name Specification
DLR Average snow cover duration (2000–2011) (Dietz et al., 2012)
Average snow cover — 1 km raster
USGS GTOPO30 Global 30 Arc-Second Digital Elevation Model
JRC Forest Cover Map, 2006 Forest cover mosaic raster data set — 25 m resolution
GISCO Transport v2 (2008) Road links at 1:1.000.000 Vector road network data set
Table 4.6 Ecosystem capacity 'Forest cover'
Class Forest density
High (1) 50–100%
Medium (2) 20–50%
Low (3) < 20%
Table 4.7 Hazard potential 'Avalanches'
Class Length of snow cover AND slopes > 15° per 1 km cell Hazard potential
Outside area 0–10 days Snow outside mountains (no avalanches assumed)
Low 10–90 d (< 3 months) Low
Medium 90–180 d (3–6 months) Medium
High 180–365 d (6 months–1 year) High

Results
32 Exploring nature-based solutions
Table 4.8 GI elements
Value Class Forest density Avalanche hazard potential
11 1 High capacity High hazard potential
12 1 High capacity Medium hazard potential
13 4 High capacity Low hazard potential
21 2 Medium capacity High hazard potential
22 2 Medium capacity Medium hazard potential
23 4 Medium capacity Low hazard potential
31 3 Low capacity High hazard potential
32 3 Low capacity Medium hazard potential
33 4 Low capacity Low hazard potential
Ecosystem service flowUnique new values were allocated to the four GI classes, according to the ecosystem service flow matrix, as seen in Table 4.8.
Beneficiaries 'Transport infrastructure'The hazard potential raster (for avalanches) was overlaid with the European transport network.
By overlaying the potential GI network (hazard potential × capacity) with the road network, one is able to obtain information on the demand side for GI, i.e. the area where assets (in this case, transport infrastructure) are at risk to a natural hazard and if (and in which quality) adaptive GI elements are present. For each road section, the danger of avalanches (without any human-made protection) is derived in this way.

Results
33Exploring nature-based solutions
4.3 Flood protection
4.3.1 Background — literature review
Floods, along with wind storms, are natural hazards that incur the highest economic losses in Europe. The flood-related losses in the EEA member countries over the period from 1998 to 2009 amounted to more than EUR 60 billion (EEA, 2011b). Feyen et al. (2012) estimated the expected annual damage (EAD) from river flooding events in Europe to exceed EUR 6.4 billion (in constant 2006 prices), likely to increase to between EUR 14 billion and EUR 21.5 billion by 2100, as a result of climate change. Jongman et al. (2014) estimated that the EAD may increase to EUR 23.5 billion by 2050, up from the current EUR 4.9 billion estimated for the period from 2000 to 2012.
Growing population and land conversion/consumption threaten to intensify flood risk, in addition to climate change. Many of Europe's large cities and conurbations are located close to major rivers in the middle or lower reaches of river basins (EEA, 2012). As a rough estimate, in absence of a faithful account of current flood protection measures, around 20% of cities are classified as vulnerable to fluvial floods. Land management choices influence both the amount and speed of surface run-off, affecting the shape of the downstream hydrograph (Morris, Hess and Posthumus, 2010). Increased flood risk is hence an unidirectional externality of the upstream land management decisions (Wheater and Evans, 2009).
Progressing urbanisation and soil sealing, along with floodplain development and wetland conversion or degradation have contributed to increased run-off and flood risk. Since the mid 1950s, the total surface area of cities in the EU has increased by 78%, while the population has grown by only 33% (EEA, 2006). Over the period from 1990 to 2006, the settlement areas increased by 15 000 km2 (9%) (EC, 2012). The urban population is expected to grow to 80% by 2020 (EEA, 2010).
Floodplains are hotspots of ecosystem services provision, playing an important role for freshwater supply; they provide products from agriculture, fishery and forestry; bioremediation; flood protection; habitat and gene pool protection; and recreational opportunities (Gren, 1995; Tockner and Stanford, 2002; Rouquette et al., 2009; Arthington et al., 2010; Posthumus et al., 2010; Scholz et al., 2012; Schindler et al., 2014; Zorilla-Miras et al., 2014). Nature-based flood management including regulatory ecosystem services has gained increasing attention (EC, 2007; EEA, 2010; Gremli et al., 2013; Alfieri et al., 2014). Basin-wide solutions focus on the reintegration of former floodplains as retention basins (Fokkens, 2007; Reckendorfer et al., 2013).
Restoration and rehabilitation measures are promoted for improving the multifunctionality of wetlands and floodplains (Maltby, 2010; Roquette et al., 2011; Schindler et al., 2014; Stürk et al., 2014). However, weak
Photo 4.3 Flood protection
© Peadar Crosbie

Results
34 Exploring nature-based solutions
understanding of the economic value of ecosystem services produced by floodplains and wetlands may lead to inadequate policy choices (Mori, 2010; Mori and Perrins, 2012; Banjeree et al., 2013). Therefore, it is necessary to improve valuations of the trade-offs between floodplain ecosystem services and land development (Acreman et al., 2011; Roquette et al., 2011; Sason et al., 2012; Zorilla-Miras et al., 2014).
There is steadily increasing evidence underlining the importance of wetlands for flood protection, as shown by Bullock and Acreman (2003), who found that in 23 of 28 relevant studies, wetlands reduce or delay peak discharge. However, studies assessing the value of GI as means of delivering flood protection services are scarce. Bradner et al. (2012) estimated that the value associated with the loss of EU wetlands, projected to decline by 7 400 km² by 2050, amounts to USD 1 billion a year. This estimate includes flood protection, but also several other ecosystem services.
Gren et al. (1995) assessed the value of the Danube floodplains, considering provision of input resources, recreation and nutrient purification. They calculated that for the entire Danube floodplains, the value of ecosystem services amounted to ECU 650 million or ECU 374/ha. Several studies deal with flood hazards and flood risk (Huttenlau et al., 2010; Gremli et al., 2013; Alfieri et al., 2014), but lack explicit information on risk mitigation and adaptation capacity.
Stürk et al. (2014), on the other hand, assessed and mapped flood protection supply by GI and flood protection demand for the entire EU except Bulgaria and Croatia. They found that flood regulation demand is highest in central Europe, at the foothills of the Alps and upstream of urban agglomerations. The patterns of demand and supply hardly match, because catchments with a high population density and more assets at risk have human-dominated land uses and a comparatively low regulation capacity. However, Stürk et al. (2014) did not explicitly relate their interesting results to flood hazard or flood risk, which would have been important given that flood protection and the demand for it are most relevant in areas where floods actually do occur.
At local level, one interesting case study was conducted in the Lower Biebrza Basin in north-east Poland (450 km²), where the value of the water storage service of the floodplains (140 km²) was assessed as EUR 5.5 million annually (i.e. EUR 400/ha floodplain)
with small areas of the central floodplains reaching values up to EUR 5 000/ha (Grygoruk et al., 2013). The estimation was conducted on the basis of the costs of small artificial water reservoirs (i.e. alternative grey infrastructure) and the retention capacity of the floodplains (i.e. GI). Using similar methods at a smaller scale, Pithart et al. (2010) assessed the annual value of the flood retention service of EUR 6 500/ha for the Lužnice floodplain (284 ha) in the Czech Republic.
In conclusion, there is general agreement that ecosystem services of floodplains and wetlands should be taken into account in management decisions on land and water use (Mori, 2010; Mori and Perrings, 2012; Verhover, 2014). Multifunctional solutions based on GI seem to be promising (Schinder et al., 2014; Stürk et al., 2014). Further degradation should be stopped, and the natural wetlands and floodplains should be restored where economically efficient (Verhoven, 2014). Human-made infrastructure can be combined with GI (Kryžanowski et al., 2014).
4.3.2 Assessment
Flooding, along with wind-related storms, is the most important natural hazard in Europe, in terms of economic loss (ESPON, 2012). River and flash floods are the most frequently occurring flood events in Europe. Whereas river floods are triggered by heavy rainfall, melting snow in upstream areas or tidal-related influences, flash floods occur as a result of the rapid accumulation and release of run-off waters from upstream mountainous areas; they can be caused by extreme rainfall, cloud bursts, landslides, the sudden break-up of a dike or failure of flood control works.
Maps 4.13 and 4.14 show the defined ecosystem capacity (4) to positively control the flood extent by infiltrating parts of the water inundating the area. The absolute infiltration values per annum are converted into a three-level capacity ranking. Maps 4.15 and 4.16 illustrate the hazard of the projected changes in flood extent, additionally to the existing hazard of being flooded by events larger than HQ2 (5).
The dimension of the inundated area represented in the map is shown as a kind of maximum predictable inundation area by the HQ100 (6) event. The increase or decrease of water height during the modelled flood is classified into three classes of hazard. As the
(4) Data source: Figure A4 in Maes, J., Paracchini, M. L., and Zulian, G., 2011, A European assessment of the provision of ecosystem services, JRC Scientific and Technical Reports, Luxembourg: Publications Office of the European Union.
(5) Indication of the return period of a flood event (HQ2 = 2-year return frequency or rather frequent flood event).(6) Indication of the return period of a flood event (HQ100 = 100-year return frequency or very rare flood event).

Results
35Exploring nature-based solutions
Map 4.13 Ecosystem capacity: annual infiltration rate
Map 4.14 Ecosystem capacity: classified annual infiltration rate
No data
Annual infiltration rate
Outside coverage
421 mm
0 mm
Classified annual infiltration rate
1–High capacity potential
2–Medium capacity potential
3–Low capacity potential
No data
Outside coverage
70°60°50°
40°
40°
30°
30°
20°
20°
10°
10°
0°
0°-10°-20°-30°
60°
50°
50°
40°
40°
70°60°50°
40°
40°
30°
30°
20°
20°
10°
10°
0°
0°-10°-20°-30°
60°
50°
50°
40°
40°
0 500 1000 1500 km 0 500 1000 1500 km
potential flood area is visible only in larger detail, the hazard is shown for parts of Europe by zooming in on different regions of interest.
Large-scale areas of highest flood hazard can be found in the Danube catchment with its tributary streams, especially in parts of Hungary, Romania and Serbia (Map 4.17). Additional regions with bigger high flood hazard stretches are situated in Alpine parts, France, the Netherlands and the United Kingdom. These areas are mentioned to demonstrate a few focus areas, just in order to show a rough European picture. River systems for northern parts of Europe show more moderate changes in flood extent which are more limited spatially.
The integration of the maps on ecosystem capacity (i.e. infiltration capacity (Map 4.14), and flood hazard, (i.e. change in inundation height (Map 4.16)) is shown in Map 4.18. Map 4.18 shows in red those areas where a flood hazard exists, but where potential mitigating, natural GI elements are missing. Western rivers, and particularly river networks in eastern countries (e.g. Hungary and Romania) exhibit gaps in natural protection against flood hazards. In these areas, both the main rivers (e.g. the Danube) and their tributaries show missing GI or at least potentially restorable GI networks. River systems with best acting GI or
restorable GI are located in northern countries (Sweden and Norway) and the northern part of Germany and Benelux, as exhibited in Map 4.19.
The integration of the GI elements (derived from flood hazard and ecosystem capacity) with the demand side is shown in Map 4.20. It indicates the high need for flood protection by GI for the eastern part of Hungary, where huge areas of high and medium risk areas can be found in the Tisza and the Körös River catchments. For the upper part of the Oder River (Map 4.21) and the Po plain in Italy, there are also big areas of higher risk, which extend to lower situated parts. The risk for floods distribution is very finely granulated, so the risk may change in a very short distance, depending on capacity and hazard. One area showing such a complex combination of all three classes of risk is the upper section of the Rhine. More major regions at high risk of flood endangerment can be found at the Danube delta region, the central part of the Elbe in Germany, the central Rhine and the lower section of the Rhône and its canal du Rhône à Sète. These are only examples and rough descriptions of the European image of flood risks, as the risk is varying on a small scale. The spatial distribution of risk areas becomes more visible after aggregation of the full resolution grid data to NUTS level 2 administrative units (see Map 4.22).

Results
36 Exploring nature-based solutions
Map 4.15 Flood depth for a HQ100 event in 2000 and 2085
Map 4.16 Change in inundation height for the HQ100 event between 2000 and 2085
Change in flood height between 2000 and 2085 (%)
211– 100
Change in inundation height for the HQ100 event
0 50 100 150 200 km
Inundation height in 2000 and 2085 (m)
13.770
Flood depth for a HQ100 event
0 50 100 150 200 km
Map 4.17 Flood hazard for parts of the Danube River catchment based on changes in inundation height
30°
20°
20°
Romania
Bulgaria
Serbia
UkraineUkraine
HU
Moldova
Slovakia
Bos.-Herz.
Montenegro
Kosovo Turkey
Croatia
PolandPoland
0 50 100 150 200 km
Sofiya
Sarajevo
Chisinau
Budapest
Bucharest
Belgrade
Hazard potential for floods
Existing hazard pluspredicted high increase
Existing hazard pluspredicted mediumincrease
Existing hazard withoutsignificant increase
Outside coverage

Results
37Exploring nature-based solutions
Map 4.18 GI elements in the Danube Basin
Map 4.19 GI elements in northern Germany
Ecosystem service flow —Flood hazard vs. infiltrationcapacity
1–Best acting GI
2–Best restorable GI
3–Inexistent or low 3–natural protection
Outside coverage
Sofiya
Belgrade
Sarajevo
Chisinau
Budapest
Bucharest
Romania
Bulgaria
Serbia
Ukraine
Hungary
Moldova
Slovakia
Bos.-Herz.
Montenegro Kosovo Turkey
Croatia
Poland Poland
Ukraine30°
20°
20°
0 50 100 150 200 km
Weser
Elbe
Bremen
Hamburg
Hannover
Bremerhaven
Germany
Ecosystem service flow —Flood hazard vs. infiltrationcapacity
1–Best acting GI
2–Best restorable GI
10°
10°
0 25 50 75 100 km

Results
38 Exploring nature-based solutions
Map 4.20 Flood risk in the Danube Basin (subset)
Map 4.21 Flood risk in the Oder Basin (subset)
HUNGARY
ROMANIA
SLOVAKIA
Dan
ube
Tisza
Duna
Arad
Eger
OradeaSzolnok
Miskolc
Budapest
Debrecen
Kecskemet
Bekescsaba
NyiregyhazaSalgotarjan
20°
20°
0 25 50 75 100 km
Physical and monetaryrisks by flood changes
1 - Low risk
2 - Medium risk
3 - High risk
1–Low risk
2–Medium risk
3–High risk
Risk — Physical and monetaryrisk by flood changes
Poland
Czech Republic
Germany
Odra
Labe
Elbe
Opole
Konin
Prague
KaliszLeszno
Poznan
Ostrava
Dresden
WroclawLegnica
Sieradz
WalbrzychJelenia Gora
Zielona Gora
Hradec Kralove
Usti Nad Labem
Gorzow Wielkopolski
50°
50°
0 25 50 75 100 km

Results
39Exploring nature-based solutions
The assessment demonstrates the scope of GI for flood protection. Even though human-made protections are not considered (this information does not exist at pan-European level (EDENext)), the assessment could identify regions with a good potential for mitigating river floods by natural means (large areas with semi-natural vegetation and good soil infiltration).
Moreover, the assessment has identified regions with a lack of existing natural capacity to mitigate floods — decision-makers in these regions will need to think about sensible combinations of natural and artificial measures to efficiently mitigate the effects of flooding. The aggregated flood risk map allows better visualisation, at European level, of regions at higher or lower risk of flooding (based on high vulnerability and demand).
Map 4.22 Flood risk map aggregated to administrative regions (NUTS level 2)
Risk — Physical and monetaryrisk by floods per NUTS2region
1–Low risk
2–Medium risk
3–High risk
No information onfloods (or < 0.5% ofNUTS unit covered)
Outside coverage
No data
70°60°
40°
40°
30°20°
20°10°0°-10°-20°-30°
60°
50°
50°
40°
0° 10°0 500 1000 1500 km
50°30°
40°

Results
40 Exploring nature-based solutions
4.3.3 Input data and analysis
Ecosystem capacity 'Annually summed soil infiltration'The annually summed soil infiltration raster was masked to cover land areas only and to show the same extent as the other data sets. The resulting raster was classified into three classes, with thresholds based on quantile distribution.
Hazard potential 'Floods'The floods used to evaluate future flood extents were based on modelling with the LISFLOOD hydrological model, produced by the EDENext project (EDENext). Current and projected flood inundation maps at 100 m resolution have been used from data produced by the
EU JRC as possible proxies for extreme precipitation. Driven by regional climate simulations of the HIRHAM regional climate model, future trends are derived of the HQ2 and HQ100 floods for the years 2000 and 2085 (mid-point of the period from 2070 to 2010). The results of the modelling approach do not consider local flood defences. The inundation information is used to identify areas potentially affected by the HQ100 event. Based on the inundation extents of the HQ100 flood for the years 2000 and 2085, the percentage change in flood height is calculated for the 100 m raster cells.
In this particular case, no 'no-risk' areas exist, as the HQ100 inundation area is at risk by definition. The assessment looks to the additional risk due to the change in flood regime.
Ecosystem service flowThe effect of GI on the hazard arising from the HQ100 flood is evaluated by combining the GI's capacity value and the hazard from the flood per raster cell. Unique values are derived from the combination, and reclassified into a three-level ecosystem service flow assessment.
Table 4.9 Input data
Name Specification
JRC Flood return rate projections 2 year/100 year return rates for 2000/25/35/85
100 m raster defining inundation heights for HQ2 and HQ100 floods in 2000, 2025, 2035 and 2085. Future flood extents based on modelling with LISFLOOD model and HIRHAM regional climate model (metres)
Corine Land Cover 2006 100 m raster representing land cover
JRC MAES annually summed soil infiltration 1 km raster defining annual infiltration (mm)
Table 4.10 Ecosystem capacity 'Soil infiltration'
Class Annual infiltration capacity (mm)
Low (3) 0–10
Medium (2) > 10–30
High (3) > 30–421
Table 4.11 Hazard potential 'Flood'
Class Percentage change in inundation height (%) for the year 2085 in addition to the HQ100
hazard in 2000
Hazard potential
High (1) > 25–210.40 High additional hazard
Medium (2) > 0–25 Medium additional hazard
Low (3) − 100–0 Low additional hazard
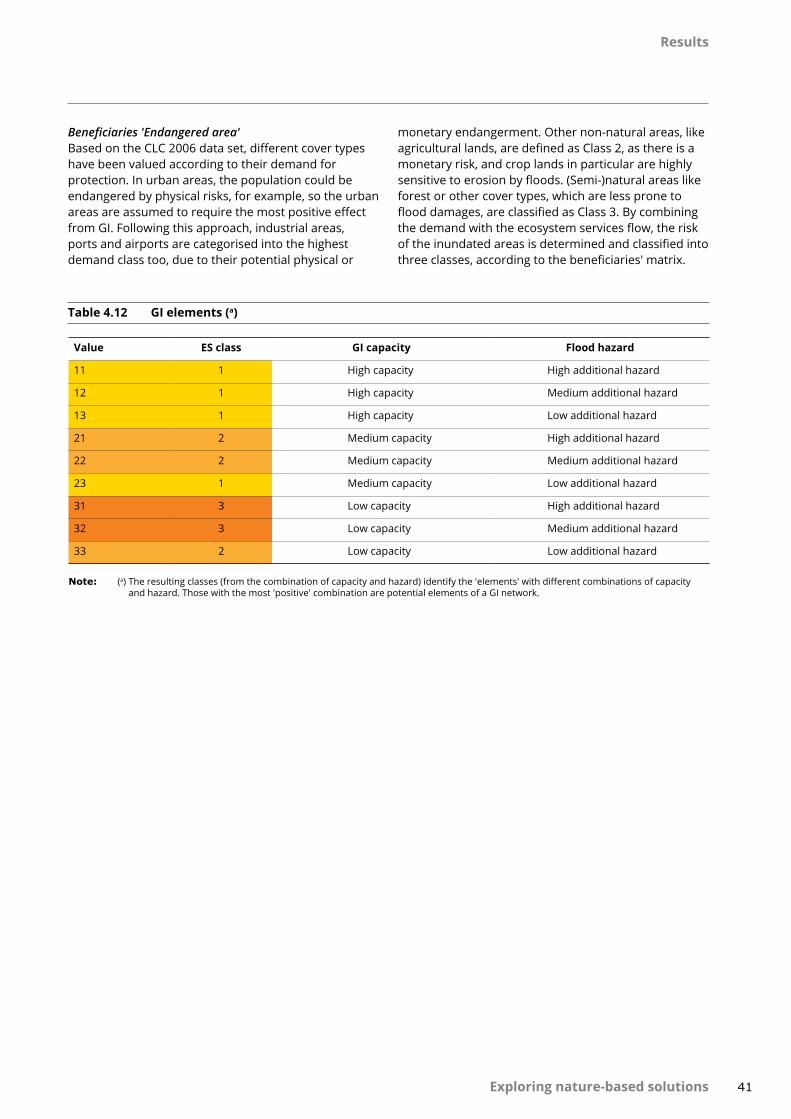
Results
41Exploring nature-based solutions
Note: (a) The resulting classes (from the combination of capacity and hazard) identify the 'elements' with different combinations of capacity and hazard. Those with the most 'positive' combination are potential elements of a GI network.
Table 4.12 GI elements (a)
Value ES class GI capacity Flood hazard
11 1 High capacity High additional hazard
12 1 High capacity Medium additional hazard
13 1 High capacity Low additional hazard
21 2 Medium capacity High additional hazard
22 2 Medium capacity Medium additional hazard
23 1 Medium capacity Low additional hazard
31 3 Low capacity High additional hazard
32 3 Low capacity Medium additional hazard
33 2 Low capacity Low additional hazard
Beneficiaries 'Endangered area'Based on the CLC 2006 data set, different cover types have been valued according to their demand for protection. In urban areas, the population could be endangered by physical risks, for example, so the urban areas are assumed to require the most positive effect from GI. Following this approach, industrial areas, ports and airports are categorised into the highest demand class too, due to their potential physical or
monetary endangerment. Other non-natural areas, like agricultural lands, are defined as Class 2, as there is a monetary risk, and crop lands in particular are highly sensitive to erosion by floods. (Semi-)natural areas like forest or other cover types, which are less prone to flood damages, are classified as Class 3. By combining the demand with the ecosystem services flow, the risk of the inundated areas is determined and classified into three classes, according to the beneficiaries' matrix.

Results
42 Exploring nature-based solutions
4.4 Storm surge protection
4.4.1 Background — literature review
In a recent systematic review, Liquete et al. (2013) define coastal protection (and synonyms such as storm surge protection) as the 'natural defence of the coastal zone against inundation and erosion from waves, storms or sea-level rise'. The provision of this ecosystem service is threatened by climate change due to expected sea-level rise and increased frequency and intensity of windstorms, but often remains unvalued through markets and thus likewise in decision-making (Hopkinson et al., 2008; Martinez et al., 2013; Ruckelshaus et al., 2013; Spalding et al., 2014a and 2014b). The dampening of environmental disturbances and natural hazards such as tidal surges, storms and floods is strongly related to the presence of organisms in the front line of sea defence: these are binding and stabilising sediments, and they bring about wave attenuation and shore stabilisation (Shepard et al., 2011; Salmonidi et al., 2012).
One of the best known examples for such GI are mangroves that provide habitat and storm surge protection; when the mangroves are deforested and used for shrimp aquaculture, this protection is severely diminished (Barbier, 2007 and 2012, Barbier et al., 2008). Also, several other coastal ecosystems such as salt marshes and other wetlands, and dune systems, can function as GI by playing key roles in buffering the coastline against the impacts of periodic storms (Costanza et al., 2008; Barbier et al., 2011; Shepard et al., 2011; Van Loon-Steensma and Vellinga,
2013; Spalding et al., 2014b). Even though they hold endangered status (Orth et al., 2006), specific seabed biotopes such as reef, kelp, seaweed, and sea grass ecosystems are crucial for sediment retention and prevention of coastal erosion or underwater sediment slides (Salmonidi et al., 2012; Christianen et al., 2013).
It is challenging to measure the value of storm surge protection by GI, because of the highly variable and uncertain trajectories, frequencies, intensities and impacts of storms (Turner et al., 2007; Costanza et al., 2008; Koch et al., 2009; Barbier et al., 2012; Lau et al., 2013). In the literature screened by Liquete et al. (2013), 53 different indicators (16 indicators on capital, 7 on flow and 30 on benefits) were used for this ecosystem service. When using choice modelling, willingness to pay is strongly influenced by whether respondents have experienced flooding, as shown for instance in Louisiana, where respondents would be willing to pay USD 35 annually to make basement flooding 50% less frequent (Londoño Cadavid and Almo, 2013).
However, several assessments were completed: coastal wetlands (i.e. GI) in the United States, for instance, are estimated to provide USD 23.2 billion in storm surge protection services annually (Constanza et al., 2008). For Europe, Roebeling et al. (2013) report territory losses due to coastal erosion of 4 500 km² for 1975 through 2006, and of between 3 700 km² and 5 800 km² for 2006 through 2050. Corresponding ecosystem services provided by coastal GI would accordingly decrease in value annually, from EUR 22.3 billion
Photo 4.4 Storm surge protection
© Richard Watkins LRPS

Results
43Exploring nature-based solutions
(1975) to EUR 21.6 billion (2006) and approximately EUR 19.8 billion (2050).
Across England and Wales, sea-level rise, increased cliff erosion and more extensive and frequent flooding is potentially jeopardising privately owned houses and business assets estimated to encompass 4 million people and collateral worth GBP 200 billion (O'Riordan et al., 2008). Disturbance prevention and alleviation provided by the British marine protected areas (i.e. GI) was estimated at GBP 440 million annually (Hussain et al., 2010). At local scale, Turner et al. (2004) showed for the Humber estuary (eastern England) that combining economic growth with environmental protection should be beneficial in the long run, compared to the strict maintenance of grey infrastructure: they set out net value differences of between GBP 4 million and GBP 12 million after 50 years. Specifically, this combination included a reduction of expenditure for grey infrastructure (flood defence) and restoration of GI (compensation for intertidal habitat loss in compliance with the Habitats Directive), as well as considerable emphasis on creation of GI (intertidal habitat) with less restrictive criteria to identify suitable areas for realignment.
Using the same scenarios for the neighbouring Blackwater estuary, but applying site-specific value estimates derived by choice experiments instead of benefit transfers, the net differences were specified, with between GBP 156 million and GBP 190 million after 50 years, in favour of the GI (Luisette et al., 2011). In another local case study for an area of 1 430 km² at the central Portuguese coast, Alves et al. (2009) report ecosystem services equalling EUR 193 million annually for the year 2000, that would decrease by EUR 45 million (i.e. 25%) by 2058. For the heavily impacted Mar Menor in south-east Spain, Martinez et al. (2013) report a willingness to pay between EUR 20 and EUR 35 annually for significant environmental improvements. These improvements would be delivered by a combination of grey (desalination plant, peripheral wells and wastewater tanks) and green (cleaned and restored main inflow) infrastructure. The investment of EUR 140 million is estimated to break even after 11 years, and to deliver net benefits of EUR 363 million after 50 years, when fully accounting for the environmental and amenity benefits. However this full accounting did not take place — and neither did the investments (Martinez et al., 2013).
In the Netherlands, Van Slobbe et al. (2013) drew up a framework for 'Building with Nature' and assessed
costs and benefits for big-scale grey infrastructure (dams, for instance), small-scale dynamic preservation (maintenance of the 1990 coastline with small-scale sand nourishments) and a 'sand engine' for coastal maintenance by mega sand nourishments. Grey infrastructure often implies low maintenance costs of the structure per se, but high adaptation costs and loss of beach and dune areas. Dynamic preservation involved annual costs of EUR 60 million for the entire Dutch coast, while benefits are being restricted to maintenance of the coastline and preservation of beaches and dunes. A single sand engine costs EUR 70 million over 20 years, but it may be cheaper once upgraded to become a regular practice, and it would have multiple benefits for coastal protection, nature, recreation and freshwater extraction (Van Slobbe et al., 2013).
Spalding et al. (2014a) recommend risk reduction by integrated coastal defence planning. Here GI and grey infrastructure would be combined into a single, holistic planning framework. The use of ecosystems to reduce coastal risk would expand the options for management, with potentially significant economic benefits, and co-benefits for coastal communities and biodiversity. It is also recommended to urgently implement proven management interventions (Spalding et al., 2014b), which include the mentioned examples for GI such as marine protected areas (e.g. Hussain et al., 2010), habitat restoration (e.g. Turner et al., 2004) and managed realignment (e.g. Luisette et al., 2011), as well as hybrid engineering structures (e.g. Van Loon-Steensma and Vellinga, 2013; Van Slobbe et al., 2013).
4.4.2 Assessment
Marine and coastal ecosystems provide a wide range of services to human society including supporting, regulating, cultural and provisioning services. With regard to storm surge protection wetlands, sand dunes, reefs and other coastal ecosystems can slow waves down, reducing their height and intensity, and prevent erosion. This means less storm surge, more stable shorelines and more resilient coastal communities.
Map 4.23 and Map 4.24 show the classified base data for ecosystem capacity to mitigate storm surge-related hazards based on coastal capacity and the hazard potential for storm surges. The integration of both data sets (in Map 4.25) results in the delineation of a potential GI network for mitigating vulnerability to storm surges in coastal regions.

Results
44 Exploring nature-based solutions
Map 4.23 Coastal capacity Map 4.24 Hazard potential for storm surges
1–High capacity
2–Medium capacity
3–Low capacity
Storm surge line
Outside coverage
No data
Coastal capacity
Implausible
Very high
Hazard potential for storm surges
Outside coverage
No data
70°60°50°
40°
40°
30°
30°
20°
20°
10°
10°
0°
0°-10°-20°-30°
60°
50°
50°
40°
40°
70°60°50°
40°
40°
30°
30°
20°
20°
10°
10°
0°
0°-10°-20°-30°
60°
50°
50°
40°
40°
0 500 1000 1500 km 0 500 1000 1500 km
Map 4.25 Potential GI network based on ecosystem capacity to mitigate exposure to storm surges
Ecosystem service flow —Coastal capacity vs. stormsurge hazard
1–Best acting GI
2–Restorable GI
3–Inexistent but needed4–natural protection
4–No risk zone under4–normal conditions
Outside coverage
No data
70°60°
40°
40°
30°20°
20°10°0°-20°-30°
60°
50°
50°
40°
10°0°0 500 1000 1500 km
40°
50°30°-10°

Results
45Exploring nature-based solutions
Map 4.26 Population at risk to storm surges, considering the presence and quality of a potential GI network and population density
(7) In fact, the general methodological approach was developed with C. Liquete while she was working at GeoVille, and the input data informing the current study were provided by her.
Regions vulnerable to storm surges are mostly found in northern Europe, which is affected by heavy storms to a greater extent than more southern regions. Nonetheless, the coastal capacity is mostly low and consequently, the existing GI network is not very efficient in protecting the coast by natural defences. Fortunately, only a few population hotspots are located in the affected coastal areas (Map 4.26).
A very similar assessment has meanwhile been published by Liquete et al. (2013) using the same input data (7), but slightly different parameters and weights for exposure and demand:
• Coastal ProtectionCapacity = 0.33 geo + 0.25 slo + 0.21 sea + 0.21 lan
• Coastal ProtectionExposure = 0.29 wav + 0.29 sur + 0.23 lev − 0.19 tid
• Coastal ProtectionDemand = 0.35 pop + 0.30 inf + 0.20 art + 0.15 cul
where 'geo' refers to geomorphology, 'slo' to slope, 'sea' to seabed habitats, 'lan' to land cover, 'wav' to wave regime, 'sur' to storm surge, 'lev' to relative sea-level change, 'tid' to tidal amplitude, 'pop' to population density, 'inf' to infrastructures, 'art' to artificial surface, and 'cul' to cultural sites.
The study uses a similar set-up of capacity, flow and demand/benefit. While the coastal protection capacity in both approaches show a consistent picture, the exposure in the study is limited to storm surges which are more concentrated in the north of Europe. The resulting demand map is therefore focused on these areas, while Map 4.27 (extracted from Liquete et al.) shows a more complete picture across Europe.
Risk — Population at risk to storm surges
1–Low risk
24Medium risk
34High risk
Outside coverage
No data
70°60°50°
40°
40°
30°
30°
20°
20°
10°
10°
0°
0°-10°-20°-30°
60°
50°
50°
40°
40°
0 500 1000 1500 km

Results
46 Exploring nature-based solutions
Map 4.27 Coastal protection benefit
Source: Liquete et al., 2013.
4.4.3 Input data and analysis
Capacity 'Coastal protection'Corresponding to the approach in Liquete et al. (2013), the coastal protection capacity was classified into three classes based on their statistical distribution (33rd and 67th percentiles as thresholds), calculated by taking geomorphology, slope, seabed habitats and land cover into account. The following values shown in Table 4.14 are consequently assigned.
Hazard potential 'Storm surges'The hazard potential for storm surges was defined using the results of the ESPON natural hazard project. The vector data set was classified into two classes,
Table 4.14 Ecosystem capacity 'Coastal protection'
Class Coastal protection
Low (3) Low capacity (0–33% percentile)
Medium (2) Medium capacity (33–67% percentile)
High capacity (1) High capacity (67–100% percentile)
Table 4.13 Input data
Name Specification
ESPON storm surge Vector file defining the plausibility for storm surge events
Coastal Protection (Liquete et al., 2013a) 1 km raster on calculated capacity of coastal protection concerning storm surges
GEOSTAT population 2006 1 km raster representing the population density (inhabitants/square kilometre) for each cell
'implausible' and 'very high vulnerability', for storm surges in NUTS 3 regions. The data set was converted from vector format to raster with a resolution of 1 km.
Coastal protection benefit
DeficientSufficientPlentiful
0 500 1000 1500 km
70°60°50°
40°
40°
30°
30°
20°
20°
10°
10°
0°
0°-10°-20°-30°
60°
50°
50°
40°
40°

Results
47Exploring nature-based solutions
Table 4.15 GI elements
Ecosystem capacity
Hazard potential
10 20 30
11 21 31
Table 4.16 Level of risk associated with storm surges
Population
GI network10 20 30
11 21 31
As the original data set only defines two classes, it was not possible to separate it into three classes. The two classes were assigned to the raster data set: no vulnerability (Class 0), and vulnerability (Class 1).
Ecosystem service flowThe potential effect of the coastal ecosystem service capacity on storm surge impacts was evaluated by combining both layers and rating the ecosystem service flow. Coastal capacity was used as the first character, while hazard potential was the second. Due to only two possible values in hazard potential, the matrix contains only six cases. The result is finally classified into three classes of potential ecosystem effect, as seen in Table 4.15.
Beneficiary 'Population'As storm surges especially endanger human lives and valuables of settlements near the coast, these are selected as beneficiaries of the GI related to impacts
of storm surges. The population grid by GEOSTAT is converted into a raster grid and categorised by the density of inhabitants per square kilometre. The thresholds for defining vulnerability are related to the definition of rural areas by the Organisation for Economic Co-operation and Development (OECD)/JRC. Regions with a population density below 150 inhabitants/km2 are categorised as low vulnerable (Class 3). Cells representing settlement areas with between 150 and 500 inhabitants/km2 are classified as having medium vulnerability (Class 2). Areas with more than 500 inhabitants/km2 are high vulnerable regions, where immense harm can occur (Class 1).
Both the population density raster and the storm surge hazard raster are combined into one raster data set with unique values for all possible combinations. These combinations are classified according to the beneficiary matrix. Since there are only two different exposure specifications, the matrix only has six cases.

Results
48 Exploring nature-based solutions
4.5 Carbon stabilisation by ecosystems
4.5.1 Background — literature review
A literature review related to this ecosystem service led to a range of publications with some relevant case studies mainly dealing with GI in urban regions and their benefits; due to increasing urbanisation, urban GI and its management plays a key role in global climate regulation. Young (2010) underlines the importance of ecosystem services provided by municipal forests and green space, in the course of an investigation in cooperation with municipal forest departments of North America. One of the results is that management of municipal green space in connection with ecosystem services is increasingly significant for the goals and actions of the departments.
Carter et al. (2014) focus on climate change in cities based in Greater Manchester while investigating requirements for building capacity for urban adaptation. In Chapter 4, titled 'Urban greening for climate change adaptation: challenges and opportunities for building adaptive capacity', they show through scenarios that additional green space could significantly reduce rising temperatures associated with climate change and the urban island effect.
Cavan et al. (2014) emphasise the importance of urban GI in providing important regulating services and stronger resilience to climate change. Applied to two African cities, Cavan et al. (2014) valuate morphological characteristics using urban morphology
types and their impact on temperature regulation services, concluding with best values for traditional housing areas with better composition of green structures.
A case study from Lancaster (United States) describes the economic benefits of GI; in this US Environmental Protection Agency (EPA) report, Mittman et al. (2012) present GI as a cost-effective solution. For valuating terms, four benefit categories were selected. The benefit category 'climate change-related benefits' value was reduced carbon dioxide (CO2). The benefit of reduced CO2 through direct carbon sequestration due to GI vegetation is estimated at USD 786 000 annually.
In their study, Foster et al. (2011) provide information on costs and benefits of GI for urban climate adaptation, considering the effects on North American cities of eco-roofs, green alleys and streets, and urban forestry. Washington's street trees, for instance, lead to an estimated value of annual USD 349 000 for CO2 benefit, deduced from increases in property value, which is based on the presence of trees. Trees in Atlanta have been calculated to provide USD 8 million worth of pollution removal value annually, and store a total of 1.2 million tonnes of carbon. Further on, Foster et al. (2011) enclose comprehensive reports of GI Strategies of some North American Cities. The study outlines that local planning and building decisions need to incorporate how to prepare for and manage impacts from climate change and weather extremes in
Photo 4.5 Carbon stabilisation by ecosystems
© EEA
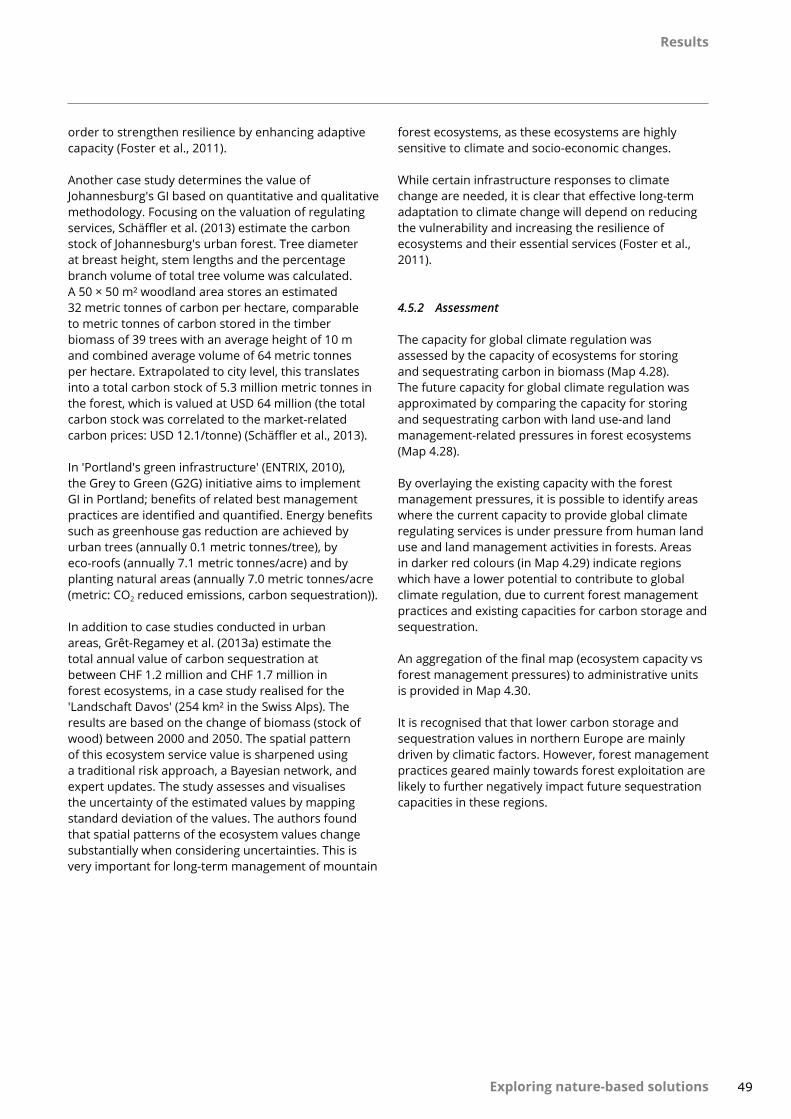
Results
49Exploring nature-based solutions
order to strengthen resilience by enhancing adaptive capacity (Foster et al., 2011).
Another case study determines the value of Johannesburg's GI based on quantitative and qualitative methodology. Focusing on the valuation of regulating services, Schäffler et al. (2013) estimate the carbon stock of Johannesburg's urban forest. Tree diameter at breast height, stem lengths and the percentage branch volume of total tree volume was calculated. A 50 × 50 m² woodland area stores an estimated 32 metric tonnes of carbon per hectare, comparable to metric tonnes of carbon stored in the timber biomass of 39 trees with an average height of 10 m and combined average volume of 64 metric tonnes per hectare. Extrapolated to city level, this translates into a total carbon stock of 5.3 million metric tonnes in the forest, which is valued at USD 64 million (the total carbon stock was correlated to the market-related carbon prices: USD 12.1/tonne) (Schäffler et al., 2013).
In 'Portland's green infrastructure' (ENTRIX, 2010), the Grey to Green (G2G) initiative aims to implement GI in Portland; benefits of related best management practices are identified and quantified. Energy benefits such as greenhouse gas reduction are achieved by urban trees (annually 0.1 metric tonnes/tree), by eco-roofs (annually 7.1 metric tonnes/acre) and by planting natural areas (annually 7.0 metric tonnes/acre (metric: CO2 reduced emissions, carbon sequestration)).
In addition to case studies conducted in urban areas, Grêt-Regamey et al. (2013a) estimate the total annual value of carbon sequestration at between CHF 1.2 million and CHF 1.7 million in forest ecosystems, in a case study realised for the 'Landschaft Davos' (254 km² in the Swiss Alps). The results are based on the change of biomass (stock of wood) between 2000 and 2050. The spatial pattern of this ecosystem service value is sharpened using a traditional risk approach, a Bayesian network, and expert updates. The study assesses and visualises the uncertainty of the estimated values by mapping standard deviation of the values. The authors found that spatial patterns of the ecosystem values change substantially when considering uncertainties. This is very important for long-term management of mountain
forest ecosystems, as these ecosystems are highly sensitive to climate and socio-economic changes.
While certain infrastructure responses to climate change are needed, it is clear that effective long-term adaptation to climate change will depend on reducing the vulnerability and increasing the resilience of ecosystems and their essential services (Foster et al., 2011).
4.5.2 Assessment
The capacity for global climate regulation was assessed by the capacity of ecosystems for storing and sequestrating carbon in biomass (Map 4.28). The future capacity for global climate regulation was approximated by comparing the capacity for storing and sequestrating carbon with land use-and land management-related pressures in forest ecosystems (Map 4.28).
By overlaying the existing capacity with the forest management pressures, it is possible to identify areas where the current capacity to provide global climate regulating services is under pressure from human land use and land management activities in forests. Areas in darker red colours (in Map 4.29) indicate regions which have a lower potential to contribute to global climate regulation, due to current forest management practices and existing capacities for carbon storage and sequestration.
An aggregation of the final map (ecosystem capacity vs forest management pressures) to administrative units is provided in Map 4.30.
It is recognised that that lower carbon storage and sequestration values in northern Europe are mainly driven by climatic factors. However, forest management practices geared mainly towards forest exploitation are likely to further negatively impact future sequestration capacities in these regions.
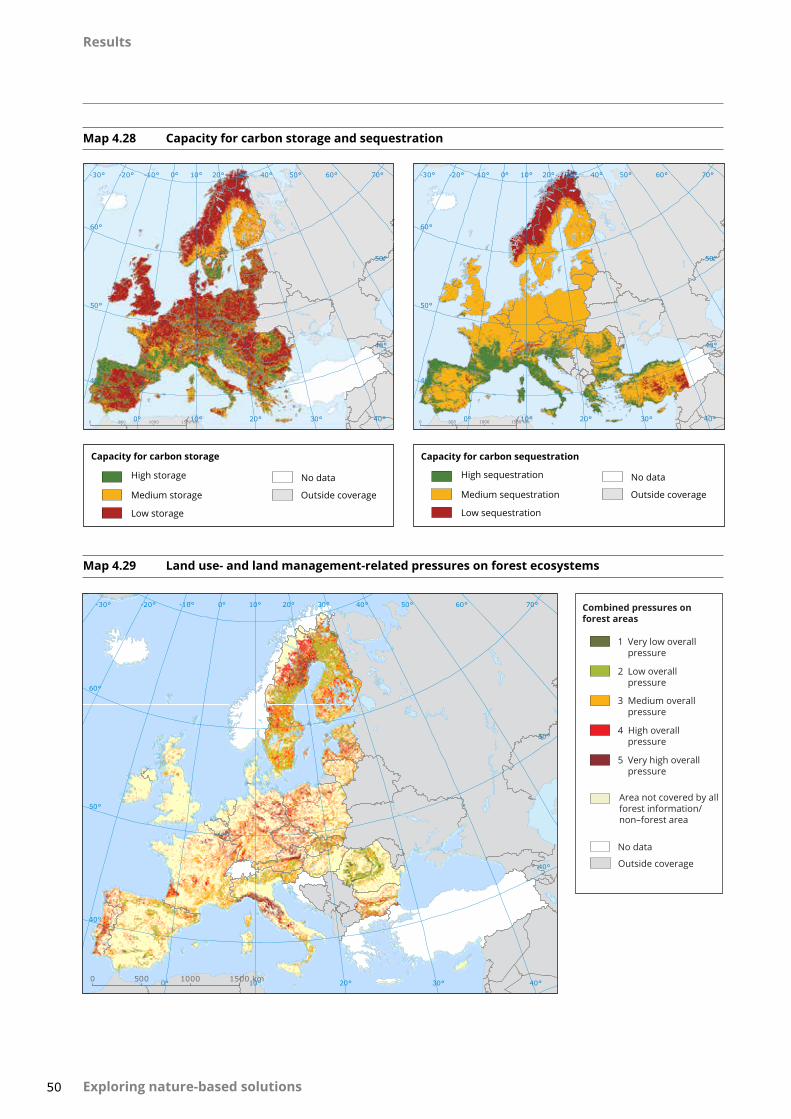
Results
50 Exploring nature-based solutions
Map 4.28 Capacity for carbon storage and sequestration
Map 4.29 Land use- and land management-related pressures on forest ecosystems
70°60°50°
40°
40°
30°20°
20°
10°
10°0°-20°-30°
60°
50°
50°
40°
40°
0 500 1000 1500 km0°
30°-10° Combined pressures onforest areas
1–Very low overall5–pressure
2–Low overall5–pressure
3–Medium overall5–pressure
4 High overall5–pressure
5–Very high overall5–pressure
No data
Outside coverage
Area not covered by allforest information/non–forest area
Capacity for carbon storage Capacity for carbon sequestration
High sequestration No data
Outside coverageMedium sequestration
Low sequestration
High storage No data
Outside coverageMedium storage
Low storage
70°60°50°
40°
40°
30°
30°
20°
20°
10°
10°
0°
0°-10°-20°-30°
60°
50°
50°
40°
40°
0 500 1000 1500 km
70°60°50°
40°
40°
30°
30°
20°
20°
10°
10°
0°
0°-10°-20°-30°
60°
50°
50°
40°
40°
0 500 1000 1500 km

Results
51Exploring nature-based solutions
Ecosystem service flow —Contribution to global climate regulation
1–High contribution
2–Medium contribution
3–Low contribution
No data
4–No forest5–management – pressures
Outside coverage
70°60°
40°
40°
30°20°
20°10°0°-10°-20°-30°
60°
50°
50°
40°
0 500 1000 1500 km0° 10°
50°30°
40°
Map 4.30 Potential GI network based on ecosystem capacity to contribute to global climate regulation, considering management pressures on forests (as a major contributor to carbon storage and sequestration)
Map 4.31 Potential GI network (by administrative region) based on ecosystem capacity to contribute to global climate regulation, considering management pressures on forests (as a major contributor to carbon storage and sequestration)
70°60°
40°
40°
30°20°
20°10°0°-10°-20°-30°
60°
50°
50°
40°
10°0 500 1000 1500 km0°
40°
50°30° Ecosystem service flow —Contribution to globalclimate regulation
1–High contribution
2–Medium contribution
3–Low contribution
No information onclimate regulation(or < 10% of NUTS unitcovered)
No data
Outside coverage

Results
52 Exploring nature-based solutions
4.5.3 Input data and analysis
Ecosystem capacity 'Carbon storage and sequestration'As storage and sequestration of carbon by ecosystems like forests and soil are major factors in global climate regulation, these two indicators were selected for the assessment of potential European GI networks to mitigate global climate change impacts. The carbon storage data set was first adapted to a 1 km raster, and then classified into three capacity classes representing the amount of carbon which is stored in the ecosystem above and below ground.
The sequestration was described as mg m-2 yr-1 in the raster data set. In order to be better comparable to the carbon storage, the values were rescaled to t ha-1 yr-1 and resampled to a raster data set with a resolution of 1 km. Analogous to the carbon storage, the sequestration was ranked into three classes to represent GI capacity (see Table 4.18).
As both carbon storage and sequestration, were assumed to have a mitigating effect on climate change, the information of both was combined and categorised according to their effect. Since sequestration will fix additional carbon, the importance of this process was estimated higher than carbon storage, and was also therefore given more weight in the combination matrix.
Hazard potential 'Pressures on forest ecosystems'The calculated combined capacity value for carbon storage and sequestration was compared with the potential of pressures on forests. Land management-related pressures on forests (Map 4.32) were generated by evaluating the ecosystems' capital accounts (forest harvest compared to growth), the most suitable forest management approach (Hengeveld et al., 2012) in a given region and the pressure arising due to the fragmentation of forest areas.
Table 4.17 Input data
Note: (a) Data source: Figure 8A in Maes, J., Paracchini, M. L., and Zulian, G., 2011, A European assessment of the provision of ecosystem services, JRC Scientific and Technical Reports, Luxembourg: Publications Office of the European Union.
(b) Data source: Figure 9A in Maes, J., Paracchini, M. L., and Zulian, G., 2011, A European assessment of the provision of ecosystem services, JRC Scientific and Technical Reports, Luxembourg: Publications Office of the European Union.
Name Specification
MAES Estimate of above- and below-ground carbon stored in living plant material (a)
0.0833° raster carbon storage t ha-1
Carbon fixation approximated by net ecosystem productivity (b)
916.6 m raster carbon sequestration mg m-2 yr-1
Forest pressure (from ETC task 1.8.4.3: Ecosystem pressures — Land use and land management related pressures in agricultural and forest ecosystems)
1 km raster describing the pressures on European forests
Table 4.18 Carbon storage and carbon sequestration — class definition
Class Capacity carbon storage Capacity carbon sequestration
Low (3) 0–25 t ha-1 0.016479–2.25 t ha-1 yr-1
Medium (2) 25–100 t ha-1 2.25–6.7 t ha-1 yr-1
High (1) 100–130 t ha-1 6.7–15.697465 t ha-1 yr-1

Results
53Exploring nature-based solutions
(8) Please contact the EEA for this document.
Table 4.19 Ecosystem capacity 'Combined carbon storage and carbon sequestration'
Carbon storage
Carbon sequestration
High Medium Low
High 11 12 13
Medium 21 22 23
Low 31 32 33
The result is a five-class assessment of land use- and land management-related pressures on forest areas, defining potential stress on the ecosystem from very low (Class 1) to very high (Class 5). For further information on the assessment of forest pressures, please refer to EEA/ETC SIA 2014 task 1.8.4.3 'Ecosystem pressures – Land use and land management related pressures in agricultural and forest ecosystems' (8).
Ecosystem service flowBy combining the GI capacity for climate change regulation with the pressure on forest ecosystems, the ecosystem service flow is evaluated and classified into three classes respective to the matrix. The two lowest forest pressures classes exert only a very low pressure, and thus have been classified as a 'no impact zone'.
Table 4.20 GI elements
Forest pressures
Capacity 'carbon storage and sequestration'
Very high High Medium Low Very low
High 11 12 13 14 15
Medium 21 22 23 24 25
Low 31 32 33 35 35
1
Best acting GI network
2
Restorable GI network
3
Non-existent but needed natural protection
4
No impact zone under normal conditions

Results
54 Exploring nature-based solutions
Map 4.32 Development of the forest pressure index
70°60°50°
40°
40°
30°
30°
20°
20°
10°
10°
0°
0°-10°-20°-30°
60°
50°
50°
40°
40°
70°60°50°
40°
40°
30°
30°
20°
20°
10°
10°
0°
0°-10°-20°-30°
60°
50°
50°
40°
40°
70°60°50°
40°
40°
30°
30°
20°
20°
10°
10°
0°
0°-10°-20°-30°
60°
50°
50°
40°
40°
0 500 1000 1500 km
0 500 1000 1500 km
0 500 1000 1500 km
1–High growth
2–Medium growth
3–Low growth
No data
Fast track ecosystem capital accounts harvest–growth
Outside coverage
Most suitable forest management
1–High suitability
2–Medium suitability
3–Low suitability
No data
Outside coverage
Forest fragmentation
1–Low fragmentation
2–Medium fragmentation
3–High fragmentation
No data
Outside coverage

55
References
Exploring nature-based solutions
References
Abramovitz, J., 2001, 'Unnatural Disasters', Worldwatch Paper 158, October 2001, Worldwatch Institute, Washington DC, USA (http://www.worldwatch.org/system/files/EWP158.pdf) accessed 9 July 2015.
Acreman, M. C., Harding, R. J., Lloyd, C., McNamara, N. P., Mountford, J. O., Mould, D. J., Purse, P. V., Heard, M. S., Stratford, C. J. and Dury, S. J., 2011, 'Trade-off in ecosystem services of the Somerset Levels and Moors wetlands', Hydrological Sciences Journal, 56(8) 1 543–1 565.
Alfieri, L., Salamon, P., Bianchi, A., Neal, J., Bates, P. and Feyen, L., 2014, 'Advances in pan-European flood hazard mapping', Hydrological Processes, (28) 4 067–4 077.
Alves, F., Roebeling, P., Pinto, P. and Batista, P., 2009, 'Valuing ecosystem service losses from coastal erosion along the central Portuguese coast: a benefits transfer approach', Journal of Coastal Research, (56) 1 169–1 173.
Arthington, A. H., Naiman, R. J., McClain, M. E. and Nilsson C., 2010, 'Preserving the biodiversity and ecological services of rivers: new challenges and research opportunities', Freshwater Biology, (55) 1–16.
Banerjee, S., Secchi, S., Fargione, J., Polasky, S. and Kraft S., 2013, 'How to sell ecosystem services: a guide for designing new markets', Frontiers in Ecology and the Environment, 11(6) 297–304.
Barbier, E. B., 2007, 'Valuing ecosystem services as productive inputs', Economic Policy, (22) 177–229.
Barbier, E. B., Hacker, S. D., Kennedy, C., Koch, E. W., Stier, A. C. and Sillimann, B. R., 2011, 'The value of estuarine and coastal ecosystem services', Ecological Monographs, (81) 169–193.
Barbier, E. B., 2012, 'Progress and challenges in valuing coastal and marine ecosystem services', Review of Environmental Economics and Policy, 6(1) 1–19.
Barbier, E. B., Koch, E. W., Silliman, B. R., Hacker, S. D., Wolanski, E., Primavera, J. H., Granek, E. F., Polasky, S., Aswani, S., Cramer, L. A., Stoms, D. M., Kennedy, C. J., Bael, D., Kappel, C. V., Perillo, G. M. and Reed, D.
J., 2008, 'Coastal ecosystem-based management with nonlinear ecological functions and values', Science, (319) 321–323.
Bullock, A. and Acreman, M. C., 2003, 'The role of wetlands in the hydrological cycle', Hydrology and Earth System Sciences, 7(3) 75–86.
Cameron, R., Blanusa, T., Taylor, J., Salisbury, A., Halstead, A., Henricot, B. and Thompson, K., 2012, 'The domestic garden – its contribution to urban green infrastructure', Urban Forestry and Urban Greening, (11) 129–137.
Carter, J., Cavan, G., Connely, A., Guy, S., Handley, J. and Kazmierczak, A., 2014, 'Climate change and the city: building capacity for urban adaptation', Elsevier, (66), In press.
Cavan, G., Lindley, S., Jalayer, F., Yeshitela, K., Pauleit, S., Renner, F., Gill, S., Capuano, P., Nebebe, A., Woldegerima, T., Kibassa, D. and Shemdoe, R., 2014, 'Urban morphological determinants of temperature regulating ecosystem services in two African cities', Ecological indicators, (42) 43–57.
Christianen, M. J. A., van Belzen, J., Herman, P. M. J., van Katwijk, M. M., Lamers, L. P. M., van Leent, P. J. M. and Boumaet, T. J., 2013, 'Low-canopy seagrass beds still provide important coastal protection services', PLoS ONE, 8(5) e62413.
CICES, 2015, 'CICES: Towards a common classification of ecosystem services', Common International Classification of Ecosystem Services (http://cices.eu/) accessed 9 July 2015.
Costanza, R., Pérez-Maqueo, O., Martinez, M. L., Sutton, P., Anderson, S. J. and Mulder, K., 2008, 'The value of coastal wetlands for hurricane protection', AMBIO, (37) 241–248.
Crozier, M. J., 2010, 'Deciphering the effect of climate change on landslide activity: A review', Geomorphology, (124) 260–267.
References
56 Exploring nature-based solutions
Cruz, A., Benedicto, J. and Gil, A., 2011, 'Socio-economic Benefits of Natura 2000 in Azores Islands — a Case Study approach on the ecosystem services provided by a Special Protected Area', Journal of Coastal Research, (64) 1 955–1 959.
de la Cruz, A. and Benedicto, J., 2009, 'Assessing Socio-economic Benefits of Natura 2000 – a Case Study on the ecosystem service provided by SPA PICO DA VARA / RIBEIRA DO GUILHERME. Output of the project Financing Natura 2000: Cost estimate and benefits of Natura 2000 (Contract No 070307/2007/484403/MAR/B2)' (http://ec.europa.eu/environment/nature/natura2000/financing/docs/azores_case_study.pdf) accessed 9 July 2015.
DeWit, M., Jayiya, T., van Zyl, H., Blignaut, J. and Crookes, D., 2009, 'Methodology to value the natural and environmental resources of the City of Cape Town', Report prepared for the Environmental Resource Management Department, City of Cape Town, May 29.
Dietz, A. J., Wohner, C. and Kuenzer, C., 2012, 'European snow cover characteristics between 2000 and 2011 derived from improved MODIS daily snow cover products', Remote Sensing, 4(8) 2 432–2 454.
EAW, 'European Avalanche Warning Services', European Avalanche Warning Services (http://www.avalanches.org/basics/glossar-en/) accessed 9 July 2015.
EC, 2006, Proposal for a Directive of the European Parliament and of the Council establishing a framework for the soil protection of soil and amending Directive 2004/35/EC (COM (2006)232 2006/0086 (COD), 22.9.2006, 30 pp.) (http://eur-lex.europa.eu/legal-content/EN/TXT/?uri=celex:52006PC0232) accessed 9 July 2015.
EC, 2007, Directive 2007/60/EC of the European Parliament and of the Council of 23 October 2007 on the assessment and management of flood risks (OJ L 288, 6.11.2007, pp. 27–34) (http://eur-lex.europa.eu/legal-content/EN/TXT/?uri=CELEX:32007L0060) accessed 9 July 2015.
EC, 2013a, Communication from the Commission to the European Parliament, the Council, the European Economic and Social Committee and the Committee of the Regions 'Green Infrastructure (GI) — Enhancing Europe's Natural Capital' (COM/2013/0249 final).
EC, 2013b, The EU strategy on adaptation to climate change: Strengthening Europe's resilience to the impacts of climate change, European Commission and Directorate-General for Climate Action (http://ec.europa.eu/clima/
publications/docs/eu_strategy_en.pdf) accessed 9 July 2015.
EC, 2014, Mapping and Assessment of Ecosystems and their Services – Indicators for ecosystem assessments under Action 5 of the EU Biodiversity Strategy to 2020, European Commission, Directorate-General for the Environment, Publications Office of the European Union (http://ec.europa.eu/environment/nature/knowledge/ecosystem_assessment/pdf/2ndMAESWorkingPaper.pdf) accessed 9 July 2015.
EC, 2015, 'JRC — European Soil Portal – Soil Data and Information Systems — Soil Themes — Landslides', Joint Research Centre (http://eusoils.jrc.ec.europa.eu/library/themes/LandSlides/index.html#ELSUS) accessed 9 July 2015.
EDENext, 'JRC Flood return rate projections 2 and 100 year return rates for 2000/25/35/85' (http://www.edenextdata.com/?q=content/jrc-flood-return-rate-projections-2-and-100-year-return-rates-2000253585) accessed 9 July 2015.
EEA, 2006, Urban sprawl in Europe — The ignored challenge, EEA Report No 10/2006, European Environment Agency (http://www.eea.europa.eu/publications/eea_report_2006_10) accessed 10 July 2015.
EEA, 2010a, Mapping the impacts of natural hazards and technological accidents in Europe, EEA Technical report No 13/2010, European Environment Agency.
EEA, 2010b, The European Environment: State and Outlook 2010 — Urban environment, State of the environment report No 1/2010, European Environment Agency (http://www.eea.europa.eu/soer/synthesis/synthesis) accessed 10 July 2015.
EEA, 2011a, Green infrastructure and territorial cohesion - The concept of green infrastructure and its integration into policies using monitoring systems, EEA Technical report No 18/2011, European Environment Agency (http://www.eea.europa.eu/publications/green-infrastructure-and-territorial-cohesion) accessed 10 July 2015.
EEA, 2011b, Mapping the impacts of natural hazards and technological accidents in Europe — An overview of the last decade, EEA Technical report No 13/2010 (http://www.eea.europa.eu/publications/mapping-the-impacts-of-natural) accessed 10 July 2015.
EEA, 2012a, Climate change, impacts and vulnerability in Europe, EEA Report No 12/1012, European Environment Agency.

References
57Exploring nature-based solutions
EEA, 2012b, Challenges and opportunities for cities together with supportive national and European policies, EEA Report No 2/2012, European Environment Agency (http://www.eea.europa.eu/publications/urban-adaptation-to-climate-change) accessed 10 July 2015.
EEA, 2014, Spatial analysis of green infrastructure in Europe, EEA Technical report No 2/2014, European Environment Agency (http://www.eea.europa.eu/publications/spatial-analysis-of-green-infrastructure) accessed 10 July 2015.
EEA, 2015, 'Mapping and assessing ecosystems', in preparation.
Elkin, C., Gutiérrez, A. G., Leuzinger, S. et al., 2013, 'A 2°C warmer world is not safe for ecosystem services in the European Alps', Global Change Biology, (19) 1 827–1 840.
ENTRIX, 2010, 'Portland's Green Infrastructure: Quantifying the Health, Energy, and Community Livability Benefits', Report for the City of Portland Bureau of Environmental Services (http://www.portlandoregon.gov/bes/article/298042) accessed 9 July 2015.
ESPON, 2012, 'Update of Maps and Related Data on Natural Hazards', European Spatial Planning Observation Network (http://www.espon.eu/main/Menu_Projects/Menu_ScientificPlatform/Menu_MapUpdates/Natural_Hazards.html) accessed 9 July 2015.
Feyen, L., Dankers, R., Bodis, K., Salamon, P. and Barredo, J. I., 2012, 'Fluvial flood risk in Europe in present and future climates', Climatic Change, 112(1) 47–62 (http://cordis.europa.eu/docs/results/265/265213/final1-epi-water-262513-final-report-ok.pdf and http://link.springer.com/article/10.1007/s10584-011-0339-7) accessed 10 July 2015.
Fokkens, B., 2007, 'The Dutch strategy for safety and river flood prevention', in: Extreme Hydrological Events: New Concepts for Security, NATO Science Series 78, pp. 337–352 (http://link.springer.com/chapter/10.1007%2F978-1-4020-5741-0_23) accessed 10 July 2015.
Foster, J., Lowe, A. and Winkelman, S., 2011, 'The value of green infrastructure for urban climate adaptation', The Center for Clean Air Policy, Washington, DC 20002.
Gantioler, S., ten Brink, P., Rayment, M., Bassi, S., Kettunen, M. and McConville, A., 2010, 'Financing Natura 2000 — Financing needs and socio-economic benefits resulting from investment in the network', Background Paper for the Conference on 'Financing Natura 2000', 15-16 July 2010, DG Environment Contract
ENV.B.2/SER/2008/0038, Institute for European Environmental Policy (IEEP)/GHK/Ecologic, Brussels (http://www.ecologic-events.de/natura2000/documents/FinancingNatura2000ConferenceBackgroundPaper_FINAL.pdf) accessed 9 July 2015..
Gómez-Baggethun, E. and Barton, D. N., 2013, 'Classifying and valuing ecosystem services for urban planning', Ecological Economics, (86) 235–245.
Gottfried, M., Pauli, H., Futschik, A. et al., 2012, 'Continent-wide response of mountain vegetation to climate change', Nature Climate Change, (2) 111–115.
Gremli, R., Keller, B., Sepp, T. and Szönyi, M., 2013, 'European floods: using lessons learned to reduce risks', Zurich Insurance Group, 10 pp.
Gren, I.-M., Groth, K.-H. and Sylvén, M., 1995, 'Economic Values of Danube Floodplains', Journal of Environmental Management, (45) 333–345.
Grêt-Regamey, A., Bebi, P., Bishop, I. D. and Schmid, W. A., 2008a, 'Linking GIS-based models to value ecosystem services in an Alpine region', Journal of Environmental Management, (89) 197–208.
Grêt-Regamey, A., Walz, A. and Bebi, P., 2008b, 'Valuing Ecosystem Services for Sustainable Landscape Planning in Alpine Regions', Mountain Research and Development, 28(2) 156–165.
Grêt-Regamey, A., Brunner, S. H., Altwegg, J. and Bebi, P., 2013a, 'Facing uncertainty in ecosystem services-based resource management', Journal of Environmental Management, (127) 145–154.
Grêt-Regamey, A., Brunner, S. H., Altwegg, J., Christen, M. and Bebi, P., 2013b, 'Integrating expert knowledge into mapping ecosystem services trade-offs for sustainable forest management', Ecology and Society, 18(3) 34.
Grygoruk, M., Mirosław-Świątek, D., Chrzanowska, W. and Ignar, S., 2013, 'How Much for Water? Economic Assessment and Mapping of Floodplain Water Storage as a Catchment-Scale Ecosystem Service of Wetlands', Water, (5) 1 760–1 779.
Günther, A., Hervás, J., Van Den Eeckhaut, M., Malet, J.-P. and Reichenbach, P., 2014, Synoptic pan-European landslide susceptibility assessment: The ELSUS 1000 v1 map' in: Sassa, K., Canuti, P. and Yin, Y. (eds), Landslide Science for a Safer Geoenvironment, Springer, Switzerland, Vol. 1, pp. 117–122 (http://link.springer.com/chapter/10.1007/978-3-319-04999-1_12) accessed 9 July 2015.

References
58 Exploring nature-based solutions
Hengeveld, G. M., G.-J. Nabuurs, M. Didion, I. Van den Wyngaert, A. P. P. M. Clerkx, and M.-J. Schelhaas, 2012, 'A forest management map of European forests', Ecology and Society, 17(4) 53 (http://dx.doi.org/10.5751/ES-05149-170453) accessed 10 July 2015.
Hopkinson, C. S., Lugo, A. E., Alber, M., Covich, A. P. and Van Bloem, S. K., 2008, 'Forecasting effects of sea-level rise and windstorms on coastal and inland ecosystems', Frontiers in Ecology and the Environment, 6(5) 255–263.
Huggel, C., Clague, J. J. and Korup, O., 2012, 'Is climate change responsible for changing landslide activity in high mountains?', Earth Surface Processes and Landforms, (37) 77–91.
Hunter, A., Williams, N., Rayner, J., Aye, L., Hes, D. and Livesley, S., 2014, 'Quantifying the thermal performance of green facades', Ecological Engineering, (63) 102–113.
Hussain, S. S., Winrow-Giffin, A., Moran, D., Robinson, L. A., Fofana, A., Paramor, O. A. L. and Frid, C. L. J., 2010, 'An ex ante ecological economic assessment of the benefits arising from marine protected areas designation in the UK', Ecological Economics, (69) 828–838.
Huttenlau, M., Stotter, J. and Stiefelmeyer, H., 2010, 'Risk-based damage potential and loss estimation of extreme flooding scenarios in the Austrian Federal Province of Tyrol', Natural Hazards and Earth Systems Science, (10) 2 451–2 473.
IEEP and Milieu, 2013, The Guide to Multi-Benefit Cohesion Policy Investments in Nature and Green Infrastructure, (Hjerp, P., ten Brink, P., Medarova-Bergstrom, K., Mazza, L. and Kettunen, M. of the Institute for European Environmental Policy, and McGuinn, J., Banfi, P. and Hernández, G. of Milieu), A Report for the European Commission, Brussels (http://ec.europa.eu/regional_policy/en/information/publications/guides/2013/guide-to-multi-benefit-cohesion-policy-investments-in-nature-and-green-infrastructure) accessed 9 July 2015.
IPCC, 2012, Managing the Risks of Extreme Events and Disasters to Advance Climate Change Adaptation, A Special Report of Working Groups I and II of the Intergovernmental Panel on Climate Change, Field, C. B., V. Barros, T. F. Stocker, D. Qin, D. J. Dokken, K. L. Ebi, M. D. Mastrandrea, K. J. Mach, G.-K. Plattner, S. K. Allen, Tignor, M. and Midgley, P.M. (eds), Intergovernmental Panel on Climate Change, Cambridge University Press, Cambridge, UK, and New York, NY, USA, 582 pp. (http://ipcc-wg2.gov/SREX/report) accessed 9 July 2015.
IPCC, 2014, 'Summary for policymakers', in: Field, C. B., V. R. Barros, D. J. Dokken, K. J. Mach, M.D. Mastrandrea,
T. E. Bilir, M. Chatterjee, K. L. Ebi, Y. O. Estrada, R. C. Genova, B. Girma, E. S. Kissel, A. N. Levy, S. MacCracken, P. R. Mastrandrea, and White, L. L. (eds), Climate Change 2014: Impacts, Adaptation, and Vulnerability. Part A: Global and Sectoral Aspects. Contribution of Working Group II to the Fifth Assessment Report of the Intergovernmental Panel on Climate Change, Cambridge University Press, Cambridge, United Kingdom and New York, NY, USA, pp. 1–32.
Jongman, B., Hochrainer-Stigler, S., Feyen, L., Aerts, J. C. J. H., Mechler, R., Botzen, W. J. W. and Ward, P. J., 2014, 'Increasing stress on disaster-risk finance due to large floods', Nature Climate Change, (4) 264–268. doi:10.1038/nclimate2124.
JRC, 2015, 'Forest Mapping', Joint Research Centre (http://forest.jrc.ec.europa.eu/activities/forest-mapping/) accessed 9 July 2015.
Koch, EW, Barbier, E. B., Silliman B. R., Reed D. J., Perillo, G. M., Hacker, S. D., Granek, E. F. J, Primavera, J. H., Muthiga, N., Polasky, S., Halpern, B. S., Kennedy, C. J., Kappel, C. V. and Wolanski, E., 2009, 'Non-linearity in ecosystem services: temporal and spatial variability in coastal protection', Frontiers in Ecology and the Environment, 7 (1) 29–37.
Kryžanowski, A., Brilly, M., Rusjan, S. and Schnabl, S., 2014, 'Review Article: Structural flood-protection measures referring to several European case studies', Natural Hazards and Earth Systems Science, (14) 135–142.
Kumar P, Imam B., 2013, 'Footprints of air pollution and changing environment on the sustainability of built infrastructure', Science of the Total Environment, (444) 85–101.
Lau, W. W. Y., 2013, 'Beyond carbon: Conceptualizing payments for ecosystem services in blue forests on carbon and other marine and coastal ecosystem services', Ocean and Coastal Management, (83) 5–14.
Liquete et al., 2013a, 'Assessment of coastal protection as an ecosystem service in Europe', Ecological Indicators, (30) 205–217, (http://dx.doi.org/10.1016/j.ecolind.2013.02.013) accessed 9 July 2015.
Liquete, C., Piroddi, C., Drakou, E. G., Gurney, L., Katsanevakis, S., Charef, A. and Egoh, B., 2013b, 'Current status and future prospects for the assessment of marine and coastal ecosystem services: A Systematic Review', PLoS ONE, 8(7) e67737.
Londoño Cadavid, C. and Ando, A. W., 2013, 'Valuing preferences over stormwater management outcomes

References
59Exploring nature-based solutions
including improved hydrologic function', Water Resources Research, (49) 4 114–4 125.
Luisetti T., Turner R. K., Bateman I. J., Morse-Jones S., Adams C. and Fonseca, L., 2011, 'Coastal and marine ecosystem services valuation for policy and management: Managed realignment case studies in England', Ocean and Coastal Management, (54) 212e224.
Maes, J., Paracchini, M. L., and Zulian, G., 2011, A European assessment of the provision of ecosystem services, JRC Scientific and Technical Reports, Luxembourg: Publications Office of the European Union.
Maltby, E., 2010, 'Effects of climate change on the societal benefits of UK upland peat ecosystems: applying the ecosystem approach', Climate Research, (45) 249–259.
Martínez-Paz, J. M., Perni, A. and Martínez-Carrasco, F., 2013, 'Assessment of the programme of measures for coastal lagoon environmental restoration using cost–benefit analysis', European Planning Studies, 21(2) 131–148.
McCain, C. M. and Colwell, R. K., 2011, 'Assessing the threat to montane biodiversity from discordant shifts in temperature and precipitation in a changing climate', Ecology Letters, (14) 1 236–1 245.
Mittman, T., Kloss, C., Katzenmoyer, C., Gallet, D., Morse, S., Nichols, K., Belan, G., Deardorff, L., Frey, M. and Kosco J., 2014, 'The economic benefits of green infrastructure, a case study of Lancaster, PA', US Environmental Protection Agency (EPA) Green Infrastructure Technical Assistance Program, Lancaster (http://water.epa.gov/infrastructure/greeninfrastructure/upload/CNT-Lancaster-Report-508.pdf) accessed 9 July 2015.
Mori, K., 2010, 'Can we avoid overdevelopment of river floodplains by economic policies? A case study of the Ouse catchment (Yorkshire) in the UK', Land Use Policy, (27) 976–982.
Mori, K. and Perrings, C., 2012, 'Optimal management of the flood risks of floodplain development', Science of the Total Environment, (431) 109–121.
Morris, J., Hess, T. and Posthumus, H., 2010, Agriculture's Role in Flood Adaptation and Mitigation: Policy Issues and Approaches, in: OECD, Sustainable Management of Water Resources in Agriculture, OECD Publishing (http://www.oecd.org/tad/sustainable-agriculture/sustainablemanagementofwaterresourcesinagriculture.htm#background_reports) accessed 10 July 2015.
Morsch, A., 2010, 'A Climate Change Vulnerability and Risk Assessment for the City of Atlanta, Georgia', Doctoral dissertation, Nicholas School of the Environment of Duke University.
Naumann, S., Davis, M., Kaphengst, T., Pieterse, M., and Rayment, M., 2010, 'Design, implementation and cost elements of Green Infrastructure projects', Final report to the European Commission, DG Environment.
Nelson, E. J. et al., 2013, 'Climate change's impact on key ecosystem services and the human well-being they support in the US', Front Ecol Environ, 11(9) 483–493.
O'Gorman, P. A., 2014, 'Contrasting responses of mean and extreme snowfall to climate change', Nature, (512) 416-418.
Olschewski, R., Bebi, B. and Teich, M. et al., 2012, 'Avalanche protection by forests — A choice experiment in the Swiss Alps', Forest Policy and Economics, (17) 19–24.
O'Riordan, T., Nicholson-Cole, S. A. and Milligan, J., 2008, 'Designing sustainable coastal futures', Twenty-First Century Society, 3(2) 145–157.
Orth, R. J., Carruthers, T. J. B., Dennison, W. C., Duarte, C. M., Fourqurean, J. W., Heck, K. L., Hughes, A. R., Kendrick, G. A., Kenworthy, W. J., Olyarnik, S., Short, F. T., Waycott, M. and Williams, S. L., 2006, 'A global crisis for seagrass ecosystems', Bioscience, 56(12) 987–996.
Pithart, D., Křováková, K., Žaloudík, J., Dostál, T., Valentová, J., Valenta, P., Weyskrabová, J. and Duše, J., 2010, 'Ecosystem services of natural floodplain segment - Lužnice River, Czech Republic', Flood Recovery, Innovation and Response II, Book Series: WIT Transactions on Ecology and the Environment, (133) 129–139.
Reckendorfer, W., Funk, A., Gschöpf, C., Hein, T. and Schiemer, F., 2013, 'Aquatic ecosystem functions of an isolated floodplain and their implications for flood retention and management', Journal of Applied Ecology (50) 119–128.
Roebeling, P. C., Costa, L., Magalhães-Filho, L. and Tekken, V., 2013, 'Ecosystem service value losses from coastal erosion in Europe: historical trends and future projections', Journal of Coastal Conservation, (17) 389–395.
Rouquette, J. R., Posthumus, H., Gowing, D. J. G., Tucker, G. and Dawson, Q. L., Hess T. M., Morris J., 2009, 'Valuing nature-conservation interests on agricultural floodplains', Journal of Applied Ecology, 46 (2) 289–296.
References
60 Exploring nature-based solutions
Rouquette, J. R., Posthumus, H., Morris, J., Hess, T. M., Dawson, Q. L. and Gowing, D. J. G., 2011, 'Synergies and trade-offs in the management of lowland rural floodplains: an ecosystem services approach', Hydrological Sciences Journal, 56(8) 1 566–1 581.
Ruckelshaus, M., Doney, S. C., Galindo, H. M., Barry, J. P., Chan, F., Duffy, J. E., English, C. A., Gaines, S. D., Grebmeier, J. M., Hollowed, A. B., Knowlton, N., Polovina, J., Rabalais, N. N., Sydeman, W. J. and Talley, L. D., 2013, 'Securing ocean benefits for society in the face of climate change', Marine Policy, (40) 154–159.
Salmonidi, M., Katsanevakis, S., Borja, A., Braeckman, U., Damalas, D., Galparsoro, I., Mifsud, R., Mirto, S., Pascual, M., Pipitone, C., Rabaut, M., Todorova, V., Vassililopoulou, V. and Vega Fernandez, T., 2012, 'Assessment of goods and services, vulnerability, and conservation status of European seabed biotopes: a stepping stone towards ecosystem-based marine spatial management', Mediterranean Marine Science, (13) 49–88.
Sanon, S., Hein, T., Douven, W. and Winkler, P., 2012, 'Quantifying ecosystem service trade-offs: The case of an urban floodplain in Vienna, Austria', Journal of Environmental Management, (111) 159–172.
Schindler, S., Sebesvari, Z., Damm, C., Euller, K., Mauerhofer, V., Hermann, A., Biró, M., Essl, F., Kanka, R., Lauwaars, S. G., Schulz-Zunkel, C., van der Sluis, T., Kropik, M., Gasso, V., Krug, A., Pusch, M., Zulka, K. P., Lazowski, W., Hainz-Renetzeder, C., Henle, K. and Wrbka, T., 2014, 'Multifunctionality of floodplain landscapes: relating management options to ecosystem services', Landscape Ecology, 29(2), 229–244.
Schneider, C., Laize, C. L. R., Acreman, M. C. and Florke, M., 2013, 'How will climate change modify river flow regimes in Europe?', Hydrology and Earth System Sciences, 17(1) 325–339.
Scholz, M., Mehl, D., Schulz-Zunkel, C., Kasperdius, H. D., Born, W. and Henle, K., 2012, 'Ökosystemfunktionen von Flussauen', Analyse und Bewertung von Hochwasserretention, Nährstoffrückhalt, Kohlenstoffvorrat, Treibhausgasemissionen und Habitatfunktion, Naturschutz und Biologische Vielfalt, 124(2).
Schweizer, J. and Jamieson, J. B., 2000, 'Field observations of skier-triggered avalanches', Proceedings International Snow Science Workshop, Big Sky, Montana, USA, 2–6 October 2000.
Schäffler, A. and Swilling, M., 2013, 'Valuing green infrastructure in an urban environment under pressure
— The Johannesburg case', Ecological Economics, (86) 246–257.
Smith, K., 2013, Environmental Hazards: Assessing Risk and Reducing Disaster, 6th edition, Routledge, Oxon, UK.
Shepard, C. C., Crain, C. M. and Beck, M. W., 2011, 'The protective role of coastal marshes: A systematic review and meta-analysis', PLoS ONE, 6(11) e27374.
Spalding, M. D., McIvor, A. L., Beck, M. W., Koch, E. W., Möller, I., Reed, D. J., Rubinoff, P., Spencer, T., Tolhurst, T. J., Wamsley, T. V., van Wesenbeeck, B. K., Wolanski, E. and Woodroffe, C. D., 2014a, 'Coastal Ecosystems: A Critical Element of Risk Reduction', Conservation Letters, (7) 293–301.
Spalding, M. D., Ruffo, S., Lacambra, C., Meliane, I., Zeitlin Hale, L., Shepard, C. C. and Beck, M. W., 2014b, 'The role of ecosystems in coastal protection: Adapting to climate change and coastal hazards', Ocean and Coastal Management, (90) 50e57.
Stokes, A., Douglas, G. B., Fourcaud, T., Giadrossich, F., Gillies, C., Hubble, T., Kim, J. H., Loades, K. W., Mao, Z., McIvor, I. R., Mickovski, S. B., Mitchell, S., Osman, N., Phillips, C., Poesen, J., Polster, D., Preti, F., Raymond, P., Rey, F., Schwarz, M. and Walker, L. R., 2014, 'Ecological mitigation of hillslope instability: ten key issues facing researchers and practitioners', Plant and Soil, (377) 1–23.
Stokes, A., Raymond, P., Polster, D., Mitchell, S. J., 2013, 'Engineering the ecological mitigation of hillslope stability research into the scientific literature', Ecological Engineering, (61) 615–620.
Stolton, S., Dudley, N. and Randall, J., 2008, 'Natural Security: Protected areas and hazard mitigation', Arguments for Protection, No 5, World Wide Fund for Nature (WWF), Gland (Switzerland) (http://awsassets.panda.org/downloads/natural_security_final.pdf) accessed 9 July 2015.
Stürck, J., Poortinga, A. and Verburg, P. H., 2014, 'Mapping ecosystem services: The supply and demand of flood regulation services in Europe', Ecological Indicators, (38) 198–211.
Tiwary, A. and Kumar, P., 2014, 'Impact evaluation of green-grey infrastructure interaction on built-space integrity: an emerging perspective to urban ecosystem service', Science of the Total Environment, (487) 350–360.
Tockner, K. and Stanford, J. A., 2002, 'Riverine flood plains: present state and future trends', Environmental Conservation, (29) 308–330.
References
61Exploring nature-based solutions
Turner, R. K., Burgess, D., Hadley, D., Coombes, E. and Jackson, N., 2007, 'A cost–benefit appraisal of coastal managed realignment policy', Global Environmental Change, (17) 397–407.
UNISDR, 2009, Terminology on Disaster Risk Reduction, UN Office for Disaster Risk reduction (UNISDR), Geneva, Switzerland (http://www.unisdr.org/files/7817_UNISDRTerminologyEnglish.pdf) accessed 9 July 2015.
UNISDR, 2015, Making Development Sustainable: The Future of Disaster Risk Management, Global Assessment Report on Disaster Risk Reduction, Geneva, Switzerland: United Nations Office for Disaster Risk Reduction (UNISDR).
Van Loon-Steensma, J. M. and Vellinga, P., 2013, 'Trade-offs between biodiversity and flood protection services of coastal salt marshes', Current Opinion in Environmental Sustainability, (5) 320–326.
Van Slobbe, E., de Vriend, H. F., Aarninkhof, S., Lulofs, K., de Vries, M. and Dircke, P., 2013, 'Building with Nature:
in search of resilient storm surge protection strategies', Natural Hazards, (65) 947–966.
Verhoeven, J. T. A., 2014, 'Wetlands in Europe: Perspectives for restoration of a lost paradise', Ecological Engineering, (66) 6–9.
Wheater, H. and Evans, E., 2009, 'Land use, water management and future flood risk', Land Use Policy, (26:1) S251–S264 (http://www.sciencedirect.com/science/article/pii/S0264837709001082) accessed 10 July 2015.
Young, R., 2010, 'Managing municipal green space for ecosystem services', Urban Forestry and Urban Greening, (9) 313–321.
Zorrilla-Miras, P., Palomo, I., Gómez-Baggethun, E., Martín-López, B., Lomas, P. L. and Montes, C., 2014, 'Effects of land-use change on wetland ecosystem services: A case study in the Doñana marshes (SW Spain)', Landscape and Urban Planning, (122) 160–174.


European Environment Agency
Exploring nature-based solutionsThe role of green infrastructure in mitigating the impacts of weather- and climate change-related natural hazards
2015 — 61 pp. — 21 x 29.7 cm
ISBN 978-92-9213-693-2doi:10.2800/946387
HOW TO OBTAIN EU PUBLICATIONS
Free publications:
• one copy: via EU Bookshop (http://bookshop.europa.eu);
• more than one copy or posters/maps: from the European Union's representations (http://ec.europa.eu/represent_en.htm); from the delegations in non-EU countries (http://eeas.europa.eu/delegations/index_en.htm); by contacting the Europe Direct service (http://europa.eu/europedirect/index_en.htm) or calling 00 800 6 7 8 9 10 11 (freephone number from anywhere in the EU) (*).
(*) The information given is free, as are most calls (though some operators, phone boxes or hotels may charge you).
Priced publications:
• via EU Bookshop (http://bookshop.europa.eu).

European Environment AgencyKongens Nytorv 61050 Copenhagen KDenmark
Tel.: +45 33 36 71 00Web: eea.europa.euEnquiries: eea.europa.eu/enquiries
TH-AK-15-012-EN
-Ndoi:10.2800/946387