exploring molecular links between lymph node invasion and cancer prognosis in human breast cancer
TRANSCRIPT

PROCEEDINGS Open Access
Exploring molecular links between lymph nodeinvasion and cancer prognosis in human breastcancerSangwoo Kim1,2, Hojung Nam3, Doheon Lee1*
From 22nd International Conference on Genome InformaticsBusan, Korea. 5-7 December 2011
Abstract
Background: Lymph node invasion is one of the most powerful clinical factors in cancer prognosis. However,molecular level signatures of their correlation are remaining poorly understood. Here, we propose a new approach,monotonically expressed gene analysis (MEGA), to correlate transcriptional patterns of lymph node invasion relatedgenes with clinical outcome of breast cancer patients.
Results: Using MEGA, we scored all genes with their transcriptional patterns over progression levels of lymph nodeinvasion from 278 non-metastatic breast cancer samples. Applied on 65 independent test data, our gene sets oftop 20 scores (positive and negative correlations) showed significant associations with prognostic measures such ascancer metastasis, relapse and survival. Our method showed better accuracy than conventional two classcomparison methods. We could also find that expression patterns of some genes are strongly associated withstage transition of pathological T and N at specific time. Additionally, some pathways including T-cell immuneresponse and wound healing serum response are expected to be related with cancer progression from pathwayenrichment and common motif binding site analyses of the inferred gene sets.
Conclusions: By applying MEGA, we can find possible molecular links between lymph node invasion and cancerprognosis in human breast cancer, supported by evidences of feasible gene expression patterns and significantresults of meta-analysis tests.
BackgroundThe presence of lymph node invasion is one of thestrongest indicators for prognoses of distant metastasisand survival in most cancers [1,2]. In the multi-step pro-cess of cancer metastasis development, invasion into avascular or a lymphatic system has generally beenbelieved to be a key step of tumor cell dissemination[3-5]. Once tumor cells acquire abilities of intravasationand survival in an unfavorable vascular environment,they circulate around the whole body parts to form newtumors at the secondary site [6]. While the exactmechanisms of cancer metastasis through blood vessels
and lymph nodes are still being studied, it is necessaryto explain the processes in a genetic level as a key factorof cancer patients’ prognosis.Many researchers have devoted their efforts to under-
stand lymph node invasion in breast cancers, becauseregional lymph nodes are frequently observed as thefirst site of metastasis [7]. Survival analyses with clinicalfeatures showed that lymph node status is generallymarked as a top significant factor among conventionalclinical features [8-10]. Studies of finding molecularmarkers using genome-wide expression profiles identi-fied various genetic signatures for prediction of lymphnode and distant metastasis [11-19]. However, the asso-ciations between conventional clinical features includingtumor size, lymph node involvement and distant metas-tasis (TNM staging [20]) and prognosis are not yet
* Correspondence: [email protected] of Bio and Brain Engineering, KAIST, 373-1 Guseong-dong,Yuseong-gu, Daejeon, 305-701, Republic of KoreaFull list of author information is available at the end of the article
Kim et al. BMC Systems Biology 2011, 5(Suppl 2):S4http://www.biomedcentral.com/1752-0509/5/S2/S4
© 2011 Kim et al; licensee BioMed Central Ltd. This is an open access article distributed under the terms of the Creative CommonsAttribution License (http://creativecommons.org/licenses/by/2.0), which permits unrestricted use, distribution, and reproduction inany medium, provided the original work is properly cited.

identified in a genetic level. Moreover, the existence of acommon gene set for lymph node metastasis in a tran-scriptional level is unclear [21].So far, t-test based differential expression analysis or
clustering methods between lymph node negative andpositive samples have been used to detect correspondinggene sets [17-19,21]. Although these methods arestraightforward and intuitive, there are several inherentproblems in them. First, direct comparison within twoclasses (lymph node negatives and positives) may sim-plify the subtle changes over cancer progression.Usually, four-stage pathological N (N0~N3) is used toindicate the degree of lymph node invasion in breastcancer; N0 denotes no lymph node invasion observed.Regarding the expression values as longitudinal data tofind patterns over lymph node progression might benefitfrom utilizing known biomedical information. Forinstance, a gene whose expression is significantly highonly at a certain stage (e.g. N2) is hardly accepted as aclosely related gene from current metastasis model.However, a two-class comparison (e.g. N0 vs. others)would mark it differently expressed. Second, the effectof a factor (e.g. lymph node invasion) should be sepa-rated from the effect of the others (e.g. tumor size orhistological subtype). These factors are generally notindependent and will lead to false findings unless care-fully analysed. And, the validation of inferred gene sig-natures should be performed on sufficient number ofindependent sets in a strict statistical manner. The datastatistics and characteristics including inherent biasesshould be recognized, appropriately treated and be prop-erly analyzed in a meta-analytic way.There are several statistical models applicable for mul-
tivariate correlation scoring (instead of two-class basedscoring). Linear/Non-linear (multiple) regression andanalysis of variance models (two-way ANOVA andMANOVA) have been widely used in various fields.Both models (linear and non-linear), however, have afew weaknesses; a gene expression pattern over lymphnode progression is not necessarily linear, and the datahas too few time points to be assessed in a non-linearway. ANOVA models are usually used to test if there isa significant difference among the mean values, so it isnot robust to inconsistent fluctuations of expressionvalues. In time series analyses, autoregressive movingaverage model and its variants (ARMA, ARMAX andARIMA) are widely used especially in electronic engi-neering and system identification fields, and some unitroot tests (for stationarity test in time series includingAugmented Dickey Fuller test [22]) have been used instatistics and econometrics as well. However, there are afew difficulties in adapting these models to our problem;the number of time points is very few, intervals are notregular and the stage is a pseudo-time. After reviewing
the conventional models, we developed a new multivari-ate correlation measure specially designed for non-linearand small data point analysis. Nevertheless, the conven-tional models were applied as well and tested to com-pare with our measure and two-class based analyses.Our method, monotonically expressed gene analysis
(MEGA), scores gene expression patterns with theirnon-linear monotonicity over a stage progression ofinterest. It accumulates all the normalized expressionaldifferences between two consecutive stages (see Meth-ods). If the direction of expressional change is consis-tently positive or negative, the score increases;otherwise, the sum of differences will be cancelled out.Because there are two non-independent factors (stage Tand N), one variable should be fixed while the othervariable is being used. In MEGA, a two dimensionalmatrix is constructed, each dimension of which is com-posed of four points (N0~N3 and T1~T4, T0 isexcluded due to the lack of data) generating totally 16data points per a gene. So, applying the scoring functionto each row or column represents calculating the cumu-lative expressional changes over one factor while theother is fixed. MEGA also has a weight parameter toemphasize a specific stage transition (e.g. N1® N2) tocapture genes activated or repressed in a particular timerange. After calculating scores, top k genes are collectedand named N-wise monotonically expressed genes (N-MEG) or T-wise monotonically expressed genes (T-MEG) depending on which factor is used for the analy-sis. Validation of inferred gene sets can be done in a ret-rospective way to see how accurately the gene setsclassify prognostic outcomes in other independent data.P-values from each test data are integrated by meta-ana-lysis to report more confident accuracy of the gene sets.This is basically one of the most unbiased ways for eval-uating usefulness of inferred gene signatures.If the gene sets show consistence and confident accu-
racy, a series follow-up analysis can be used for reason-ing biological meaning (e.g. common pathways ortranscription factors). First, gene set analysis can dis-cover some biological pathways involving in metastasisprogression. Considering pathways instead of individualgenes as an acting unit of biological phenomenaexplains how different gene sets are sometimes asso-ciated with same conditions. And we can find more suc-cinct way to describe the whole processes. Second, thefact that the genes show similar expression patterns asthe cancer metastasis progresses leads us to a hypothesisthat some common transcription factors play a crucialrole in the process. Here, all the genes are not necessa-rily causative; rather, they are effect from changes of afewer number of genes in upper hierarchy. In this case,finding frequently represented motifs from the promoterregions of the gene sets might be a good analysis for
Kim et al. BMC Systems Biology 2011, 5(Suppl 2):S4http://www.biomedcentral.com/1752-0509/5/S2/S4
Page 2 of 14

discovering the transcription factors. This would bemore powerful information in practical applicationssuch as pharmaceutical research and patient treatment.
ResultsTotally four gene sets of size 20 are constructed from278 breast tumor gene expression data (expO database)by applying monotonically expressed gene analysis(MEGA). They are N-wise monotonically expressedgenes (N-MEG) and T-wise monotonically expressedgenes (T-MEG), which are further divided into positiveand negative correlation sets. Given these four gene sets(N-MEG+, N-MEG-, T-MEG+, and T-MEG-), we testedon65 independent breast cancer prognosis data setsdownloaded from ONCOMINE database (See Methodsfor details) how much the expression values of thegenes are correlated with prognostic outcomes.
Lymph node-wise monotonically expressed genes (N-MEG)The result of meta-analysis test with N-MEG+ and N-MEG- is shown in Figure 1. Two gene sets are dividedby the vertical separator. Three major analysis types(PRG, STG, and GRD) and seven minor analysis typesare denoted in the first and second columns. Each rowcorresponds to an experiment and each column corre-sponds to a gene. So a value in a cell is a p-value of agene in the corresponding experiment. Cells are coloredblue when the genes are significantly up-regulated at thestudy, yellow when down-regulated, black when not sig-nificantly regulated, and grey when the genes could notbe found in the corresponding experiments; here, up-regulation means genes are up-regulated in bad-prog-noses, higher stages, and higher grades.It is easily shown that N-MEG+ genes are positively
correlated with worse prognoses, higher tumor stagesand higher tumor grades. Similarly, N-MEG- is nega-tively correlated. From the p-value matrix, we can calcu-late integrated p-values using three meta-analysismethods over ten test classes (Figure 2). It is easilyfound that the N-MEG is highly significant in all typesof prognosis analyses (p-values less than 10-14 in anymethods). Except the test for stage M (current status ofmetastasis), all p-values were less than 0.01. The studyof stage M is designed for elucidating differences ofgene expression profile between primary tumors andmetastatic tumors. The conceptual difference from theprognosis study of metastasis is that while the formerdescribes the status of ‘metastasis occurred’, the latterdescribes ‘metastasis will occur’. The results of stage Nand stage T were intermediately significant; five of theseven studies in the stage N are two class comparisons(N0 vs. others).Correlations with the tumor grade stu-dies were extremely significant. It is also shown that the
Stouffer’s Z method gives relatively more conservativeresults. As the Stouffer’s Z method has been proven tobe more robust to a few extreme values [23] and cor-rectable here (see Methods), we will use the correctedversion of this method for rest of the study.In a comparison with gene sets from previous work,
the N-MEG showed the highest association with cancerprognoses (Figure 3).Gene sets from a multiple regres-sion and a two-way ANOVA model followed it andother two gene sets (Suzuki et al and Ellsworth et al)showed relatively lower significance. This result impliesthat the pattern based methods (MEGA, two-wayANOVA and multiple regression models) are moreeffective than two class direct comparison methods (t-test and clustering) in finding prognosis associatedgenes. On the other hand, ANOVA and Suzuki setshowed the best score with the N stage. Like we alreadymentioned, most of the existing N stage test sets arebased on a t-test within two classes, which is the samemethod as what Suzuki et al used. In other analysistypes including M and T stage grouping and tumorgrade, we could not find significant differences amongfive methods. Abba set was also tested even though thegene set was already had a selection step using prog-nosis data (selecting 46 top ranked genes from 300genes, see Methods). The test showed that our gene setwas comparable to it (better in metastasis, relapse andoverall prognosis) in spite of a significant degree ofunfairness.Overall aspects of gene expression progression along
the N stage give explicit explanations of differencesamong the candidate gene sets (Figure 4). In the N-MEG and multiple regression model-based gene setsshow consistent increase or decrease along the N stageindependent to the T stage (Figure 4A and 4B). How-ever, gene sets from two class direct comparison meth-ods (t-test and Mann-Whitney test) show certain degreeof inconsistency and discrepancy between lymph nodephenotypes and gene expression patterns (Figure 4D,4E, and 4F). This result shows that those gene sets(lymph node positive vs. negative) may contain falsepositives from abstracting detailed pattern information,and also implicates the reason why N-MEG showedrelatively high significance in the prognosis test.
Classification and survival analysisTo show the classification power of the N-MEGs, we con-ducted a test for 5-year metastasis free survival data fromWang et al [15]. Because the meaning of N-MEG+ and N-MEG- is so clear, we scored the sum of row-normalized z-scores of corresponding genes; adding for 20 N-MEG+genes and subtracting for 20 N-MEG- genes. For the 286primary breast samples (91 metastasis in 5-years), themean score was nearly zero (6.5x10⁻¹³) and the standard
Kim et al. BMC Systems Biology 2011, 5(Suppl 2):S4http://www.biomedcentral.com/1752-0509/5/S2/S4
Page 3 of 14

deviation was 7.8. From the 51 patients whose scores werebigger than the mean plus one standard deviation, 37 hadmetastasis in 5-years giving 0.35 of sensitivity and 0.92 ofspecificity. The overall accuracy was 0.71. An ROC curvewas drawn to compare the N-MEGs with other gene sets(Figure 5A). The N-MEGs showed the best classificationpower. Interestingly, while the two statistical approaches
using stage progression (multiple regression and two-wayANOVA) managed to prove a certain degree of usefulness,the studies using two class comparisons did not. Althoughthe result may be further improved by other fancy classi-fiers with optimization procedures, we can tentatively con-clude that observing the signatures of stage progressiongives better results. A set of area under curve (AUC) were
Figure 1 N-MEG with their meta-analysis test result. Here, 20 N-MEG+ and 20 N-MEG- genes are tested. Each column corresponds to aspecific gene, and each row to an experiment in the ONCOMINE test set. Test set of 65 experiments are classified into three major classes (PRG,STG, and GRD), each of which are subdivided into several minor classes. Blue color denotes up-regulation, and yellow color denotes down-regulation. Experiments with an asterisk (*) denote they used the expO database, and were excluded from further analyses. PRG=prognosis,MP=metastatic prognosis, RLP=relapse prognosis SVP=survival prognosis, STG=stage, M=M stage, N=N stage, G=stage grouping, T=T stage,GRD=tumor grade.
Kim et al. BMC Systems Biology 2011, 5(Suppl 2):S4http://www.biomedcentral.com/1752-0509/5/S2/S4
Page 4 of 14

denoted in Figure 5B. The AUC of MEGA was 0.69 (0.626~ 0.757 in 95% confidence limits). To conduct a survivalanalysis we divided the all 286 patients into three groupsof equal size (n=95 for good and poor group, 96 for inter-mediate group). It is shown that the three groups have
distinct metastasis free survival and hazard rate in KaplanMeier estimation (Figure 5 C and D).
T-wise monotonically expressed genes (T-MEG) andcomparison with N-MEGT-MEG (n=40, 20 T-MEG+ and 20 T-MEG-) were alsosignificantly correlated with breast cancer prognosisincluding metastasis and relapse, but the significancewas generally worse than N-MEG (Table 1). In theprognosis of metastasis studies, both of the T-MEG+and T-MEG- were significant (p-values of 4.3x10⁻⁸
and3.1x10-3respectively), but they were not as effectiveas N-MEG (p-values of 1.2x10⁻¹⁵ and1.4x10-6). Thisresult agrees with the previously known pathologicalfacts; both of the degree of lymph node invasion andtumor size are important in predicting metastasis prob-abilities, while the former gives more direct evidences.We can also notice that tumor size related gene wereeither not significant (in prognosis of survival andtumor stages) or less significant than lymph node inva-sion related genes (in prognosis of relapse and tumorgrade).The distinct characteristics between the two tumoral
features might be tumor tissue specific. Breasts are notessential organs for personal survival. So even though atumor has grown to be large, the cancer is not a fataldisease unless the tumor has been spread to otherorgans. In this case, mastectomy would be effective for
Figure 2 P-values of N-MEG over ten analysis types. Each linedenotes a different kind of meta-analysis method. Except the ‘stageM’ class, all the p-values are less than 0.01 (and extremely low inprognosis analyses). Each p-value was calculated by multiplying twop-values from 20 up and 20 down genes.
0
10
20
30
40
50
60
70
OverallPrognosis
MetastasisPrognosis
RelapsePrognosis
SurvivalPrognosis
OverallStage
M Stage N Stage T Stage StageGrouping
Grade (/10)
Log-
odd
scor
e (U
P+D
OW
N)
N-MEGs
MR
2ANOVA
Suzuki
Ellsworth
Figure 3 Comparison with previous studies. Each value corresponds to a sum of log-odd scores from up and down regulated gene sets. Inprognosis analyses, pattern based methods (MEGA, multiple regression and ANOVA models) showed better results than two-class comparisonmethods (Paired t-test in Suzuki and Mann-Whitney test in Ellsworth). N-MEG (blue) showed the best significance among all the gene sets.Instead, N-MEG and a multiple regression set showed relatively low significance in tumor stage data; probably because most of the N stage testsets used two-class comparison methods. Values in tumor grade analyses were scaled down to 1/10 for better presentation of the graph. N-MEG= N-wise monotonically expressed genes, MR = multiple regression, 2ANOVA = two-way ANOVA.
Kim et al. BMC Systems Biology 2011, 5(Suppl 2):S4http://www.biomedcentral.com/1752-0509/5/S2/S4
Page 5 of 14

improving patients’ survival rate. Although cancer prog-nosis is a result of complex and stochastic activitiesamong cellular processes, we can conclude this tendencywould be valid for other non-essential organs.
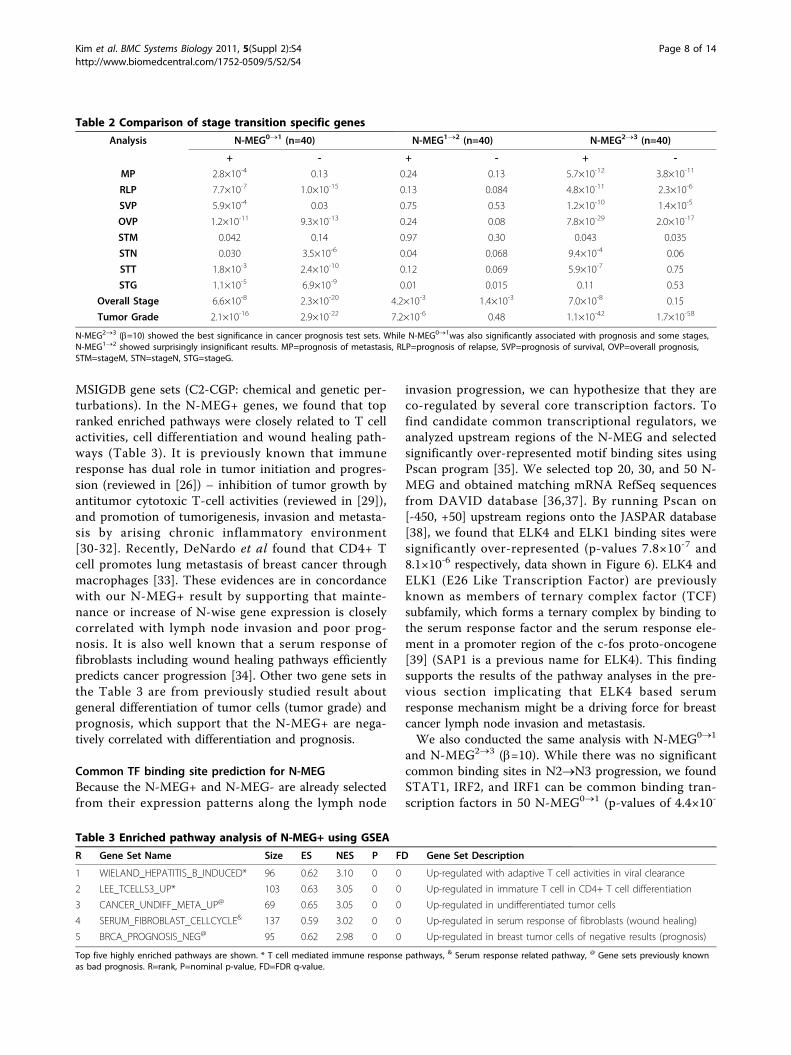
Genes related to specific N stage transitionsWe further tested the significance of genes related tospecific steps of lymph node invasion progression byaltering a leaping factor b. The leaping factor was set to10 and applied to three different steps (N0®N1,N1®N2, and N2®N3) with a factor remains to bezero. These gene sets are N-wise monotonicallyexpressed genes with a leaping at a specific stage transi-tion A®B (N-MEGA®B: here, N-MEG0®1, N-MEG1®2,and N-MEG2®3 respectively). Interestingly, we found
significant discrepancy among lymph node invasion pro-gression steps (Table 2). Genes which were significantlyup or down regulated in the N1®N2 progression (N-MEG1®2) were of no significance in most of the prog-nosis and tumor stage studies (p-values > 0.01). Instead,N-MEG0®1 and N-MEG2®3 were significant in most ofthe studies including prognosis of metastasis, prognosisof relapse, prognosis of survival and tumor grade.Firstly, we expected that N-MEG0®1 would be more
informative than N-MEG in the other stage transitions.Because, it is thought that if a set of tumor cells acquirehigh motility to migrate and intravasate into lymphnodes, dissemination of tumor cells over the larger partsof lymph nodes would follow spontaneously [5]. But theresult of meta-analysis test represents that there would
Figure 4 Aspects of gene expression patterns. Top ranked genes from four different methods are shown (A: N-MEG, B: multiple regression, C:two-way ANOVA, D: Suzuki set, E: Ellsworth set, and G: Abba set). Genes in the first row are up-regulated genes in lymph node positive samplesin each study, the second row are down regulated genes (except in B; ANOVA does not give directional results). Lymph node progression isdenoted in X-axis, and the relative expression values against normal breast samples are denoted in Y-axis (in log 2 based fold change). Fourdifferent colors are used to discriminate different tumor sizes (T stage 1 to 4). Expression patterns of two genes from N-MEG and multipleregression (FLJ32549, AKR1D1, TMEM65 and MGC35361) show consistent increase (top row) or decrease (bottom row) in all tumor sizes, whiletop-ranked genes from other studies (D~F) show either inconsistency among different tumor sizes (D up, E and F up) or disagreement overphenotypic traits (D down, E down, and F up). We can see that the multiple regression model find more linear relationships (B) and ANOVA setcontains significant fluctuations (C).
Kim et al. BMC Systems Biology 2011, 5(Suppl 2):S4http://www.biomedcentral.com/1752-0509/5/S2/S4
Page 6 of 14

be another transcriptional changing event in the latestep of lymph node invasion before raising distantmetastasis.To inspect the characteristics of N-MEG0®1 and N-
MEG2®3, we chose 200 genes from each gene set (100positive and 100 negative genes in N-MEG0®1 and N-MEG2®3) and compared them each other. We foundthat there were few overlaps between two gene sets; nooverlap in top 20 genes, and only two overlaps in 200genes. But in the gene function analysis using Gorilla[24], both gene sets were enriched in the immuneresponse GO terms (p-values ~ 1.0×10⁻⁴). Where the
immune response is a well-known process affectinglymph node invasion [25-27], it is convincing that bothgene sets are distinct but closely related to lymph nodeinvasion by connected pathways (see Additional Files 1and 2 for full enrichment map).
Pathway analysis of N-wise progressionTo observe changes of pathways in N-wise progression,we applied Gene Set Enrichment Analysis (GSEA) [28]to N-MEG. All 20,073 genes were sorted by their LE’scores in descendant order. And the sorted list was ana-lyzed by the GSEA Preranked test using 1,186 curated
Figure 5 Classification and survival analysis using N-MEG genes. (A) An ROC curve shows that the genes from MEGA analysis (N-MEG) havethe strongest classification power among other candidate lymph node related genes. (B) Areas under ROC curve (AUC) denote the statisticalmeasurement of the classification power. Note that the genes from previous two-class comparisons hardly prove their usefulness in classification;but the result may differ when conducted in other classification methods. (C and D) Three risk groups (good, intermediate and poor) showdistinct survival and hazard functions in Kaplan-Meyer diagrams. AUC=area under curve, Std. Error=standard error, Asym. Prob.=Asymptoticprobability, LCL=lower confidence limit, UCL=upper confidence limit.
Table 1 Comparison of N-MEG and T-MEG in a meta-analysis test
Analysis N-MEG (n=40) T-MEG (n=40)
N-MEG+ (n=20) N-MEG- (n=20) T-MEG+ (n=20) T-MEG- (n=20)
Metastasis Prognosis 1.2x10⁻¹⁵ 1.4x10⁻⁶ 4.3x10⁻⁸ 3.1x10⁻³
Relapse Prognosis 7.9x10⁻²⁷ 7.8x10⁻⁶ 7.6x10⁻⁴ 2.1x10⁻⁷
Survival Prognosis 5.7x10⁻¹³ 0.21 0.41 0.013
Overall Prognosis 9.4x10-51 1.9x10⁻⁸ 1.5x10⁻⁶ 1.1x10⁻⁹
Stage M 0.38 0.28 0.91 2.8x10⁻⁴
Stage N 0.017 0.10 0.15 0.57
Stage T 2.1x10⁻³ 0.074 0.098 0.15
Stage G 0.063 7.2x10⁻³ 0.93 0.18
Overall Stage 2.1x10⁻⁴ 1.2x10⁻³ 0.46 0.075
Tumor Grade 1.3x10-104 1.3x10⁻⁸ 2.3x10⁻⁸ 6.0x10⁻¹⁰
N-MEG showed better significance than T-MEG. Generally speaking, N-wise progression gives more information than T-wise progression in cancer prognosis.
Kim et al. BMC Systems Biology 2011, 5(Suppl 2):S4http://www.biomedcentral.com/1752-0509/5/S2/S4
Page 7 of 14
MSIGDB gene sets (C2-CGP: chemical and genetic per-turbations). In the N-MEG+ genes, we found that topranked enriched pathways were closely related to T cellactivities, cell differentiation and wound healing path-ways (Table 3). It is previously known that immuneresponse has dual role in tumor initiation and progres-sion (reviewed in [26]) – inhibition of tumor growth byantitumor cytotoxic T-cell activities (reviewed in [29]),and promotion of tumorigenesis, invasion and metasta-sis by arising chronic inflammatory environment[30-32]. Recently, DeNardo et al found that CD4+ Tcell promotes lung metastasis of breast cancer throughmacrophages [33]. These evidences are in concordancewith our N-MEG+ result by supporting that mainte-nance or increase of N-wise gene expression is closelycorrelated with lymph node invasion and poor prog-nosis. It is also well known that a serum response offibroblasts including wound healing pathways efficientlypredicts cancer progression [34]. Other two gene sets inthe Table 3 are from previously studied result aboutgeneral differentiation of tumor cells (tumor grade) andprognosis, which support that the N-MEG+ are nega-tively correlated with differentiation and prognosis.
Common TF binding site prediction for N-MEGBecause the N-MEG+ and N-MEG- are already selectedfrom their expression patterns along the lymph node
invasion progression, we can hypothesize that they areco-regulated by several core transcription factors. Tofind candidate common transcriptional regulators, weanalyzed upstream regions of the N-MEG and selectedsignificantly over-represented motif binding sites usingPscan program [35]. We selected top 20, 30, and 50 N-MEG and obtained matching mRNA RefSeq sequencesfrom DAVID database [36,37]. By running Pscan on[-450, +50] upstream regions onto the JASPAR database[38], we found that ELK4 and ELK1 binding sites weresignificantly over-represented (p-values 7.8×10⁻⁷ and8.1×10-6 respectively, data shown in Figure 6). ELK4 andELK1 (E26 Like Transcription Factor) are previouslyknown as members of ternary complex factor (TCF)subfamily, which forms a ternary complex by binding tothe serum response factor and the serum response ele-ment in a promoter region of the c-fos proto-oncogene[39] (SAP1 is a previous name for ELK4). This findingsupports the results of the pathway analyses in the pre-vious section implicating that ELK4 based serumresponse mechanism might be a driving force for breastcancer lymph node invasion and metastasis.We also conducted the same analysis with N-MEG0®1
and N-MEG2®3 (b=10). While there was no significantcommon binding sites in N2®N3 progression, we foundSTAT1, IRF2, and IRF1 can be common binding tran-scription factors in 50 N-MEG0®1 (p-values of 4.4×10-
Table 2 Comparison of stage transition specific genes
Analysis N-MEG0®1 (n=40) N-MEG1®2 (n=40) N-MEG2®3 (n=40)
+ - + - + -
MP 2.8×10⁻⁴ 0.13 0.24 0.13 5.7×10⁻¹² 3.8×10⁻¹¹
RLP 7.7×10⁻⁷ 1.0×10⁻¹⁵ 0.13 0.084 4.8×10⁻¹¹ 2.3×10⁻⁶
SVP 5.9×10⁻⁴ 0.03 0.75 0.53 1.2×10⁻¹⁰ 1.4×10⁻⁵
OVP 1.2×10⁻¹¹ 9.3×10⁻¹³ 0.24 0.08 7.8×10⁻²⁹ 2.0×10⁻¹⁷
STM 0.042 0.14 0.97 0.30 0.043 0.035
STN 0.030 3.5×10⁻⁶ 0.04 0.068 9.4×10⁻⁴ 0.06
STT 1.8×10⁻³ 2.4×10⁻¹⁰ 0.12 0.069 5.9×10⁻⁷ 0.75
STG 1.1×10⁻⁵ 6.9×10⁻⁹ 0.01 0.015 0.11 0.53
Overall Stage 6.6×10⁻⁸ 2.3×10⁻²⁰ 4.2×10⁻³ 1.4×10⁻³ 7.0×10⁻⁸ 0.15
Tumor Grade 2.1×10⁻¹⁶ 2.9×10⁻²² 7.2×10⁻⁶ 0.48 1.1×10-42 1.7×10-58
N-MEG2®3 (b=10) showed the best significance in cancer prognosis test sets. While N-MEG0®1was also significantly associated with prognosis and some stages,N-MEG1®2 showed surprisingly insignificant results. MP=prognosis of metastasis, RLP=prognosis of relapse, SVP=prognosis of survival, OVP=overall prognosis,STM=stageM, STN=stageN, STG=stageG.
Table 3 Enriched pathway analysis of N-MEG+ using GSEA
R Gene Set Name Size ES NES P FD Gene Set Description
1 WIELAND_HEPATITIS_B_INDUCED* 96 0.62 3.10 0 0 Up-regulated with adaptive T cell activities in viral clearance
2 LEE_TCELLS3_UP* 103 0.63 3.05 0 0 Up-regulated in immature T cell in CD4+ T cell differentiation
3 CANCER_UNDIFF_META_UP@ 69 0.65 3.05 0 0 Up-regulated in undifferentiated tumor cells
4 SERUM_FIBROBLAST_CELLCYCLE& 137 0.59 3.02 0 0 Up-regulated in serum response of fibroblasts (wound healing)
5 BRCA_PROGNOSIS_NEG@ 95 0.62 2.98 0 0 Up-regulated in breast tumor cells of negative results (prognosis)
Top five highly enriched pathways are shown. * T cell mediated immune response pathways, & Serum response related pathway, @ Gene sets previously knownas bad prognosis. R=rank, P=nominal p-value, FD=FDR q-value.
Kim et al. BMC Systems Biology 2011, 5(Suppl 2):S4http://www.biomedcentral.com/1752-0509/5/S2/S4
Page 8 of 14

13,1.1×10-12, and7.4×10-12 respectively, data shown inFigure 6). We found that IRF1, who plays a tumor sup-pressing role, is negatively regulated by competitivetranscriptional binding of IRF2, both of which were sig-nificantly correlated with tumor stage (p-value 0.001),depth of tumor infiltration (p-value 0.006) and lymphnode metastasis (p-value 0.015) in human esophagealcancers [40]. Here, we also suggest that IRF2-IRF1 path-way is likely to be involved in lymph node invasion andmetastasis progression in human breast cancers withwell-known activities of STAT1 [41-44].
DiscussionIn this study, we proposed a monotonically expressedgene analysis (MEGA) for extracting genes that arerelated to lymph node invasion and tumor size in breast
cancer. We analysed expression patterns over a twodimensional N×T space and provided results of meta-analysis to evaluate the gene sets. The test has been con-ducted on completely independent data sets. We showedthat gene sets selected from the suggested LE’ and TE’functions are strongly correlated with cancer prognosesincluding metastasis, relapse and survival, and showedsignificantly better results than conventional approaches.These functions are specially designed to capture expres-sional differences between two consecutive stages andconsistency of expression patterns as well. The MEGAmodel also enabled us to analyze the impact of each clini-cal factor independently, and to inspect a specific stagetransition in a cancer progression.Before concluding our report, it is necessary to recon-
sider the meaning of linking clinical factors and cancer
Figure 6 Candidate commonly binding transcription factors. Using Pscan, 50 top-ranked N-MEG+ and N-MEG0®1+ were analysed in theirupstream sequences. In N-MEG+, transcription factors involved in serum response activities have been identified. In N-MEG0®1+, IRF1-IRF2mediated tumor suppressing pathways were identified as candidate driving pathways.
Kim et al. BMC Systems Biology 2011, 5(Suppl 2):S4http://www.biomedcentral.com/1752-0509/5/S2/S4
Page 9 of 14

prognosis in a molecular level. A general relationshipamong clinical and genetic factors is described in Figure7. Since a primary tumor first occurred, accumulatedgenetic and epigenetic aberrations drive the tumor’sprogression. The relationship between genetic aberra-tions and gene expression changes or protein functionaberration is strongly established. So it is obvious thatprogressed tumors have different gene expressions orabnormal proteins. In our MEGA analysis, we focusedon the gene expression part. If we found a candidategene set which connects gene expression changes andlymph node invasion (A in Figure 7), it should be ableto explain the relationship to cancer prognosis (C inFigure 7), because the correlation between lymph nodeinvasion and cancer prognosis has been firmly proven
(B in Figure 7). We found that previous candidate genesin A rarely found proper explanations of C. Here, themeaning of our study is summarized in two points.First, we tried to improve accuracy in finding candidategenes in A by interpreting gene expression patterns overlymph node progression (MEGA). Second, we provideda credible meta-analysis test procedure to validate therelationship in C. As there still unexplained importantfactors remain, we have to integrate additional data ofother levels to finalize the lymph node invasion related(or causing) genes. But we suggest the future work alsoshould be cross-validated in the different types ofrelations.Although the MEGA analysis provided a feasible link
to clinical factors and cancer prognoses in a genetic
Figure 7 Conceptual relationship of clinical and genetic factors. Colors in the box denote different levels of data. Lines are drawn indifferent shapes according to different degrees of certainty. After primary tumor occurred, accumulated (epi)genetic mutations drive cancerprogression. With transcriptional level data, we can elucidate lymph node invasion (A) and cancer prognosis (C). But in the prediction steps, thepreviously proven relation between D and F should be properly explained (B).
Kim et al. BMC Systems Biology 2011, 5(Suppl 2):S4http://www.biomedcentral.com/1752-0509/5/S2/S4
Page 10 of 14

level, some parts remain to be improved. First, themonotonicity can be defined in various ways. Currentlywe can rarely determine the activities of genes in anabsolute expression level. Some genes have highersaturation level so that the gene expression patternmight show a monotonic increase through all the clini-cal stages. On the other hand, if an activity of a gene iseasily saturated, the gene expression pattern above acertain degree would not be informative anymore.Handling and determining the optimized pattern onevery gene is almost impossible, but other heuristics willbe available using kinetics and text-mining. Second,integration with other omics data always count. It is stilla big question; how to connect two different types andlevels of information. As shown in Figure 7, proteinlevel information explains another big part of clinicaloutcomes. In our opinion, those information sets shouldbe integrated to an augmented ‘gene’ entity with otheravailable information like point mutations, SNPs, andCNVs. In this case, the MEGA model has to be revisedin its scoring functions. Lastly, finding for drivingmechanisms of progression is one of the ultimate goalsin this field. We tried to elucidate these mechanismsthrough pathway analyses and commonly binding tran-scription factor analyses here, but it is yet to be a strik-ing discovery. After we solve the prior questions, ourapproach might be more helpful in clarifying the coregenes or genetic events that can be essential in thera-peutic applications.
MethodsData setsTraining data setsWe used 278 breast tumor gene expression data from theexpO (expression project for Oncology) database (http://www.intgen.org/expo.cfm, International Genomics Con-sortium). The data can be also downloaded from NCBI’sGEO database (GSE2109). From 2,158 gene expressionprofiles for all tissues and tumor types, we chose onlybreast carcinomas. Samples without pathological N andT stage records, or whose pathological M stage and histo-logical information indicate inclusion of distant metasta-sis were removed. Finally, the 278 non-metastasis breasttumor samples were categorized into 16 N×T classes(N0~N3, T1~T4). We also used seven normal breastgene expression profiles from GSE3744 [45] to infer thedeviation of each N×T stage against the normal condi-tion. Normalization of data was processed with the Sim-pleaffy Package [46] in R by applying RMA normalizationfor every N×T stage with normal breast samples. Afternormalization, probe sets were collapsed into gene sym-bols using the GSEA collapse tool [28]. Each gene wasscored by log 2 based fold change.
ONCOMINE data sets for testFor test sets, we used 65 breast cancer data sets fromONCOMINE database [47]. The 65 data sets were firstlyclassified into three major analysis types (Prognosis,Tumor Stage, and Tumor Grade) each of which isfurther classified into matching minor subtypes. Minortyping has been done by manual inspection. From theONCOMINE database, we could download pre-analyzedtables which include sample size, statistics, and two-tailed p-values. Two-tailed p-values were further con-verted into one-tailed p-values.
Monotonically expressed gene analysis (MEGA)In this work, we use two clinical variables (pathologicalT and N), but MEGA can be expanded to three or morevariables with similar procedures. The final goal of theMEGA analysis is to extract N-wise monotonicallyexpressed genes (N-MEG) and T-wise monotonicallyexpressed genes (T-MEG) using monotonicity functions.We first define a two dimensional N×T space for eachgene. The N×T space for a gene gy consists of p num-bers of N stages and q numbers of T stages can bedefined as a (p+1)×(q+1) matrix X:
X( )g
x x
x x
y
y y q
y p y pq
=⎛
⎝
⎜⎜⎜
⎞
⎠
⎟⎟⎟
00 0
0
where the first row and the first column denote geneexpressions of normal samples.To represent how consistently a series of gene expres-
sions has changed along N and T axes, we defined twoscoring functions of the X matrix:
LE(g ) {( ) S( )} (y = − + − +=
−
==∑∑∑ b akj yki yji yki yji
j
k
i
q
k
p
yx x x x x1
1
12
11
1
0
1
1
i
i
q
y i
kj yik yij yik yij
j
k
x
x x x x
=
=
−
∑
∑
−
= − + −
)
TE(g ) {( ) S( )}y b aii
p
k
q
yi
i
p
yix x== =∑∑ ∑+ −
12
1
1
0( )
where LE is a monotonicity function of gene expres-sion over lymph node invasion progression and TE ismonotonicity function of gene expression over tumorsize growth. The parameter a is a consistency factorwhich emphasizes the direction of gene expressionchanges, S is a sign function, and b is a leaping factorfor giving weights to an specific step of stage progres-sion. The characteristics of parameter a were notexplored in this study. The sign function S is definedas:
S( )( )
( )x
x
x=
+ ≥− <
⎧⎨⎩
1 0
1 0
Kim et al. BMC Systems Biology 2011, 5(Suppl 2):S4http://www.biomedcentral.com/1752-0509/5/S2/S4
Page 11 of 14

And a matrix of leaping factors b is defined as amatrix form:
bb =⎛
⎝
⎜⎜⎜
⎞
⎠
⎟⎟⎟
−
b
b
10 1
1 1p p( )
Because b is only meaningful in two consecutivestages, the b matrix is much like a diagonal matrix. Theoff-diagonal entries are always defined as 1. In thisstudy, we applied the leaping factors only for N stageprogression.We can interpret the value of LE and TE functions as
a sum of moving deviations in the course of N and Tstage progression. For each stage, we calculate the geneexpression differences between the current stage andprevious stages from the beginning of stage to the onestep before the current stage. If a certain gene shows amonotonic increase or decrease in its gene expressionalong the N or T stages, the absolute value of the func-tion would be larger.Finally the LE and TE functions are normalized by the
overall standard deviation of the X matrix:
LE’(g )LE(g )( ( ))
TE’(g )TE(g )( ( ))
yy
yy
=
=
s
s
X
X
g
g
y
y
We selected top 40 genes for each monotonicity func-tion (LE’ and TE’) with their absolute scores. The 40genes are composed of 20 genes of high score and 20genes of low score. The genes of high LE’ score meansthat the expression of those genes showed monotonicincrease as the lymph node invasion progresses, so theset of the genes is named N-wise monotonicallyexpressed genes with positive correlation (N-MEG+).Similarly, N-wise monotonically expressed genes withnegative correlation (N-MEG-) and two other gene setson a tumor size factor (T-MEG+ and T-MEG-) weredefined.
Meta-analysis test on ONCOMINE data setWe performed meta-analysis tests on 65 ONCOMINEdata sets with the selected N-MEG and T-MEG.Assume that we have a gene set G = {g1, g2…gn} and anexperiment set E = {e1, e2…ek}. For a gene i and experi-ment j, we can extract a p-value of gene i in the experi-ment j from the ONCOMINE data set:
pij = ≤ ≤p-value of gene i in experiment j (for i n, j k)
Because the pij is basically two tailed p-value in theoriginal data sets, we converted these p-values into one-tailed p-values:
p
p
pij
ij
ij’
( )
(=
−
2
12
same direction
opposite directiion)
⎧
⎨⎪⎪
⎩⎪⎪
During this procedure, some genes were missed due tothe different naming strategies and the difference of cover-age among the test sets. To minimize the loss of informa-tion, we searched for all aliases and symbols of earlierversions using the recent version of HUGO Gene Nomen-clature Committee (HGNC) database (2009/08/23).Three meta-analysis methods have been applied to calcu-
late overall p-values for a certain set of experiments – Fish-er’s inverse chi-square [48], Stouffer’s overall Z [49], andcumulative binomial distribution. Here, the Fisher’s inversechi-square method computes a combined statistic using,
S pij= − ∏2 ln( ’)
which follows a c2distribution with 2nk degrees offreedom under the joint null hypothesis [50].Unweighted Stouffer’s Z was calculated by transformingevery p-value into z-score upon the standard normaldistribution, followed by summing up all z values anddividing by square root of the total numbers:
∀ →
=
ℵ
∑∑p
Zz
nk
ij
ij
zij’ in (0, 1 )2
Here, the ℵ is a standard normal distribution, Z isthe sum of all z-values. For the cumulative binomialmethod, we first set a threshold to determine whether agiven p-value is significant or not. From the total nknumbers of p-values, we count the significant p-valuenumber ns. For given a threshold ph, a probability thatone can get a number of p-values equal to or more thanns incidentally is,
1
1
1 10
−= − ≤
= −⎛
⎝⎜
⎞
⎠⎟ − −
=∑
F n nk p
X n
nk
ip p
s h
s
hi
hnk i
i
ns
( ; , )
Pr( )
( )
which can be approximated using incomplete betafunction.
Kim et al. BMC Systems Biology 2011, 5(Suppl 2):S4http://www.biomedcentral.com/1752-0509/5/S2/S4
Page 12 of 14

I ( , )( )!
!( )!( )x
j a b j
j a
a b
a ba b
j a b jx x= + −
+ − −− + − −
=
+ −
∑ 11
1 11
So, the final p-value is calculated like below.
p nk n np s s= − − − +−1 1 11I ( , )
Correction of Z scores from background biasesBefore finalizing p-values of meta-analyses, we noticedthat the p-values in the ONCOMINE data sets areupwardly biased. In the 65 studies, 55 studies have big-ger number of significantly changed genes than weexpected. And we also found that 43 studies have moreup-regulated genes than down-regulated genes. We donot insist that these results mean experimental errors;we would rather think it is natural that many of genesare going to be actively expressed as the cancer pro-gresses and regulatory mechanisms are being brokedown. But in the case of test procedures, we are likelyto get more false positives unless we consider the back-ground biases. For example, some random gene setsmay represent ‘more than average’ results and will bethought to be significant for cancer phenotypes.To correct the background biases, we generated 1,000
random gene sets (n=20) and tested on the ONCO-MINE data sets. And we computed Stouffer’s overall Zscore on each random gene set. Averaged Z scoresrepresent an expected Z score from a random gene set.From this result, we could conclude that the meta-ana-lysis result of gene sets look more up-regulated in thecancer progression than they really are. So we correctedall the Stouffer’s Z scores result from N-MEG and T-MEG by subtracting the mean values of Z in the up-reg-ulation test and adding in the down-regulation test.
Comparing with previous studiesWe first extracted lymph node invasion related gene setsfrom previous studies (Suzuki et al [17], Abba et al [18],and Ellsworth et al [19]). Each gene set was tested usingthe corrected Stouffer’s Z test described in previous sec-tion. We found that the gene set from Abba et al wasalready reduced from 300 to 46 genes using eight prog-nosis experiments. So the Abba set was not used infurther comparisons. We also found there are fourexperiments which used expO data set in the ONCO-MINE test set (Bittner et al). All the overlapping datawas excluded in the test procedure. Additionally, weselected 40 genes from expO data using two-wayANOVA and multiple regression models. For each gene,both models were constructed using ‘aov’ and ‘lm’ func-tions in R. In ANOVA models, genes were sorted by N
stage dependent two-tailed p-values derived from theirF-statistics because of the model’s non-directionality. Inmultiple regression models, 40 genes with the highest P-values of N stage were selected where their T stage andinteraction terms are not significant. Directions of regu-lation were determined from the estimated coefficients(up >0, down <0). Finally five gene sets (N-MEG, multi-ple regression set, two-way ANOVA set, Suzuki set, andEllsworth set) were tested and their p-values werereported. P-values from meta-analysis were convertedinto log-odd score using –log10(P). For each study, thefinal score was calculated from adding the two log-oddscores (from up and down regulated gene sets).
Additional material
Additional File 1: Analysis of enriched GO Term with GOrilla (N-MEG0®1). Genes related to N0®N1 stage transition showed significantover-representation with collagen and extracellular matrix constituent.
Additional File 2: Analysis of enriched GO Term with GOrilla (N-MEG2®3). Genes related to N2®N3 stage transition showed significantover-representation with immune response, wound response andinflammation.
AcknowledgementsThe efforts of the International Genomics Consortium (IGC) and expO(expression project for Oncology) are greatly acknowledged. We would liketo thank CHUNG Moon Soul Center for BioInformation and BioElectronics forproviding research facilities. This work was supported by the World ClassUniversity program (R32-2008-000-10218-0) of the Ministry of Education,Science and Technology through the National Research Foundation ofKorea.This article has been published as part of BMC Systems Biology Volume 5Supplement 2, 2011: 22nd International Conference on Genome Informatics:Systems Biology. The full contents of the supplement are available online athttp://www.biomedcentral.com/1752-0509/5?issue=S2.
Author details1Department of Bio and Brain Engineering, KAIST, 373-1 Guseong-dong,Yuseong-gu, Daejeon, 305-701, Republic of Korea. 2Current address:Department of Computer Science and Engineering, University of California atSan Diego, 9500 Gilman Dr. La Jolla, CA 92093-0404, USA. 3Department ofBioengineering, University of California at San Diego, 9500 Gilman Dr. LaJolla, CA 92093, USA.
Authors’ contributionsSK and DL designed the study. SK and HN performed the experiments. Allauthors helped draft and edit the final manuscript.
Competing interestsThe authors declare that they have no competing interests.
Published: 14 December 2011
References1. McGuire WL: Prognostic factors for recurrence and survival in human
breast cancer. Breast Cancer Research and Treatment 1987, 10:5-9.2. Foster RS Jr: The biologic and clinical significance of lymphatic
metastases in breast cancer. Surgical oncology clinics of North America1996, 5:79.
3. Christine LC, Carol A, Donald EH: Relation of tumor size, lymph nodestatus, and survival in 24,740 breast cancer cases. Cancer 1989,63:181-187.
Kim et al. BMC Systems Biology 2011, 5(Suppl 2):S4http://www.biomedcentral.com/1752-0509/5/S2/S4
Page 13 of 14

4. Fidler IJ: THE PATHOGENESIS OF CANCER METASTASIS: THE ‘SEED ANDSOIL’ HYPOTHESIS REVISITED. Nature Reviews Cancer 2003, 3:453-458.
5. Gupta GP, Massague J: Cancer Metastasis: Building a Framework. Cell2006, 127:679-695.
6. Nguyen DX, Massague J: Genetic determinants of cancer metastasis. NatRev Genet 2007, 8:341-352.
7. Stacker SA, Achen MG, Jussila L, Baldwin ME, Alitalo K: Metastasis:Lymphangiogenesis and cancer metastasis. Nat Rev Cancer 2002,2:573-583.
8. Jatoi I, Hilsenbeck SG, Clark GM, Osborne CK: Significance of AxillaryLymph Node Metastasis in Primary Breast Cancer. J Clin Oncol 1999,17:2334-2340.
9. Nasser IA, Lee AK, Bosari S, Saganich R, Heatley G, Silverman ML: Occultaxillary lymph node metastases in node-negative breast carcinoma.Human pathology 1993, 24:950.
10. Gasparini G, Weidner N, Bevilacqua P, Maluta S, Dalla Palma P, Caffo O,Barbareschi M, Boracchi P, Marubini E, Pozza F: Tumor microvessel density,p53 expression, tumor size, and peritumoral lymphatic vessel invasionare relevant prognostic markers in node- negative breast carcinoma. JClin Oncol 1994, 12:454-466.
11. Sorlie T: Gene expression patterns of breast carcinomas distinguishtumor subclasses with clinical implications. Proc Natl Acad Sci USA 2001,98:10869-10874.
12. van de Vijver MJ: A gene-expression signature as a predictor of survivalin breast cancer. N Engl J Med 2002, 347:1999-2009.
13. van/’t Veer LJ: Gene expression profiling predicts clinical outcome ofbreast cancer. Nature 2002, 415:530-536.
14. Ramaswamy S, Ross KN, Lander ES, Golub TR: A molecular signature ofmetastasis in primary solid tumors. Nature Genet 2003, 33:49-54.
15. Wang Y, Klijn JGM, Zhang Y, Sieuwerts AM, Look MP, Yang F, Talantov D,Timmermans M, Meijer-van Gelder ME, Yu J, et al: Gene-expression profilesto predict distant metastasis of lymph-node-negative primary breastcancer. The Lancet 2005, 365:671-679.
16. Sun Y, Goodison S, Li J, Liu L, Farmerie W: Improved breast cancerprognosis through the combination of clinical and genetic markers.Bioinformatics 2007, 23:30-37.
17. Suzuki M, Tarin D: Gene expression profiling of human lymph nodemetastases and matched primary breast carcinomas: clinicalimplications. Molecular oncology 2007, 1:172-180.
18. Abba MC, Sun H, Hawkins KA, Drake JA, Hu Y, Nunez MI, Gaddis S, Shi T,Horvath S, Sahin A: Breast cancer molecular signatures as determined bySAGE: correlation with lymph node status. Molecular Cancer Research2007, 5:881.
19. Ellsworth RE, Seebach J, Field LA, Heckman C, Kane J, Hooke JA, Love B,Shriver CD: A gene expression signature that defines breast cancermetastases. Clinical and Experimental Metastasis 2009, 26:205-213.
20. Singletary SE, Connolly JL: Breast Cancer Staging: Working With the SixthEdition of the AJCC Cancer Staging Manual. CA Cancer J Clin 2006,56:37-47.
21. Weigelt B, Wessels LFA, Bosma AJ, Glas AM, Nuyten DSA, He YD, Dai H,Peterse JL, van’t Veer LJ: No common denominator for breast cancerlymph node metastasis. Br J Cancer 2005, 93:924-932.
22. Dickey DA, Fuller WA: Distribution of the estimators for autoregressivetime series with a unit root. Journal of the American statistical association1979, 427-431.
23. W MC: Combining probability from independent tests: the weighted Z-method is superior to Fisher’s approach. Journal of Evolutionary Biology2005, 18:1368-1373.
24. Eden E, Navon R, Steinfeld I, Lipson D, Yakhini Z: GOrilla: a tool fordiscovery and visualization of enriched GO terms in ranked gene lists.BMC Bioinformatics 2009, 10:48.
25. Noriaki S, Hiroyuki K, Masayuki W, Soichiro M, Masaki M, Keizo S: Localimmune response to tumor invasion in esophageal squamous cellcarcinoma: The expression of human leukocyte antigen-DR andlymphocyte infiltration. Cancer 1994, 74:586-591.
26. de Visser KE, Eichten A, Coussens LM: Paradoxical roles of the immunesystem during cancer development. Nat Rev Cancer 2006, 6:24-37.
27. Byrne KJO, Dalgleish AG, Browning MJ, Steward WP, Harris AL: Therelationship between angiogenesis and the immune response incarcinogenesis and the progression of malignant disease. Europeanjournal of cancer (Oxford, England : 1990) 2000, 36:151-169.
28. Subramanian A, Tamayo P, Mootha VK, Mukherjee S, Ebert BL, Gillette MA,Paulovich A, Pomeroy SL, Golub TR, Lander ES, Mesirov JP: Gene setenrichment analysis: A knowledge-based approach for interpretinggenome-wide expression profiles. Proceedings of the National Academy ofSciences of the United States of America 2005, 102:15545-15550.
29. Zou W: Immunosuppressive networks in the tumour environment andtheir therapeutic relevance. Nat Rev Cancer 2005, 5:263-274.
30. Leek RD, Lewis CE, Whitehouse R, Greenall M, Clarke J, Harris AL:Association of Macrophage Infiltration with Angiogenesis and Prognosisin Invasive Breast Carcinoma. Cancer Res 1996, 56:4625-4629.
31. Lin EY, Pollard JW: Tumor-Associated Macrophages Press the AngiogenicSwitch in Breast Cancer. Cancer Res 2007, 67:5064-5066.
32. Pollard JW: Tumour-educated macrophages promote tumour progressionand metastasis. Nat Rev Cancer 2004, 4:71-78.
33. DeNardo DG, Barreto JB, Andreu P, Vasquez L, Tawfik D, Kolhatkar N,Coussens LM: CD4+ T Cells Regulate Pulmonary Metastasis of MammaryCarcinomas by Enhancing Protumor Properties of Macrophages. CancerCell 2009, 16:91-102.
34. Chang HY, Sneddon JB, Alizadeh AA, Sood R, West RB, Montgomery K,Chi J-T, Rijn Mvd, Botstein D, Brown PO: Gene Expression Signature ofFibroblast Serum Response Predicts Human Cancer Progression:Similarities between Tumors and Wounds. PLoS Biol 2004, 2:e7.
35. Zambelli F, Pesole G, Pavesi G: Pscan: finding over-representedtranscription factor binding site motifs in sequences from co-regulatedor co-expressed genes. Nucl Acids Res 2009, 37:W247-252.
36. Dennis G, Sherman B, Hosack D, Yang J, Gao W, Lane HC, Lempicki R:DAVID: Database for Annotation, Visualization, and Integrated Discovery.Genome Biology 2003, 4:P3.
37. Huang DW, Sherman BT, Lempicki RA: Systematic and integrative analysisof large gene lists using DAVID bioinformatics resources. Nat Protocols2008, 4:44-57.
38. Vlieghe D, Sandelin A, De Bleser PJ, Vleminckx K, Wasserman WW, van Roy F,Lenhard B: A new generation of JASPAR, the open-access repository fortranscription factor binding site profiles. Nucl Acids Res 2006, 34:D95-97.
39. Dalton S, Treisman R: Characterization of SAP-1, a protein recruited byserum response factor to the c-fos serum response element. Cell 1992,68:597-612.
40. Wang Y, Liu D-P, Chen P-P, Koeffler HP, Tong X-J, Xie D: Involvement of IFNRegulatory Factor (IRF)-1 and IRF-2 in the Formation and Progression ofHuman Esophageal Cancers. Cancer Res 2007, 67:2535-2543.
41. Huang Suyun, B CD, Van Arsdall Melissa, Fidler Isaiah J: Stat1 negativelyregulates angiogenesis, tumorigenicity and metastasis of tumor cells.Oncogene 2002, 21:2504-2512.
42. Khodarev NN, Roach P, Pitroda SP, Golden DW, Bhayani M, Shao MY,Darga TE, Beveridge MG, Sood RF, Sutton HG, et al: STAT1 PathwayMediates Amplification of Metastatic Potential and Resistance toTherapy. PLoS ONE 2009, 4:e5821.
43. Woelfle U, Assmann V, Pantel K: Conditionally active STAT1 and itsfunctional role in tumor progression and invasion. AACR Meeting Abstracts2006, 2006:430-a-.
44. Yu H, Pardoll D, Jove R: STATs in cancer inflammation and immunity: aleading role for STAT3. Nat Rev Cancer 2009, 9:798-809.
45. Richardson AL, Wang ZC, De Nicolo A, Lu X, Brown M, Miron A, Liao X,Iglehart JD, Livingston DM, Ganesan S: X chromosomal abnormalities inbasal-like human breast cancer. Cancer Cell 2006, 9:121-132.
46. Wilson CL, Miller CJ: Simpleaffy: a BioConductor package for AffymetrixQuality Control and data analysis. Bioinformatics 2005, 21:3683-3685.
47. Rhodes DR, Yu J, Shanker K, Deshpande N, Varambally R, Ghosh D,Barrette T, Pandey A, Chinnaiyan AM: ONCOMINE: a cancer microarraydatabase and integrated data-mining platform. Neoplasia 2004, 6:1-6.
48. Fisher RA: Statistical methods for research workers Edinburgh. Oliver andBoyd 1950, 354.
49. Stouffer SA, DeVinney LC, Suchmen EA: The American soldier: Adjustmentduring army life. Princeton University Press Princeton, NJ; 1949.
50. Hong F, Breitling R: A comparison of meta-analysis methods fordetecting differentially expressed genes in microarray experiments.Bioinformatics 2008, 24:374-382.
doi:10.1186/1752-0509-5-S2-S4Cite this article as: Kim et al.: Exploring molecular links between lymphnode invasion and cancer prognosis in human breast cancer. BMCSystems Biology 2011 5(Suppl 2):S4.
Kim et al. BMC Systems Biology 2011, 5(Suppl 2):S4http://www.biomedcentral.com/1752-0509/5/S2/S4
Page 14 of 14