explanatory notes for year 12 statistical reports, 2018...scaled score or the australian tertiary...
TRANSCRIPT
Explanatory notes: for Year 12 statistical reports Page 1 December 2018 2018/58643
Explanatory notes for Year 12 statistical reports, 2018
These notes are provided to assist schools to understand the parameters used by the School Curriculum and Standards Authority in the compilation of statistical reports on Year 12 participation and achievement.
Schools can download the following statistical reports from SIRS:
Report Number Title of report
STS010* Year 12 provider statistics
STS009* Year 12 State statistics
STS022* School assessment statistics
STS028* School grade distribution against State grade distribution
STS029 Distribution of examination statistics
STS036 Statistical moderation and concurrent validity of school assessments
MF01, MF02 and MF03
Detailed written examination feedback (Maximising feedback)
CSE077 Student summary details by provider
AWD007 Exhibition and Award Notification
EST018 Externally Set Task – Percentage scores and grades
*Schools can review historical data (i.e. 2015 and beforehand) by running the ‘H’ versions of the reports. These reports are available via the pathways indicated in the following explanatory notes for reports.
If you require assistance with SIRS (relating to logging on or access to reports), please contact the SIRS helpdesk at the Authority on 9273 6719 or email [email protected].
Schools are reminded that it is best to use the ‘run report as batch’ option when generating reports from SIRS. This option enables users to continue to work in SIRS while the report is processing. The report is sent directly to your email address. This is particularly useful when generating reports that contain a large amount of data.
Note: the Authority is not responsible for statistics relating to university admission, such as the scaled score or the Australian Tertiary Admission Rank (ATAR). All enquiries concerning these statistics should be directed to the Tertiary Institutions Service Centre (9318 8000).

Page 2 Explanatory notes: for Year 12 statistical reports December 2018
STS010 – Year 12 provider statistics This report consists of six sections and can be downloaded from SIRS using the following pathway:
Section 1: Summary statistics
1a Student population Section 1a provides the number of Year 12 students who completed at least one course or course unit, VET unit of competency, or endorsed program or equivalent in the year in which their results were awarded or equivalent and the number of repeating, re-entering, overseas and mature-age students.
Note:
• ‘Completing’ a course or a course unit is defined as obtaining either a grade (A, B, C, D, or E) in the course or course unit.
• ‘Repeating’ are Year 12 students who complete at least one course or course unit or equivalent in the year following first enrolment in Year 12.
• ‘Re-entering’ are Year 12 students who complete at least one course or course unit or equivalent more than one year after first enrolment in Year 12.
• ‘Mature-age’ students were aged 19 or more on 1 March of the year in which their results were
awarded. 1b Western Australian Certificate of Education (WACE) Section 1b provides the number of full-time students who are eligible to achieve the WACE, demonstrated both the literacy and numeracy standard and who achieved the WACE.
The WACE is awarded to students who have successfully met the requirements for breadth and depth, the achievement standard and the literacy and numeracy standard in their senior secondary schooling.
For 2018, these requirements were:
Breadth and depth
Students must complete a minimum of 20 units (or the equivalent) of which at least 10 Year 12 units (or the equivalent) must be included. The 20 units (or the equivalent) must include at least:
• a minimum of ten Year 12 units, or the equivalent • four units from an English course, post-Year 10, including at least one pair of Year 12 units from
an English course and
reports other reports
report type: statistics
report: STS010 - Year 12 provider statisticsor
STS010 - Year 12 provider statistics Part 2

Explanatory notes: for Year 12 statistical reports Page 3 December 2018
• one pair of Year 12 units from each of List A (arts/languages/social sciences) and List B (mathematics/science/technology).
Of the 20 units required for a WACE, up to a maximum of four Year 11 units and four Year 12 units may be substituted by VET qualifications and/or endorsed programs. A student may choose to study VET qualifications and/or endorsed programs and is able to substitute using only VET qualifications (up to a total of eight units) or using endorsed programs (up to a total of four units) or using a combination of VET and endorsed programs (up to a total of eight units but with a maximum of four units with endorsed programs – two in Year 11 and two in Year 12).
Achievement standard
Students must achieve at least 14 C grades or higher (or the equivalent) in Year 11 and 12 units with a minimum of six C grades or the equivalent in Year 12 units.
Both VET qualifications and endorsed programs can indirectly contribute to the WACE standard requirement of a C grade in at least 14 units. A C grade in a maximum of eight units (four in Year 11 and four in Year 12) can be replaced by unit equivalents from VET qualifications and/or endorsed programs. Of these eight unit equivalents, a maximum of four can be from endorsed programs (two in Year 11 and two in Year 12).
Students are required to complete at least four Year 12 ATAR courses or a Certificate II (or higher) VET qualification.
Literacy and numeracy standard
Student must demonstrate the minimum standard of literacy and numeracy.
The minimum standard is indicative of Level 3 of the Australian Core Skills Framework. Students who have achieved Band 8 or higher in the corresponding Year 9 NAPLAN component (Reading, Writing and Numeracy) have met the standard required for that component. Students who had not prequalified in reading, writing or numeracy were required to achieve a Category 3 result in the corresponding component/s of the Online Literacy and Numeracy Assessment (OLNA).
The detailed requirements for achievement of the WACE are provided in the information paper The WACE 2018 – Your Guide to the Western Australian Statement of Student Achievement (WASSA), Western Australian Certificate of Education (WACE) and ATAR Course Report which is available on the Authority website at https://senior-secondary.scsa.wa.edu.au/certification/wace.
It has been agreed, in consultation with stakeholders, that the percentage of students achieving the WACE is calculated from a base population consisting only of those full-time Year 12 students who could have achieved the WACE (if they had achieved at a suitable standard).
The population of full-time students eligible to achieve the WACE is also used as a base when calculating the numbers of ATAR examination students, course unit students, VET students and endorsed program students.
1c WACE course units Section 1c provides the number of full-time students who are eligible to achieve the WACE, and who attained a grade of A, B, C, D or E in at least one pair of course units in either ATAR, General, Foundation or VET industry specific courses. Also included is the number of these students who attained a grade of A in at least one pair of course units.

Page 4 Explanatory notes: for Year 12 statistical reports December 2018
Generally, students taking fewer than four Year 12 ATAR courses in Year 12 are not able to obtain an ATAR, so they may be regarded as not aspiring to university study in the following year.
1d ATAR examination students Section 1d provides the number of students eligible to achieve the WACE who attained four or more ATAR combined scores. Usually, students aspiring to enter university need at least four scaled scores to obtain an ATAR.
1e VET Section 1e provides the number of full-time students eligible to achieve the WACE who completed at least one qualification at Certificate II or higher in Year 10, Year 11 or Year 12.
Students in this category may also be included in category 1c or category 1d.
Note: VET qualifications, reported by schools, are not awarded by the Authority and need to be verified by sighting the relevant certificate.
1f Endorsed programs Section 1f provides the number of full-time students eligible to achieve a WACE, and who were enrolled in at least one endorsed program.
Also reported is the number of these students who achieved a result in at least one endorsed program.
Students in this category may also be included in category 1c or category 1d.
Section 2: WACE courses Section 2 shows the distribution of full-time students eligible to achieve the WACE, by the number of Year 12 course unit pairs completed by each student.
Section 3: ATAR course examinations Section 3 shows the distribution of full-time students eligible to achieve the WACE, by the number of ATAR course examinations sat by each student. Subtotals show the number of students who sat the ATAR course examination in enough courses to obtain an ATAR (at least four) and the number who sat the ATAR course examination in less than four courses. The number of ATAR course examinations sat by a student is defined as the number of course combined scores obtained.
Section 4: VET studies VET qualifications count towards achievement of the WACE. However, unit equivalence is not awarded for partially completed Certificate I and II qualifications.
Section 4 provides the distribution of VET qualifications completed among full-time students eligible to achieve the WACE. Students who have completed more than one VET qualification will be counted as many times as they have completed qualifications.
Note: VET qualifications, reported by schools, are not awarded by the Authority and need to be verified by sighting the relevant certificate.
Explanatory notes: for Year 12 statistical reports Page 5 December 2018
Section 5: Endorsed programs Endorsed programs count towards the achievement of the WACE.
Section 5 provides the distribution of unit equivalents achieved for endorsed programs amongst full-time students eligible to achieve the WACE. A unit equivalent of an endorsed program is equivalent to one course unit.
STS010 – Year 12 provider statistics Part 2
Section 6a: Summary of students’ results by grade for courses Section 6a provides the number and percentage of Year 12 students awarded each of the grades (A, B, C, D and E) for each WACE course by gender.
In addition, a statistical test has been carried out to compare the performance of males against females within the school group.
Under the heading better performing group the following entries may be found:
Entry Meaning
Males In this school, males had higher grades than females.
Females In this school, females had higher grades than males.
NS The statistical test showed no significant difference between groups.
- No test was carried out because there were not enough candidates.
Section 6b: Summary of students’ completions for Preliminary course units Section 6b provides the number of Year 12 students who completed Preliminary course units by gender.
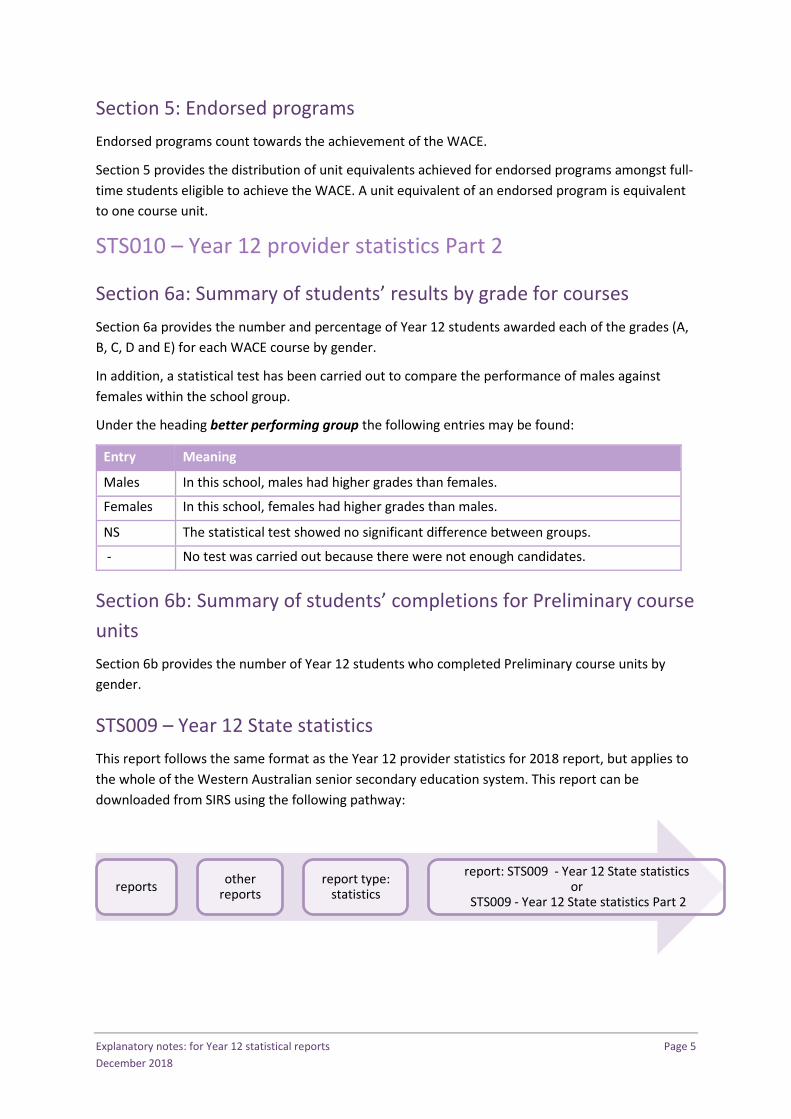
STS009 – Year 12 State statistics This report follows the same format as the Year 12 provider statistics for 2018 report, but applies to the whole of the Western Australian senior secondary education system. This report can be downloaded from SIRS using the following pathway:
reports other reports
report type: statistics
report: STS009 - Year 12 State statisticsor
STS009 - Year 12 State statistics Part 2
Page 6 Explanatory notes: for Year 12 statistical reports December 2018
Results for all WACE courses or course units are tabulated. Under the heading better performing group the following entries may be found:
Entry Meaning
Males For this course, males had higher grades than females.
Females For this course, females had higher grades than males.
NS The statistical test showed no significant difference between groups.
- No test was carried out because there were not enough candidates.
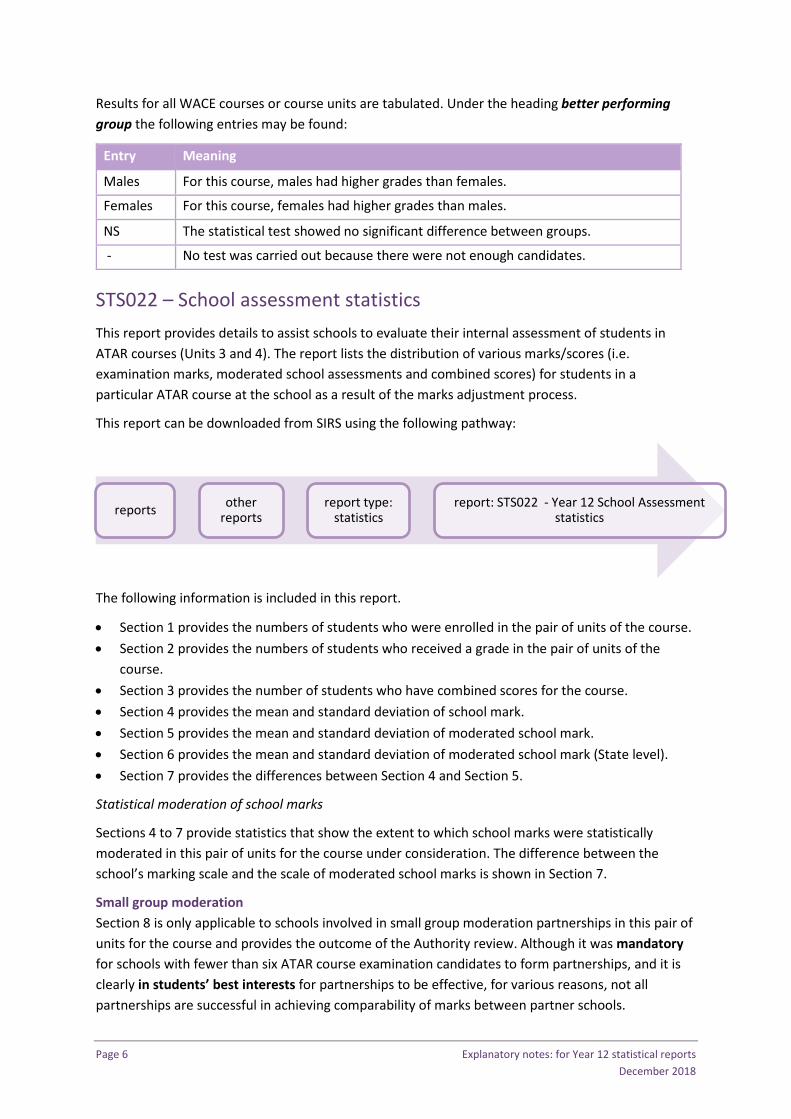
STS022 – School assessment statistics This report provides details to assist schools to evaluate their internal assessment of students in ATAR courses (Units 3 and 4). The report lists the distribution of various marks/scores (i.e. examination marks, moderated school assessments and combined scores) for students in a particular ATAR course at the school as a result of the marks adjustment process.
This report can be downloaded from SIRS using the following pathway:
The following information is included in this report.
• Section 1 provides the numbers of students who were enrolled in the pair of units of the course. • Section 2 provides the numbers of students who received a grade in the pair of units of the
course. • Section 3 provides the number of students who have combined scores for the course. • Section 4 provides the mean and standard deviation of school mark. • Section 5 provides the mean and standard deviation of moderated school mark. • Section 6 provides the mean and standard deviation of moderated school mark (State level). • Section 7 provides the differences between Section 4 and Section 5.
Statistical moderation of school marks
Sections 4 to 7 provide statistics that show the extent to which school marks were statistically moderated in this pair of units for the course under consideration. The difference between the school’s marking scale and the scale of moderated school marks is shown in Section 7.
Small group moderation Section 8 is only applicable to schools involved in small group moderation partnerships in this pair of units for the course and provides the outcome of the Authority review. Although it was mandatory for schools with fewer than six ATAR course examination candidates to form partnerships, and it is clearly in students’ best interests for partnerships to be effective, for various reasons, not all partnerships are successful in achieving comparability of marks between partner schools.
reports other reports
report type: statistics
report: STS022 - Year 12 School Assessment statistics
Explanatory notes: for Year 12 statistical reports Page 7 December 2018
Schools which had six or more ATAR course examination candidates and were in a partnership were given the option at the end of the year to be statistically moderated without their partner/s.
For all other partner schools, the Authority reviewed the marking scales used by each of the schools and judged whether there were grounds for adjusting the partnership. If there was evidence that the partner schools had not used the same marking scales, partnerships were split or re-arranged (in the case of multi-school partnerships) to give the fairest result.
Grade distribution Section 9 provides information about the grade distribution for the pair of units for the course. It includes the number and percentage of students allocated each grade in the pair of units in the course offered by the school. For comparative purposes, State data is also provided.
ATAR course examination marks and school marks Section 10 provides summary data of students who sat the ATAR course examination for the course. For comparative purposes, data from the school and State populations are provided. This section provides the means and standard deviations for school and examination marks, with written and practical marks provided separately where there is a practical examination.
Individual student achievement Section 11 shows each student’s ATAR course examination mark, school mark, and the intermediate marks used to produce the course combined score. The reasons for adjusting raw scores, and a brief description of each adjustment, are given on the Authority website at Your Marks (see last page of this document). These adjustments are used to ensure that combined scores are fairly calculated for all students.
To compensate for variations, relating to examination difficulty, which may occur from year to year, the distributions of each course combined marks were standardised to a predetermined shape such that each distribution has the same mean and standard deviation. A description of this adjustment is given on the TISC website at 2018 marks adjustment process for university admission in 2019 (see last page of this document). Each student’s standardised course combined score is provided.
The information on individual students is confidential and can only be used by the teachers involved in the analysis of results as part of the feedback on student performance. Individual student information must not be released to a third party without permission of the student concerned.
Explanatory notes Each table includes some notes and abbreviations. These abbreviations mean:
Sickness/misadventure applications (column SK)
All students who applied for special consideration for the ATAR course under consideration have an entry in this column. It should be noted that a sickness/misadventure application could be submitted for either the practical or written component of the ATAR course examination. As such, entries in this column are component-specific.
‘N’ means that the application was rejected and no special consideration was given.
‘S’ means that the application was approved and an estimated examination mark, which was higher than the actual mark, replaced the actual examination mark. Students in the ‘S’ category are not included when statistical moderation parameters are calculated for
Page 8 Explanatory notes: for Year 12 statistical reports December 2018
the school/course group (i.e. they are not included in the moderation population for the school/course group).
‘R’ means that the application was approved but the estimated examination mark was lower than the actual mark and hence the actual mark was used in subsequent calculations. Students in the ‘R’ category are included in the moderation population for the school/course group.
Anomalous performers (column AN)
For various reasons, some candidates do not perform at the same level in the ATAR course examination as they usually do in class. Since the aim of statistical moderation is to give meaning to the scale of marks used in class assessments, only the results of candidates who perform typically in an ATAR course examination are used to determine the statistical moderation of the school/course group at a school. This group of ‘typical’ candidates is obtained by excluding from the state-wide candidature those candidates whose examination results are significantly lower than would be expected from their school marks.
The primary method of identifying such students is through the use of a statistical process. The lower cut-off is two standard deviations below the mean difference between moderated school marks and ATAR examination marks, across all candidates of the course. Students who have performed unexpectedly poorly in the ATAR course examination (below the cut-off of the course), are categorised as anomalous performers.
In addition to the statistical process, there are several other methods of identifying students whose examination marks may be lower than expected, for reasons other than acceptable statistical variation. The notations below list all of the codes to be found in the AN column. These refer to all of the possible reasons for excluding a candidate from the moderation populations of a school.
‘A’ identified as anomalous by the statistical process
‘C’ candidate incurred a penalty for breaching examination rules
‘F’ the mark of the candidate had to be estimated because of exceptional circumstances (e.g. a successful sickness/misadventure claim).
Absent from an examination (column ABS)
Candidates who are missing an examination component are identified by a Y.
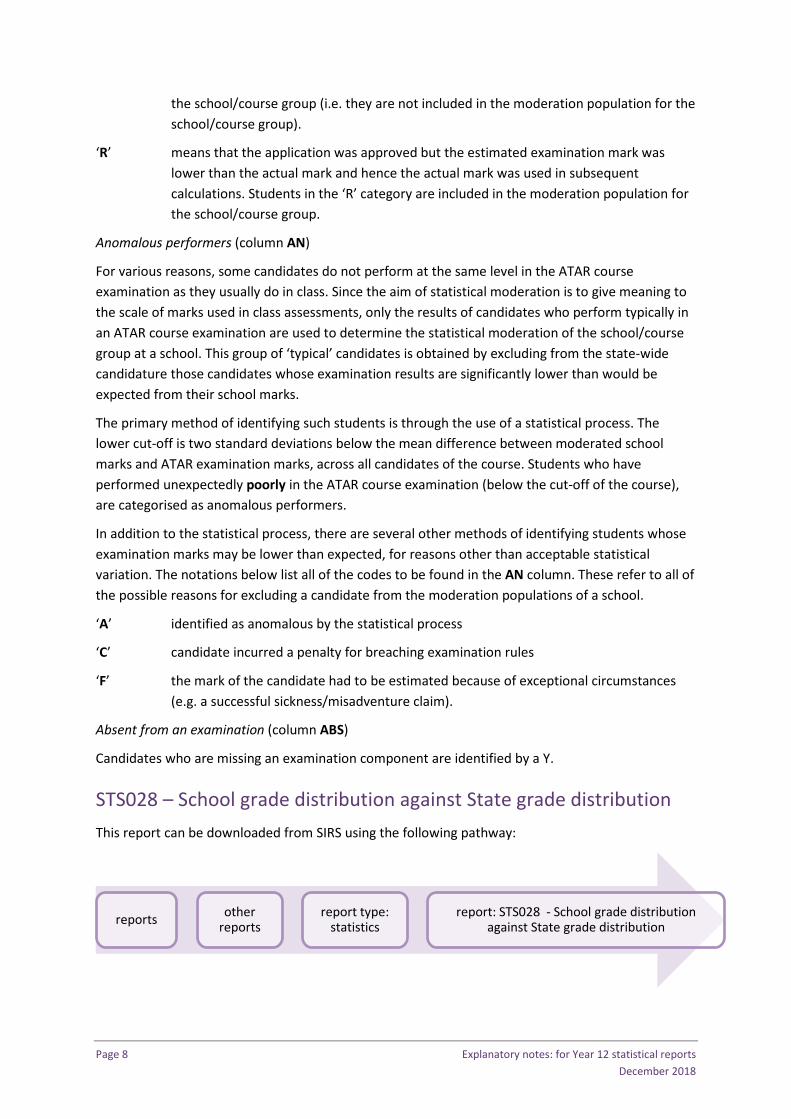
STS028 – School grade distribution against State grade distribution This report can be downloaded from SIRS using the following pathway:
reports other reports
report type: statistics
report: STS028 - School grade distribution against State grade distribution

Explanatory notes: for Year 12 statistical reports Page 9 December 2018
This report provides a graphical presentation of the school grade allocations for a course with reference to either the moderated school mark distribution or the ATAR course examination mark distribution.
For comparative purposes, the report also provides the State pattern of grade allocation for 2018 against the moderated school marks or the ATAR course examination marks. Summary statistics relating to the moderated school marks and the ATAR examination marks are provided for the school and the State.
STS029 – Distribution of examination statistics This report can be downloaded from SIRS using the following pathway:
This report provides a graphical presentation of the distribution of various marks/scores for students in a particular ATAR course at the school as a result of the marks adjustment process. The marks/scores include: examination marks, moderated school assessments and combined scores.
Where a course has a practical and written component, the distributions of each component are indicated on the graphs of examination marks and moderated school assessments.
STS036 – Statistical moderation and concurrent validity of school assessments This report can be downloaded from SIRS using the following pathway:
This report provides two important features of your school’s marks in relation to state-wide school marks. Your school is shown as a blue dot. Other schools are shown by solid green, solid red or hollow red dots.
The vertical axis shows the difference between the mean moderated school mark and the mean school mark at a school – a positive value shows that school marks have been moderated upwards, and a negative value shows they have been moderated downwards.
reports other reports
report type: statistics
report: STS029 – Distribution of Examination Statistics by Provider (All Courses)
reports other reports
report type: statistics
report: STS036 – Statistical moderation and concurrent validity of school assessments
Page 10 Explanatory notes: for Year 12 statistical reports December 2018
The horizontal axis shows the correlation between the school marks and the ATAR course examination marks at a school. A correlation of 0.7 or above (solid green dots) shows reasonable consistency, whereas values below 0.7 are considered poor (hollow red dots) or unacceptable (solid red dots). Correlations for schools with less than 10 students may not be reliable.
In the table your school may be highlighted with:
• a grey shade where the correlation is below 0.5 OR the mean moderated school mark is greater than 10 or less than –10 from the mean school mark, relative to the State difference.
• a pink shade where the correlation is below 0.5 AND the mean moderated school mark is greater than 10 or less than –10 from the mean school mark, relative to the State difference.
Where a school is in a small group moderation partnership the population is the moderation population of the small group moderation group.
Detailed Written Examination Feedback (Maximising Feedback): written – MF01, multiple choice – MF02 and practical – MF03 It should be noted that only a SIRS administrator (e.g. user name will be p**** and no alpha character (letter) after the school code) has initial access to the Detailed written examination feedback (Maximising feedback) reports. However, they can delegate this role to other staff. Details on how this can be done can be found in Section 2.4.2 Managing roles of other user accounts in the Data Procedures Manual which is available on the Authority website at https://www.scsa.wa.edu.au/publications/data-procedures-manual.
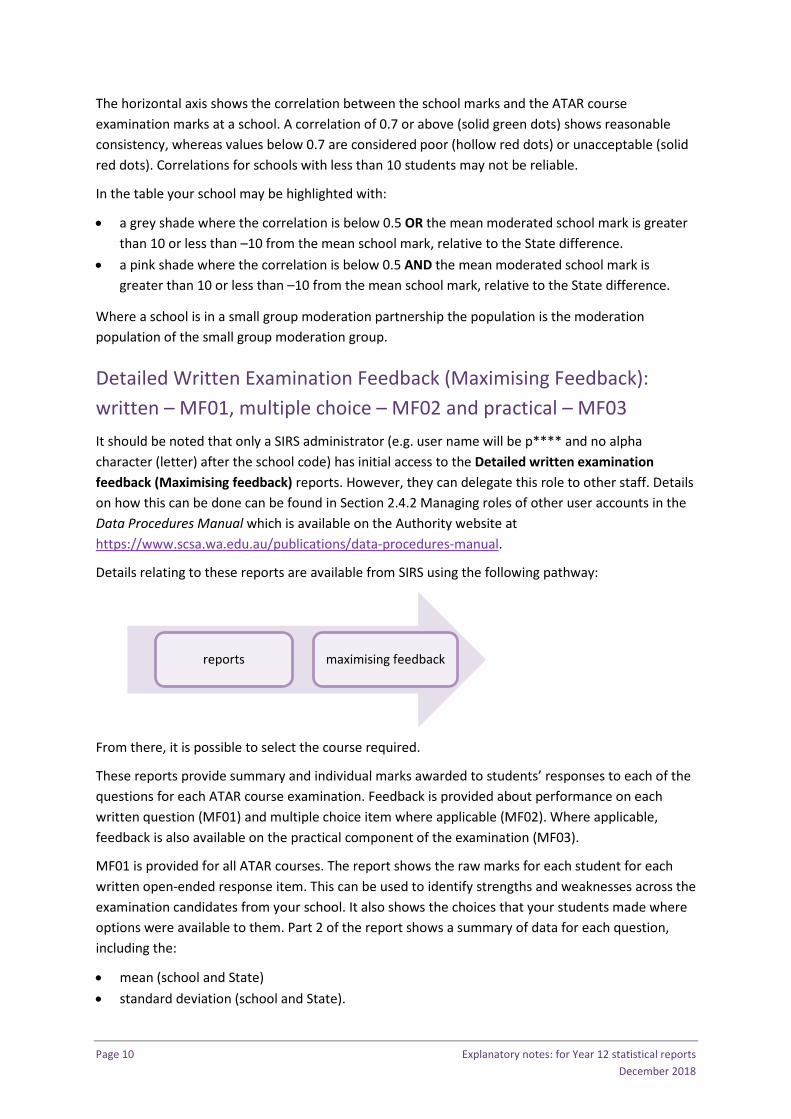
Details relating to these reports are available from SIRS using the following pathway:
From there, it is possible to select the course required.
These reports provide summary and individual marks awarded to students’ responses to each of the questions for each ATAR course examination. Feedback is provided about performance on each written question (MF01) and multiple choice item where applicable (MF02). Where applicable, feedback is also available on the practical component of the examination (MF03).
MF01 is provided for all ATAR courses. The report shows the raw marks for each student for each written open-ended response item. This can be used to identify strengths and weaknesses across the examination candidates from your school. It also shows the choices that your students made where options were available to them. Part 2 of the report shows a summary of data for each question, including the:
• mean (school and State) • standard deviation (school and State).
reports maximising feedback
Explanatory notes: for Year 12 statistical reports Page 11 December 2018
MF02 is provided for those ATAR courses that include multiple-choice questions. Part 1 of the report provides the school and State mean and standard deviation for the multiple-choice questions.
Part 2 is a distractor analysis for all candidates (the State), which provides for each question, the correct answer, the percentage of all candidates who answered correctly and the number of candidates who selected each distractor. Part 3 is the distractor analysis for the school, showing the number of students selecting each alternative (A, B, C, D) and the percentage who selected the correct answer.
Part 4 is a school diagnostic profile which compares the school data to the data for all candidates and identifies questions where the school performance indicates relative strengths or weaknesses. Part 5 is a student-item response table. Part 6 is a state-wide distribution of scores which shows the number and percentage of the candidates achieving each possible score.
MF03 is provided for those ATAR courses with a practical examination. Page 1 of this report shows the marks for each criterion and the total practical examination mark for each candidate at the school. Page 2 shows a summary of data for each criterion, including the:
• mean (school and State) • standard deviation (school and State).
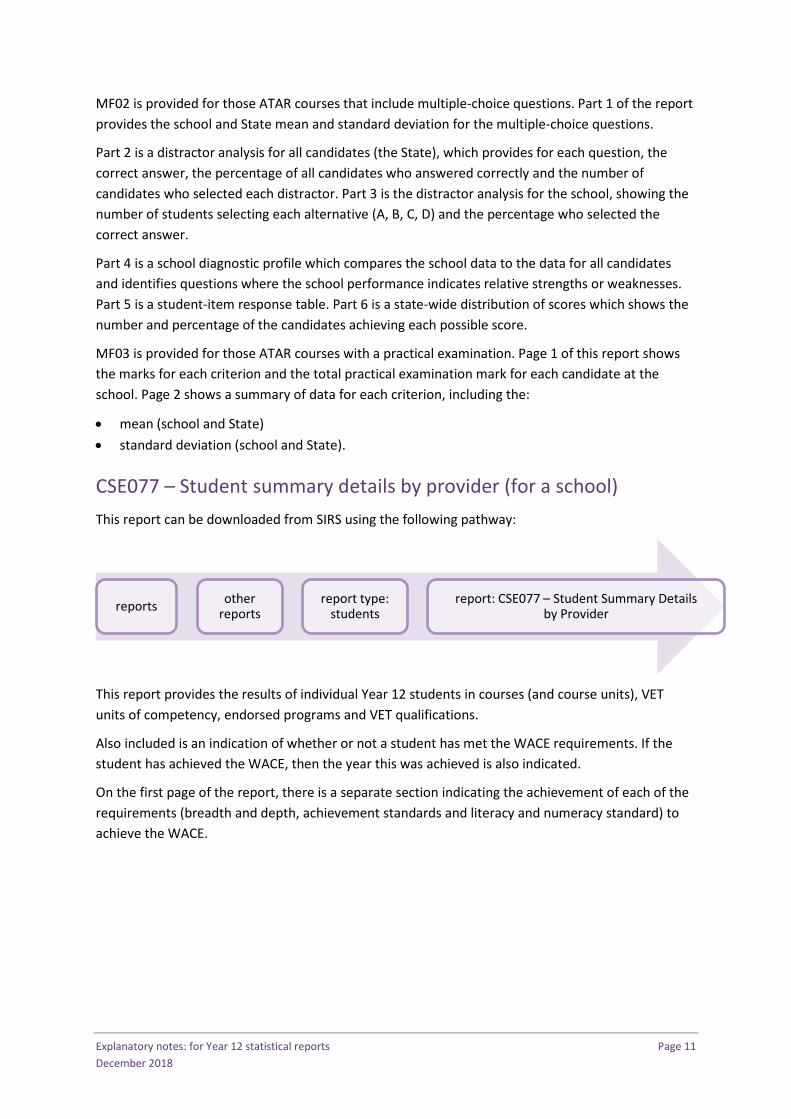
CSE077 – Student summary details by provider (for a school) This report can be downloaded from SIRS using the following pathway:
This report provides the results of individual Year 12 students in courses (and course units), VET units of competency, endorsed programs and VET qualifications.
Also included is an indication of whether or not a student has met the WACE requirements. If the student has achieved the WACE, then the year this was achieved is also indicated.
On the first page of the report, there is a separate section indicating the achievement of each of the requirements (breadth and depth, achievement standards and literacy and numeracy standard) to achieve the WACE.
reports other reports
report type: students
report: CSE077 – Student Summary Details by Provider
Page 12 Explanatory notes: for Year 12 statistical reports December 2018
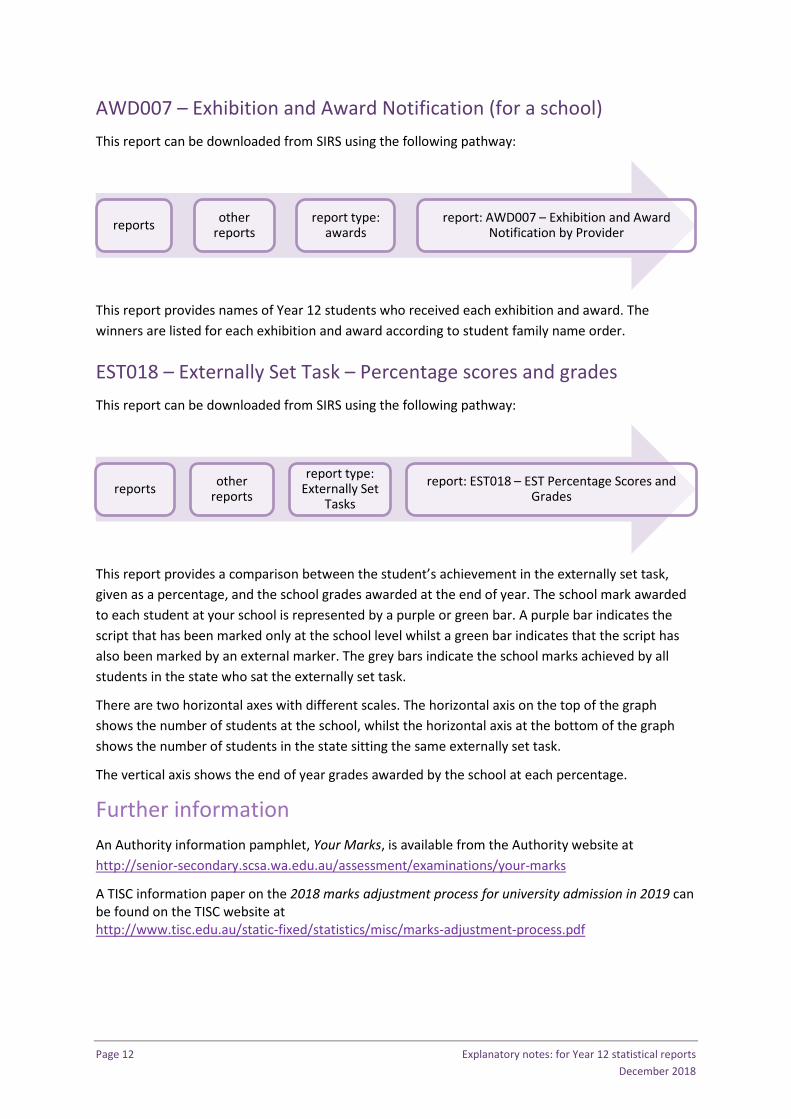
AWD007 – Exhibition and Award Notification (for a school) This report can be downloaded from SIRS using the following pathway:
This report provides names of Year 12 students who received each exhibition and award. The winners are listed for each exhibition and award according to student family name order.
EST018 – Externally Set Task – Percentage scores and grades This report can be downloaded from SIRS using the following pathway:
This report provides a comparison between the student’s achievement in the externally set task, given as a percentage, and the school grades awarded at the end of year. The school mark awarded to each student at your school is represented by a purple or green bar. A purple bar indicates the script that has been marked only at the school level whilst a green bar indicates that the script has also been marked by an external marker. The grey bars indicate the school marks achieved by all students in the state who sat the externally set task.
There are two horizontal axes with different scales. The horizontal axis on the top of the graph shows the number of students at the school, whilst the horizontal axis at the bottom of the graph shows the number of students in the state sitting the same externally set task.
The vertical axis shows the end of year grades awarded by the school at each percentage.
Further information An Authority information pamphlet, Your Marks, is available from the Authority website at http://senior-secondary.scsa.wa.edu.au/assessment/examinations/your-marks
A TISC information paper on the 2018 marks adjustment process for university admission in 2019 can be found on the TISC website at http://www.tisc.edu.au/static-fixed/statistics/misc/marks-adjustment-process.pdf
reports other reports
report type: awards
report: AWD007 – Exhibition and Award Notification by Provider
reports other reports
report type: Externally Set
Tasks
report: EST018 – EST Percentage Scores and Grades