experimental study on the influence of sulfate reducing...
TRANSCRIPT

Research ArticleExperimental Study on the Influence ofSulfate Reducing Bacteria on the Metallic Corrosion Behaviorunder Disbonded Coating
Qingmiao Ding,1 Liping Fang,2 Yanyu Cui,1 and YujunWang1
1Airport School, Civil Aviation University of China, Tianjin, China2Guangxi Colleges and Universities Key Laboratory of Beibu Gulf Oil and Natural Gas Resource Effective Utilization,Qinzhou University, Qinzhou 535011, China
Correspondence should be addressed to Qingmiao Ding; [email protected]
Received 20 April 2017; Accepted 18 July 2017; Published 23 October 2017
Academic Editor: Flavio Deflorian
Copyright © 2017 Qingmiao Ding et al.This is an open access article distributed under the Creative CommonsAttribution License,which permits unrestricted use, distribution, and reproduction in any medium, provided the original work is properly cited.
A rectangle disbonded coating simulation device was used to research the effect of sulfate reducing bacteria (SRB) on the metalliccorrosion behavior under disbonded coating by the electrochemical method. The results showed that the metal self-corrosionpotential at the same test point had little change in the initial experiment stage, whether the solution was without or with SRB.The potential amplitude in the solution with SRB was larger than that without SRB in the later corrosion period. The corrosioncurrent density of the metal at the same test point increased gradually over time in the solution with or without SRB, and SRB couldaccelerate the corrosion of the metal in the disbonded crevice. The metal self-corrosion potential in the crevice had little change inthe SRB solution environment after adding the fungicide, but the corrosion current density decreased significantly. That meant thegrowth and reproduction of SRB were inhibited after adding the fungicide, so the metal corrosion rate slowed down. Among thethree kinds of solution environment, increasing the coating disbonded thickness could accelerate the corrosion of the metal in thecrevice, and it was the largest in the solution with SRB.
1. Introduction
With the rapid development of buried pipeline construction,more and more attention had been paid to the problemof pipeline corrosion [1–5]. The buried pipelines werearranged in a crisscross pattern, and this would cause fireand explosion once they start to corrode and leak; thatwould threaten the personal safety and cause environmentalpollution. The anticorrosion coating of the buried pipelineoften had disbonded area with broken open holiday due tothe mechanical damage, aging and degradation, cathodicdisbondment, and other reasons in the process of pipelineinstallation and using [6–8]. It formed the special corrosiveenvironment between the anticorrosion coating and pipelinesurface, and themoisture, the soluble ion likeCO2 andO2 andother corrosive media in the soil got into the disbonded areathrough the holiday; that caused the corrosion of the metal
under the disbonded coating [9–11]. A large number of stud-ies showed that the content of moisture and bacteria in thebackfill soil was more than that in the original uncultivatedsoil, and that would cause microbial corrosion (MIC) dueto microbial activity under disbonded coating [12–14]. Thesulfate reducing bacteria (SRB) as a kind of microorganismwidely existed in soil, sea, river water, underground pipeline,oil gas well, and so on, and they made the pipeline moreprone to perforation in the solution with SRB. So the metalcorrosion caused by SRB in recent years was taking more andmore attention; there have been massive researches aboutSRB corrosion on emergence [15–18] and some reportingabout metal corrosion under disbanded coating [19, 20], butup to now, there was no study on the SRB corrosion behaviorunder disbonded coating. Therefore, we built a rectanglecrevice device for the metal corrosion under disbondedcoatings and researched the regularity of SRB corrosion on
HindawiInternational Journal of CorrosionVolume 2017, Article ID 9740817, 13 pageshttps://doi.org/10.1155/2017/9740817

2 International Journal of Corrosion
�e electrochemical tester
(1)(2)
(4)
(11)
(5)
(3)(13)
(7)
(8) (6)
(12)
(17)
(14)
(15)
(16)
(18)
(9) (10)
Figure 1: The experimental device. (1) Organic glass box; (2) soil simulated solution; (3) the saturated calomel electrode with salt-bridge;(4) auxiliary anode; (5) wire; (6) gap space; (7) bolt; (8) working electrode at test point 1; (9) working electrode at test point 2; (10) workingelectrode at test point 3; (11) electrochemical tester; (12) organic glass plate; (13) voltmeter; (14) the point of coating damage; (15) the spacer;(16) rubber plug; (17) epoxy resin board; (18) needle tubing.
the metal under disbonded coatings by the electrochemicalmethod. It is meaningful to the safe operation and long-termservice of the pipeline in the soil environment.
2. Experiment Content
2.1. Experimental Device. Experiment device was shown inFigure 1; we use the epoxy resin plate and organic glass plateof 30 cm × 10 cm × 0.5 cm while simulating the situation ofcoating disbonded, also we put a gasket of 0.5mm thicknessbetween them for regulating the thickness of simulationstripping gap. We drill a round hole of 1 cm diameter as point1 to simulate coating damage point on organic glass plate nearthe end of 7 cm and drill the round holes of 0.5 cm diameterat 80mm and 160mm from the damaged point, respectively,as the electrochemical parameters test point 2 and point 3.We set an organic glass box on point 1 of the organic glassplate to contain simulated soil solution and set the workingelectrodes, respectively, in the epoxy resin plate with points1∼3 in the organic glass plate while simulating the pipelinemetal under the disbonded coating.
2.2. The Experimental Material. The working electrode wasmade from X80 steel, and its chemical composition wasshown in Table 1. The sample was made of the smallcylindrical specimens, 10mm diameter, and the electrodesurface was polished successively with 60#∼2000# sandpaperby MP-2 metallographic sample pregrinding machine untilthe metal surface was smooth and there were no obvioussigns; then we washed away the surface oil with acetone andwashed away the surface residues water and acetone withanhydrous ethanol and then put it into the drying box for use.The reference electrode was saturated calomel electrode (inthis paper, if there were no special instructions, the potentialwas defined relatively to the saturated calomel referenceelectrode). The auxiliary electrode was platinum electrode.
The composition of the solution was as follows: 0.1712 gNa2SO4, 0.1600 g Na2CO3, 0.0865 g NaHCO3 0.5125 g NaCl,and 1 L distilled water.
SRB was selected as the experimental bacterial strain.The medium composition of SRB strains was as follows: 0.5 gKH2PO4, 0.06 g CaCl2, 0.06 g MgSO4⋅7H2O, 1.0 g NH4Cl,0.3 g C6H5Na3O7⋅2H2O, 6.0 g CH3CH(OH)COONa, 1.0 gyeast extract powder, and 1 L distilledwater.We put the ready-preparedmedium in the high temperature steam sterilizationpot (120∘C) to sterilize 30min before starting the experiment.We use glutaraldehyde (C5H8O2) as the fungicide.
2.3. The Experiment Content. The rectangle crevice devicewas used to study the SRB corrosion behavior of the metalin the crevice under the disbonded thickness of 0.5mm and1.0mm, respectively. The experimental period was 14 days,and we test the electrochemical impedance spectroscopy(EIS) and polarization curves by the electrochemical work-station in the test period.
3. The Experimental Results and Discussion
3.1. The SRB Corrosion Behavior of the Metal in DifferentSolution Environments. As shown in Figure 2 and Table 2,the self-corrosion potential of the metal in the crevice at thesame test point had a little change in the solution without orwith SRB in the initial stage when the disbonded thicknesswas 0.5mm, and it tended to be stable. But there was obviouspotential amplitude of self-corrosion potential in the laterstage, and the amplitude affected with SRB was much largerthan that without SRB. The self-corrosion potential of themetal without SRB was more negative than that with SRB.With the extension of time, the corrosion current density ofthe metal in the crevice gradually increased at the same testpoint in two solutions, and the corrosion current density ofthemetal affectedwith SRBwas significantly greater than that

International Journal of Corrosion 3
−0.6 −0.7 −0.8 −0.9−0.5
�e potential value (V)
−8.0
−7.5
−7.0
−6.5
−6.0
−5.5
−5.0
−4.5
−4.0
−3.5
−3.0
0 2 4 6 8 10
0
2
4
6
8
10
�e c
orro
sion
curr
ent/F
IAI(∗e−5
A)
With SRB-1 dWithout SRB-7 d
dWithout SRB-1 With SRB-7 dWithout SRB-14 dWith SRB-14 d
(a) The polarization curves of the damaged point indifferent time
−0.6 −0.7 −0.8 −0.9−0.5
�e potential value (V)
0
2
4
6
8
100 2 4 6 8 10
−8.0−8.5
−7.5−7.0−6.5−6.0−5.5−5.0−4.5−4.0−3.5−3.0−2.5
�e c
orro
sion
curr
ent/F
IAI(∗e−5
A)
With SRB-1 dWithout SRB-7 d
dWithout SRB-1 With SRB-7 dWithout SRB-14 dWith SRB-14 d
(b) The polarization curves of the point in the 80mmstripping depth
0 2 4 6 8 10
�e c
orro
sion
curr
ent/F
IAI(∗e−5
A)
0
2
4
6
8
10
−0.6 −0.7 −0.8 −0.9−0.5
�e potential value (V)
−9.0−8.5−8.0−7.5−7.0−6.5−6.0−5.5−5.0−4.5−4.0−3.5−3.0−2.5
With SRB-1 dWithout SRB-7 d
dWithout SRB-1 With SRB-7 dWithout SRB-14 dWith SRB-14 d
(c) The polarization curves of the point in the 160mmstripping depth
�e c
orro
sion
−0.6 −0.7 −0.8 −0.9−0.5
�e potential value (V)
0
2
4
6
8
100 2 4 6 8 10
−8.0
−7.5
−7.0
−6.5
−6.0
−5.5
−5.0
−4.5
−4.0
−3.5
−3.0
curr
ent/F
IAI(∗e−5
A)
Without SRB-0 mmWith SRB-0 mmWithout SRB-80 mm
With SRB-80 mmWithout SRB-160 mmWith SRB-160 mm
(d) The polarization curves of each point in the firstexperiment day
−0.6 −0.7 −0.8 −0.9−0.5
�e potential value (V)
0
2
4
6
8
100 2 4 6 8 10
�e c
orro
sion
curr
ent/F
IAI(∗e−5
A)
−8.0
−7.5
−7.0
−6.5
−6.0
−5.5
−5.0
−4.5
−4.0
−3.5
−3.0
Without SRB-0 mmWith SRB-0 mmWithout SRB-80 mm
With SRB-80 mmWithout SRB-160 mmWith SRB-160 mm
(e) The polarization curves of each point in the seventhexperiment day
−0.6 −0.7 −0.8 −0.9−0.5
�e potential value (V)
−8.0
−7.5
−7.0
−6.5
−6.0
−5.5
�e c
orro
sion
curr
ent/F
IAI(∗e−5
A)
−5.0
−4.5
−4.0
−3.5
−3.0
0
2
4
6
8
100 2 4 6 8 10
Without SRB-0 mmWith SRB-0 mmWithout SRB-80 mm
With SRB-80 mmWithout SRB-160 mmWith SRB-160 mm
(f) The polarization curves of each point in the fourteenthexperiment day
Figure 2: The polarization curves of the metal; the influence on the metal corrosion process with or without SRB.
4 International Journal of Corrosion
Table 1: The chemical composition of X80 steel (%).
C Si Mn Cr Mo Ni Al Cu Nb Ti Pb Fe0.042 0.189 1.560 0.028 0.243 0.230 0.034 0.153 0.060 0.019 0.005 97.464
Table 2: The electrochemical parameters.
Simulated solution Experimenttime
Strippingdepths/mm
The corrosion currentdensity/𝜇A/cm2
The self-corrosionpotential/mV
The ratio of anode Tafelslope and cathode Tafel
slope
Soil simulatedsolution(No. 1)
1 d0 23.1029 −702 1.732880 19.2514 −722 1.6538160 11.5943 −718 1.5963
7 d0 43.7829 −708 1.572680 30.3086 −722 1.5250160 26.0457 −725 1.4844
14 d0 45.2457 −701 1.411180 32.3429 −717 1.4049160 27.7543 −723 1.4831
Soil simulatedsolution +SRB(No. 2)
1 d0 25.8171 −688 1.813480 20.2457 −696 1.6897160 19.5143 −700 1.6727
7 d0 30.9143 −688 1.750980 28.4971 −692 1.7250160 21.7143 −695 1.6395
14 d0 78.5143 −675 1.751580 87.6457 −680 1.2216160 95.4914 −676 1.0870
Soil simulatedsolution +SRB +fungicide(No. 3)
1 d0 16.3886 −694 1.985980 19.0400 −692 1.4779160 21.2457 −696 1.3274
7 d0 32.4343 −698 1.624380 40.1143 −732 1.4063160 43.4286 −691 1.4588
14 d0 45.6114 −684 1.415780 58.8800 −689 1.4475160 64.1714 −684 1.4206
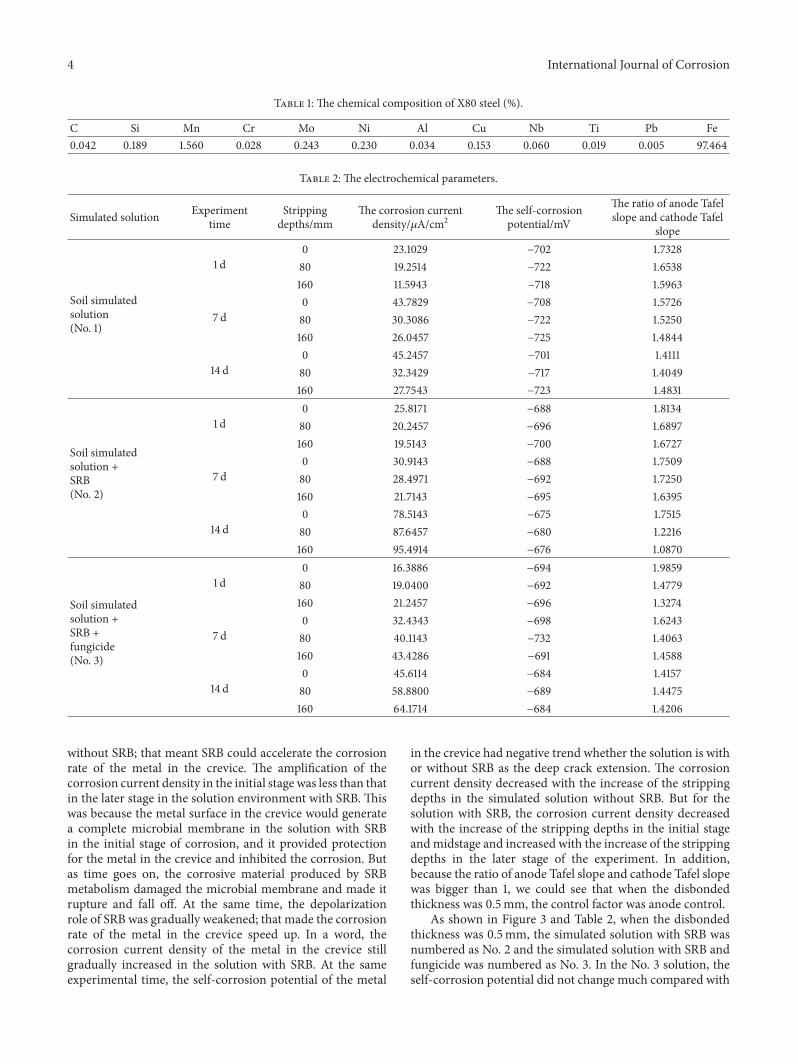
without SRB; that meant SRB could accelerate the corrosionrate of the metal in the crevice. The amplification of thecorrosion current density in the initial stage was less than thatin the later stage in the solution environment with SRB. Thiswas because the metal surface in the crevice would generatea complete microbial membrane in the solution with SRBin the initial stage of corrosion, and it provided protectionfor the metal in the crevice and inhibited the corrosion. Butas time goes on, the corrosive material produced by SRBmetabolism damaged the microbial membrane and made itrupture and fall off. At the same time, the depolarizationrole of SRB was gradually weakened; that made the corrosionrate of the metal in the crevice speed up. In a word, thecorrosion current density of the metal in the crevice stillgradually increased in the solution with SRB. At the sameexperimental time, the self-corrosion potential of the metal
in the crevice had negative trend whether the solution is withor without SRB as the deep crack extension. The corrosioncurrent density decreased with the increase of the strippingdepths in the simulated solution without SRB. But for thesolution with SRB, the corrosion current density decreasedwith the increase of the stripping depths in the initial stageandmidstage and increased with the increase of the strippingdepths in the later stage of the experiment. In addition,because the ratio of anode Tafel slope and cathode Tafel slopewas bigger than 1, we could see that when the disbondedthickness was 0.5mm, the control factor was anode control.
As shown in Figure 3 and Table 2, when the disbondedthickness was 0.5mm, the simulated solution with SRB wasnumbered as No. 2 and the simulated solution with SRB andfungicide was numbered as No. 3. In the No. 3 solution, theself-corrosion potential did not change much compared with

International Journal of Corrosion 5
With SRB and antiseptic-14 d
�e c
orro
sion
curr
ent/F
IAI(∗e−5
A)
−0.6 −0.7 −0.8 −0.9−0.5
�e potential value (V)
−8.0−7.5−7.0−6.5−6.0−5.5−5.0−4.5−4.0−3.5−3.0
0 2 4 6 8 10
0
2
4
6
8
10
With SRB-1 d
With SRB-7 d
With SRB and antiseptic-1 d
With SRB and antiseptic-7 d
dWith SRB-14
(a) The polarization curves of the damaged point indifferent time
�e c
orro
sion
curr
ent/F
IAI(∗e−5
A)
−0.6 −0.7 −0.8 −0.9−0.5
�e potential value (V)
0
2
4
6
8
100 2 4 6 8 10
−8.0−7.5−7.0−6.5−6.0−5.5−5.0−4.5−4.0−3.5−3.0
With SRB-1 d
With SRB-7 d
With SRB and antiseptic-1 d
With SRB and antiseptic-7 d
With SRB and antiseptic-14 d
dWith SRB-14
(b) The polarization curves of the point in the80mm stripping depth
−0.6 −0.7 −0.8 −0.9 −1.0−0.5
�e potential value (V)
0
2
4
6
8
100 2 4 6 8 10
�e c
orro
sion
−8.0−7.5−7.0−6.5−6.0−5.5−5.0−4.5−4.0−3.5−3.0
curr
ent/F
IAI(∗e−5
A)
With SRB and antiseptic-14 d
With SRB-1 d
With SRB-7 d
With SRB and antiseptic-1 d
With SRB and antiseptic-7 d
dWith SRB-14
(c) The polarization curves of the point in the160mm stripping depth
−0.6 −0.7 −0.8 −0.9−0.5
�e potential value (V)
0
2
4
6
8
100 2 4 6 8 10
−8.0−7.5−7.0−6.5−6.0−5.5−5.0−4.5−4.0−3.5−3.0
�e c
orro
sion
curr
ent/F
IAI(∗e−5
A)
With SRB-0 mm
With SRB-80 mm
With SRB and antiseptic-0 mm With SRB-160 mm
With SRB and antiseptic-80 mm
With SRB and antiseptic-160 mm
(d) Thepolarization curves of each point in the firstexperiment day
−0.6 −0.7 −0.8 −0.9−0.5
�e potential value (V)
−8.0−7.5−7.0−6.5−6.0−5.5−5.0−4.5−4.0−3.5−3.0
�e c
orro
sion
curr
ent/F
IAI(∗e−5
A)
0 2 4 6 8 10
0
2
4
6
8
10
With SRB-0 mm
With SRB-80 mm
With SRB and antiseptic-0 mm With SRB-160 mm
With SRB and antiseptic-80 mm
With SRB and antiseptic-160 mm
(e) The polarization curves of each point in theseventh experiment day
−8.0−7.5−7.0−6.5−6.0−5.5−5.0−4.5
�e c
orro
sion
curr
ent/F
IAI(∗e−5
A)
−4.0−3.5−3.0
0 2 4 6 8 10
0
2
4
6
8
10
−0.6 −0.7 −0.8 −0.9−0.5
�e potential value (V)
With SRB-0 mm
With SRB-80 mm
With SRB and antiseptic-0 mm With SRB-160 mm
With SRB and antiseptic-80 mm
With SRB and antiseptic-160 mm
(f) The polarization curves of each point in thefourteenth experiment day
Figure 3: The polarization curves of the influence on the metal corrosion process with or without fungicide.

6 International Journal of Corrosion
Table 3: The polarization resistance under the disbonded coatings in different solution environment in the seventh experiment day/Ω.
Simulated solution At the damagepoint/mm
At the point of 80mmstripping depth/mm
At the point of 160mmstripping depth/mm
Soil simulated solution 1426.4 3246.3 3231.6Soil simulated solution + SRB 955.1 1632.7 1803.1Soil simulated solution + SRB +Fungicide 919.3 1290.7 1408.1
that in the No. 2 solution, but the corrosion current densitysignificantly decreased.Thatmeant the growth and reproduc-tion of SRB would be inhibited after adding the fungicideand then slowed down the corrosion rate of the metal in thecrevice. As the experiment time goes on, the self-corrosionpotential at the same test point shifted toward negative beforeshifting toward positive, and the corrosion current densityincreased. This was because fungicide, although inhibitingthe growth and reproduction of SRB, meanwhile damagedthe integrity of metal surface microbiofilm and made themicrobial film protection reduce, so the corrosion speedwas still very fast. At the same test time, the self-corrosionpotential did not change much with the increase of thestripping depths, but the corrosion current density increased;that was different from the solution only with SRB. Inaddition,we also could see thatwhen the disbonded thicknesswas 0.5mm, the control factor of the corrosion in No. 3solution was anode control in the crevice at different testpoint. During the whole experimental period, the change ofthis ratio presented the irregularity obviously; it was indicatedthat the motion of charged particles in the SRB solution wasirregular after adding the fungicide, and the speed changewaslarger than before, so the conversion trend of anode controlin the whole corrosion process was not obvious.
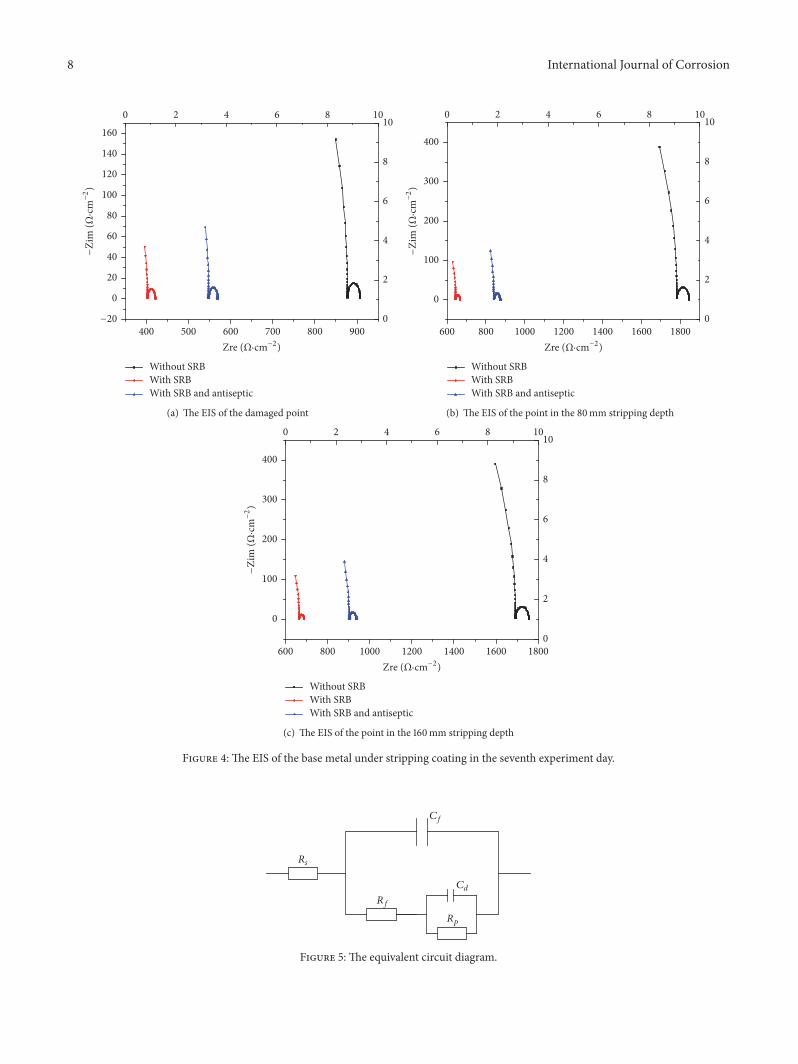
In order to accurately analyze the electrochemical impe-dance spectroscopywhichwas shown in Figure 4, the electro-chemical impedance spectroscopy under different conditionswas fitted through ZSimpWin software in this article. We useelectrochemical equivalent circuit C (CR (CR)) comprised ofresistance𝑅 and capacitance𝐶 to represent the electrode pro-cess. The equivalent circuit diagram was shown in Figure 5.𝑅𝑠 was the solution resistance between the reference
electrode and the working electrode in the crevice. 𝐶𝑓 wasthe capacitor of adsorption film formed on the corrosionmetal surface. 𝑅𝑓 was the adsorption film resistance formedon corrosion metal surface due to the microbial attachment.𝐶𝑑 was the double layer capacitance between the metalsurface and the electrolyte solution. 𝑅𝑝 was the polarizationresistance; it was associated with Faraday process and anodicreaction; thus it could reflect the corrosion well, so we woulduse 𝑅𝑝 to characterize the corrosion rate.
As shown in Figure 5, when the disbonded thickness was0.5mm, the EIS of every point in the crevice in differentsimulated solution environment in the seventh experimentday was composed of single high-frequency capacitanceand single low-frequency capacitance. The high-frequencysection corresponded to the impedance signal of the corro-sion product, and low-frequency section was the corrosionreaction of metal substrate. At the same stripping depths, the
capacitance arc radius of the metal in solution No. 2 wasthe minimum, and the capacitance in solution No. 3 camesecond; the capacitance of the solution without SRB was themaximum. That meant the corrosion resistance of the metalunder the disbonded coating in the solution with SRB wasthe worst, and the corrosion was the most serious. In thesolution environment with SRB, the fungicide is added, thecorrosion resistance of themetal under the disbonded coatingwas enhanced, but the corrosionwas still very serious, and thecapacitance arc radius was far less than that in the solutionwithout SRB. In addition, according to the polarizationresistance of various points in the crevice in different solutionenvironment from Table 3, we could see that the polarizationresistance of the metal in the crevice in the solution with SRBwas the minimum, the solution with SRB and the fungicideadded came second, and they were far less than that withoutSRB. Therefore, the presence of SRB in the solution wouldreduce the resistance of the metal corrosion process in thedisbonded crevice, which meant that SRB could acceleratethe corrosion rate of the metal in the disbonded crevice. Theresults above were consistent with the conclusions obtainedby the method of polarization curves analysis.
3.2. The Effect of SRB on Corrosion Behavior of the Metalunder Different Disbonded Thickness. According to the elec-trochemical parameters in Table 4, in the above three kindsof simulated solution, with the increase of the coatingdisbonded thickness, the self-corrosion potential of themetalin the crevice shifted negatively and the corrosion currentdensity increased obviously. As shown in Figure 6, when thecoating disbonded thickness increased in the simulated solu-tion without SRB, the crevice space became larger, and thedissolved oxygen content increased, and that accelerated thecorrosion rate of the metal in the crevice. At the same experi-ment time, the increase amplitude of themetal corrosion cur-rent density in the crevice at the distance of 160mmwas signi-ficantly higher than that of 80mm and that at damagedpoint; thatmeant the crevice thickness increased, of themetalwhich at the longer distance in the crevice had also beensupplemental oxygen. In the simulated solution with SRB, asshown in Figure 7, increasing the coating disbonded thick-ness, the amplitude of the metal corrosion current density inthe crevice was significantly greater than the other two kinds;that meant larger aperture space was suitable for the growthand reproduction of SRB, improving the activity of SRB in thecrevice, thus greatly accelerating the corrosion rate of metalin the crevice. As shown in Figure 8, when the fungicidewas added to the simulated SRB solution, the amplitude ofthe metal corrosion current density in the initial experiment

International Journal of Corrosion 7
Table 4: The electrochemical parameters.
Simulatedsolution
Experimenttime
Strippingdepths/mm
Disbondedthickness(mm)
The corrosion currentdensity/𝜇A/cm2
The self-corrosionpotential/mV
The ratio of anode Tafelslope and cathode Tafel
slope
Soilsimulatedsolution
1 d
0 0.5 23.1029 −702 1.73281.0 35.1429 −719 1.6204
80 0.5 19.2514 −722 1.65381.0 35.3486 −724 1.7384
160 0.5 11.5943 −718 1.59631.0 34.3171 −718 1.5686
7 d
0 0.5 43.7829 −708 1.57261.0 38.2800 −719 1.4733
80 0.5 30.3086 −722 1.52501.0 38.1543 −717 1.3973
160 0.5 26.0457 −725 1.48441.0 36.8343 −716 1.3790
14 d
0 0.5 45.2457 −701 1.41111.0 45.8971 −718 1.4050
80 0.5 32.3429 −717 1.40491.0 48.0971 −720 1.3542
160 0.5 27.7543 −723 1.48311.0 46.9549 −713 1.3135
Soilsimulatedsolution +SRB
1 d
0 0.5 25.8171 −688 1.81341.0 35.6800 −707 1.8220
80 0.5 20.2457 −696 1.68971.0 31.9029 −710 1.6832
160 0.5 19.5143 −700 1.67271.0 31.7543 −705 1.6649
7 d
0 0.5 30.9143 −688 1.75091.0 66.9429 −692 1.7047
80 0.5 28.4971 −692 1.72501.0 67.3714 −706 1.6529
160 0.5 21.7143 −695 1.63951.0 65.6229 −701 1.5372
14 d
0 0.5 78.5143 −675 1.75151.0 100.4343 −692 1.5221
80 0.5 87.6457 −680 1.22161.0 96.6857 −710 1.4924
160 0.5 95.4914 −676 1.08701.0 98.8457 −701 1.4101
Soilsimulatedsolution +SRB +fungicide
1 d
0 0.5 16.3886 −694 1.98591.0 33.6514 −708 1.9256
80 0.5 19.0400 −692 1.47791.0 34.5714 −719 1.5530
160 0.5 21.2457 −696 1.32741.0 32.9943 −713 1.6431
7 d
0 0.5 33.4433 −698 1.62431.0 54.1429 −695 1.7249
80 0.5 43.1143 −732 1.40631.0 51.7086 −703 1.7372
160 0.5 47.4286 −691 1.45881.0 50.7714 −696 1.5878
14 d
0 0.5 48.6114 −684 1.41571.0 79.0457 −690 1.6985
80 0.5 63.8800 −689 1.44751.0 77.1771 −712 1.4383
160 0.5 75.1714 −684 1.42061.0 78.0971 −700 1.4900
8 International Journal of Corrosion
Without SRBWith SRBWith SRB and antiseptic
500 600 700 800 900400Zre (Ω·cG−2)
0
2
4
6
8
100 2 4 6 8 10
−20
0
20
40
60
80
100
120
140
160
−:CG
(Ω·cG
−2)
(a) The EIS of the damaged point
Without SRBWith SRBWith SRB and antiseptic
0
100
200
300
400
−:CG
(Ω·cG
−2)
800 1000 1200 1400 1600 1800600Zre (Ω·cG−2)
0 2 4 6 8 10
0
2
4
6
8
10
(b) The EIS of the point in the 80mm stripping depth
Without SRBWith SRBWith SRB and antiseptic
800 1000 1200 1400 1600 1800600Zre (Ω·cG−2)
0
2
4
6
8
100 2 4 6 8 10
0
100
200
300
400
−:CG
(Ω·cG
−2)
(c) The EIS of the point in the 160mm stripping depth
Figure 4: The EIS of the base metal under stripping coating in the seventh experiment day.
Cd
Rf
Rs
Cf
Rp
Figure 5: The equivalent circuit diagram.

International Journal of Corrosion 9
−0.60 −0.65 −0.70 −0.75 −0.80 −0.85 −0.90−0.55
�e potential value (V)
0
2
4
6
8
100 2 4 6 8 10
−8.5
−8.0
−7.5
−7.0
−6.5
−6.0
−5.5
−5.0
−4.5
−4.0
0.5-1 d1.0-1 d0.5-7 d
1.0-7 d
1.0- d14
0.5- d14
FIAI(∗e−5
A)
�e c
orro
sion
curr
ent/
(a) The polarization curves of the damaged point in different time
−0.60 −0.65 −0.70 −0.75 −0.80 −0.85 −0.90−0.55
�e potential value (V)
0 2 4 6 8 10
0
2
4
6
8
10
−8.5
−8.0
−7.5
−7.0
−6.5
−6.0
−5.5
−5.0
−4.5
−4.0
0.5-1 d1.0-1 d0.5-7 d
1.0-7 d
1.0- d14
0.5- d14
FIAI(∗e−5
A)
�e c
orro
sion
curr
ent/
(b) The polarization curves of the point in the 80mm stripping depth
−8.5
−8.0
−7.5
−7.0
−6.5
−6.0
−5.5
−5.0
−4.5
−4.0
−0.60 −0.65 −0.70 −0.75 −0.80 −0.85 −0.90−0.55
�e potential value (V)
0
2
4
6
8
100 2 4 6 8 10
0.5-1 d1.0-1 d0.5-7 d
1.0-7 d
1.0- d14
0.5- d14
�e c
orro
sion
curr
ent/F
IAI(∗e−5
A)
(c) The polarization curves of the point in the 160mm stripping depth
Figure 6: The polarization curves of various points of the metal substrate in the disbonded crevice under different disbonded thickness inthe simulated solution without SRB.
stage was significantly higher than that in the later stage ofcorrosion with the increase of the coating disbonded thick-ness. In addition, the ratio of anode Tafel slope and cathodeTafel slope was still more than 1 after increasing the coatingdisbonded thickness in these three kinds of simulated solu-tion, so the control factor of the corrosion was anode control,but as the coating disbonded thickness increases this ratiohad a decreasing trend with and without SRB. The anodecontrol trend was gradually weakened, but this ratio had anincreasing trend in the solution environment with SRB and
added fungicide, and the anode control trend was graduallyenhanced.
The EIS used the ZSimpWin software for fitting.The elec-trochemical equivalent circuit C (CR (CR)) was composed ofa resistance 𝑅 and a capacitance 𝐶 to represent the electrodeprocess, the equivalent circuit diagram was the same asFigure 5, and there was no longer a detailed introduction.
As shown in Figure 9, when the stripping depth was80mm, the capacitance arc radius of the disbonded thicknessof 0.5mmwas bigger than that of 1.0mm in the three kinds of

10 International Journal of Corrosion
−0.60 −0.65 −0.70 −0.75 −0.80 −0.85 −0.90−0.55
�e potential value (V)
−8.5
−8.0
−7.5
−7.0
−6.5
−6.0
−5.5
−5.0
−4.5
−4.0
−3.5
−3.0
0 2 4 6 8 10
0
2
4
6
8
10
FIAI(∗e−5
A)
0.5-1 d1.0-1 d0.5-7 d
1.0-7 d
1.0- d14
0.5- d14
�e c
orro
sion
curr
ent/
(a) The polarization curves of the damaged point in different time
−0.60 −0.65 −0.70 −0.75 −0.80 −0.85 −0.90−0.55
�e potential value (V)
−8.5
−8.0
−7.5
−7.0
−6.5
−6.0
−5.5
−5.0
−4.5
−4.0
−3.5
−3.0
0
2
4
6
8
100 2 4 6 8 10
FIAI(∗e−5
A)
0.5-1 d1.0-1 d0.5-7 d
1.0-7 d
1.0- d14
0.5- d14
�e c
orro
sion
curr
ent/
(b) The polarization curves of the point in the 80mm stripping depth
−0.60 −0.65 −0.70 −0.75 −0.80 −0.85 −0.90−0.55
�e potential value (V)
−8.5
−8.0
−7.5
−7.0
−6.5
−6.0
−5.5
−5.0
−4.5
−4.0
−3.5
−3.0
0 2 4 6 8 10
0
2
4
6
8
10
FIAI(∗e−5
A)
0.5-1 d1.0-1 d0.5-7 d
1.0-7 d
1.0- d14
0.5- d14
�e c
orro
sion
curr
ent/
(c) The polarization curves of the point in the 160mm stripping depth
Figure 7: The polarization curves of various points of the metal substrate in the disbonded crevice under different disbonded thickness inthe simulated solution with SRB.
simulated solution in the seventh day. That meant the corro-sion resistance of the metal in the crevice with the disbondedthickness 1.0mm was worse; the corrosion was more serious.In addition, according to the polarization resistance of themetal in Table 5, we could see that the polarization resistanceof the metal in the crevice at the thickness of 0.5mm wasbigger than that of 1.0mm in these three kinds of simulatedsolution, and the difference of the polarization resistanceof the metal in the solution with SRB was the maximum.Therefore, increasing the coating disbonded thickness wouldenhance the resistance of the metal corrosion process, and
it also could accelerate the corrosion rate of the metal inthe disbonded crevice. The change of the coating disbondedthickness had a far greater impact on the corrosion rate of themetal in the simulated solution with SRB. The results abovewere consistent with the conclusions obtained by the methodof polarization curve analysis.
4. Conclusion
(1) Whether the simulated solution is without or with SRB,the self-corrosion potential of the metal in the crevice under

International Journal of Corrosion 11
0
2
4
6
8
10
−0.60 −0.65 −0.70 −0.75 −0.80 −0.85 −0.90−0.55
�e potential value (V)
0 2 4 6 8 10
−8.5
−8.0
−7.5
−7.0
−6.5
−6.0
−5.5
−5.0
−4.5
−4.0
−3.5
−3.0
�e c
orro
sion
curr
ent/F
IAI(∗e−5
A)
0.5-1 d1.0-1 d0.5-7 d
1.0-7 d
1.0- d14
0.5- d14
(a) The polarization curves of the damaged point in different time
−0.60 −0.65 −0.70 −0.75 −0.80 −0.85 −0.90−0.55
�e potential value (V)
−8.5
−8.0
−7.5
−7.0
−6.5
−6.0
−5.5
−5.0
−4.5
−4.0
−3.5
−3.0
0 2 4 6 8 10
0
2
4
6
8
10
0.5-1 d1.0-1 d0.5-7 d
1.0-7 d
1.0- d14
0.5- d14
FIAI(∗e−5
A)
�e c
orro
sion
curr
ent/
(b) The polarization curves of the point in the 80mm stripping depth
0 2 4 6 8 10
0
2
4
6
8
10
−8.5
−8.0
−7.5
−7.0
−6.5
−6.0
−5.5
−5.0
−4.5
−4.0
−3.5
−3.0
−0.60 −0.65 −0.70 −0.75 −0.80 −0.85 −0.90−0.55
�e potential value (V)
FIAI(∗e−5
A)
0.5-1 d1.0-1 d0.5-7 d
1.0-7 d
1.0- d14
0.5- d14
�e c
orro
sion
curr
ent/
(c) The polarization curves of the point in the 160mm stripping depth
Figure 8: The polarization curves of various points of the metal substrate in the disbonded crevice under different disbonded thickness inthe simulated solution with SRB and fungicide.
Table 5: The polarization resistance of the metal at the distance of 80mm under different disbonded thickness/Ω.
The disbondeddistance/mm The experiment time The simulated solution The disbonded
thickness/mm 𝑅𝑝/Ω
80
Soil simulated solution 0.5 3246.31.0 3090.4
7 d Soil simulated solution + SRB 0.5 1632.71.0 1152.4
Soil simulated solution + SRB + fungicide 0.5 1321.21.0 1290.7

12 International Journal of Corrosion
1700
1880
1740
1860
1820
1800
1960
1980
1780
1760
1900
1920
1940
1720
1840
2000
2020
1680
Zre (Ω·cG−2)
0
2
4
6
8
100 2 4 6 8 10
0
100
200
300
400
500
−:CG
(Ω·cG
−2)
0.5mm1.0 mm(a) The EIS of the solution without SRB
0 2 4 6 8 10
0
2
4
6
8
10
0
20
40
60
80
100
−:CG
(Ω·cG
−2)
665
660
655
650
635
645
640
670
605
600
610
590
625
620
615
595
630
Zre (Ω·cG−2)0.5mm1.0 mm(b) The EIS of the solution with SRB
650 700 750 800 850 900600Zre (Ω·cG−2)
0
2
4
6
8
100 2 4 6 8 10
0
20
40
60
80
100
120
140
−:CG
(Ω·cG
−2)
0.5mm1.0 mm
(c) The EIS of the solution with SRB and adding the fungicide
Figure 9: The EIS of the metal at the distance of 80mm under different disbonded thickness in the seventh experiment day.
the same disbonded distance had little change in the initialexperiment stage. In the later stage, the self-corrosion poten-tial of the metal in the crevice had amplitude obviously, andthe amplitude in the SRB solution environment was greaterthan that without SRB. With the extension of the experi-ment time, whether the solution is without or with SRB, thecorrosion current density of themetal in the crevice under thesame disbonded distance increased gradually, and the corro-sion current density of the metal in the crevice in the simu-lated solution with SRB was significantly greater than thatwithout SRB; that meant SRB could accelerate the corrosionof the metal in the disbonded crevice.
(2) In the SRB solution where the fungicide was addedat the same time, the self-corrosion potential of the metal inthe disbonded crevice did not change much, but the corro-sion current density significantly decreased; that meant the
growth and reproduction of SRB were inhibited after addingthe fungicide, so as to slow down the corrosion rate of themetal in the crevice. With the experiment time extension,the self-corrosion potential of the metal in the crevice shiftednegatively before moving to positive direction at the samedepths, but the corrosion current density was increasing.When the experimental time was the same, with the increaseof the coating disbonded depths, the self-corrosion potentialof the metal in the crevice did not change much, but thecorrosion current density increased.
(3) In the three kinds of simulated solution, with theincrease of the coating disbonded thickness, the self-corro-sion potential of the metal in the disbonded crevice shiftednegatively, and the corrosion current density increased sig-nificantly. It indicated that increasing the coating disbondedthickness could accelerate the corrosion of the metal in the

International Journal of Corrosion 13
crevice, and in the simulated solutionwith SRB, the amplitudeof the corrosion current density of themetal in the crevicewasgreater than that in other two kinds of solution.
Conflicts of Interest
The authors declare that there are no conflicts of interestregarding the publication of this article.
Acknowledgments
The research work was supported by the Central CollegeFoundation of CAUC (3122017038), the Opening Projectof Guangxi Colleges and Universities Key Laboratory ofBeibu Gulf Oil and Natural Gas Resource Effective Utiliza-tion (2016KLOG21), and the National Science Foundation(U1633111).
References
[1] I. U. L. Xu and W. Xiaoyu, “The research of oil and gas pipelinecorrosion and protection technology,” inAdvances in PetroleumExploration and Development, vol. 7, pp. 102–105, 2014.
[2] D. B. Yadav,K. S. Jha, andR.Kumar, “PipelineCorrosion in a 24”dia Crude Oil Pipeline due to Interference from High VoltageAC Transmission Line: A Case Study,” in Proceedings of the 10thPipeline Technology Conference 2015, EITEP Institute, 2015.
[3] G. Cui, Z.-L. Li, C. Yang, and M. Wang, “The influence of DCstray current on pipeline corrosion,” Petroleum Science, vol. 13,no. 1, pp. 135–145, 2016.
[4] Y. Liu, B. Zhang, Y. Zhang, L.Ma, and P. Yang, “Electrochemicalpolarization study on crude oil pipeline corrosion by the pro-duced water with high salinity,” Engineering Failure Analysis,vol. 60, pp. 307–315, 2016.
[5] H. Tian and Y. Frank Cheng, “Novel inhibitors containingmulti-functional groups for pipeline corrosion inhibition inoilfield formation water,” Corrosion, vol. 72, no. 4, pp. 472–485,2016.
[6] S. Lyon, R. Bingham, and D. Mills, “Advances in corrosion pro-tection by organic coatings: what we know and what we wouldlike to know,”Progress inOrganic Coatings, vol. 102, pp. 2–7, 2017.
[7] B. T. Richards,M. R. Begley, andH. N. G.Wadley, “Mechanismsof ytterbiummonosilicate/mullite/silicon coating failure duringthermal cycling in water vapor,” Journal of the AmericanCeramic Society, vol. 98, no. 12, pp. 4066–4075, 2015.
[8] A. A. Vereschaka, B. Y. Mokritskii, N. N. Sitnikov, G. V. Ogan-yan, and A. Y. Aksenenko, “Study of mechanism of failure andwear ofmulti-layered composite nano-structured coating basedon system Ti-TiN-(ZrNbTi)N deposited on carbide substrates,”Journal of Nano Research, vol. 45, pp. 110–123, 2017.
[9] F. Varela, M. Forsyth, and M. Y. J. Tan, “Electrochemicallymonitoring localized corrosion patterns and CP effectivenessunder disbonded coatings,” NACE - International CorrosionConference Series, vol. 2015-, 2015.
[10] Y. A. N. Maocheng, X. U. Jin, Y. U. Libao, W. U. Tangqing, S. U.N. Cheng, andK. E.Wei, “EIS analysis on stress corrosion initia-tion of pipeline steel under disbonded coating in near-neutralpH simulated soil electrolyte,” Corrosion Science, vol. 110, pp.23–34, 2016.
[11] Y. Chen, “Electrochemical impedance spectroscopy study forcathodic disbonding test technology on three layer polyethylene
anticorrosive coating under full immersion and alternatingdry–wet environments,” International Journal of ElectrochemicalScience, pp. 10884–10894, 2016.
[12] D. Xu, Y. Li, and T. Gu, “Mechanistic modeling of biocorrosioncaused by biofilms of sulfate reducing bacteria and acid produc-ing bacteria,” Bioelectrochemistry, vol. 110, pp. 52–58, 2016.
[13] D. Xu and T. Gu, “Carbon source starvation triggered moreaggressive corrosion against carbon steel by the Desulfovibriovulgaris biofilm,” International Biodeterioration and Biodegra-dation, vol. 91, pp. 74–81, 2014.
[14] D. Xu, Y. Li, F. Song, and T. Gu, “Laboratory investigation ofmicrobiologically influenced corrosion of C1018 carbon steelby nitrate reducing bacteriumBacillus licheniformis,”CorrosionScience, vol. 77, pp. 385–390, 2013.
[15] H. Venzlaff, D. Enning, J. Srinivasan et al., “Accelerated cathodicreaction in microbial corrosion of iron due to direct electronuptake by sulfate-reducing bacteria,” Corrosion Science, vol. 66,pp. 88–96, 2013.
[16] D. Enning and J. Garrelfs, “Corrosion of iron by sulfate-reducing bacteria: New views of an old problem,” Applied andEnvironmental Microbiology, vol. 80, no. 4, pp. 1226–1236, 2014.
[17] S. Chen, P.Wang, and D. Zhang, “Corrosion behavior of copperunder biofilm of sulfate-reducing bacteria,” Corrosion Science,vol. 87, pp. 407–415, 2014.
[18] M. G. Chesnokova, V. V. Shalaj, Y. A. Kraus et al., “Analysis ofcorrosion defects on oil pipeline surface using scanning elec-tron microscopy and soil thionic and sulfate-reducing bacteriaquantification,” Procedia Engineering, vol. 152, pp. 247–250,2016.
[19] W.Wang, Q.Wang, C.Wang, and J. Yi, “Experimental studies ofcrevice corrosion for buried pipeline with disbonded coatingsunder cathodic protection,” Journal of Loss Prevention in theProcess Industries, vol. 29, no. 1, pp. 163–169, 2014.
[20] F. N. Varela, M. Y. Tan, and M. Forsyth, “A novel approach formonitoring pipeline corrosion under disbonded coatings,” inProceedings of the 2014 10th International Pipeline Conference,p. V002T06A068, Calgary, Alberta, Canada.

Submit your manuscripts athttps://www.hindawi.com
ScientificaHindawi Publishing Corporationhttp://www.hindawi.com Volume 2014
CorrosionInternational Journal of
Hindawi Publishing Corporationhttp://www.hindawi.com Volume 2014
Polymer ScienceInternational Journal of
Hindawi Publishing Corporationhttp://www.hindawi.com Volume 2014
Hindawi Publishing Corporationhttp://www.hindawi.com Volume 2014
CeramicsJournal of
Hindawi Publishing Corporationhttp://www.hindawi.com Volume 2014
CompositesJournal of
NanoparticlesJournal of
Hindawi Publishing Corporationhttp://www.hindawi.com Volume 2014
Hindawi Publishing Corporationhttp://www.hindawi.com Volume 2014
International Journal of
Biomaterials
Hindawi Publishing Corporationhttp://www.hindawi.com Volume 2014
NanoscienceJournal of
TextilesHindawi Publishing Corporation http://www.hindawi.com Volume 2014
Journal of
NanotechnologyHindawi Publishing Corporationhttp://www.hindawi.com Volume 2014
Journal of
CrystallographyJournal of
Hindawi Publishing Corporationhttp://www.hindawi.com Volume 2014
The Scientific World JournalHindawi Publishing Corporation http://www.hindawi.com Volume 2014
Hindawi Publishing Corporationhttp://www.hindawi.com Volume 2014
CoatingsJournal of
Advances in
Materials Science and EngineeringHindawi Publishing Corporationhttp://www.hindawi.com Volume 2014
Smart Materials Research
Hindawi Publishing Corporationhttp://www.hindawi.com Volume 2014
Hindawi Publishing Corporationhttp://www.hindawi.com Volume 2014
MetallurgyJournal of
Hindawi Publishing Corporationhttp://www.hindawi.com Volume 2014
BioMed Research International
MaterialsJournal of
Hindawi Publishing Corporationhttp://www.hindawi.com Volume 2014