experimental study on fault ride-through capability of vsc
TRANSCRIPT

ARCHIVES OF ELECTRICAL ENGINEERING VOL. 70(1), pp. 37 –51 (2021)
DOI 10.24425/aee.2021.136051
Experimental study on fault ride-through capabilityof VSC-based HVDC transmission system
NGO MINH KHOAo , NGUYEN AN TOANo , DOAN DUC TUNGo
Faculty of Engineering and Technology, Quynhon UniversityVietnam
e-mails: ngominhkhoa/nguyenantoan/[email protected]
(Received: 13.04.2020, revised: 18.08.2020)
Abstract: For voltage-source-converter based high-voltage-direct-current (VSC-HVDC)transmission systems, fault ride-through (FRT) capability is a very important grid require-ment in order to enhance its operational availability under an alternating current (AC) gridfault condition. Voltage sags during a short-circuit fault in power transmission lines can leadto fluctuations in the direct current (DC) link voltage of converter systems, and may inducereversed power flow and even trip a VSC-HVDC transmission system. A practical methodis developed in this paper for investigating FRT capability of VSC-HVDC transmissionsystem characteristics during a voltage sag event using experimental results from SmartGrid Laboratory. Symmetrical and asymmetrical voltage sag events with different remain-ing voltages are applied to an AC grid that lasts with a variable duration. The experimentalwaveforms of the two converter systems are recorded and analyzed in order to evaluate theFRT capability of VSC-HVDC transmission systems.Key words: converter system, experimental waveform, fault ride-through, high-voltagedirect current, voltage sag
1. Introduction
The development of national and international interconnected networks has necessitateda bridging of relatively long distances in some cases. In the case of 3-phase alternating cur-rent (AC) power, this has given rise to stability problems attributable to the different voltageangles between a line’s beginning and ending [1–3]. Furthermore, a line produces or consumesreactive power depending on whether the load on the line is low or high. Due to their highmutual capacitance, cable routes without elaborate compensation facilities can be established
0
© 2021. The Author(s). This is an open-access article distributed under the terms of the Creative Commons Attribution-NonCommercial-NoDerivatives License (CCBY-NC-ND4.0, https://creativecommons.org/licenses/by-nc-nd/4.0/), which per-mits use, distribution, and reproduction in any medium, provided that the Article is properly cited, the use is non-commercial,and no modifications or adaptations are made.

38 Ngo Minh Khoa, Nguyen An Toan, Doan Duc Tung Arch. Elect. Eng.
only up to the length of a transmission line. Efforts were, therefore, made at an early stageto also use high direct current (DC) voltages for power transmission [4, 5]. One challenge forvoltage-source-converter based high-voltage-direct-current (VSC-HVDC) transmission systemsis the fault ride-through (FRT) capability which is specified by grid codes [4–6]. The FRT ca-pability allows VSC-HVDC transmission systems to remain a normally operating status duringabnormal AC grid conditions like voltage deviations [7, 8]. The FRT requirement consists ofzero voltage ride-through (ZVRT), low voltage ride-through (LVRT), and high-voltage ride-through (HVRT).
The FRT has attracted widespread scientific attention, most of them are mainly studyingmethods for enhancing the FRT capability of wind turbines connected to an AC grid througha VSC-HVDC transmission system [9–16]. The authors in [9] proposed a new control approachfor securing fault ride-through of wind. The approach in [10] could improve the FRT capability ofwind farms by using a nonlinear adaptive control of VSC-HVDC. The control method could blockthe converters for a short-time and could take corresponding actions to diminish the post-faultdisturbances. The over-current was limited, the wind turbines managed to remain connected, andthe AC voltage recovered quickly [11]. The work in [12] presented an FRT protection method fora wind farm connected to an AC grid through an HVDC link. In [13], an FRT strategy for offshorewind farms connected to the grid through a VSC-HVDC transmission system was proposed tointroduce a controlled voltage drop at the offshore grid when a fault occurred at the onshoreside. The DC fault recovery strategy proposed in [14] applied a high rating series diode valvelocated at each VSC inverter pole for reducing fault currents. The schemes of the FRT controland management for the VSC-HVDC system were proposed in [15, 16].
The control strategy of converters in VSC-HVDC plays an important role for enhancingits FRT capability [17–22]. In [17], a strategy for reducing the inverter-side overvoltage of theHVDC system under a fault in the inverter-side AC system was proposed. The authors in [18]presented a new static synchronous compensator model of operation for the recently publishedalternate arm converter. The new FRT method proposed in [19] was without any direct informa-tion exchange between two Double-Star Chopper-Cell (DSCC) converters. The authors in [20]developed a perturbation observer-based sliding-mode scheme in order to control VSC-HVDCsystems. The scheme did not require an accurate system model and only one state measurementwas needed to estimate online the nonlinearities, parameter uncertainties, unmodelled dynamicsand time-varying external disturbances of VSC-HVDC systems. For multi-terminal VSC-HVDCsystems, the passive control scheme was proposed in [21] to provide a reliable and effectiveintegration of electrical power from renewable energy. The negative sequence controller, whichis required for such asymmetrical conditions in AC grids, was proposed by the authors in [22].
This paper aims to study the FRT capability of VSC-HVDC systems under symmetrical andasymmetrical voltage sag events. A practical method is developed in this work by using practicalmodules of the VSC-HVDC transmission system in our laboratory in order to carry case studies.All experimental results are carefully analyzed for the purpose of evaluating the FRT capabilityof the VSC-HVDC system. The main contributions presented in this paper are as follows:
(i) To develop a practical method for testing the FRT capability of VSC-HVDC systems basedon the platform in a laboratory environment.
(ii) To give an extensive experimental verification of the proportional integral (PI) controlperformance of VSCs under different voltage sag types.

Vol. 70 (2021) Experimental study on fault ride-through capability 39
2. Background and methodology
2.1. VSC-HVDC Configuration and modellingThe studied system in a laboratory environment is illustrated in Fig. 1, wherein an HVDC
system is used to connect two AC grids. The two converter systems can be considered as thecomposition of two constant-frequency VSC systems: the left-hand-side VSC system is a DC-linkvoltage controller and the right-hand-side VSC system is an active/reactive power controller.As shown in Fig. 1, the DC-link voltage controller and the active/reactive power controllerare interfaced with Grid 1 and Grid 2, respectively. The DC-link voltage controller and theactive/reactive power controller are connected in parallel from their DC-side terminals. The left-hand side VSC system, that is, the DC-link voltage controller, provides the DC voltage supportto the active/reactive power controller. The active/reactive power controller can independentlycontrol the active and reactive power exchanged with Grid 2, that is, Ps2 and Qs2 [23, 24].
The global mathematical model of the overall VSC-HVDC system is expressed as follows:
did1dt
= −R1L1
id1 + ωiq1 +Vsd1 − Vcd1
L1
diq1
dt= −
R1L1
iq1 − ωid1 −Vcq1
L1
did2dt
= −R2L2
id2 + ωiq2 +Vsd2 − Vcd2
L2
diq2
dt= −
R2L2
iq2 − ωid2 −Vcq2
L2
dVDC1dt
=3Vsq1iq1
2CDC1VDC1−
IDC
CDC1
dVDC2dt
=3Vsq2iq2
2CDC2VDC2−
IDC
CDC2
d IDC
dt=
1LDC
(VDC1 − VDC2) −RDC
LDCIDC
. (1)
The active and reactive powers entering both VSC1 and VSC2 can be expressed as:
P1 =32(Vsq1iq1 + Vsd1id1
)=
32(Vsq1iq1
)Q1 =
32(Vsq1id1 + Vsd1iq1
)=
32(Vsq1id1
)P2 =
32(Vsq2iq2 + Vsd2id2
)=
32(Vsq2iq2
)Q2 =
32(Vsq2id2 + Vsd2id2
)=
32(Vsq2id2
), (2)
where number 1, 2 subscripts denote the variable corresponding to VSC1 and VSC2.

40 Ngo Minh Khoa, Nguyen An Toan, Doan Duc Tung Arch. Elect. Eng.
Fig.
1.Con
figurationof
VSC
-HVDCtra
nsmission
syste
m

Vol. 70 (2021) Experimental study on fault ride-through capability 41
2.2. Development of practical method
An experimental setup applied to emulate the VSC-HVDC transmission system of Smart GridLaboratory at our university is shown in Fig. 2(a). Main elements include converter system 1(VSC1), converter system 2 (VSC2), a DC cable, a dynamic grid fault simulator, an adjustable3-phase power supply (Grid 1) and a 3-phase power supply (Grid 2). The nominal frequencyand voltage of two AC grids in this system are 50 Hz and 380 V, respectively. The VSC-HVDCsystem parameters are given in Table 1. Besides, both VSC1 and VSC2 can control active powerin the DC cable in both directions, can be coupled to the power grid at various frequencies, andcan automatically control active/reactive power, and voltage. The conventional PI controllers areapplied to VSC-HVDC systems. The PI control parameters can be optimally chosen and tunedby a meta-heuristic algorithm to obtain the optimal control performance [25]. In this paper, theconventional PI controllers, control parameters of which are presented in Table 2, are also appliedto VSC-HVDC systems.
Converter system 1 (VSC1)
Converter system 2 (VSC2)
DC cable
Grid 1
Grid 2
Computer
Monitor
Dynamic grid fault simulator
Converter system 1 (VSC1) DC cable Converter system 2
(VSC2)
Adjustable 3-phase power supply (Grid 1)
Grid 2 Dynamic grid fault simulator
(a) Experimental setup (b) Wiring diagram
Fig. 2. The laboratory prototype for testing the FRT capability of VSC-HVDC transmission system
The VSC-HVDC system is installed for education purposes at the authors’ univeristy, it canonly transmit up to 1 kWof active power, provide up to 1 kvar of reactive power, and has adjustableDC-link voltage up to 700 VDC. Besides, converter system 1 (VSC1) and converter system 2(VSC2) are also communicated with a personal computer (PC) which installed an Interactive LabAssistant course for setting, monitoring, and recording all experimental results. The DC cablein this VSC-HVDC system is to model a 300 km HVDC transmission line. Its resistance andinductance per phase are 7.2 Ohm and 230 mH, respectively. The DC cable can carry a maximumcurrent of 2 A, 700 VDC. In order to establish a fault in an AC grid, the dynamic grid faultsimulator in the VSC-HVDC system can perform the function. This module can be used to set upsymmetrical and asymmetrical voltage sags in an AC grid with an adjustable remaining voltagefor three phases and adjustable duration of the fault from 50 ms to 1000 ms. In addition, the jumpangle of voltage sag events which is generated by this module can be varied for analyzing theFRT capability of the VSC-HVDC system. The experiments described in this paper were carriedout according to the experimental setup, the wiring diagram of which is shown in Fig. 2(b).

42 Ngo Minh Khoa, Nguyen An Toan, Doan Duc Tung Arch. Elect. Eng.
Table 1. The VSC-HVDC system parameters
Adjustable 3-phase power supply (Grid 1)
Maximum voltage Vs1 [V] 400
Nominal frequency fs1 [Hz] 50
Grid 2
Nominal voltageVs2 [V] 380
Nominal frequency fs2 [Hz] 50
DC cable
Base DC voltage VDCbase [V] 700
DC resistanceRDC [Ω] 7.2
DC inductance LDC [mH] 230
Table 2. The PI controller parameters of VSCs
Converter system 1 (VSC1)
Inductance L1 [µF] 83
Resistance R1 [mΩ] 1.3
DC bus capacitance C1 [µF] 73.33
Closed-loop time constant τi1 [ms] 1
Proportional gain kp1 0.083
Integral gain ki1 1.3
Converter system 2 (VSC2)
Inductance L2 [µF] 83
Resistance R2 [mΩ] 1.3
DC bus capacitance C2 [µF] 73.33
Closed-loop time constant τi2 [ms] 1
Proportional gain kp2 0.083
Integral gain ki2 1.3
A practical method shown in Fig. 3 is developed in this paper to study the FRT capabilityof VSC-HVDC systems. Using the dynamic fault simulator to create types of voltage sags atthe AC grids, the FRT experiments are carried out on the experimental setup. The status ofconverter systems can be used to evaluate the FRT capability of VSC-HVDC systems. Moreover,all recorded data of these experiments is used to analyze offline and the FRT requirement of theVSC-HVDC system is applied to compare with the experimental results.

Vol. 70 (2021) Experimental study on fault ride-through capability 43
Fig. 3. The flowchart of the practical method for testing the FRT capability of VSC-HVDC system
3. Experimental results and discussion
In order to study the effectiveness of the FRT capability of the VSC-HVDC transmissionsystem shown in Fig. 1 in the case of symmetrical and asymmetrical voltage sag events, threecase studies have been carried out and described in this paper. The first case study considersa three-phase voltage sag at the point of common coupling PCC2 (or Grid 2). The second case

44 Ngo Minh Khoa, Nguyen An Toan, Doan Duc Tung Arch. Elect. Eng.
study examines the recovery strategy when the VSC-HVDC system is subjected to a two-phasevoltage sag at the point of common coupling PCC2. Finally, the third case study considersa single-phase voltage sag at the point of common coupling PCC2. The voltage sag of the threecase studies that occurred in Grid 2 has a depth of 60% and a duration time of 200 ms. Thefollowing will investigate three case studies in order to analyse and evaluate the FRT capabilityof the VSC-HVDC transmission system.
Case 1: Three-phase voltage sagIn this case, using a dynamic grid fault simulator, we establish a three-phase voltage sag
at the point of common coupling PCC2 (Grid 2), with a depth of 60% and a time duration of200 ms. In a steady state before the voltage sag is started, the converter system, VSC2, is set to anactive/reactive power setting of Psref2 = 80% or Psref2 = 800 W, Qsref2 = 0% or Qsref2 = 0 kVARand the active power is transmitted in the DC cable by the direction from Grid 1 to Grid 2.In this stage, the VSC-HVDC system is normally operated; therefore, three-phase AC voltagesand currents are balanced and constant, as shown in the period from 0 ms to 100 ms. Fig. 4(a)and Fig. 4(b) show experimental waveforms of Case 1 which are recorded at VSC1 and VSC2,respectively. In each figure, the first and second plots represent the three-phase voltage and currentwaveforms at the AC grid to which the VSC is connected, the third and fourth plots show the DCvoltage and the DC power at the DC-link circuit of the VSC. Because the three-phase voltage sagin this case occurs at the point of common coupling PCC2 (Grid 2), the magnitude of three-phasevoltages at VSC2 is evenly decreased to 0.4 pu (or 92 V) in a short time of the voltage sag (from100 ms to 300 ms), as shown in the first plot of Fig. 4(b). Before, while and after three-phasevoltage sag occurs at Grid 2, the magnitude of three-phase voltages at VSC1 is not still varied
0 100 200 300 400 500-500
0
500
0 100 200 300 400 500-2
0
2
0 100 200 300 400 500200
300
400
500
0 100 200 300 400 5000
500
1000
200ms
0 100 200 300 400 500-500
0
500
0 100 200 300 400 500-2
0
2
0 100 200 300 400 500200
300
400
500
0 100 200 300 400 5000
500
1000
200ms
(a) VSC1 (b) VSC2
Fig. 4. Case 1: Experimental waveforms with FRT control at Psref2 = 80%, Qsref2 = 0% before, while, andafter a three-phase voltage sag with a depth of 60% and a duration time of 200 ms occurred in Grid 2

Vol. 70 (2021) Experimental study on fault ride-through capability 45
as shown in the first plot of Fig. 4(a). However, the controller of the VSC-HVDC system willcontrol in order to maintain power supply of the system. In this case, the DC-link voltages ofboth VSC1 and VSC2 are almost flat, as clearly shown in the third plot of Fig. 4(a) and Fig. 4(b),due to the converter system VSC1. The magnitude of three-phase currents of VSC1 is decreasedin the period between 100 ms and 300 ms, as shown in the second plot of Fig. 4(a), while themagnitude of three-phase currents of VSC2 is still stable, as shown in the second plot of Fig. 4(b).During the entire voltage sag period from 100 ms to 300 ms, the DC power of both VSC1 andVSC2, as shown in the fourth plot of Fig. 4(a) and Fig. 4(b), is reduced. After the voltage sagends, a transient state appears in the waveforms for a short time and then the system’s parameterscomeback to the steady state, same as the state before the voltage sag. This means the VSC-HVDC transmission system is still normally operated to transmit an active and reactive power(Psref2 = 800 W, Qsref2 = 0 kVAR) from Grid 1 to Grid 2 after the three-phase voltage sag witha depth of 60% and a time duration of 200 ms occurred in Grid 2.
In the state-space representation, after applying the Park transformation into the dq-axis,Fig. 5 shows the dq-components of the voltage and current of the two converter systems whichwere also recorded when we carried out Case 1. Fig. 5(a) shows clearly that the d-component ofthe AC voltage at VSC1 (Vsd1) is still constant but the d-component of the AC voltage at VSC2(Vsd2) is dramatically reduced during the period of the three-phase voltage sag, that occurred inGrid 2. Before, while and after the fault, three-phase voltages of VSC1 and VSC2 are perfectlybalanced; therefore, their q-components (Vsq1, Vsq2) equal zero as shown in Fig. 5(a). Besides,the dq-components of the AC current at both VSC1 and VSC2 are shown in Fig. 5(b). As Fig. 5(b)shown, the d-component of the AC current at VSC1 (id1) is dramatically reduced during theperiod of the voltage sag but the d-component of the AC current at VSC2 (id2) is almost constant.The q-components (iq1, iq2) are shown in Fig. 5(b). The experimental results in Fig. 5 also showthat after the duration time of the three-phase voltage sag, the voltage and current of both VSC1and VSC2 of the VSC-HVDC transmission system is normal therefore the VSC-HVDC systemis not disconnected.
0 100 200 300 400 500-50
0
50
100
150
200
250
0 100 200 300 400 500-0.5
0
0.5
1
1.5
(a) Voltage (b) Current
Fig. 5. Case 1: The dq-components of the voltage and current of VSC1 and VSC2
46 Ngo Minh Khoa, Nguyen An Toan, Doan Duc Tung Arch. Elect. Eng.
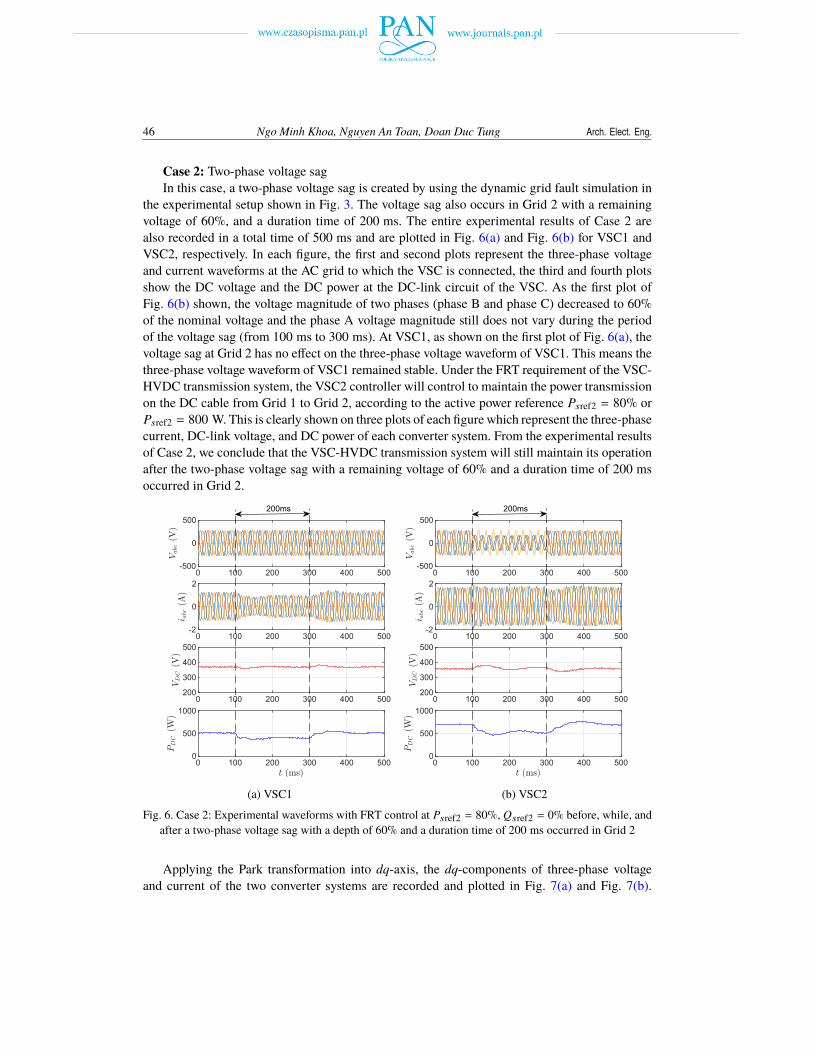
Case 2: Two-phase voltage sagIn this case, a two-phase voltage sag is created by using the dynamic grid fault simulation in
the experimental setup shown in Fig. 3. The voltage sag also occurs in Grid 2 with a remainingvoltage of 60%, and a duration time of 200 ms. The entire experimental results of Case 2 arealso recorded in a total time of 500 ms and are plotted in Fig. 6(a) and Fig. 6(b) for VSC1 andVSC2, respectively. In each figure, the first and second plots represent the three-phase voltageand current waveforms at the AC grid to which the VSC is connected, the third and fourth plotsshow the DC voltage and the DC power at the DC-link circuit of the VSC. As the first plot ofFig. 6(b) shown, the voltage magnitude of two phases (phase B and phase C) decreased to 60%of the nominal voltage and the phase A voltage magnitude still does not vary during the periodof the voltage sag (from 100 ms to 300 ms). At VSC1, as shown on the first plot of Fig. 6(a), thevoltage sag at Grid 2 has no effect on the three-phase voltage waveform of VSC1. This means thethree-phase voltage waveform of VSC1 remained stable. Under the FRT requirement of the VSC-HVDC transmission system, the VSC2 controller will control to maintain the power transmissionon the DC cable from Grid 1 to Grid 2, according to the active power reference Psref2 = 80% orPsref2 = 800 W. This is clearly shown on three plots of each figure which represent the three-phasecurrent, DC-link voltage, and DC power of each converter system. From the experimental resultsof Case 2, we conclude that the VSC-HVDC transmission system will still maintain its operationafter the two-phase voltage sag with a remaining voltage of 60% and a duration time of 200 msoccurred in Grid 2.
0 100 200 300 400 500-500
0
500
0 100 200 300 400 500-2
0
2
0 100 200 300 400 500200
300
400
500
0 100 200 300 400 5000
500
1000
200ms
0 100 200 300 400 500-500
0
500
0 100 200 300 400 500-2
0
2
0 100 200 300 400 500200
300
400
500
0 100 200 300 400 5000
500
1000
200ms
(a) VSC1 (b) VSC2
Fig. 6. Case 2: Experimental waveforms with FRT control at Psref2 = 80%, Qsref2 = 0% before, while, andafter a two-phase voltage sag with a depth of 60% and a duration time of 200 ms occurred in Grid 2
Applying the Park transformation into dq-axis, the dq-components of three-phase voltageand current of the two converter systems are recorded and plotted in Fig. 7(a) and Fig. 7(b).

Vol. 70 (2021) Experimental study on fault ride-through capability 47
The dq-components of the voltage of the two converter systems are shown in Fig. 7(a). In Fig. 7(a),the d-component of the voltage of VSC1 Vsd1 (blue line) is almost flat but the d-component of thevoltage of VSC2 Vsd2 (red line) is reduced in the period from 100 ms to 300 ms. Before, whileand after the fault, three-phase voltages of VSC1 and VSC2 are perfectly balanced; therefore, theirq-components (green line and magenta line) equal zero (Vsq1 = Vsq2 = 0), as shown in Fig. 7(a).Besides, the dq-components of the current of the two converter systems are shown in Fig. 7(b).As we can see in Fig. 7(b), the q-components of the currents (iq1 and iq2) almost equal zero dueto its balance, but the d-components (id1 and id2) are varied as the blue line and the red lineshow in Fig. 7(b). Moreover, these experimental results also show that after the voltage sag ends,the voltage and current of the two converters come back as the initial steady state. Therefore,the VSC-HVDC transmission system can ride-through a two-phase voltage sag with a remainingvoltage of 60% and a duration time of 200 ms.
0 100 200 300 400 500-50
0
50
100
150
200
250
0 100 200 300 400 500-0.5
0
0.5
1
1.5
(a) Voltage (b) Current
Fig. 7. Case 2: The dq-components of the voltage and current of VSC1 and VSC2
Case 3: Single-phase voltage sagIn the third case study, a single-phase voltage sag with a depth of 60% and a duration time
of 200 ms is generated by using the dynamic grid fault simulator in order to investigate theFRT capability of the VSC-HVDC transmission system of Smart Grid Laboratory. In the initialsteady state, the converter system, VSC2, is also set up to transmit an active power of 80% powerrating (Pref2 = 80% or Pref2 = 800 W) and a reactive power of 0% power rating (Qref2 = 0% orQref2 = 0 kVAR) from Grid 1 to Grid 2. The single-phase voltage sag at Grid 2 starts at 100 msand lasts for 200 ms, as shown in the first plot of Fig. 8(b). The voltage waveform in the firstplot of Fig. 8(a) represents three-phase voltages of VSC1 which is still stable during the entirerecording time. Under the FRT requirement of the VSC-HVDC transmission system, its controllerwill control to maintain the power transmission in the DC cable from Grid 1 to Grid 2, accordingto the active and reactive power reference (Psref2 = 80% or Psref2 = 800 W and Qsref2 = 0% orQsref2 = 0 kvar). According to these experimental waveforms, we conclude that the VSC-HVDCtransmission system will still stay connected after the single-phase voltage sag with a depth of

48 Ngo Minh Khoa, Nguyen An Toan, Doan Duc Tung Arch. Elect. Eng.
0 100 200 300 400 500-500
0
500
0 100 200 300 400 500-2
0
2
0 100 200 300 400 500200
300
400
500
0 100 200 300 400 5000
500
1000
200ms
0 100 200 300 400 500-500
0
500
0 100 200 300 400 500-2
0
2
0 100 200 300 400 500200
300
400
500
0 100 200 300 400 5000
500
1000
200ms
(a) VSC1 (b) VSC2
Fig. 8. Case 3: Experimental waveforms with FRT control at Psref2 = 80%, Qsref2 = 0% before, while, andafter a single-phase voltage sag with a depth of 60% and a duration time of 200 ms occurred in Grid 2
60% and a duration time of 200 ms occurred in Grid 2. Moreover, the experimental parametersincluding Vsd1, Vsq1, Vsd2, Vsq2, id1, iq1, id2, and iq2 represent the dq-components of the voltageand current at VSC1 as well as VSC2, and are recorded and plotted in Fig. 9(a) and Fig. 9(b)when we carry on with this case. These experimental parameters show that the VSC-HVDC cancompletely ride through the single-phase voltage sag.
0 100 200 300 400 500-50
0
50
100
150
200
250
0 100 200 300 400 500-0.5
0
0.5
1
1.5
(a) Voltage (b) Current
Fig. 9. Case 3: The dq-components of the voltage and current of VSC1 and VSC2

Vol. 70 (2021) Experimental study on fault ride-through capability 49
According to the analysis of the experimental results mentioned above, the requirement isapplied to evaluate the FRT capability of the VSC-HVDC transmission system. Hence, the d-components of the voltages at VSC2 in three case studies are plotted on the FRT profile, asshown in Fig. 10. As in the previous section, three voltage sag events of three case studies havea same depth of 60% and a same duration time of 200 ms. However, the three-phase voltage sagfor Case 1, the two-phase voltage sag for Case 2, and the single-phase voltage sag for Case 3are carried out. Therefore, the d-components of these voltage sag events after using the Parktransformation will vary, as shown clearly in Fig. 10. From these experimental results, it canbe seen that the VSC-HVDC transmission system can overcome three faults in order to stayconnected.
0 500 1000 1500 2000 2500 30000
0.2
0.4
0.6
0.8
1
1.2
LVRT profileThree-phase voltage sag
Two-phase voltage sagSingle-phase voltage sag
0 100 200 300 4000.2
0.4
0.6
0.8
1
1.2
Fig. 10. The comparision between the experimental results and FRT requirement
4. Conclusions
A practical method has been developed in this research work for investigating the FRTcapability of the VSC-HVDC transmission system in a laboratory environment. The effectivenessof this method is to show clearly the operation status of the VSC-HVDC in real time and allrecorded data can also be used to compare with the FRT requirement. The symmetrical andasymmetrical voltage sag events are generated by using the dynamic grid fault simulator toverify the control performance of the converter systems. Three case studies including three-phasevoltage sag, two-phase voltage sag, and single-phase voltage sag have been extensively carried outto record the voltage and current waveforms at the converter systems. The experimental results ofeach case study are compared with the FRT requirement of the VSC-HVDC system to evaluateits FRT capability. The experimental results show the FRT capability and its performance duringa network fault and they are thoroughly addressed in this paper.

50 Ngo Minh Khoa, Nguyen An Toan, Doan Duc Tung Arch. Elect. Eng.
Future works will be undertaken on the following aspects: (i) New control methods of VSCswill be studied to update the hardware units of the experimental setup; (ii) The integration ofthe experimental module of a doubly-fed induction generator (DFIG) wind turbine using theVSC-HVDC system will be also investigated.
References
[1] Hingorani N., Gyugyi L., Understanding FACTS: Concepts and Technology of Flexible AC Transmis-sion Systems, IEEE Press, Willey (2000).
[2] Zhang X.P., Rehtanz C., Pal B., Flexible AC Transmission Systems: Modelling and Control, Springer-Verlag (2006).
[3] Yazdani A., Iravani R., Voltage-sourced converters in power systems: Modeling, Control, and Appli-cations, IEEE Press, Wiley (2010).
[4] Flourentzou N., Agelidis V.G., Demetriades G.D., VSC-Based HVDC Power Transmission Systems:An Overview, IEEE Transactions on Power Electronics, vol. 24, pp. 592–602 (2009).
[5] Sessa S.D., Chiarelli A., Benato R., Availability Analysis of HVDC-VSC Systems: A Review, Energies,vol. 12, no. 14, pp. 1–22 (2019), DOI: 10.3390/en12142703.
[6] Alassi A., Bañales S., Ellabban O., Adam G., MacIver C., HVDC Transmission: Technology Review,Market Trends and Future Outlook, Renewable and Sustainable Energy Reviews, vol. 112, pp. 530–554(2019), DOI: 10.1016/j.rser.2019.04.062.
[7] Patil P.R., Bhole A.A., A review on enhancing fault ride-through capability of distributed generationin a microgrid, In Proceedings of 2017 Innovations in Power and Advanced Computing Technologies(i-PACT), April 21–22, Vellore, India (2017), DOI: 10.1109/IPACT.2017.8245189.
[8] Yaramasu V., Wu B., Sen P.C., Kouro S., Narimani M., High-power wind energy conversion systems:State-of-the-art and emerging technologies, Proceedings of the IEEE, vol. 103, pp. 740–788 (2015).
[9] Feltes C.,WredeH., Koch F.W., Erlich I.,Enhanced fault ride-throughmethod forwind farms connectedto the grid through VSC-based HVDC transmission, IEEE Transactions on Power Systems, vol. 24,pp. 1537–1546 (2009).
[10] Sang Y., Yang B., Shu H., An N., Zeng F., Yu T., Fault Ride-Through Capability Enhancement ofType-4WECS in OffshoreWind Farm via Nonlinear Adaptive Control of VSC-HVDC, Processes, vol. 7,no. 540 (2019), DOI: 10.3390/pr7080540.
[11] Vrionis T.D., Koutiva X.I., Vovos N.A., Giannakopoulos G.B., Control of an HVDC Link Connectinga Wind Farm to the Grid for Fault Ride-Through Enhancement, IEEE Transactions on Power Systems,vol. 22, no. 4, pp. 2039–2047 (2007).
[12] Ramtharan G., Arulampalam A., Ekanayake J.B., Hughes F., Jenkins N., Fault ride through of fullyrated converter wind turbineswith ACandDC transmission systems, IETRenewable PowerGeneration,vol. 3, iss. 4, pp. 426–438 (2009).
[13] Sun W., Torres-Olguina R.E., Anaya-Laraa O., Investigation on Fault-ride through Methods for VSC-HVDC Connected Offshore Wind Farms, Energy Procedia, vol. 94, pp. 29–36 (2016).
[14] Haleem N.M., Rajapakse A.D., Gole A.M., Fernando I.T., Investigation of Fault Ride-Through Capa-bility of Hybrid VSC-LCC Multi-Terminal HVDC Transmission Systems, IEEE Transactions on PowerDelivery, vol. 34, iss. 1, pp. 241–250 (2019).
[15] Li Y., Liu C., Tian X., Wang Z., Study on fault ride-through control of islanded wind farm connectedto VSC-HVDC grid based on the VSC converter AC-side bus forced short circuit, The Journal ofEngineering, vol. 2019, no. 16, pp. 3325–3328 (2019).

Vol. 70 (2021) Experimental study on fault ride-through capability 51
[16] Moawwad A., El Moursi M.S., Xiao W., Advanced fault ride-through management scheme forVSC-HVDC connecting offshore wind farms, IEEE Transactions on Power Systems, vol. 31, no. 6,pp. 4923–4934 (2016).
[17] Zhou Z., Chen Z., Wang X., Du D., Yang G., Wang Y., Hao L., AC fault ride through control strategyon inverter side of hybrid HVDC transmission systems, Journal of Modern Power Systems and CleanEnergy, vol. 7, iss. 5, pp. 1129–1141 (2019).
[18] Feldman R., Farr E., Watson A.J., Clare J.C., Wheeler P.W., Trainer D.R., Crookes R.W., DC faultride-through capability and STATCOM operation of a HVDC hybrid voltage source converter, IETGeneration, Transmission and Distribution, vol. 8, iss. 1, pp. 114–120 (2014).
[19] Oguma K., Akagi H., Low-Voltage-Ride-Through Performance of an HVDC Transmission SystemUsing Two Modular Multilevel Double-Star Chopper-Cells Converters, Electrical Engineering inJapan, vol. 200, pp. 33–44 (2017), DOI: 0.1109/TPEL.2016.2615048.
[20] Yang B., Sang Y.Y., Shi K., Yao W., Jiang L., Yu T., Design and real-time implementation of pertur-bation observer based sliding-mode control for VSC-HVDC systems, Control Engineering Practice,vol. 56, pp. 13–26 (2016).
[21] Yang B., Jiang L., Yu T., Shua H.C., Zhang C.K., Yao W., Wu Q.H., Passive control design for multi-terminal VSC-HVDC systems via energy shaping, International Journal of Electrical Power and EnergySystems, vol. 98, pp. 496–508 (2018).
[22] Dumnic B., Popadic B., Milicevic D., Vukajlovic N., Delimar M., Control Strategy for a GridConnected Converter in Active Unbalanced Distribution Systems, Energies, vol. 12, no. 7 (2019),DOI: 10.3390/en12071362.
[23] Latorre H.F., Ghandhari M., Soder L., Active and Reactive Power Control of VSC-HVDC, ElectricalPower System Research, vol. 78, pp. 1756–1763 (2008).
[24] Li C., Li Y., Guo J., He P., Research on emergency DC power support coordinated control for hybridmulti-infeed HVDC system, Archives of Electrical Engineering, vol. 69, no. 1, pp. 5–21 (2020).
[25] Yang B., Yu T., Zhang X., Huang L., Shu H., Jiang L., Interactive teaching-learning optimizer forparameter tuning of VSC-HVDC systems with offshore wind farm integration, IET Generation, Trans-mission and Distribution, vol. 12, no. 3, pp. 678–687 (2018).